Market Minds Advisory
Driveline Additives Market

Driveline Additives Market: Specification Gatekeeping, Factory Fill Economics, and the Electrified Fluid Rewrite

Additives are under a tenth of a finished transmission fluid and decide entirely whether it passes an approval that costs millions in hardware testing and takes years to obtain. Five companies clear it.

Lead Analyst

Bilal Shaikh

Published

September 2026

Make Smarter Decisions with Customized Research Insights

Request a free sample report and evaluate market opportunities, growth trends, and competitive dynamics relevant to your business needs.

2025 MARKET VALUE$3.6BMarket Size 2025
2036 FORECAST VALUE$6.0BBase Case , 2026 to 2036
CAGR 2026 TO 20364.8 %Bull 6.0% / Bear 3.6%
INCREMENTAL OPPORTUNITY$2.3BNet 10- year value creation
EXPANSION MULTIPLE1.60x2036 value over 2026 base
Strategic Levers
M&A Pipeline
Regional Outlook
Country Rankings
Competitive Intelligence
Segmental Deep-dive
Call-Us : 91 93563 13602

Executive Snapshot and Market Trajectory

The additive package is 8.4% of a finished driveline fluid and determines whether that fluid can legally carry a manufacturer approval. Everything commercial in this market follows from that gap between how little goes in and how much depends on it. The approval is the product.
Commercial power sits with the handful of suppliers who can fund hardware test programmes rather than with anyone able to blend chemistry. Electrical property modifiers for electrified driveline grow fastest at 14.6%, roughly 3.04 times the market, because electric axle fluids need properties conventional additives actively work against. East Asia holds 30% of total global value on vehicle production and transmission technology leadership together.
Concentration is extreme at roughly 78% for the top five, among the highest figures in any chemicals market, and approval test cost is the reason. Factory fill takes 34% of volume at thin margin and locks the service fill business behind it. Electrified driveline already supplies 9% of total market value today. Electric axle requirements invert the chemistry that built every incumbent position, which has reopened competitive ground that looked permanently settled a decade ago.
Market Definition
The market comprises additive components and formulated packages for driveline lubricants, covering extreme pressure and anti-wear additives, friction modifiers, dispersants and detergents, viscosity index improvers, corrosion and oxidation inhibitors, and electrical property modifiers for electrified driveline. Value is measured at additive supplier level across transmission, gear, axle, and electric driveline fluid applications. Engine oil additives, hydraulic and industrial gear oil additives, base oils, finished lubricants sold to consumers, and greases fall outside scope.
Base Year Value
$3.6B in 2025 (MMA Primary Research Dataset, August 2026)
Forecast Period
2026 to 2036, eleven discrete annual values
CAGR
4.8% base case. Bull 6.0%. Bear 3.6%.
Fastest Growth Segment
Electrical Property Modifiers for Electrified Driveline: 14.6% CAGR
Fastest Growth Country
India: 7.8% CAGR
Fastest Growth Region
South Asia and Pacific: 6.9% CAGR
Largest Region
East Asia: 30% of 2025 global value
Market Leaders
Lubrizol, Infineum, Chevron Oronite, Afton Chemical, and BASF lead on driveline additive supply. Source: company annual reports and MMA Analysis, July 2026.
Primary Survey
n=3,800 procurement and R&D decision-makers, Q4 2025, six countries
Methodology
Demand-side build-up, cross-validated against public data, 47 expert interviews

Driveline Additives Market Forecast Scenarios

driveline-additives-market-trends-size-forecast-scenario-1787549287564
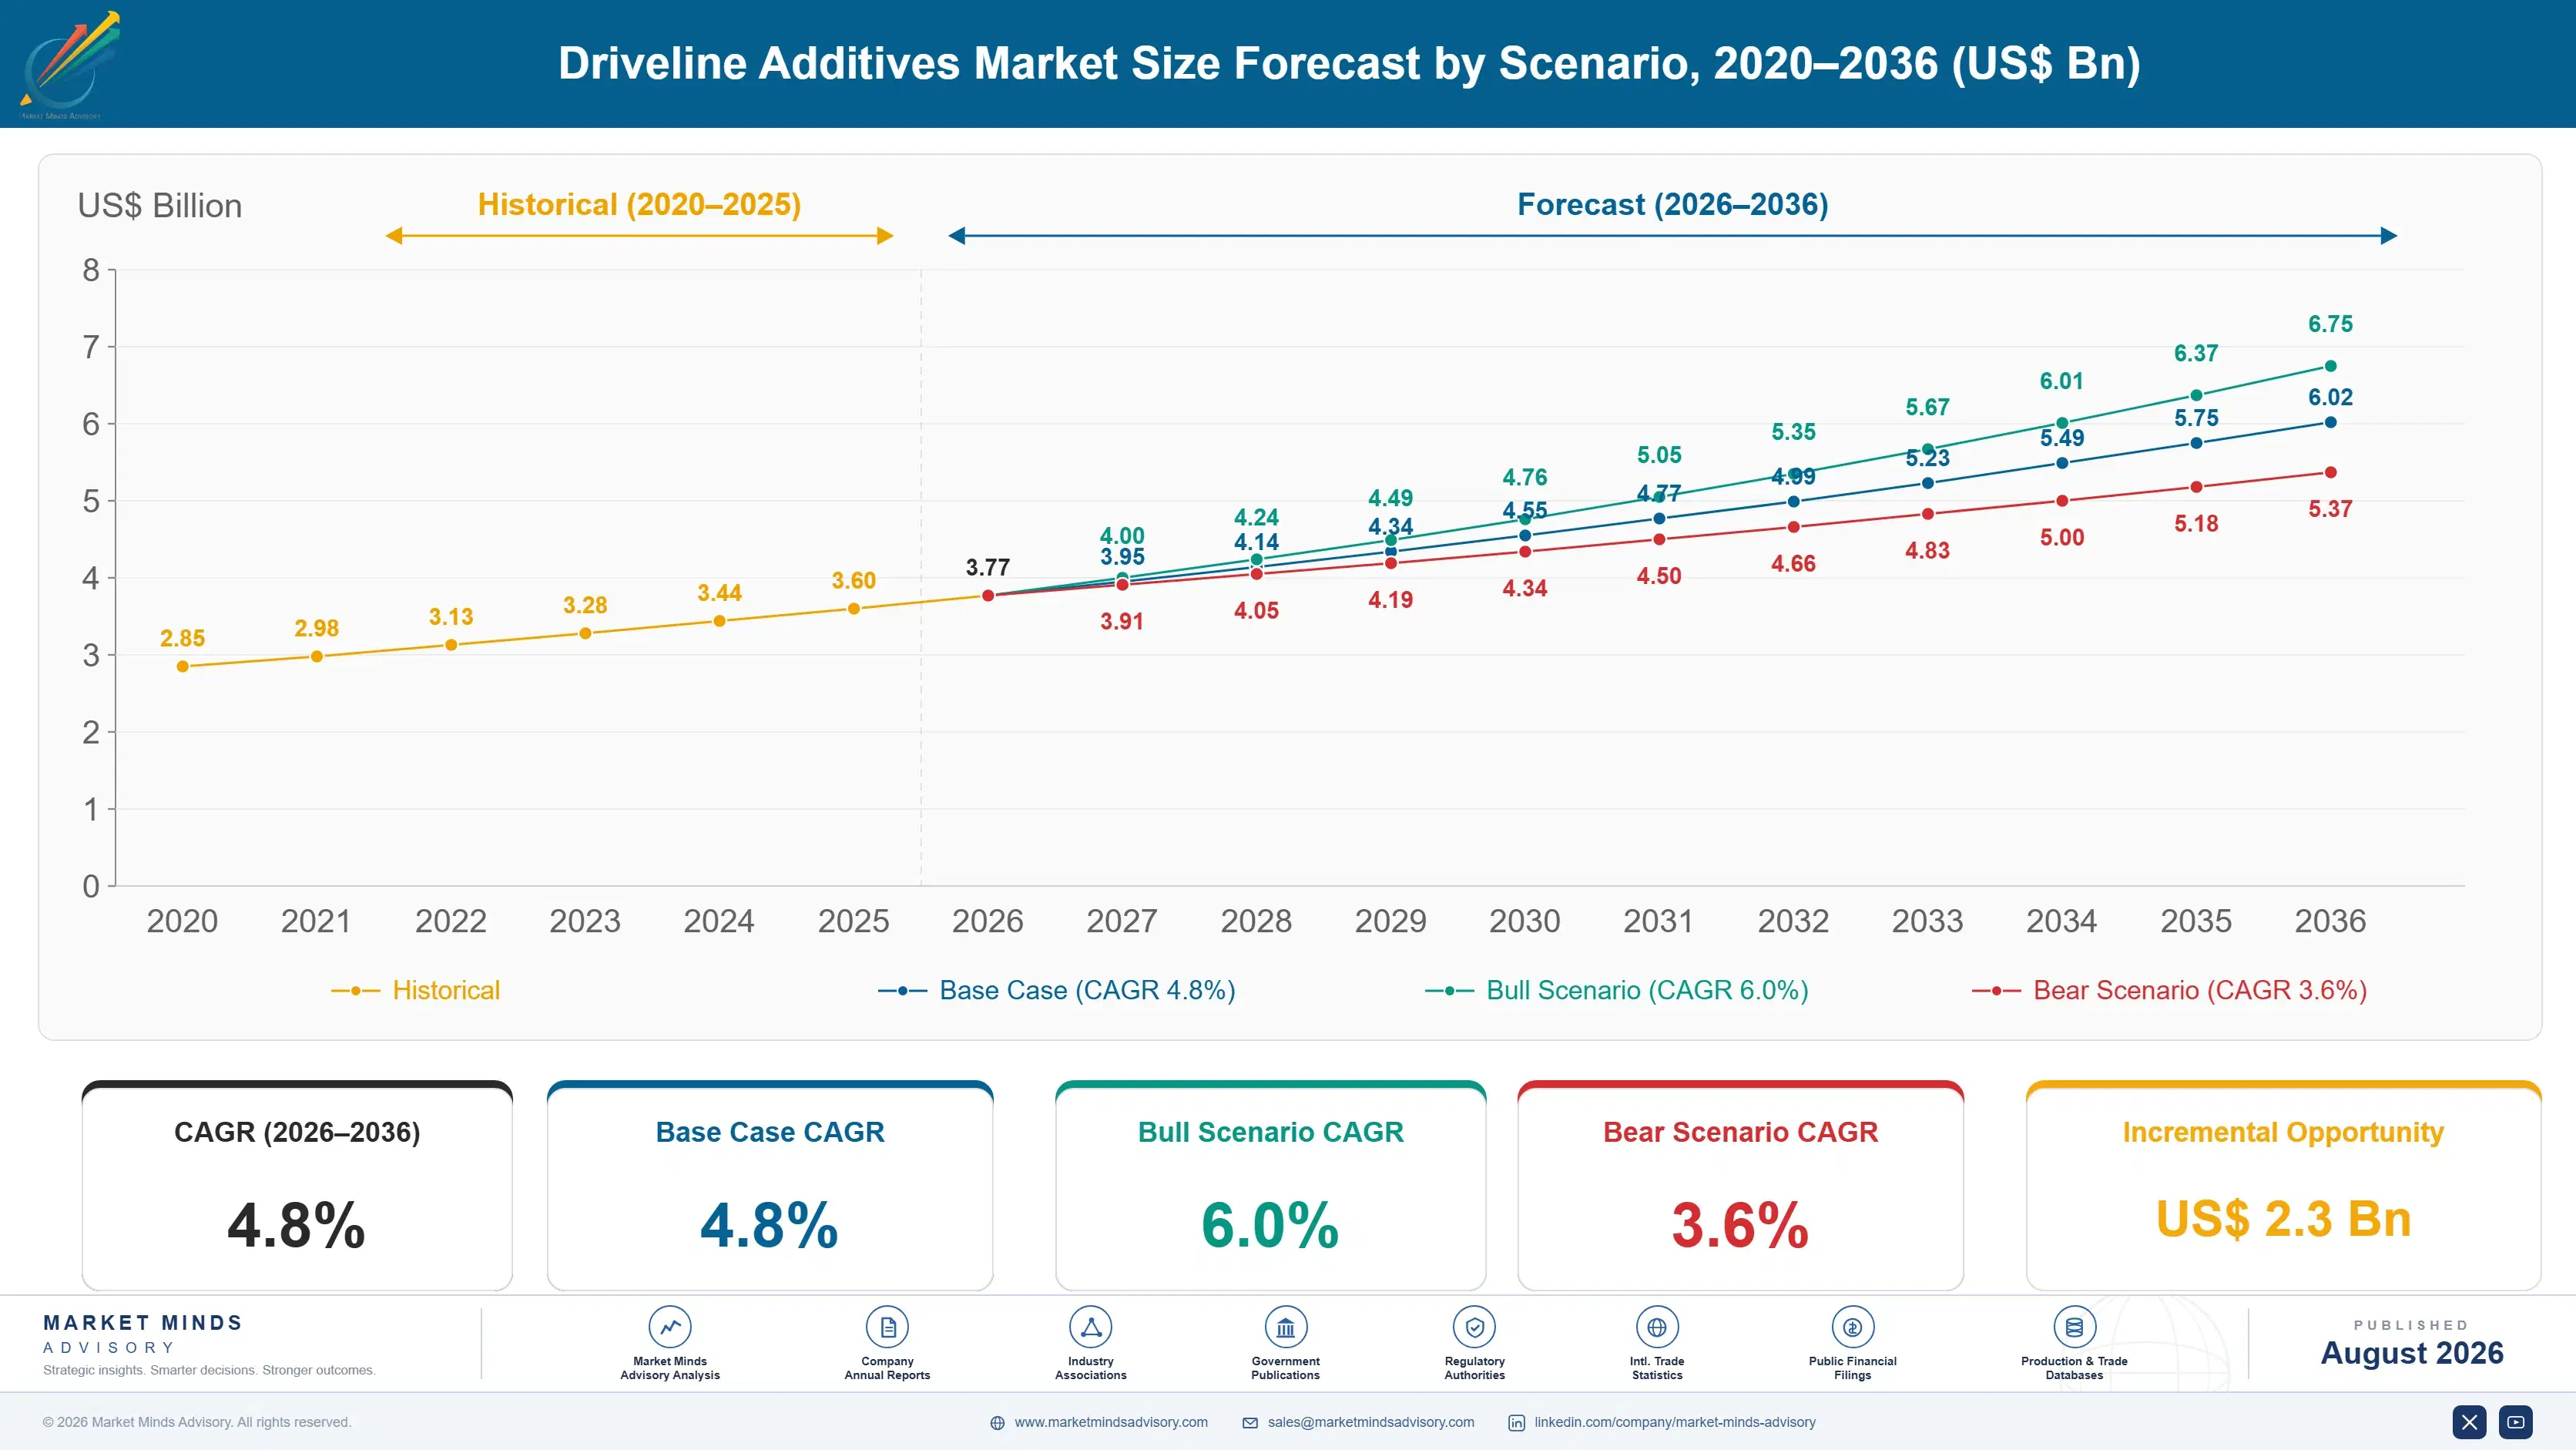
Between 2020 and 2025 the market grew on specification content rather than on fluid volume. Transmissions gained ratios and shrank sumps, cutting litres per vehicle while raising performance demanded from each, and treat rates rose accordingly. Electrified driveline emerged as a genuinely separate requirement late in the period. Base oil and component costs moved sharply throughout. The 3.7% historical growth reflects content gain offsetting falling volume almost exactly.
The 4.8% base case rests on three mechanisms. Electric driveline fluids require electrical insulation, copper compatibility, and thermal conductivity that conventional anti-wear chemistry actively undermines, which forces a genuinely new additive architecture rather than a reformulation. Transmission specification cycles keep raising performance requirements roughly every seven years. And Asian and Indian vehicle parc growth expands the service fill base that follows every factory fill decision. Only the third of those three depends on vehicle sales at all.
The 6.0% bull case assumes electrified driveline penetration accelerates and dedicated electric fluid specifications proliferate across manufacturers. The 3.6% bear case reflects extended drain intervals and fill-for-life transmissions shrinking service volume, slower electric vehicle adoption, and manufacturers consolidating specifications to cut their own qualification costs. Manufacturer decisions rather than consumer demand separate the two cases.

Eight Percent of the Fluid, All of the Approval

Three things set the commercial shape of this market. Approval status comes first, because a fluid without manufacturer approval cannot be sold against that specification whatever it contains, and obtaining approval means hardware testing measured in millions of dollars. Factory fill position comes second, since the fluid filled at assembly sets what the dealer network sells for the vehicle's life. Electrification comes third and is rewriting the chemistry.
TOP-FIVE CONCENTRATION78%Share of global driveline additive supply held by leading producers
AVERAGE TREAT RATE8.4%Additive package proportion within a finished driveline fluid
FACTORY FILL SHARE34%Portion of volume supplied into vehicle assembly plant filling
BASE OIL COST SHARE41%Carrier and diluent oil within total package cost
SPECIFICATION CYCLE LENGTH7 yearsTypical interval between major transmission fluid specification updates
ELECTRIFIED DRIVELINE SHARE9%Portion of value from electric vehicle driveline fluids
The approval barrier explains the concentration. Qualifying a package against a major transmission specification requires rig and vehicle testing costing several million dollars across two to four years, with no certainty of passing. Only suppliers with the balance sheet and the accumulated test data to design toward a pass attempt it, which is why five companies hold 78% of the market.
Electric driveline turned the chemistry upside down. An electric axle fluid must insulate electrically because it contacts motor windings, must not attack copper for the same reason, and increasingly must conduct heat because manufacturers cool motors with it directly. Conventional sulphur-phosphorus anti-wear chemistry is conductive and corrodes copper, which means the established toolkit works against every one of those requirements.
"For sixty years the answer to a driveline wear problem was more sulphur and phosphorus. Then somebody put the fluid in contact with copper windings carrying four hundred volts and the entire toolkit became the problem rather than the solution. That is a genuinely rare event in lubricant chemistry, and it has reset positions that looked permanent."
Practice Director, Lubricant Additives and Driveline Technology · MMA Chemicals and Materials Practice · August 2026

Market Trends

Electric Driveline Fluids Invert Conventional Additive Chemistry

An electric axle fluid contacts motor windings, which means it must be electrically insulating and must not attack copper, and manufacturers increasingly use it to cool the motor directly, which means it must also conduct heat. Conventional sulphur-phosphorus anti-wear chemistry is conductive and corrosive to copper, so the established toolkit works against all three requirements simultaneously. Electrical property modifiers addressing this grow at 14.6% and already supply 9% of market value. What matters commercially is that decades of accumulated formulation advantage transfers poorly, which has reopened positions that appeared settled for a generation.
Market Impact: Factory fill takes 34% of volume
Specification Consolidation Reduces the Number of Approvals Available

Vehicle manufacturers have begun consolidating around fewer transmission fluid specifications, partly to cut their own qualification burden and partly because platform sharing across brands makes multiple fluids hard to justify. Fewer specifications means fewer approval opportunities and higher stakes on each one, since losing a consolidated specification removes more volume than losing any single previous one would have. Suppliers with broad approval portfolios face concentration risk they did not previously carry. It also raises the value of each remaining approval and hardens the barrier for anyone attempting to enter the category now.
Market Impact: Parc growth exceeds 6% annually

Market Opportunities and Growth Drivers

Factory Fill Position Locks Service Fill Volume Behind It

The fluid filled at vehicle assembly determines what the dealer network stocks and what the service manual specifies for the vehicle's operating life, which typically runs well over a decade. Factory fill itself takes 34% of volume at margins thin enough that suppliers effectively buy the position, and the service fill business that follows earns several times more per litre. That makes each factory fill award an annuity rather than a contract, and it explains why suppliers compete for them at pricing that looks irrational until the downstream volume is counted properly.
Market Impact: Intervals extended beyond 100,000 kilometres

Asian Vehicle Parc Growth Expands the Service Fill Base

Vehicle populations across India, Southeast Asia, and China continue growing, and every vehicle sold today generates transmission and axle fluid demand for a decade or more afterwards regardless of what happens to new vehicle sales. Service fill volumes therefore lag production by years and grow more steadily than assembly output ever does. Independent workshops in these markets increasingly specify approved fluids as vehicles come under warranty and manufacturers push service standards. That converts an informal market into one where approval status matters commercially rather than only in dealer networks. Approval status is starting to matter there.
Market Impact: Programmes exceed $3 million each

Market Restraints and Challenges

Extended Drain Intervals Shrink Service Fill Volume Per Vehicle

Manufacturers have lengthened transmission fluid change intervals repeatedly and several now specify fill-for-life on sealed units, which removes service volume entirely from those vehicles. The root cause is that fluid technology genuinely improved, and manufacturers used the improvement to reduce maintenance cost rather than to extend margins. Each interval extension removes litres from a service business that funds the whole category. Suppliers mitigate by pricing factory fill against a shorter service annuity, developing higher-performance fluids that command better factory fill pricing, and pursuing the independent aftermarket where drain practice is more conservative.
Market Impact: Electrified fluids supply 9% of value

Approval Testing Costs Exclude Almost All Potential Entrants

Qualifying a package against a major transmission specification costs several million dollars in rig and vehicle testing across two to four years, with a genuine risk of failing and starting again. The root cause is that transmission durability cannot be predicted from bench chemistry and must be demonstrated in hardware. That cost falls per specification regardless of the volume it eventually supports. Suppliers mitigate by designing packages to address several specifications from one test programme, sharing data across related approvals, and licensing approved formulations to regional blenders rather than testing separately.
Market Impact: Cycles run about 7 years
4 additional market trends, 3 additional growth drivers, and 2 additional restraints and challenges are covered in the full report. Contact sales@marketmindsadvisory.com to access the complete intelligence.

Segment CAGR and Growth Architecture

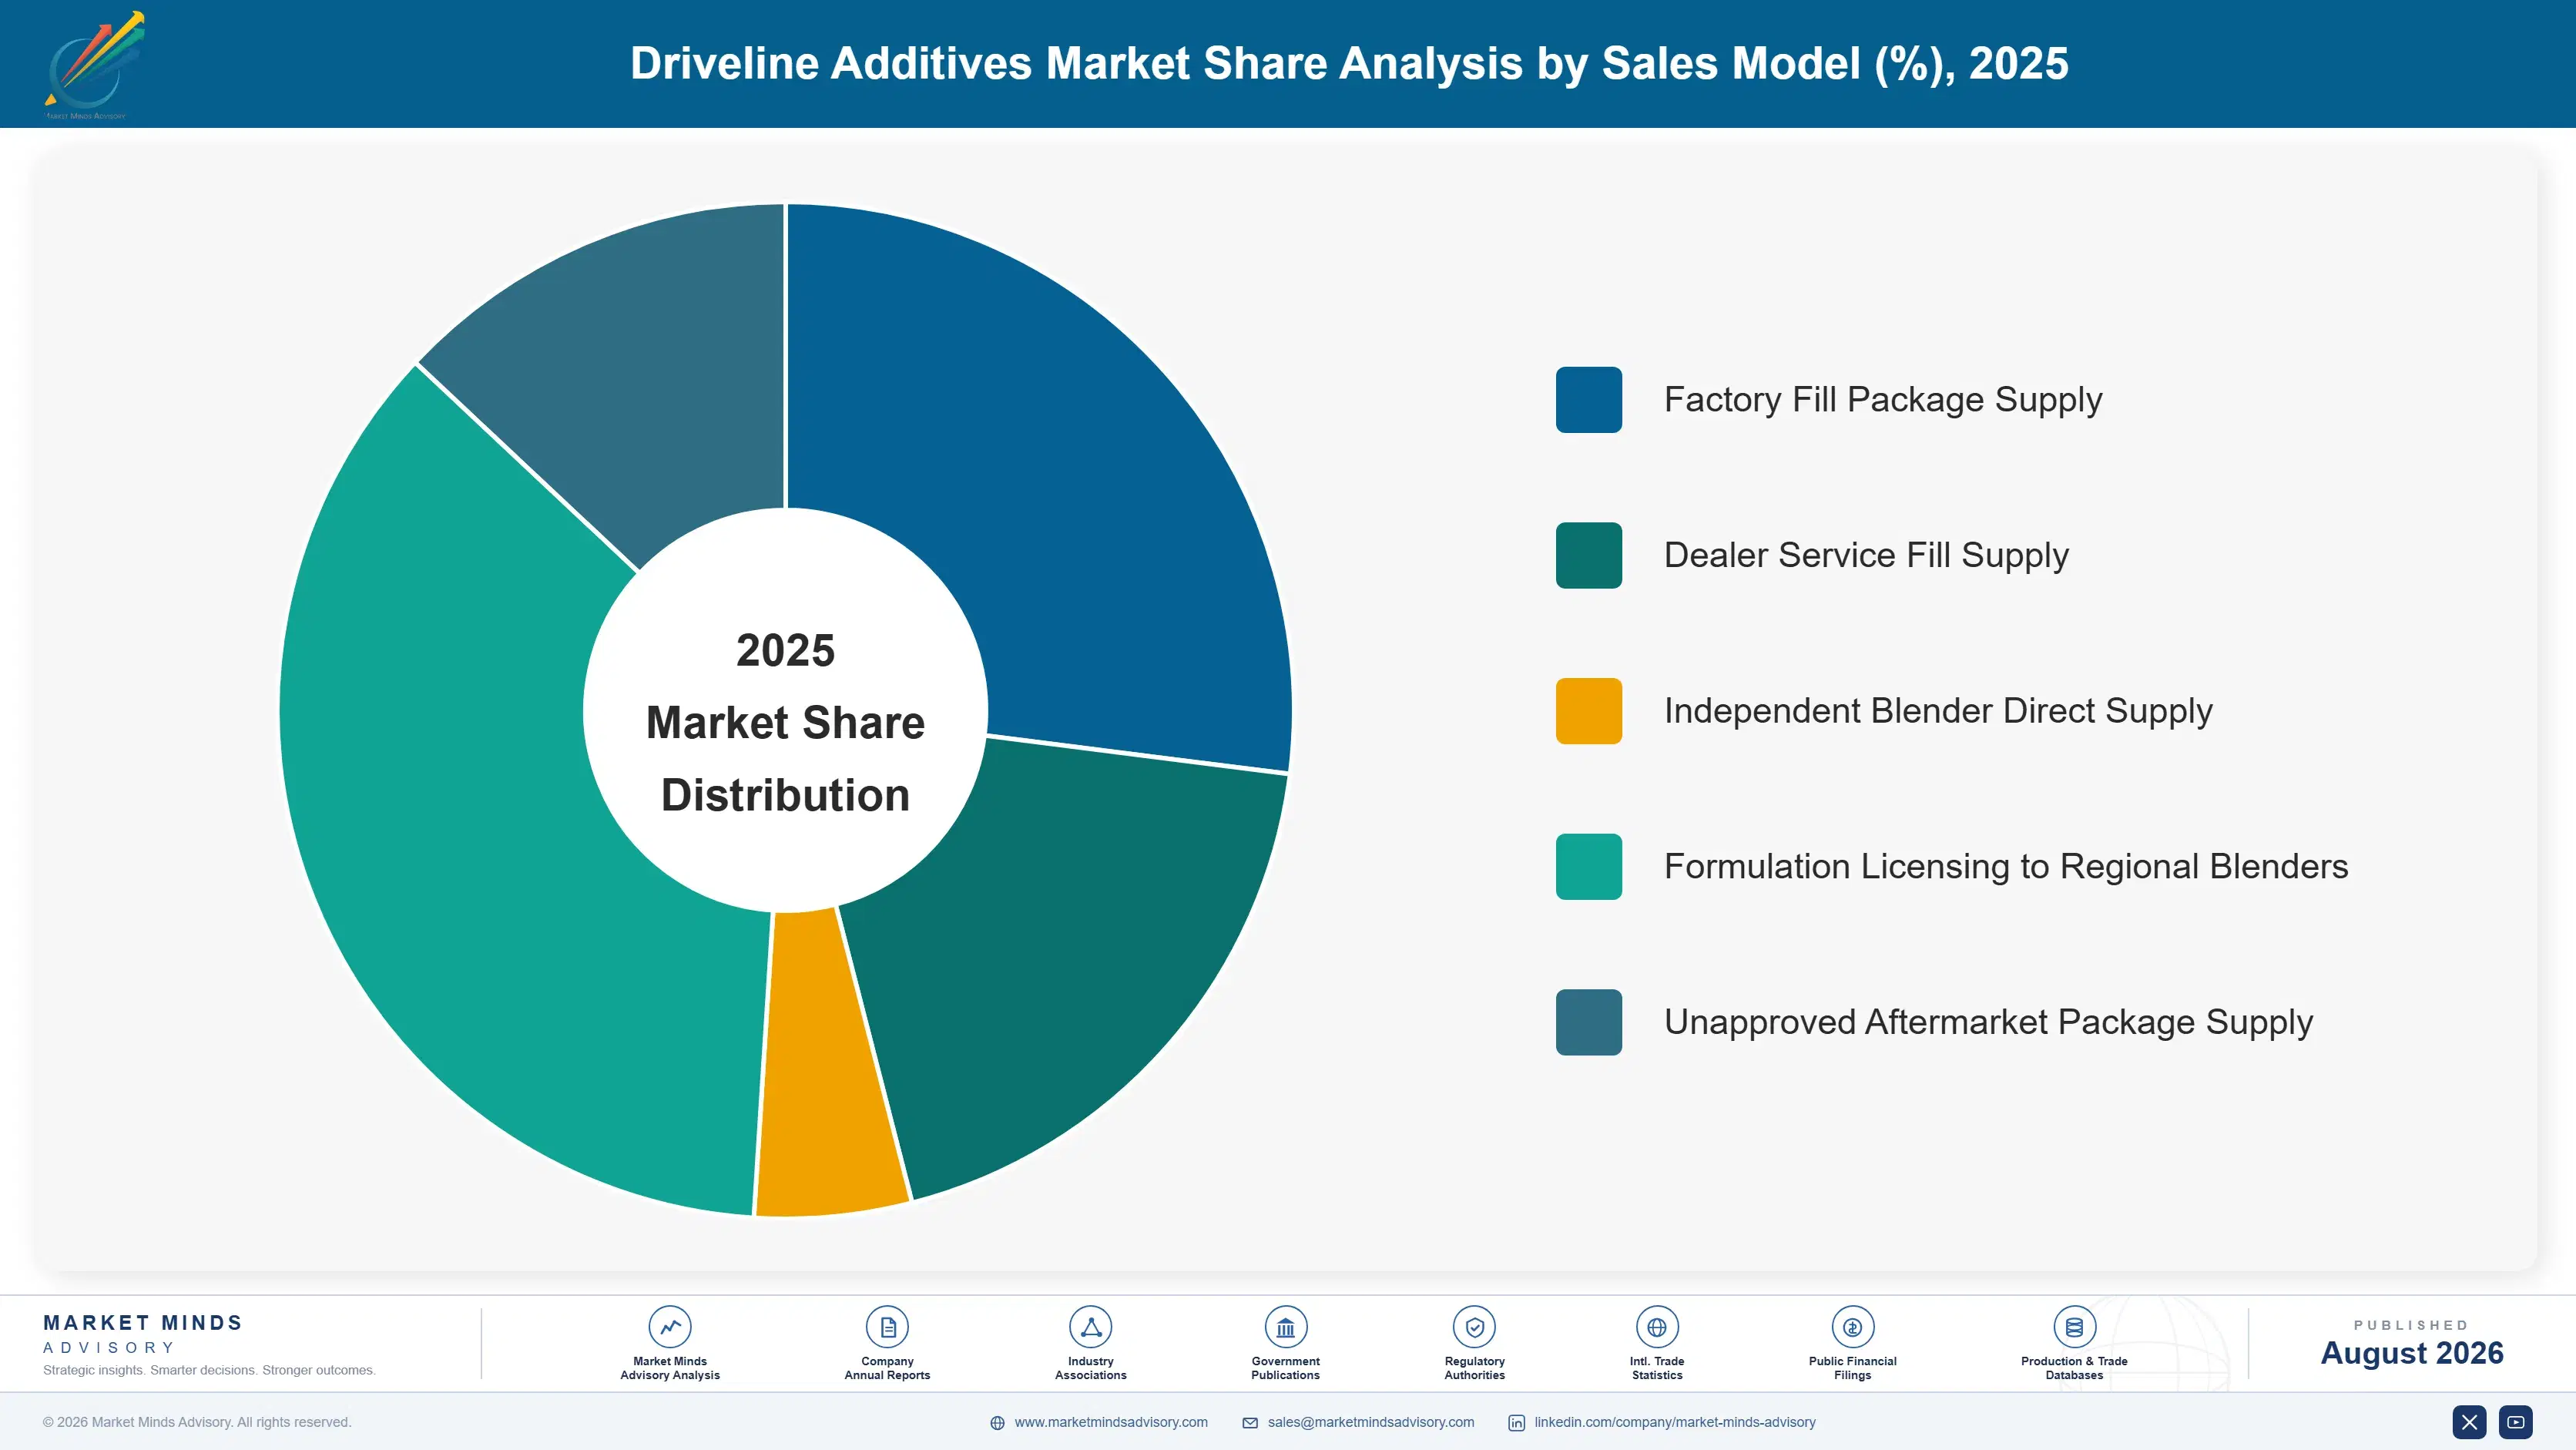
Segmentation follows additive function, because the function determines what the component does in the fluid, which specifications require it, how it interacts with other components, and what it contributes to the package cost. Six functional families cover commercial supply, and they are combined rather than substituted, since a driveline package contains most of them at once in carefully balanced proportions.
driveline-additives-market-trends-market-share-analysis-1787549288094

Electrical Property Modifiers for Electrified Driveline

The fastest-growing family at 14.6%, roughly 3.04 times the market, and the only one addressing requirements that did not exist a decade ago. Electric axle fluids must hold high volume resistivity so they do not conduct across motor windings, must leave copper untouched, and increasingly must transfer heat because manufacturers cool motors directly with the fluid. Conventional anti-wear chemistry fails all three tests, which forces genuinely new components rather than reformulated old ones. Volumes remain modest against conventional driveline at 9% of value. The commercial significance is that decades of accumulated formulation advantage transfers poorly here, which has reopened competitive positions that looked permanently settled. Specifications are still forming, which is exactly why the window remains open.
CAGR 14.6%

Friction Modifiers

Second fastest at 6.4%, and the component that determines shift quality, which is what a driver actually perceives. Automatic and continuously variable transmissions depend on precisely controlled friction between clutch plates and bands, and the friction curve must hold across temperature and through the fluid's whole service life rather than only when fresh. That durability requirement is what makes friction modification difficult and what most approval testing actually measures. Efficiency requirements have raised the stakes further, since manufacturers now specify lower viscosity fluids that leave less margin for error in the friction system. Formulation experience here transfers reasonably well into electrified driveline applications. Durability across service life, not performance when fresh, is what approval testing measures.
CAGR 6.4%
Full segment breakdown across 6 segments available in the complete report.

Regional Architecture and Country Demand Map

Regional shares follow vehicle production and parc size together, since factory fill tracks assembly while service fill tracks the vehicles already on the road. Transmission technology leadership concentrates in fewer places still, which shapes where specifications originate. Electrification pace then varies again on top of both.

North America

Automatic transmissions dominate the parc here more completely than anywhere, which makes this the largest single market for transmission fluid additives by application rather than by vehicle count. Manufacturer specifications originating here have historically been adopted internationally, giving suppliers approved against them reach well beyond the region. The vehicle parc is large, ages slowly, and generates service fill demand for well over a decade after each sale. Lubrizol, Afton, and Chevron Oronite all hold substantial domestic positions with test facilities to match. Pickup and sport utility mix raises axle fluid volumes above passenger car averages. Growth of 4.4% reflects content gain against gradually declining fluid volume per vehicle. Axle fluid volumes run above passenger car averages.
Share: 26% | CAGR: 4.4% (2026 to 2036)

Western Europe

Manual transmissions historically held higher share here than elsewhere, which shaped a different additive mix, though automatics and dual-clutch units have displaced them steadily across the past two decades. German manufacturer specifications set the technical standard for much of the world's premium driveline, and approval against them carries weight far beyond regional volume. Electrification has advanced faster here than in North America, which makes this the leading market for electric driveline fluid development. Infineum and BASF hold strong regional positions. The parc is large and ageing, sustaining service fill demand. Growth of 3.2% is the slowest in the report, reflecting declining production alongside the electric transition. Premium specification leadership persists despite falling volumes.
Share: 19% | CAGR: 3.2% (2026 to 2036)
Regional intelligence for 5 additional markets available in the complete report: East Asia, South Asia and Pacific, Latin America, Middle East and Africa, Eastern Europe. Contact sales@marketmindsadvisory.com.
driveline-additives-market-trends-country-cagr-analysis-1787549288606

Four Moves That Change the Economics

Advantage here comes from approval portfolio, factory fill position, and electrified formulation capability rather than from component chemistry, most of which is decades old and widely understood. Four moves are worth capital and management attention across the forecast period, and the first is where the whole industry structure comes from. Two of them cost discipline rather than money.

Design one test programme against several specifications

Approval testing costs several million dollars per specification across two to four years, and suppliers who design a package targeting one requirement pay that repeatedly. Formulating deliberately to satisfy multiple manufacturer specifications from a single hardware programme cuts qualification cost 30 to 45% per approval obtained. It requires accepting formulation compromises that a single-target package would avoid, and the arithmetic favours breadth in almost every case. Suppliers who plan approvals as a portfolio rather than as individual projects consistently hold wider coverage at lower total cost. Portfolio planning beats project-by-project approval every time.
Market Impact: Cuts qualification cost by 30 to 45% overall

Price factory fill against the service annuity behind it

The fluid filled at assembly determines what dealer networks stock and service manuals specify for a decade or more, and service fill earns several times factory fill margin per litre. Suppliers pricing factory fill on its own economics lose positions to competitors valuing the annuity properly, and the total lifetime value of an award typically runs 4 to 7 times the factory fill revenue itself. The discipline required is holding that pricing internally when a factory fill contract looks unprofitable in isolation, which finance functions frequently resist. A clear lifetime model is what makes that discipline survivable.
Market Impact: Lifetime value runs 4 to 7 times higher

Build electrified driveline formulation capability now

Electric axle fluids need electrical insulation, copper compatibility, and thermal conductivity that conventional anti-wear chemistry actively undermines, which means accumulated formulation advantage transfers poorly into this segment. That has reopened positions that looked permanently settled, and the window will close as specifications firm up and early approvals accumulate. Electrified driveline already supplies 9% of value and grows at 14.6%. Development requires new component chemistry and testing capability rather than manufacturing capacity, which puts it within reach of suppliers who could never fund a conventional approval war. Specifications firm quickly once early approvals accumulate.
Market Impact: Addresses 9% of value now growing at 14.6%

License approved formulations to regional blenders

Service fill demand across India, Southeast Asia, Latin America, and Africa is served by regional blenders who cannot fund approval testing and will otherwise sell unapproved product into a market where standards are tightening. Licensing an approved formulation generates royalty revenue and extends approval coverage into territories where direct supply would never pay for itself. Royalty income typically runs 3 to 6% of blender revenue at essentially no incremental cost. The trade-off is ceding the direct customer relationship, which matters far less in markets a supplier was never going to serve directly.
Market Impact: Yields 3 to 6% royalty on blender revenue

Who Controls the Margin Pool

Concentration is extreme: the top five hold roughly 78% of global driveline additive supply, among the highest figures in any chemicals market, and approval test cost rather than manufacturing scale explains it entirely. Lubrizol and Infineum lead through the broadest approval portfolios and the test infrastructure that produced them. Chevron Oronite and Afton compete on comparable terms with different manufacturer relationships, while BASF brings component chemistry breadth that several competitors formulate with.
Competitive activity runs on three fronts. Approval portfolio breadth is the first, because a package without the relevant approval cannot be quoted at all regardless of performance. Factory fill relationships are the second, and they determine service volume for a decade afterwards. Electrified formulation capability is the third, and it is the only front where accumulated advantage genuinely fails to transfer. None of the three is available to purchase at any price.

Pressure is building from two directions. Chinese additive suppliers compete effectively in service fill across Asia and are pursuing approvals. And specialist entrants with electrical property chemistry are addressing electrified driveline requirements that the established toolkit works against rather than toward. The second matters more, since incumbent test data offers no advantage there.
driveline-additives-market-trends-company-positioning-matrix-1787549289121

Competitive Moat and Risk Dimensions

LUBRIZOL

Moat: Approval portfolio and test infrastructure

Decades of accumulated approvals across manufacturer specifications, supported by test facilities and historical data that let formulators design toward a pass rather than discover failure in hardware, give Lubrizol a position competitors cannot buy. Every additional approval costs the company less than it costs an entrant, because the data behind it already exists.
LUBRIZOL

Risk: Electrified chemistry advantage transfer

The formulation experience underpinning that position was built on sulphur-phosphorus chemistry that electric driveline fluids specifically cannot use, and accumulated advantage transfers poorly into a requirement set that inverts the old rules. Specialist entrants with electrical property expertise face no such legacy, and early approvals in that segment will harden quickly.
INFINEUM

Moat: Manufacturer relationships across regions

Deep technical relationships with vehicle manufacturers in Europe, Japan, and North America give Infineum early visibility of specification direction, which matters enormously when a test programme takes years and must target requirements that do not yet exist publicly. Formulating against a specification before it is published is a genuine advantage.
INFINEUM

Risk: Exposure to specification consolidation

Manufacturers consolidating around fewer fluid specifications reduce the number of approval opportunities and raise the stakes on each, which concentrates risk for suppliers holding broad portfolios built on the previous fragmentation. Losing a consolidated specification now removes considerably more volume than losing any single earlier specification ever would have.

Players Tracked

Prominent Players

Lubrizol
Infineum
Chevron Oronite
Afton Chemical
BASF

Other Key Players

Evonik Industries
Croda International
Vanderbilt Chemicals
Dover Chemical
King Industries
NYCO
Italmatch Chemicals
Adeka Corporation
Sanyo Chemical Industries
Wuxi South Petroleum Additive
Jinzhou Kangtai Lubricant Additives
Lanxess
Tianhe Chemicals
Idemitsu Kosan
Sinopec Lubricant

Recent Developments

FEBRUARY 2025

Supplier launches dedicated electric axle fluid package

An additive package formulated specifically for electric driveline was introduced, combining high volume resistivity, copper passivation, and improved thermal transfer for direct motor cooling. Conventional anti-wear components were replaced rather than reduced, since the established chemistry conflicts with all three requirements. Blender trials began immediately.
Signal: Electric driveline demands wholesale replacement rather than reformulation, which is why accumulated advantage transfers so poorly
JUNE 2025

Manufacturer consolidates transmission fluid specifications

A vehicle manufacturer reduced its transmission fluid specifications across platforms, citing qualification cost and inventory complexity in dealer networks. Suppliers approved against the retained specification gained volume while those holding only the discontinued approvals lost positions they had funded expensively. Dealer inventory complexity was cited.
Signal: Specification consolidation raises the stakes on every remaining approval and concentrates supplier risk considerably further still
SEPTEMBER 2025

Additive supplier licenses formulation to Asian blenders

An approved driveline formulation was licensed to regional blending operations across South and Southeast Asia, extending approval coverage into service fill markets the supplier had not served directly. Royalty terms replaced direct supply in territories where shipping finished packages was uneconomic. Royalty terms replaced direct supply.
Signal: Licensing is becoming the practical route into service fill markets that direct supply cannot economically reach

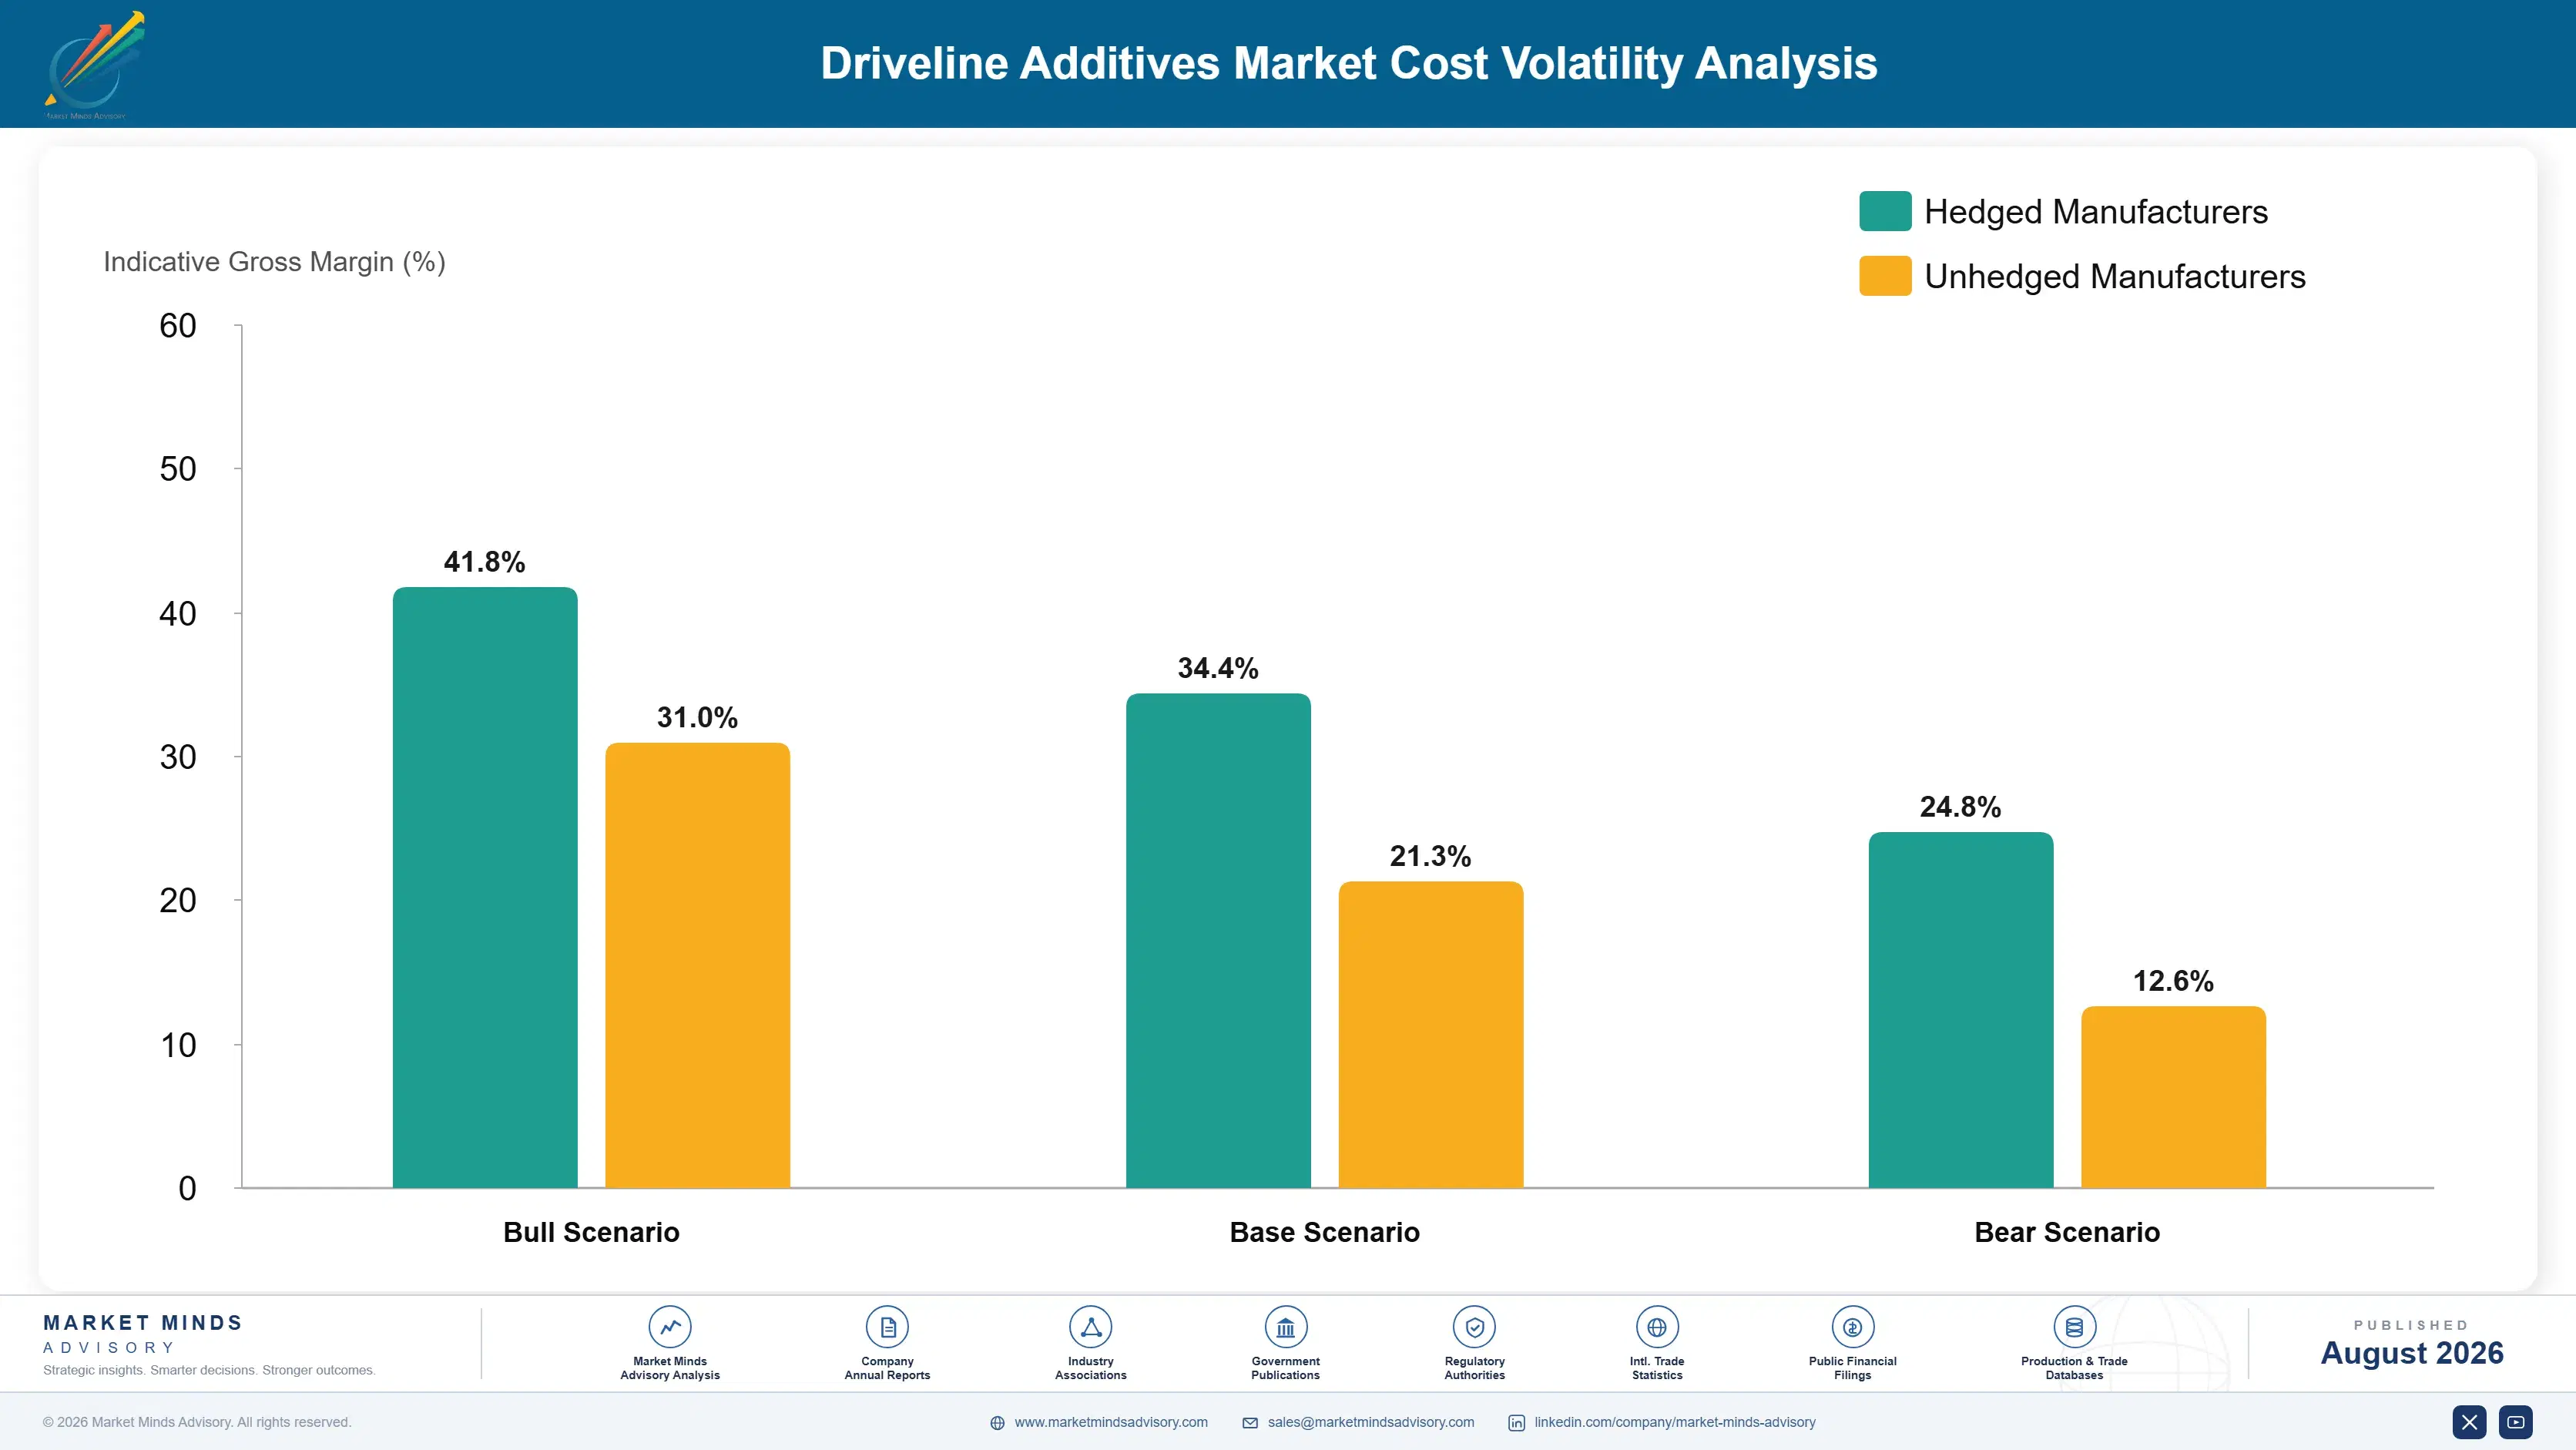
What Sets the Cost Base

Base oil used as carrier and diluent accounts for roughly 41% of package cost, which surprises people who assume additive packages are mostly active chemistry. Performance components including friction modifiers, extreme pressure additives, and dispersants contribute 34%, with several depending on phosphorus, sulphur, and specialty amine feedstocks. Viscosity modifier polymers take 11%. Approval amortisation, technical service, and quality control absorb the remainder. Little of it is active chemistry.
Base oil and specialty component costs moved sharply through 2021 and 2022 as refinery run rates fell, group three base oil tightened, and several additive intermediates went on allocation. Lubrizol and Afton both referenced raw material cost inflation and pricing actions across their reporting for those years. Package suppliers passed costs through to blenders with a lag that compressed margin, and blenders in turn struggled to reprice finished fluids under annual contracts with vehicle manufacturers.

Exposure divides on component integration and approval amortisation rather than on scale alone. Suppliers manufacturing their own performance components carry feedstock exposure while those purchasing them carry supplier margin as well. Approval cost amortisation is the larger and less visible divide, since spreading test cost across many approved formulations carries a far lower burden per litre.
driveline-additives-market-trends-cost-volatility-analysis-1787549289316

Index blender contracts to published base oil benchmarks

Base oil is 41% of package cost and moves with refinery economics that no additive supplier influences. Indexing blender pricing to published base oil benchmarks passes movement through within weeks rather than at annual renewal. Blenders resist because their own contracts with vehicle manufacturers are frequently fixed, which pushes the problem along a chain that absorbs it somewhere.

Amortise approval testing across a planned formulation portfolio

Test cost falls per specification rather than per litre, which punishes suppliers holding few approvals severely. Planning formulations as a family designed to address several specifications from shared hardware programmes spreads that cost properly. It requires approval strategy to sit inside formulation development from the start rather than being applied to finished packages afterwards.

Integrate backward into key performance component manufacture

Performance components are 34% of cost and several come from a narrow supplier base that also serves competitors. Manufacturing the most critical of them internally removes both margin stacking and allocation risk during tight periods. Capital cost is significant and only justifies itself above real volume thresholds, which partly explains why concentration sits so high.

Portfolio Architecture for Margin Defence

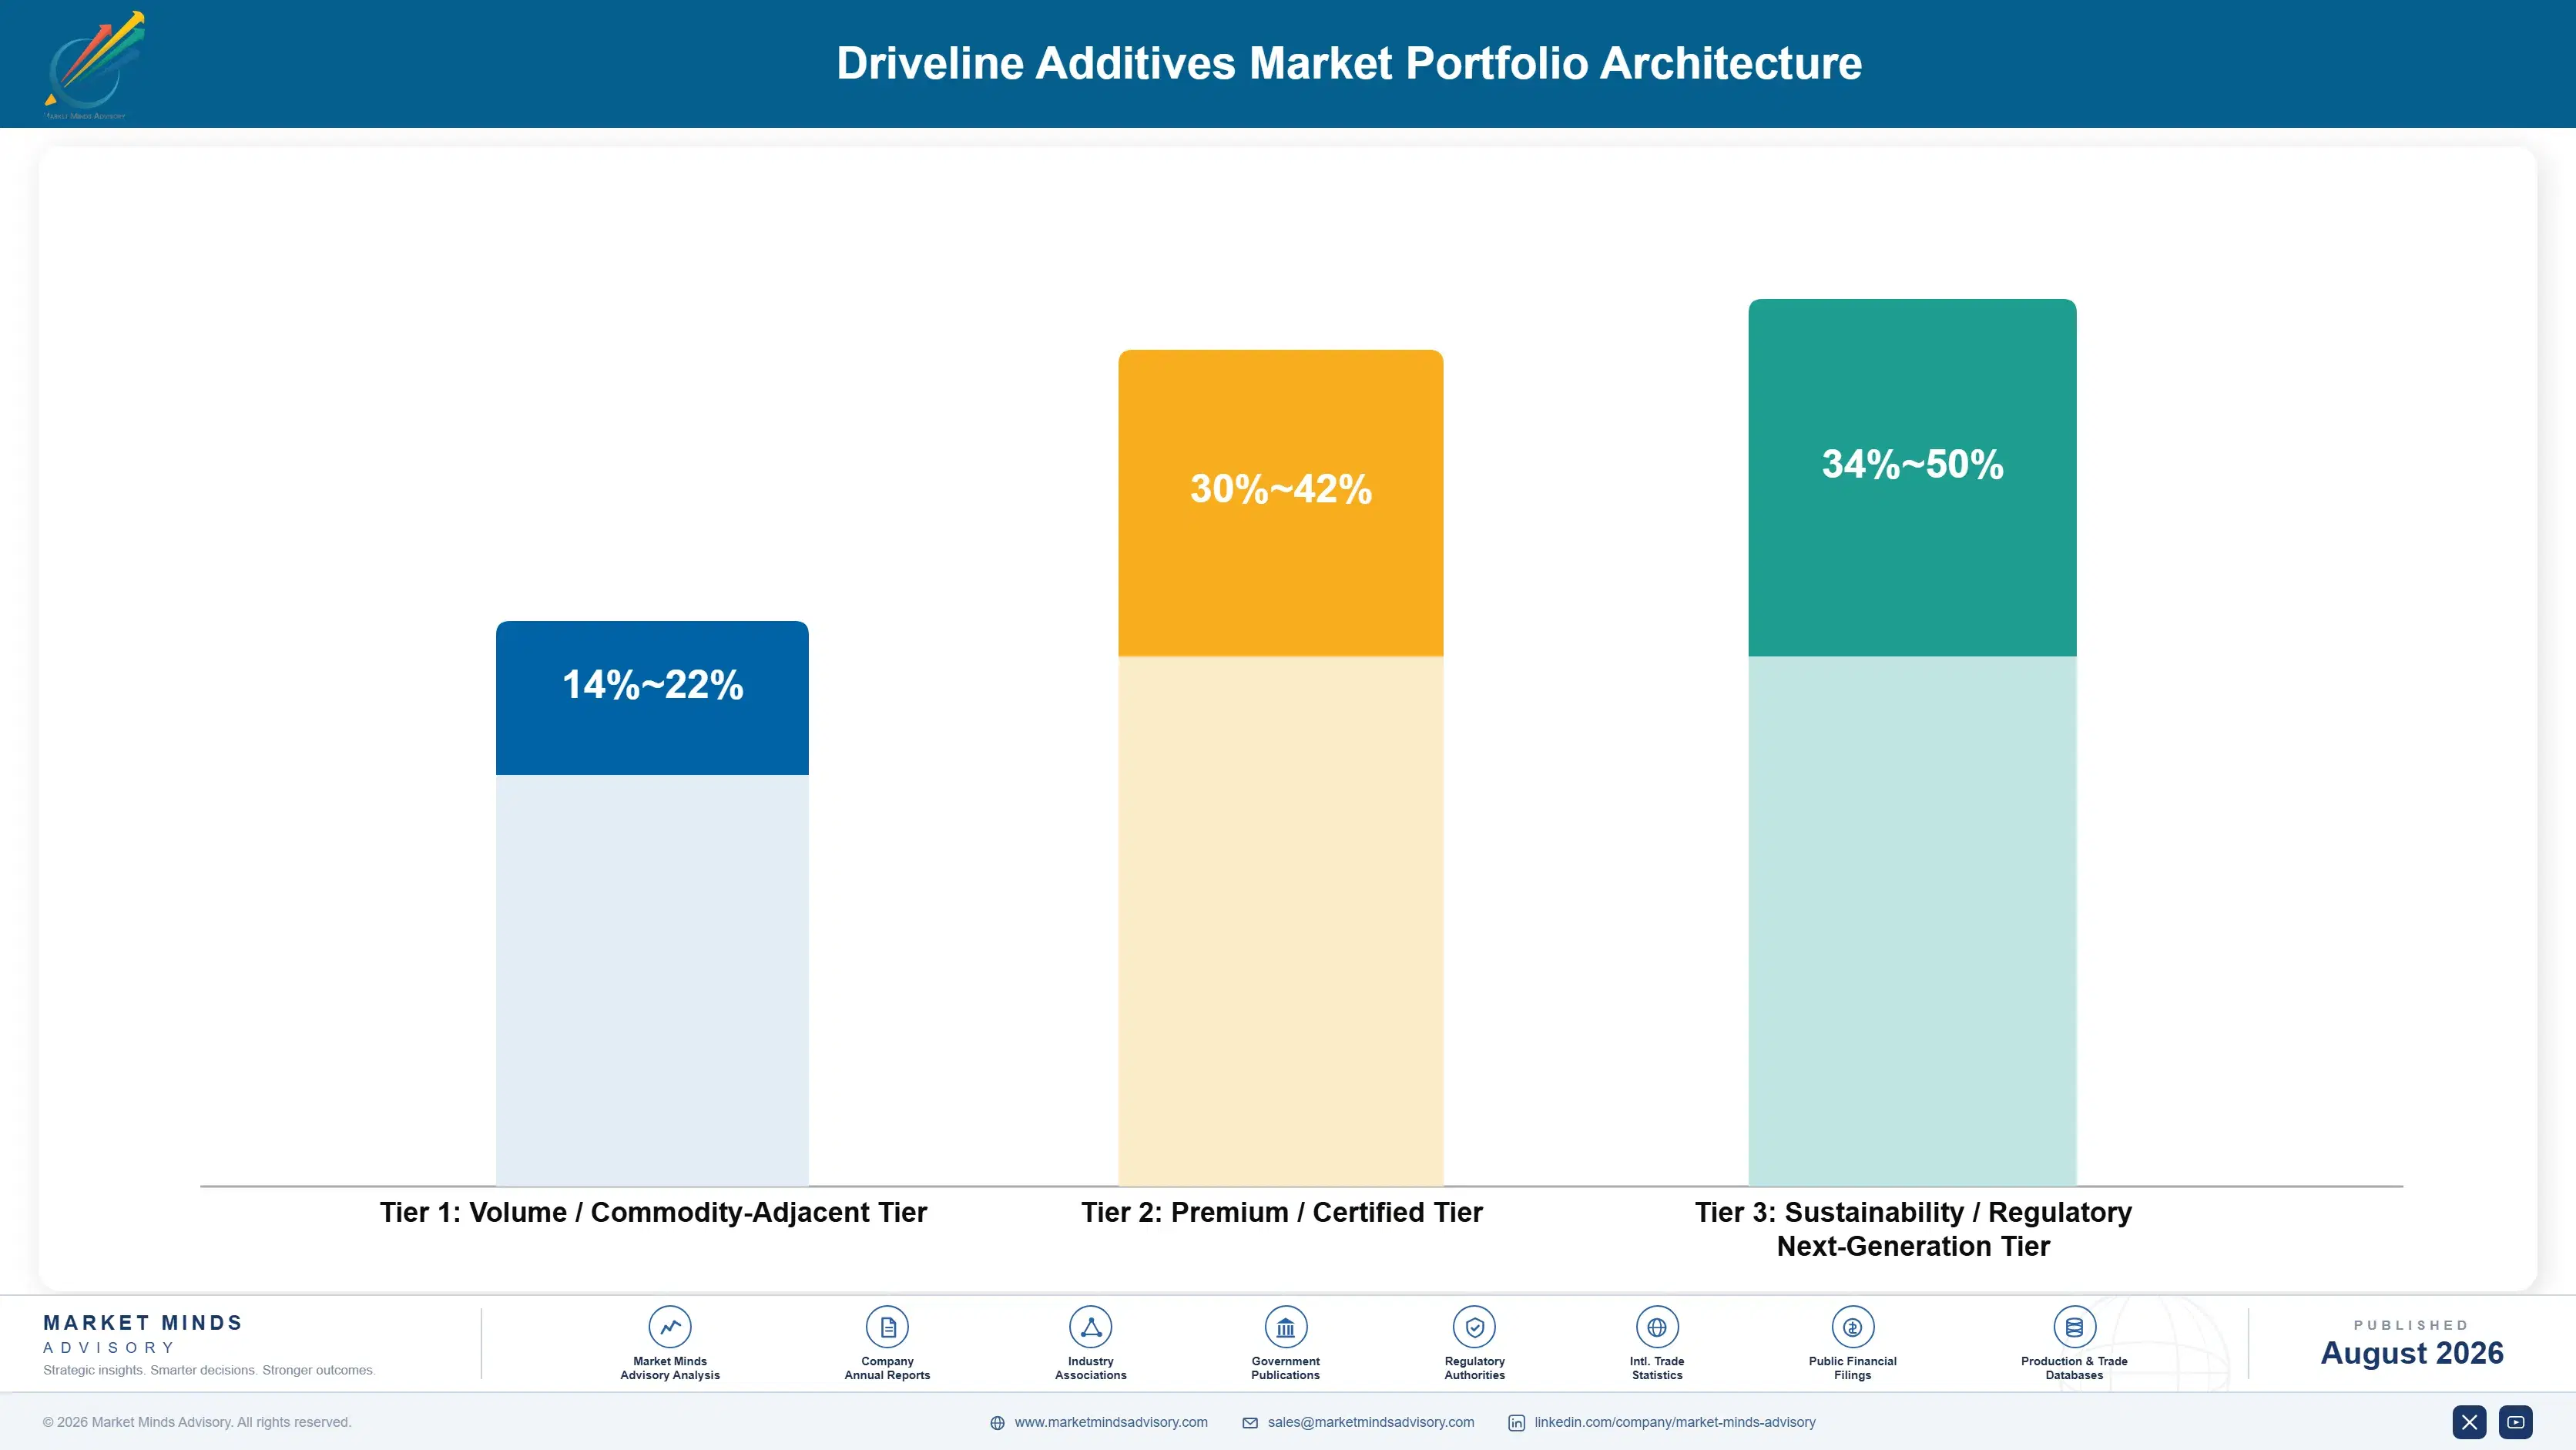
Margin follows approval status and channel rather than volume. Unapproved packages sold to independent blenders for aftermarket fluids earn thin returns, because the chemistry is well understood and buyers compare price against a performance claim nobody verifies. Approved packages carrying manufacturer specifications earn several times that, since the approval cannot be replicated without repeating the test programme and the blender is buying market access rather than chemistry.
The volume and premium tension sits in approval amortisation rather than in plant loading. Test costs are fixed per specification and must be recovered across whatever volume that approval eventually supports, so suppliers take lower-margin aftermarket business to spread the burden. That works until specification consolidation removes an approval and the volume behind it disappears while the sunk cost remains. That risk was invisible while specifications proliferated and is visible now.

High-value pools concentrate in three places: factory fill positions with the service annuity behind them, electrified driveline packages where advantage is being rebuilt, and licensed formulations generating royalty in markets direct supply cannot reach. Each is defended by approval, capability, or contract rather than by price. Price competition arrives only when a competitor funds the test programme.

Volume / Commodity-Adjacent Tier

Unapproved and older specification packages sold to independent blenders for aftermarket fluids. Competes on price against regional additive suppliers. The range reflects large differences in component integration and base oil position.
Gross Margin: 14%-22%

Premium / Certified Tier

Approved packages carrying current manufacturer specifications for factory and dealer service fill. The blender purchases market access rather than chemistry, and no substitute exists without repeating the whole test programme.
Gross Margin: 30%-42%

Sustainability / Regulatory / Next-Generation Tier

Electrified driveline packages and low-viscosity efficiency formulations addressing requirements conventional chemistry cannot meet. Technical scarcity drives the premium. The range is wide because electric fluid specifications have not yet settled.
Gross Margin: 34%-50%
driveline-additives-market-trends-portfolio-architecture-1787549289820

High-value Sub-segments and Strategic Watch-out

Factory Fill Approval Positions

Each award sets what dealer networks stock and service manuals specify for a decade or more, which makes it an annuity rather than a contract. Lifetime value runs several times the factory fill revenue itself. Price them accordingly or lose them. Model the annuity before bidding anything.
Gross Margin: 28%-40%

Electrified Driveline Packages

The one front where accumulated formulation advantage genuinely fails to transfer, because electric fluids need properties conventional chemistry actively undermines. Growing at 14.6% with specifications still forming. The competitive window will close quickly. Component chemistry rather than capacity is required. Move while it stays open.
Gross Margin: 36%-50%

Licensed Regional Formulations

Royalty income from blenders in markets direct supply could never economically reach, at essentially no incremental cost once the approval exists. It also extends approval coverage as service standards tighten across emerging markets. Licensing costs nothing once approval exists. Pursue it deliberately. Start now. Free money.
Gross Margin: 55%-75%

Unapproved Aftermarket Packages

The strategic watch-out. Well-understood chemistry sold against performance claims nobody verifies, competing on price with regional suppliers. It spreads approval cost amortisation across more volume, and that is the whole argument. Expect it to decline as enforcement tightens further. Manage the decline deliberately. Plan for it.
Gross Margin: 14%-21%

How Demand Actually Reaches Suppliers

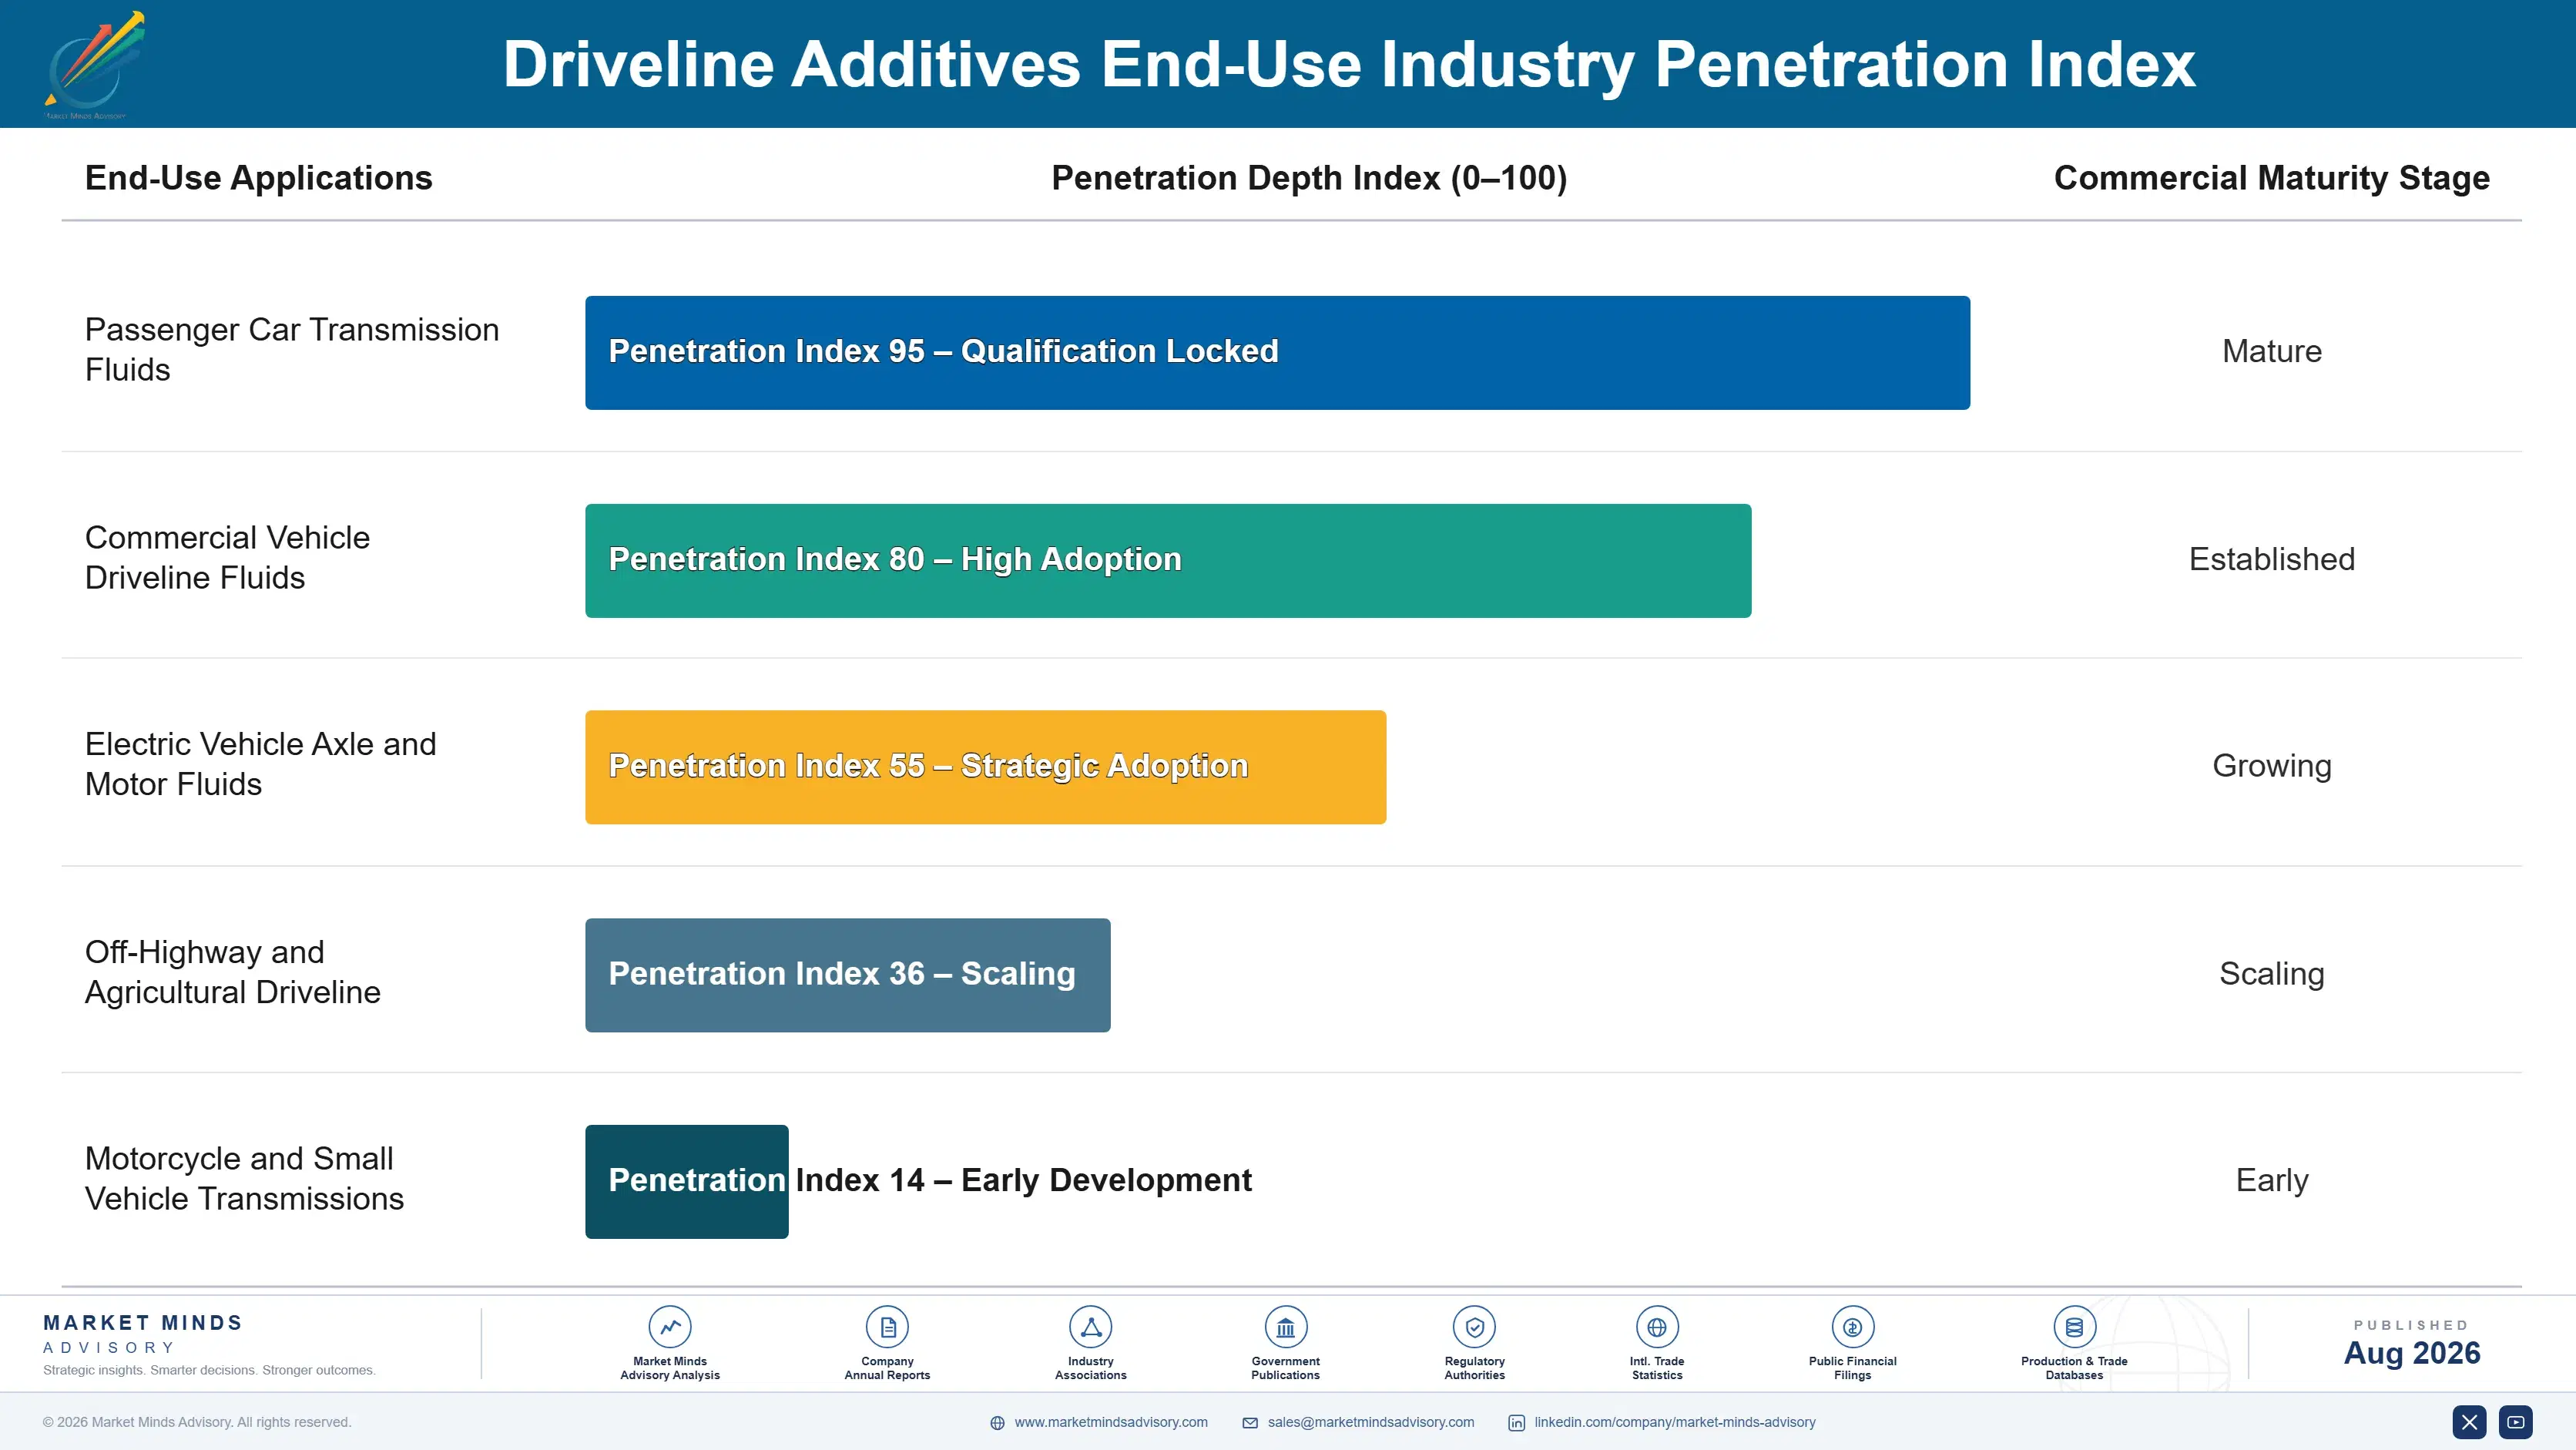
The annuity here is exceptional and runs through the vehicle rather than the customer. A factory fill award determines what a dealer network stocks and what the service manual specifies for a decade or more, so winning the fill at assembly captures service volume that arrives automatically for years afterwards. Factory fill itself takes 34% of volume at thin margin, and the service business behind it earns several times more per litre. Losing an award therefore removes revenue that will not appear for years.
Adoption depth varies sharply by channel. Vehicle manufacturers specify to approval and change reluctantly given the qualification burden they carry themselves. Dealer networks follow the service manual without discretion. Independent workshops in developed markets increasingly specify approved fluids under warranty pressure, while those in emerging markets buy on price against a claim. Fleet operators sit between the two, weighing warranty against cost.

The buyer has shifted toward manufacturer powertrain engineering rather than lubricant purchasing. Those engineers evaluate hardware test data and specification compliance, never price. A supplier whose package has not been through the relevant hardware programme is not in the conversation at all, and no commercial relationship substitutes for it.
driveline-additives-market-trends-end-use-penetration-index-1787549290305

Where the Money Sits

These are among the four positions where our research anticipates prominent divergence between winners and laggards over the coming forecast period. Each is grounded in the demand model, the regulatory perimeter, and the announced capacity pipeline.
01 / APPROVAL PORTFOLIO PLANNING

Design one test programme to clear several specifications

Qualification costs several million dollars per specification across two to four years, and suppliers formulating toward a single manufacturer requirement pay that cost over and over again. Designing packages deliberately to satisfy multiple specifications from one hardware programme cuts qualification cost 30 to 45% for each approval obtained. It requires accepting formulation compromises a single-target package would avoid, and the arithmetic favours breadth in almost every case a supplier will realistically encounter, which surprisingly few of them plan for properly.
02 / FACTORY FILL PRICING DISCIPLINE

Bid the annuity, not the fill contract in front of you

The fluid filled at vehicle assembly sets what dealer networks stock and service manuals specify for a decade or more, and service fill earns several times factory fill margin on every litre. Total lifetime value of an award typically runs 4 to 7 times the factory fill revenue that appears in the contract itself. The hard part is holding that pricing internally when the fill contract looks unprofitable in isolation, which finance functions reliably resist without a clear model behind it.
03 / ELECTRIFIED CAPABILITY WINDOW

Build electric fluid chemistry while positions remain genuinely open

Electric axle fluids require electrical insulation, copper compatibility, and thermal conductivity that conventional sulphur-phosphorus chemistry actively works against, which means sixty years of accumulated formulation advantage transfers remarkably poorly into this particular segment. That has reopened competitive positions that appeared permanently settled, and the window narrows steadily as specifications firm up and early approvals begin to accumulate. The segment supplies 9% of value and grows at 14.6%, and entry requires new component chemistry and test capability rather than any manufacturing capacity at all.
04 / REGIONAL LICENSING STRATEGY

License approvals into markets you will never serve directly

Service fill demand across India, Southeast Asia, Latin America, and Africa reaches blenders who cannot fund approval testing and will otherwise sell unapproved fluid into markets where service standards are visibly tightening. Licensing generates 3 to 6% royalty on blender revenue at essentially no incremental cost once the approval exists. Ceding the direct customer relationship matters little in territories where direct supply would never have paid for the freight, let alone the technical organisation needed to support it properly on the ground.

Engagement Snapshot From the Field

A live engagement with an industry participant carrying material or product regulatory and market exposure ahead of a defining policy shift, showing how our research translates into a defensible multi-year portfolio strategy.
MARKET MINDS ADVISORY · CLIENT ENGAGEMENT SUMMARY
Driveline Additives Producer Strategic Portfolio Review and Transition Roadmap 2026·Investment Scenario on Driveline Additives Exposure Evaluation 2025-26
CLIENT PROFILE
A regional additive supplier producing driveline packages for independent blenders across Asia and the Middle East, with revenue near USD 128 million (client-reported, unverified by MMA). The business held two current manufacturer approvals, competed largely on price in unapproved aftermarket packages, and had no electrified driveline formulation capability at all. Warranty enforcement was tightening regionally.
STRATEGIC CHALLENGE
Independent workshops in the client's core markets were beginning to specify approved fluids as warranty terms tightened, which threatened the unapproved volume that made up most of the business. Electrified vehicle penetration was rising in two markets, and the client had nothing to offer. Approval testing appeared unaffordable at the client's scale.
MMA APPROACH
MMA sized approved versus unapproved service fill demand by market and vehicle age, modelled approval programme cost against multi-specification formulation strategies, and assessed licensing economics for territories the client served indirectly. Forty-seven expert interviews with blenders, workshop operators, and manufacturer engineers established how specification enforcement was actually tightening. Enforcement patterns proved decisive.
KEY FINDINGS
  1. Unapproved package volume was forecast to decline across three of the client's five markets within four years as warranty enforcement and workshop accreditation both tightened considerably.
  2. A single hardware programme designed against three related specifications would cost roughly forty percent less per approval than pursuing each separately, bringing it within the client's funding capacity.
  3. Electrified driveline formulation required component chemistry and testing rather than manufacturing investment, making it unusually accessible to a supplier of the client's size and balance sheet.
  4. Two blenders in markets the client supplied indirectly were willing to license approved formulations, generating royalty income the business had never previously considered pursuing at all.
CLIENT PROFILE
A regional additive supplier producing driveline packages for independent blenders across Asia and the Middle East, with revenue near USD 128 million (client-reported, unverified by MMA). The business held two current manufacturer approvals, competed largely on price in unapproved aftermarket packages, and had no electrified driveline formulation capability at all. Warranty enforcement was tightening regionally.
STRATEGIC CHALLENGE
Independent workshops in the client's core markets were beginning to specify approved fluids as warranty terms tightened, which threatened the unapproved volume that made up most of the business. Electrified vehicle penetration was rising in two markets, and the client had nothing to offer. Approval testing appeared unaffordable at the client's scale.
MMA APPROACH
MMA sized approved versus unapproved service fill demand by market and vehicle age, modelled approval programme cost against multi-specification formulation strategies, and assessed licensing economics for territories the client served indirectly. Forty-seven expert interviews with blenders, workshop operators, and manufacturer engineers established how specification enforcement was actually tightening. Enforcement patterns proved decisive.
KEY FINDINGS
  1. Unapproved package volume was forecast to decline across three of the client's five markets within four years as warranty enforcement and workshop accreditation both tightened considerably.
  2. A single hardware programme designed against three related specifications would cost roughly forty percent less per approval than pursuing each separately, bringing it within the client's funding capacity.
  3. Electrified driveline formulation required component chemistry and testing rather than manufacturing investment, making it unusually accessible to a supplier of the client's size and balance sheet.
  4. Two blenders in markets the client supplied indirectly were willing to license approved formulations, generating royalty income the business had never previously considered pursuing at all.
RECOMMENDED STRATEGY
Phase 1: Phase one: commit to a single multi-specification approval programme, designing the formulation from the outset against three related manufacturer requirements rather than one. Phase 2: Phase two: build electrified driveline formulation capability while positions remain open, prioritising electrical resistivity and copper compatibility over conventional wear performance. Phase 3: Phase three: license approved formulations to blenders in territories the business supplies indirectly, converting unserved demand into royalty income at no incremental cost.
OUTCOME
The client secured two of three targeted approvals within thirty-one months at the projected cost saving. Approved package revenue rose from 18% to 41% of the total across three years, an electrified formulation reached blender trials, and blended gross margin improved 7.1 percentage points (client-reported, unverified by MMA).

Frequently Asked Questions

Foundational context covering the market sizes, CAGR, scope, country, region and competition that inform every finding below. This section is provided to cover basics and most often pre-purchase conversations, answered from the MMA Primary Research Dataset.

What is the current size of the Driveline Additives Market?

The market was valued at USD 3.6 billion in 2025, rising to an estimated USD 3.77 billion in 2026. East Asia holds the largest regional share at 30% of global value.

How large will the Driveline Additives Market be by 2036?

MMA forecasts USD 6.03 billion by 2036 under the base case, an expansion multiple of 1.60 times the 2026 value. That represents USD 2.26 billion of incremental value across the forecast period.

What is the CAGR for the Driveline Additives Market 2026 to 2036?

The base case CAGR is 4.8%, with a bull case of 6.0% and a bear case of 3.6%. The spread reflects uncertainty over electrification pace and transmission drain interval extension.

Which segment is growing fastest?

Electrical property modifiers for electrified driveline grow fastest at 14.6%, roughly 3.04 times the market rate. Friction modifiers follow at 6.4% on shift quality and efficiency requirements.

Who are the major companies in the Driveline Additives Market?

Lubrizol, Infineum, Chevron Oronite, Afton Chemical, and BASF lead on driveline additive supply. The top five hold roughly 78% of global value, among the highest concentrations anywhere.

Which country is growing fastest?

India grows fastest at 7.8%, driven by vehicle parc expansion and faster than expected adoption of automatic transmissions in passenger cars. Service fill demand will keep growing for decades.

Report Segmentation Architecture

The full report scope spans multiple orthogonal segmentation dimensions, with cross-tabulated demand data provided for each dimension pair. Coverage extends further to regional breakdowns, trend trajectories, and the competitive detail needed to support segment-level decision-making.

By Additive Function

  • Extreme Pressure and Anti-Wear Additives
  • Friction Modifiers
  • Dispersants and Detergents
  • Viscosity Index Improvers
  • Corrosion and Oxidation Inhibitors
  • Electrical Property Modifiers for Electrified Driveline

By End-Use Industry

  • Passenger Car Transmission Fluids
  • Commercial Vehicle Driveline Fluids
  • Electric Vehicle Axle and Motor Fluids
  • Off-Highway and Agricultural Driveline
  • Motorcycle and Small Vehicle Transmissions

By Sales Model

  • Factory Fill Package Supply
  • Dealer Service Fill Supply
  • Independent Blender Direct Supply
  • Formulation Licensing to Regional Blenders
  • Unapproved Aftermarket Package Supply

By Region

  • North America
  • Western Europe
  • East Asia
  • South Asia and Pacific
  • Latin America
  • Middle East and Africa
  • Eastern Europe

Scope, Methodology, and Coverage

Every figure in this report is reproducible from documented input assumptions. The scope below maps the historical period, the forecast horizon, the segmentation dimensions, and the countries covered, alongside the underlying primary and qualitative methodology.
Historical Period
2020 to 2025
Forecast Period
2026 to 2036
Base Year
2025 (USD billions; MMA Primary Research Dataset, August 2026)
Market Definition
The market comprises additive components and formulated packages for driveline lubricants, covering extreme pressure and anti-wear additives, friction modifiers, dispersants and detergents, viscosity index improvers, corrosion and oxidation inhibitors, and electrical property modifiers for electrified driveline applications. Value is measured at additive supplier level across automatic and manual transmission fluids, gear and axle oils, continuously variable and dual-clutch transmission fluids, and electric driveline fluids. Engine oil additives, hydraulic and industrial gear oil additives, base oils, finished lubricants sold to end users, greases, and coolants fall outside scope.
Quantitative Units
USD billions (current prices); thousand tonnes of additive package supplied annually; USD per tonne by function and approval status
Segmentation Dimensions
By Additive Function; By End-Use Industry; By Sales Model; By Region
Regions Covered
North America, Western Europe, East Asia, South Asia and Pacific, Latin America, Middle East and Africa, Eastern Europe
Countries Covered
United States, Canada, Mexico, Germany, France, United Kingdom, Italy, Spain, Sweden, Belgium, Czechia, Slovakia, Hungary, Poland, Romania, China, Japan, South Korea, India, Thailand, Indonesia, Australia, Brazil, Argentina, Mexico, Saudi Arabia, United Arab Emirates, Turkey, South Africa
Key Companies Profiled
Lubrizol, Infineum, Chevron Oronite, Afton Chemical, BASF, Evonik Industries, Croda International, Vanderbilt Chemicals, Dover Chemical, King Industries, NYCO, Italmatch Chemicals, Adeka Corporation, Sanyo Chemical Industries, Wuxi South Petroleum Additive, Jinzhou Kangtai Lubricant Additives, Lanxess, Tianhe Chemicals, Idemitsu Kosan, Sinopec Lubricant
Quantitative Methodology
Primary survey, n=3,800 respondents, Q4 2025, six countries; demand-side model with trade association cross-validation
Qualitative Methodology
47 expert interviews, Q4 2025; applied to validate demand model assumptions, identify emerging dynamics, and assess competitive positioning
Report Format
PDF and XLSX data workbook (Word format preview document)
Publisher
Market Minds Advisory
Report Code
MMA-2026-CHM-217
Published
August 2026
Contact
sales@marketmindsadvisory.com | www.marketmindsadvisory.com

Purchase the full Driveline Additives Market Report (2026 to 2036).

The full report sizes driveline additive demand across six functional families, five end-use categories, and seven regions with 2026 to 2036 forecasts under base, bull, and bear cases. It separates factory fill volume from the service fill annuity that follows each award, since the two carry entirely different margins. Competitive profiles cover twenty suppliers assessed consistently on driveline additive supply, approval portfolio, and electrified formulation capability. Cost analysis traces base oil and performance component exposure alongside approval testing amortisation. Commercial guidance addresses approval portfolio planning, factory fill pricing, electrified capability, and regional licensing.
Six additive functions sized separately by region
Factory fill separated from the service fill annuity
Approval portfolios mapped across twenty suppliers
Electrified driveline requirements contrasted with conventional chemistry
Drain interval extension modelled against service volume
Licensing economics quantified for emerging service fill markets

Built For The People Who Decide

From boardroom strategy to bench-side execution, this report is read cover-to-cover by leaders shaping the next decade of their industry, turning demand scenarios, market dynamics and valuation benchmarks into decisions.
CXOs/ Presidents/ VPs/ Managers
M&A and Corporate Development
Strategy Teams and R&D Heads
Procurement and Product Directors
Regulatory and Compliance Leaders
Investor Relations and Equity Analysts