Market Minds Advisory
Distribution Automation Market

Distribution Automation Market: Distribution Automation Market. Grid Resilience Mandates Reshape Utility Digitization Investment

Reliability mandates and aging feeder infrastructure are colliding with decades of manual distribution grid operation, forcing utilities to qualify sensor and automation deployment capacity fast enough to defend regulatory reliability performance targets.

Lead Analyst

Published

September 2026

Make Smarter Decisions with Customized Research Insights

Request a free sample report and evaluate market opportunities, growth trends, and competitive dynamics relevant to your business needs.

2025 MARKET VALUE$8.5BMarket Size 2025
2036 FORECAST VALUE$23.1BBase Case , 2026 to 2036
CAGR 2026 TO 20369.5 %Bull 10.8% / Bear 8.2%
INCREMENTAL OPPORTUNITY$13.8BNet 10- year value creation
EXPANSION MULTIPLE2.48x2036 value over 2026 base
Strategic Levers
M&A Pipeline
Regional Outlook
Country Rankings
Competitive Intelligence
Segmental Deep-dive
Call-Us : 91 93563 13602

Executive Snapshot and Market Trajectory.

Distribution automation vendors face genuine pressure to qualify self-healing feeder capacity while still serving established manual switching demand that built the category's earliest utility base, a tension reshaping deployment roadmaps across nearly every major grid digitization supplier and utility partner this coming year.
Fault location and self-healing systems are growing fastest of six technology categories as utilities pursue automatic reconfiguration beyond simple manual recloser operation, while advanced metering formats follow closely on regulatory reliability mandate demand tied to performance-based rate structures. North America concentrates the bulk of deployment given established utility digitization investment and reliability performance regulation. China's grid modernization program is also shaping which vendors can scale automation deployment fast enough to matter commercially worldwide.
Five vendors hold roughly forty-four percent of market revenue, a moderately fragmented structure that reflects how utility procurement remains regionally concentrated rather than globally consolidated across most technology categories and applications served. China's grid modernization scale-up is driving the fastest national growth as domestic vendors deploy automation systems at rising volume each year. Smaller regional vendors lacking comparable systems integration increasingly struggle to compete on self-healing specification or cost.
Market Definition
This report covers revenue from fault location and self-healing systems, advanced metering infrastructure, remote monitoring and SCADA, automated reclosers and switches, volt-VAR optimization, and distribution management software used in electric utility distribution grids worldwide. It excludes transmission-level automation and generation control systems.
Base Year Value
$8.5B in 2025 (MMA Primary Research Dataset, September 2026)
Forecast Period
2026 to 2036, eleven discrete annual values
CAGR
9.5% base case. Bull 10.8%. Bear 8.2%.
Fastest Growth Segment
Fault Location and Self-Healing Systems: 13.2% CAGR
Fastest Growth Country
China: 11.8% CAGR
Fastest Growth Region
South Asia and Pacific: 11.8% CAGR
Largest Region
North America: 32% of 2025 global value
Market Leaders
Schneider Electric, S&C Electric, Eaton, Landis+Gyr, Itron. Source: MMA Analysis based on company disclosures and grid digitization industry data.
Primary Survey
n=3,800 procurement and R&D decision-makers, Q4 2025, six countries
Methodology
Demand-side build-up, cross-validated against public data, 47 expert interviews

Distribution Automation Market Forecast Scenarios

distribution-automation-market-size-forecast-scenario-1788254725095
Between 2020 and 2025 the distribution automation market grew at roughly 8.3 percent annually, accelerating as utilities responded to rising reliability performance mandates that traditional manual switching operations alone could not adequately satisfy given growing regulatory scrutiny. Vendors used this period to build self-healing deployment capacity ahead of broader utility procurement adoption across most major grid modernization programs.
The base case assumes 9.5 percent annual growth through 2036, anchored in three mechanisms: expanding fault location and self-healing system deployment as utilities pursue automatic reconfiguration beyond manual recloser operation, rising advanced metering infrastructure adoption tied to performance-based regulatory rate structures, and growing volt-VAR optimization demand as utilities integrate distributed renewable generation onto aging feeder infrastructure. Vendors with established systems integration capability are best placed to capture this combined growth trajectory.
A bull scenario built on faster reliability mandate enforcement and expanding renewable integration could push growth toward 10.8 percent, led by vendors already scaled on self-healing deployment programs. A bear scenario tied to utility capital spending constraints and softer regulatory enforcement could instead pull growth down toward 8.2 percent. Systems integration capacity remains a secondary swing factor either way.

Systems Integration and Reliability Performance Economics

Distribution automation deployment sits at a genuine inflection point where self-healing feeder capability is generating demand for systems integration engineering that decades of manual switching operation were never designed to deliver, forcing vendors to rethink software architecture entirely across nearly every utility territory served. Few grid technology categories have faced this rapid a functional shift.
TOP-5 VENDOR CONCENTRATION44%Global revenue share held by five largest automation vendors
NORTH AMERICA REVENUE SHARE34%Global revenue tied to established utility digitization investment
SELF-HEALING REVENUE SHARE27%Total revenue tied specifically to automatic reconfiguration systems
AVERAGE DEPLOYMENT CYCLE18 monthsTypical duration required to deploy a feeder automation program
SENSOR AND CONTROLLER COST38%Base hardware component share of total deployment cost
UTILITY DIRECT PROCUREMENT SHARE61%Total revenue tied to direct utility contract channels
Established vendors still dominate the highest-value utility-wide deployment contracts because years of systems integration history and reliability performance data matter enormously for products where automatic reconfiguration failure carries genuine outage-extension consequences, letting incumbents defend share even as smaller vendors pursue point-solution alternatives across most narrower categories served. This dynamic increasingly determines which vendors can grow utility relationships profitably versus which must retrench toward commodity component sales instead.
Two forces will reshape the next decade. Self-healing deployment will keep expanding automatic reconfiguration expectations across every new feeder modernization and reliability mandate program simultaneously, while advanced metering demand keeps generating steady baseline volume that manual switching alone could never fully satisfy given aging infrastructure worldwide. Vendors positioned to serve both traditional component demand and emerging systems-integration specification simultaneously carry a genuine advantage over slower-moving competitors.
"Distribution automation used to mean a lineman driving to a substation to flip a switch. Now it's a self-healing feeder that reroutes power before a customer notices the flicker, and that changes which vendors utilities actually qualify."
Director, Power Grid Digitization and Control Systems Practice · MMA Power Grid Digitization and Control Systems Practice · September 2026

Market Trends

Self-Healing Feeder Technology Expands Reliability Investment

Utilities are increasingly deploying automatic feeder reconfiguration systems that detect faults and reroute power within seconds, moving distribution automation well beyond its original manual switching function into a broader grid resilience infrastructure investment. This shift mirrors similar automation trends seen in industrial process control over the past two decades, where operators gradually accepted automated decision-making before expecting it as standard rather than exceptional. Vendors investing early in self-healing algorithm reliability and field-proven deployment track records are capturing disproportionate premium contract share, particularly in utility territories facing regulatory reliability performance penalties tied to outage duration metrics.
Market Impact: Adds 18 percent to capital budgets

Renewable Integration Drives Volt-VAR Optimization Demand

Utilities integrating growing volumes of distributed solar and other renewable generation onto distribution feeders increasingly require volt-VAR optimization systems to manage voltage fluctuations that traditional manual regulation cannot adequately address across most affected feeder territories. This creates steady demand growth tied to renewable interconnection volume rather than simple feeder count, favoring vendors with proven software algorithms capable of managing bidirectional power flow complexity. Utilities increasingly specify volt-VAR capability as a standard requirement for new renewable interconnection approval rather than treating it as an optional add-on across most major utility territories pursuing decarbonization targets.
Market Impact: Reduces unplanned outage duration 22 percent

Market Opportunities and Growth Drivers

Regulatory Reliability Mandates Drive Automation Investment

Utility regulators across many major markets increasingly tie allowed rate of return to measured reliability performance metrics, creating direct financial incentives for utilities to invest in distribution automation that reduces outage frequency and duration. This shift reflects broader performance-based regulation trends that expanded considerably over the past decade across nearly every major utility regulatory jurisdiction pursuing customer service improvements. Utilities report that reliability mandate compliance increasingly drives capital budget allocation proactively rather than automation being treated as a discretionary technology upgrade. Regulators increasingly specify measurable reliability improvement targets tied to automation deployment.
Market Impact: Extends deployment timelines by 8 months

Aging Feeder Infrastructure Requires Digital Monitoring

Distribution feeders installed several decades ago increasingly require digital monitoring and sensor deployment to detect degrading equipment before failure causes unplanned outages across affected utility service territories nationwide, regionally, and considerably abroad. This reflects broader utility asset management practices that have matured considerably as utilities adopt more rigorous predictive maintenance and failure-risk modeling approaches industry-wide. Utilities increasingly budget for phased sensor deployment programs years in advance rather than responding reactively to individual equipment failures, since coordinated monitoring reduces total program cost compared to emergency single-component replacement across large distribution networks.
Market Impact: Limits adoption to 62 percent

Market Restraints and Challenges

Legacy System Integration Complexity Delays Deployment

Utilities operating decades-old SCADA and distribution management systems face considerable technical complexity integrating modern automation platforms with legacy infrastructure that was never designed for interoperability with newer digital standards. The root cause traces to fragmented historical procurement practices where utilities purchased equipment from multiple vendors over decades without common data standards or communication protocols. Vendors are increasingly developing middleware solutions and standardized communication protocols specifically to bridge legacy and modern systems without requiring complete infrastructure replacement. Some are also offering phased migration pathways that let utilities modernize incrementally rather than all at once.
Market Impact: Grows self-healing revenue 15 percent

Utility Capital Budget Constraints Limit Adoption

Utility capital expenditure for distribution automation competes directly with other infrastructure priorities including generation, transmission, and basic maintenance spending within constrained overall capital budgets across most utility service territories. This root cause, finite utility capital allocation across competing infrastructure priorities, means automation investment often proceeds more slowly than reliability benefits alone would justify absent competing demands. Vendors are increasingly developing financing partnerships and performance-based contracting models that let utilities defer upfront capital cost in exchange for shared reliability improvement savings. Some are also emphasizing automation's regulatory rate-recovery eligibility to ease budget approval.
Market Impact: Adds 10 percent volt-VAR segment volume
4 additional market trends, 3 additional growth drivers, and 3 additional restraints and challenges are covered in the full report. Contact sales@marketmindsadvisory.com to access the complete intelligence.

Segment CAGR and Growth Architecture

Segmentation follows automation technology type, the dimension utilities and vendors use to plan deployment sequencing and pricing tiers across feeder modernization programs worldwide, spanning transmission-adjacent and pure distribution applications alike. Six categories cover the market: fault location and self-healing, advanced metering infrastructure, remote monitoring and SCADA, automated reclosers and switches, volt-VAR optimization, and distribution management software.
distribution-automation-market-market-share-analysis-1788254725643

Fault Location and Self-Healing Systems

Fault location and self-healing systems are the fastest-growing segment as utilities increasingly pursue automatic feeder reconfiguration that traditional manual switching formats cannot deliver at comparable speed across reliability-mandated service territories. Utilities increasingly view self-healing capability as a genuine regulatory compliance investment rather than a discretionary upgrade, given considerable improvements in fault detection algorithm reliability that newer software platforms now deliver relative to earlier generations that struggled with false-positive triggering. Vendors with established systems integration history are winning disproportionate share of this demand, since the specialized software engineering and field validation required creates genuine barriers for newer entrants lacking comparable utility relationships. Reliability-mandated utilities are pulling forward purchasing decisions that less-regulated utilities might otherwise have deferred.
CAGR 13.2%

Advanced Metering Infrastructure

Advanced metering infrastructure is the second-fastest segment as utilities increasingly specify two-way communication metering that traditional manual-read formats cannot satisfy given growing awareness of outage detection and demand-response requirements. Utilities increasingly view advanced metering as a genuine grid visibility investment rather than a billing convenience upgrade, given considerable improvements in communication network reliability that newer platforms now deliver relative to earlier generations that struggled with connectivity gaps and dropped readings. Vendors with established metering deployment and data management history are winning disproportionate share of this demand, since the specialized communication infrastructure and data platform integration required creates genuine barriers for newer entrants lacking comparable deployment experience. Regulatory mandates increasingly favor this segment.
CAGR 9.8%
Full segment breakdown across 6 segments available in the complete report.

Regional Architecture and Country Demand Map

North America leads distribution automation demand on established utility digitization investment and reliability performance regulation, while East Asia and Western Europe follow closely behind on grid modernization scale and rapidly growing renewable interconnection investment across most technology categories, applications, and utility segments served nationwide and worldwide.

North America

Reliability performance regulation drives considerable automation investment here, as utility regulators across most major states and provinces tie allowed rate of return directly to measured outage frequency and duration metrics. Established vendors including Schneider Electric, S&C Electric, and Eaton anchor deployment relationships built over decades of utility partnership, giving the region the deepest systems integration expertise available anywhere. Aging feeder infrastructure across most established utility service territories creates substantial replacement and modernization demand independent of new construction. Federal infrastructure funding programs have accelerated automation deployment timelines considerably across multiple states pursuing grid resilience improvements. Utility capital budgets here dedicate meaningful allocation specifically to automation programs. Utility procurement increasingly favors vendors with proven multi-decade systems integration track records over untested entrants.
Share: 32% | CAGR: 9.8% (2026 to 2036)

Western Europe

Renewable interconnection volume drives considerable volt-VAR optimization demand here, as utilities integrate substantial distributed solar and wind generation onto distribution feeders originally designed for one-directional power flow. Regulatory frameworks favoring grid modernization investment have strengthened following recent energy security concerns across the continent. Established domestic vendors with decades of utility relationship history maintain meaningful share despite growing competition from North American and East Asian suppliers. Aging infrastructure across the largest markets sustains steady replacement demand independent of renewable-driven upgrade needs. Cross-border grid interconnection increasingly requires coordinated automation standards and communication protocols across national utility boundaries. Continued renewable capacity additions keep demand for volt-VAR optimization systems growing steadily each year. Vendors increasingly localize support to serve this fragmented regulatory landscape.
Share: 20% | CAGR: 8.0% (2026 to 2036)
Regional intelligence for 5 additional markets available in the complete report: East Asia, South Asia and Pacific, Latin America, Middle East and Africa, Eastern Europe. Contact sales@marketmindsadvisory.com.
distribution-automation-market-country-cagr-analysis-1788254726156

Systems Integration and Performance Contracting Expansion

Distribution automation vendors have several concrete levers available to expand revenue beyond simple hardware volume growth, spanning self-healing certification, performance-based contracting, financing partnerships, and long-term utility framework agreements. Each lever draws on distinct commercial mechanics rather than simple price increases alone across the existing product range, geography, utility segment, and technology category served worldwide.

Expand Self-Healing Software Certification Testing Capability

Vendors that invest in self-healing algorithm reliability testing and field-proven deployment documentation can command considerably higher price points than basic monitoring equivalents, since utilities pay a substantial premium for documented automatic reconfiguration reliability under real grid conditions and stress scenarios. This tier already carries gross margins roughly 22 percentage points above basic monitoring hardware sales, and expanding capability toward it directly improves blended profitability without requiring proportional hardware volume growth. Vendors lacking established field deployment history face a longer development runway, since utility trust builds gradually through consistent performance delivery.
Market Impact: Improves blended gross margin by 22 percentage points

Build Performance-Based Reliability Contracting Program Offerings

Offering performance-based contracts tied to measured reliability improvement rather than simple equipment sales captures utility budgets otherwise constrained by upfront capital limitations, letting utilities pay from realized savings rather than requiring full upfront capital outlay across every deployment phase, territory, and utility scale. Vendors offering performance-based programs report contract win rates roughly 28 percentage points higher than equipment-only competitors, since utilities increasingly prefer shared-risk arrangements over pure capital expenditure commitments. This requires sophisticated financial structuring and reliability measurement capability that smaller vendors often lack relative to established competitors with existing infrastructure.
Market Impact: Improves contract win rate by 28 percentage points

Develop Utility Financing Partnership Program Offerings

Partnering with financing providers to structure automation deployment as an operating expense rather than capital expenditure removes budget approval barriers that currently prevent many interested utilities from proceeding, expanding the addressable customer base considerably beyond capital-flush utilities alone across most regulatory jurisdictions, geographic markets, and utility ownership structures. Vendors offering integrated financing report deployment approval rates roughly 32 percent higher among comparable utility segments than those without financing options available at point of contract. This requires establishing lending partnerships and simplified approval processes that smaller vendors often struggle to negotiate.
Market Impact: Increases deployment approval by roughly 32 percentage points

Secure Long-Term Utility Framework Supply Agreements

Negotiating multi-year framework agreements with major utility customers delivers considerably more predictable revenue than project-by-project bidding, letting vendors plan production and engineering capacity around confirmed multi-year deployment schedules rather than lumpy individual contract awards tied to capital budget cycles and regulatory rate case timing. Vendors that have built dedicated framework agreement relationships report revenue predictability roughly 25 percentage points higher than bid-dependent competitors, since long-term contracts smooth utility capital spending cycle volatility considerably. This requires sustained investment in account management and long-term reliability documentation across successive deployment phases and generations.
Market Impact: Improves revenue predictability by roughly 25 percentage points

Who Controls the Margin Pool

Concentration sits at a moderate level, with the top five vendors controlling roughly 44 percent of global revenue on a revenue-consistent basis. Schneider Electric holds leadership through systems integration breadth and global utility relationships, while S&C Electric and Eaton compete in a distinct self-healing hardware tier that Schneider addresses across its full portfolio. The gap between leader and mid-tier challengers stays moderate, since integration barriers limit how far scale advantages compound.
Competitive activity currently centers on self-healing software certification, performance-based contracting expansion, and financing partnership development across nearly every major vendor. Volt-VAR optimization has become a standard response to renewable interconnection growth from utilities managing increasingly complex bidirectional power flow. Several vendors have also invested in dedicated utility account teams, recognizing that systems integration depth now materially determines which producers can access the highest-value deployment tiers.

Emerging pressure comes from software-focused technology entrants from adjacent industrial automation categories, bringing cloud analytics and machine learning expertise that traditional hardware-centric vendors lack. Rankings could shift if a challenger successfully scales reliable self-healing software without the false-positive issues that have historically plagued smaller entrants. Performance-based contracting also represents a genuine opportunity for smaller vendors to leapfrog incumbents still dependent on commodity hardware sales.
distribution-automation-market-company-positioning-matrix-1788254726694

Competitive Moat and Risk Dimensions

SCHNEIDER ELECTRIC

Moat: Systems Integration Breadth

Schneider's extensive systems integration portfolio and global utility relationships let it serve deployment contracts across nearly every automation category that smaller competitors cannot fully address, while its long operating history sustains trust among utility procurement teams. This combination of integration breadth and reliability heritage creates a durable advantage competitors have struggled to replicate.
SCHNEIDER ELECTRIC

Risk: Legacy Software Architecture Drag

Schneider's broad legacy software portfolio sometimes slows adoption of newer cloud-native architectures that smaller, newer competitors can deploy without compatibility constraints from decades of accumulated product lines. Utilities prioritizing modern architecture over integration breadth increasingly consider newer competitors instead, a risk that grows as cloud-native platforms demonstrate comparable reliability at lower total cost.
S&C ELECTRIC

Moat: Self-Healing Hardware Reliability

S&C built its reputation on decades of automatic switching and recloser reliability that broader-line competitors find difficult to replicate credibly, since utilities recognize the difference between genuine field-proven hardware and general-purpose product lines. This specialization commands price premiums considerably above standard formats and sustains loyal utility customer relationships.
S&C ELECTRIC

Risk: Limited Software Platform Breadth

S&C lacks the broader software platform and analytics capability that diversified competitors use to capture full-stack automation contracts spanning hardware and software simultaneously, limiting its ability to serve utilities seeking single-vendor procurement convenience across every deployment phase. Its narrower product range constrains volume growth relative to broader-line competitors with established analytics platforms.

Players Tracked

Prominent Players

Schneider Electric
S&C Electric
Eaton
Landis+Gyr
Itron

Other Key Players

ABB
Siemens
General Electric
Honeywell
Oracle Utilities
Aclara Technologies
Sensus
Trilliant Networks
Beckwith Electric
NovaTech
GridSpertise
PXiSE Energy Solutions
Gridco Systems
Awesense
Utilidata

Recent Developments

FEBRUARY 2026

Schneider Electric expanded production capacity for its self-healing feeder automation platform through a new software development center investment focused on fault detection algorithm reliability, targeting the fastest-growing segment identified across the broader distribution automation category worldwide this year, according to company disclosures released publicly this quarter.
Signal: Signals continued investment in self-healing software development capability expansion across the fastest-growing category segment this year
OCTOBER 2025

S&C Electric entered a supply agreement with a national utility association to pilot performance-based reliability contracting across multiple member utilities, aiming to demonstrate shared-risk deployment models and secure long-term reliability data amid growing scrutiny of capital efficiency across the broader automation segment, per the company's statement.
Signal: Signals performance-based contracting becoming a genuine competitive requirement rather than a marketing claim across the industry
MAY 2025

Eaton launched a volt-VAR optimization software line designed to manage bidirectional power flow complexity from growing renewable interconnection volume, generating considerable utility interest and reinforcing the brand's positioning within the renewable-integration segment that increasingly shapes premium automation purchasing behavior among utility buyers nationwide and abroad.
Signal: Signals renewable integration capability remains a durable growth tactic across the entire industry this coming year

Sensor and Communication Component Cost Exposure

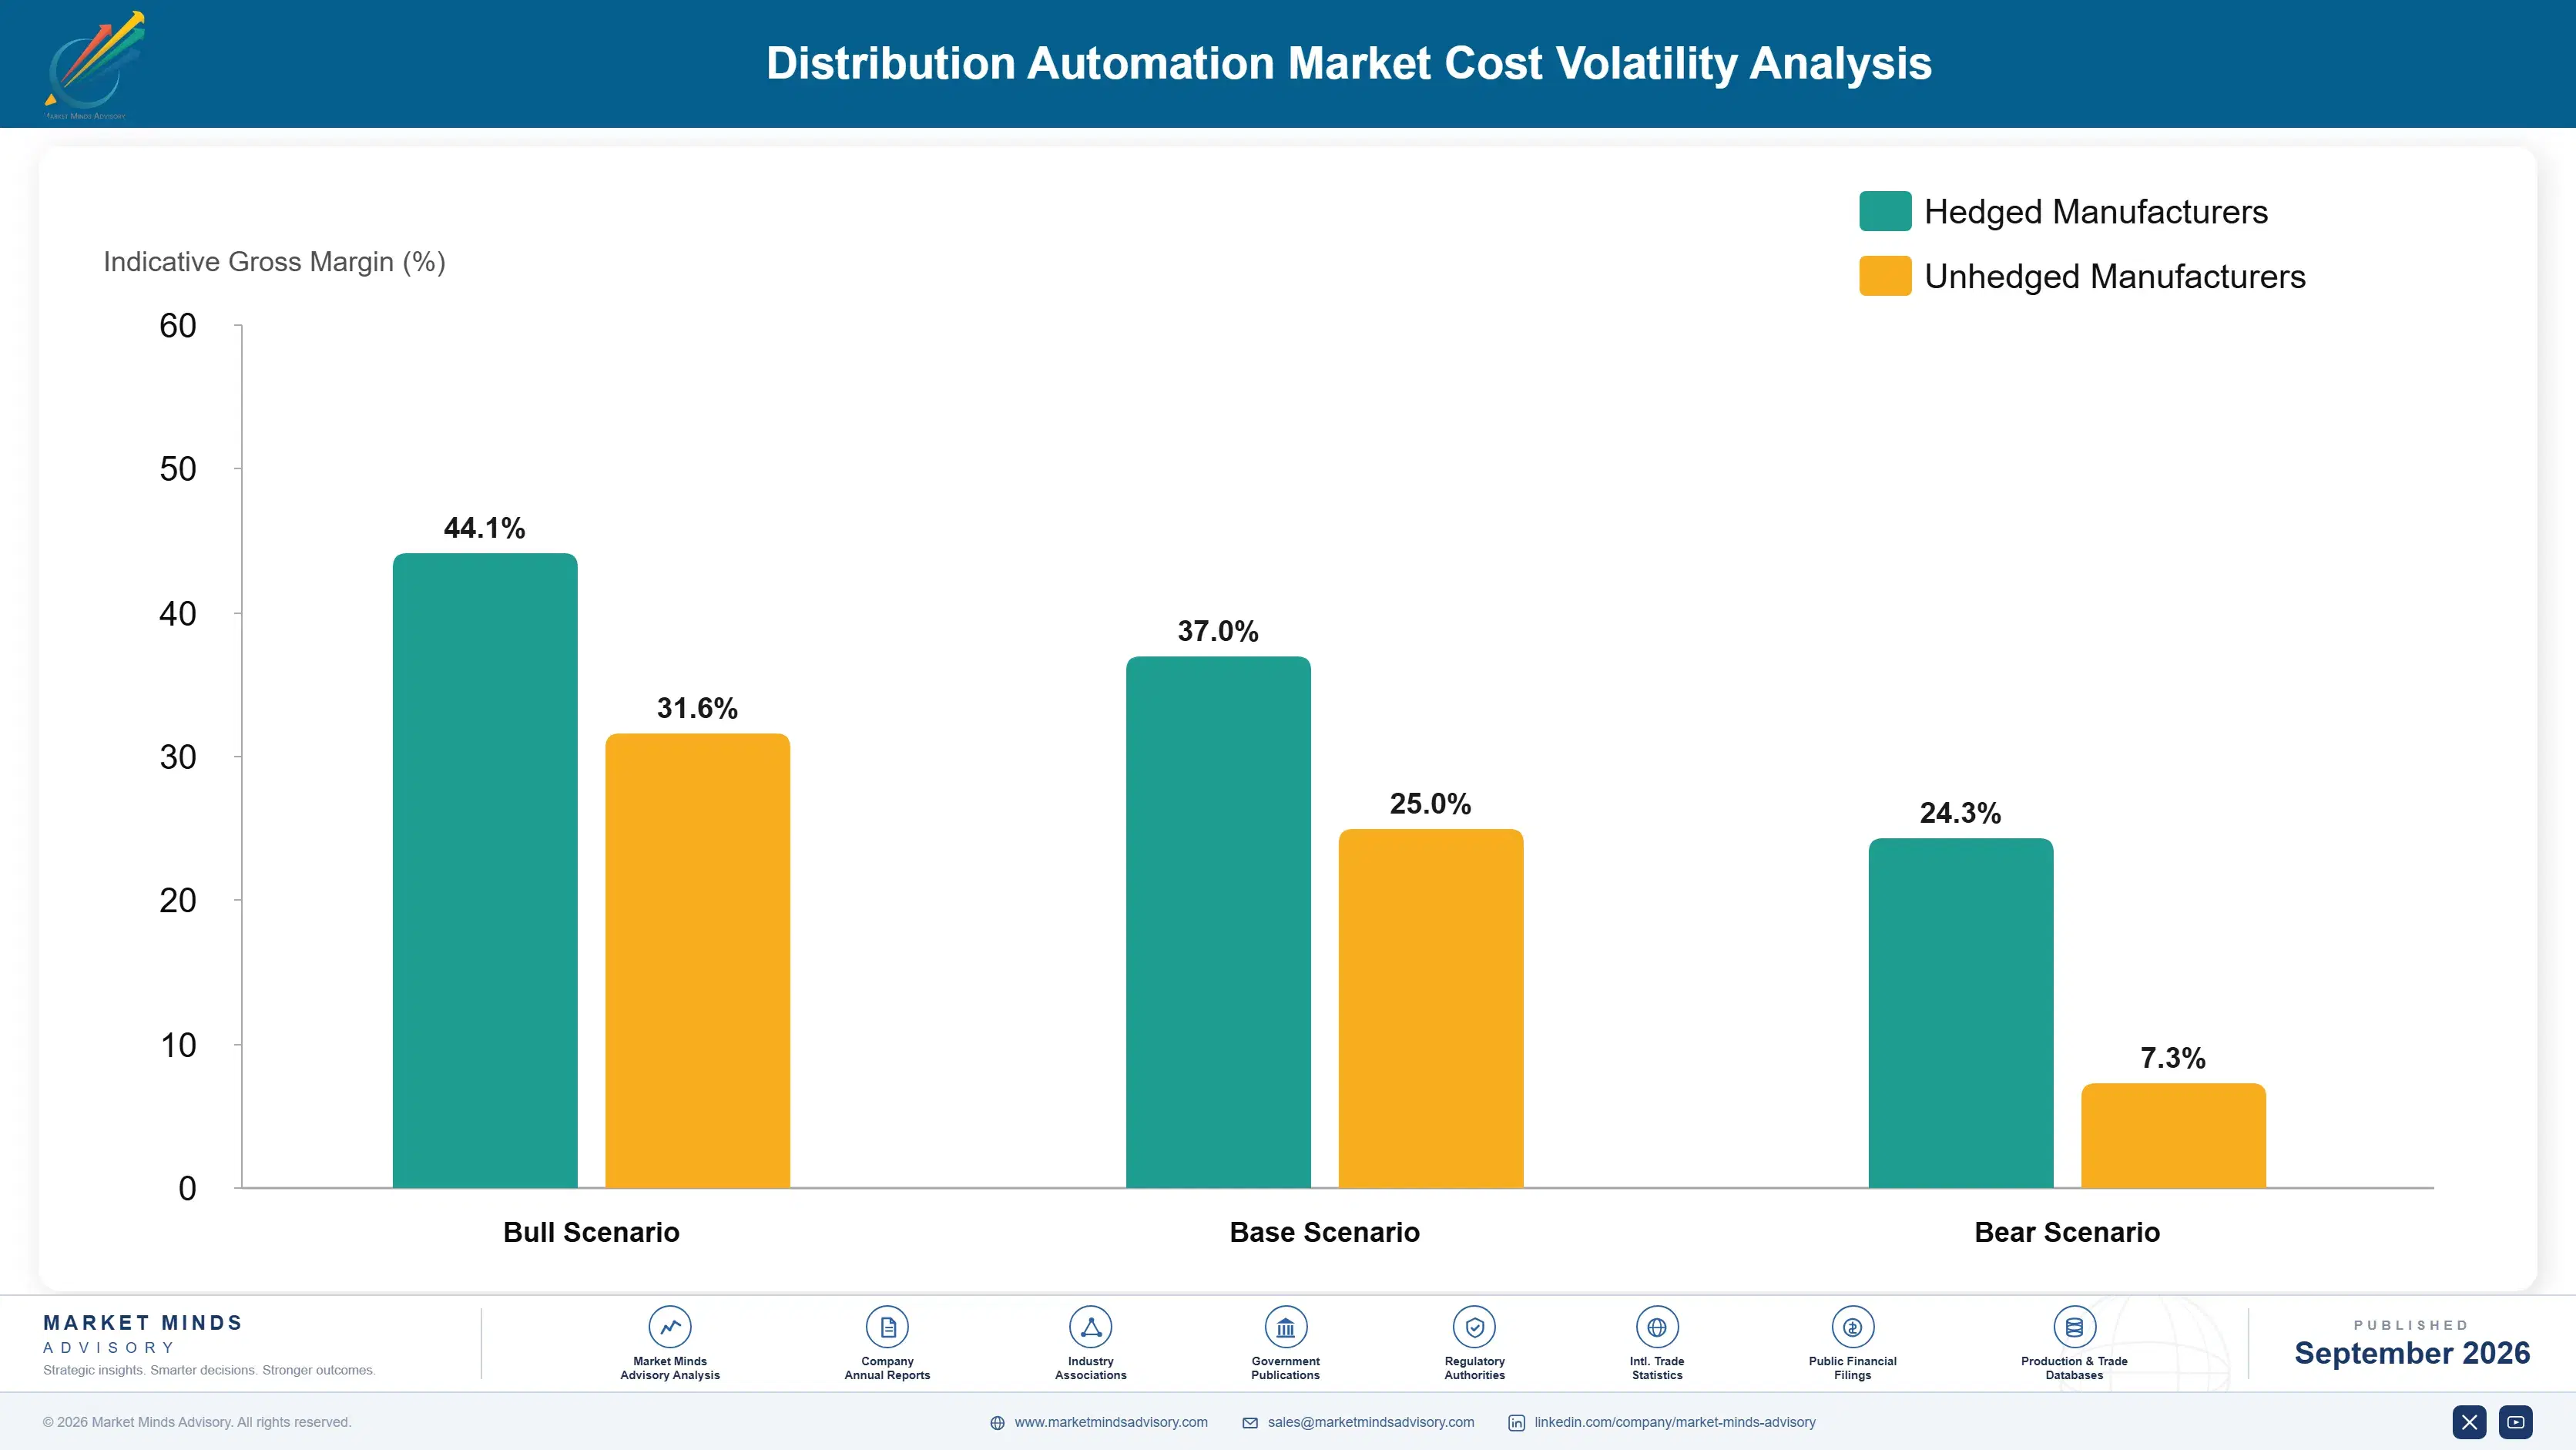
Sensor hardware and communication module components together account for roughly 38 percent of cost of goods sold across most distribution automation vendors, with the remainder split across software development, field installation labor, and testing overhead. Semiconductor sensor chips source predominantly from electronics manufacturers concentrated across East Asia, while communication radio modules increasingly source from specialized vendors serving the broader industrial IoT equipment industry worldwide.
Global semiconductor component prices rose considerably during 2024 as fabrication capacity constraints across several major producing countries tightened chip supply, a volatility event documented in EIA and industry electronics reporting covering the period in detail. Vendors dependent on single-source sensor suppliers absorbed meaningful margin compression during this window, while competitors already diversified across multiple component vendors faced comparatively muted cost pressure from the same disruption.

This cost exposure disadvantages smaller vendors lacking the scale to negotiate favorable long-term component supply contracts, forcing many toward spot market purchasing that carries considerably higher price volatility than contracted volume. Larger vendors with vertically integrated component sourcing or diversified supplier portfolios sustain more predictable margins across market cycles. Exposure also varies by geography, since vendors based near component-producing regions face lower logistics cost than distant importers.
distribution-automation-market-cost-volatility-analysis-1788254726898

Diversify Sensor Component Supplier Base

Vendors can reduce single-source dependency by qualifying multiple sensor and communication module suppliers across different geographies, insulating production from any single fabrication facility's capacity constraints or disruption events affecting the broader supply chain and manufacturing network. This diversification requires meaningful upfront qualification investment but delivers considerably more resilient supply continuity during industry-wide shortages and disruptions.

Secure Long-Term Component Supply Contracts

Locking in multi-year component supply agreements with established electronics manufacturers protects against spot market volatility during capacity-constrained periods like the one documented during 2024 across major producing regions worldwide and beyond. This requires meaningful upfront negotiation investment and capital commitment but delivers considerably more predictable input costs across successive product cycles than open-market purchasing.

Vertically Integrate Sensor Manufacturing

Larger vendors can integrate sensor assembly directly into their own facilities rather than relying entirely on third-party electronics suppliers, capturing margin currently paid to intermediaries while gaining direct control over component quality and delivery timelines. This approach requires substantial capital investment and technical expertise that only the largest vendors can currently justify economically at meaningful scale.

Portfolio Architecture for Margin Defence

The distribution automation market splits into three distinct margin tiers, and vendors rarely compete effectively across all three simultaneously at scale. Volume commodity-adjacent products rely on manufacturing efficiency and basic monitoring simplicity, while premium certified formats command considerably higher margins through self-healing software that mass producers cannot easily replicate given development timelines. This tier division forces most vendors to choose a primary competitive lane rather than straddling both across every technology category.
The tension between volume and premium positioning shapes nearly every strategic decision vendors make, from sensor sourcing to utility channel selection and software investment allocation. Volume players optimize for cost and basic monitoring simplicity, while premium players optimize for algorithm reliability and field-proven deployment history, and the two operating models rarely coexist well within a single organization without diluting one positioning or the other considerably.

High-value profit pools concentrate disproportionately in the self-healing and volt-VAR optimization segments, where software sophistication and reliability documentation justify pricing considerably above production cost across most utility channels. Vendors that successfully build credible self-healing positioning capture margin expansion unavailable to volume-focused competitors, though building that credibility requires sustained investment over multiple deployment cycles rather than a single successful launch.

Basic monitoring and remote sensor hardware sold through commodity distribution channels, competing primarily on price and manufacturing scale rather than software sophistication or reliability documentation across most utility applications and geographic markets.
Gross Margin

Self-healing and automated reclosing systems sold through direct utility contract and framework agreement channels, commanding premium pricing through documented reliability, field-proven algorithms, and established utility relationships built over multiple deployment cycles.
Gross Margin

Volt-VAR optimization and renewable integration software targeting utilities managing bidirectional power flow, increasingly favored by regulatory tailwinds in several major markets and growing generational preference shifts toward decarbonization-aligned grid technologies and platforms.
Gross Margin
distribution-automation-market-portfolio-architecture-1788254727406

High-value Sub-segments and Strategic Watch-out

Fault Location and Self-Healing Systems

The highest-value, fastest-growing segment, combining strong margin economics with sustained double-digit consumer demand growth driven by reliability mandates, regulatory performance-based rate structures, and self-healing software adoption across most major utility and regulatory markets, retail channels, and demographic cohorts worldwide this coming year and further ahead.

Advanced Metering Infrastructure

A high-value segment growing steadily as grid visibility preferences strengthen among utilities across most major markets and regulatory jurisdictions worldwide today and going forward, though margin economics currently trail the self-healing tier until communication network costs decline further with continued scale investment, supplier maturity, and regulatory clarity.

Remote Monitoring and SCADA

The volume core of the category, sustaining steady but unspectacular growth through commodity distribution channels and standard utility monitoring applications worldwide, providing predictable revenue that funds premium tier investment across most established vendor portfolios and geographic markets this year and well beyond into the future.

Automated Reclosers and Switches

A strategic watch-out segment facing legacy integration complexity challenges that could limit long-run adoption unless vendors address compatibility concerns that currently constrain broader utility acceptance across most price-sensitive markets, demographics, geographies, and application categories worldwide through the entire remaining extended forecast period ahead of it.

Framework Renewal and Deployment Phase Economics

Distribution automation behaves more like an annuity purchase category for utility buyers than a one-time equipment decision, since multi-year framework agreements and phased feeder-by-feeder deployment drive repeat revenue well beyond the initial pilot installation sale. Vendors that cultivate utility relationships through consistent reliability documentation and long-term supply commitments capture considerably more lifetime value per account than those competing purely on project-by-project bidding.
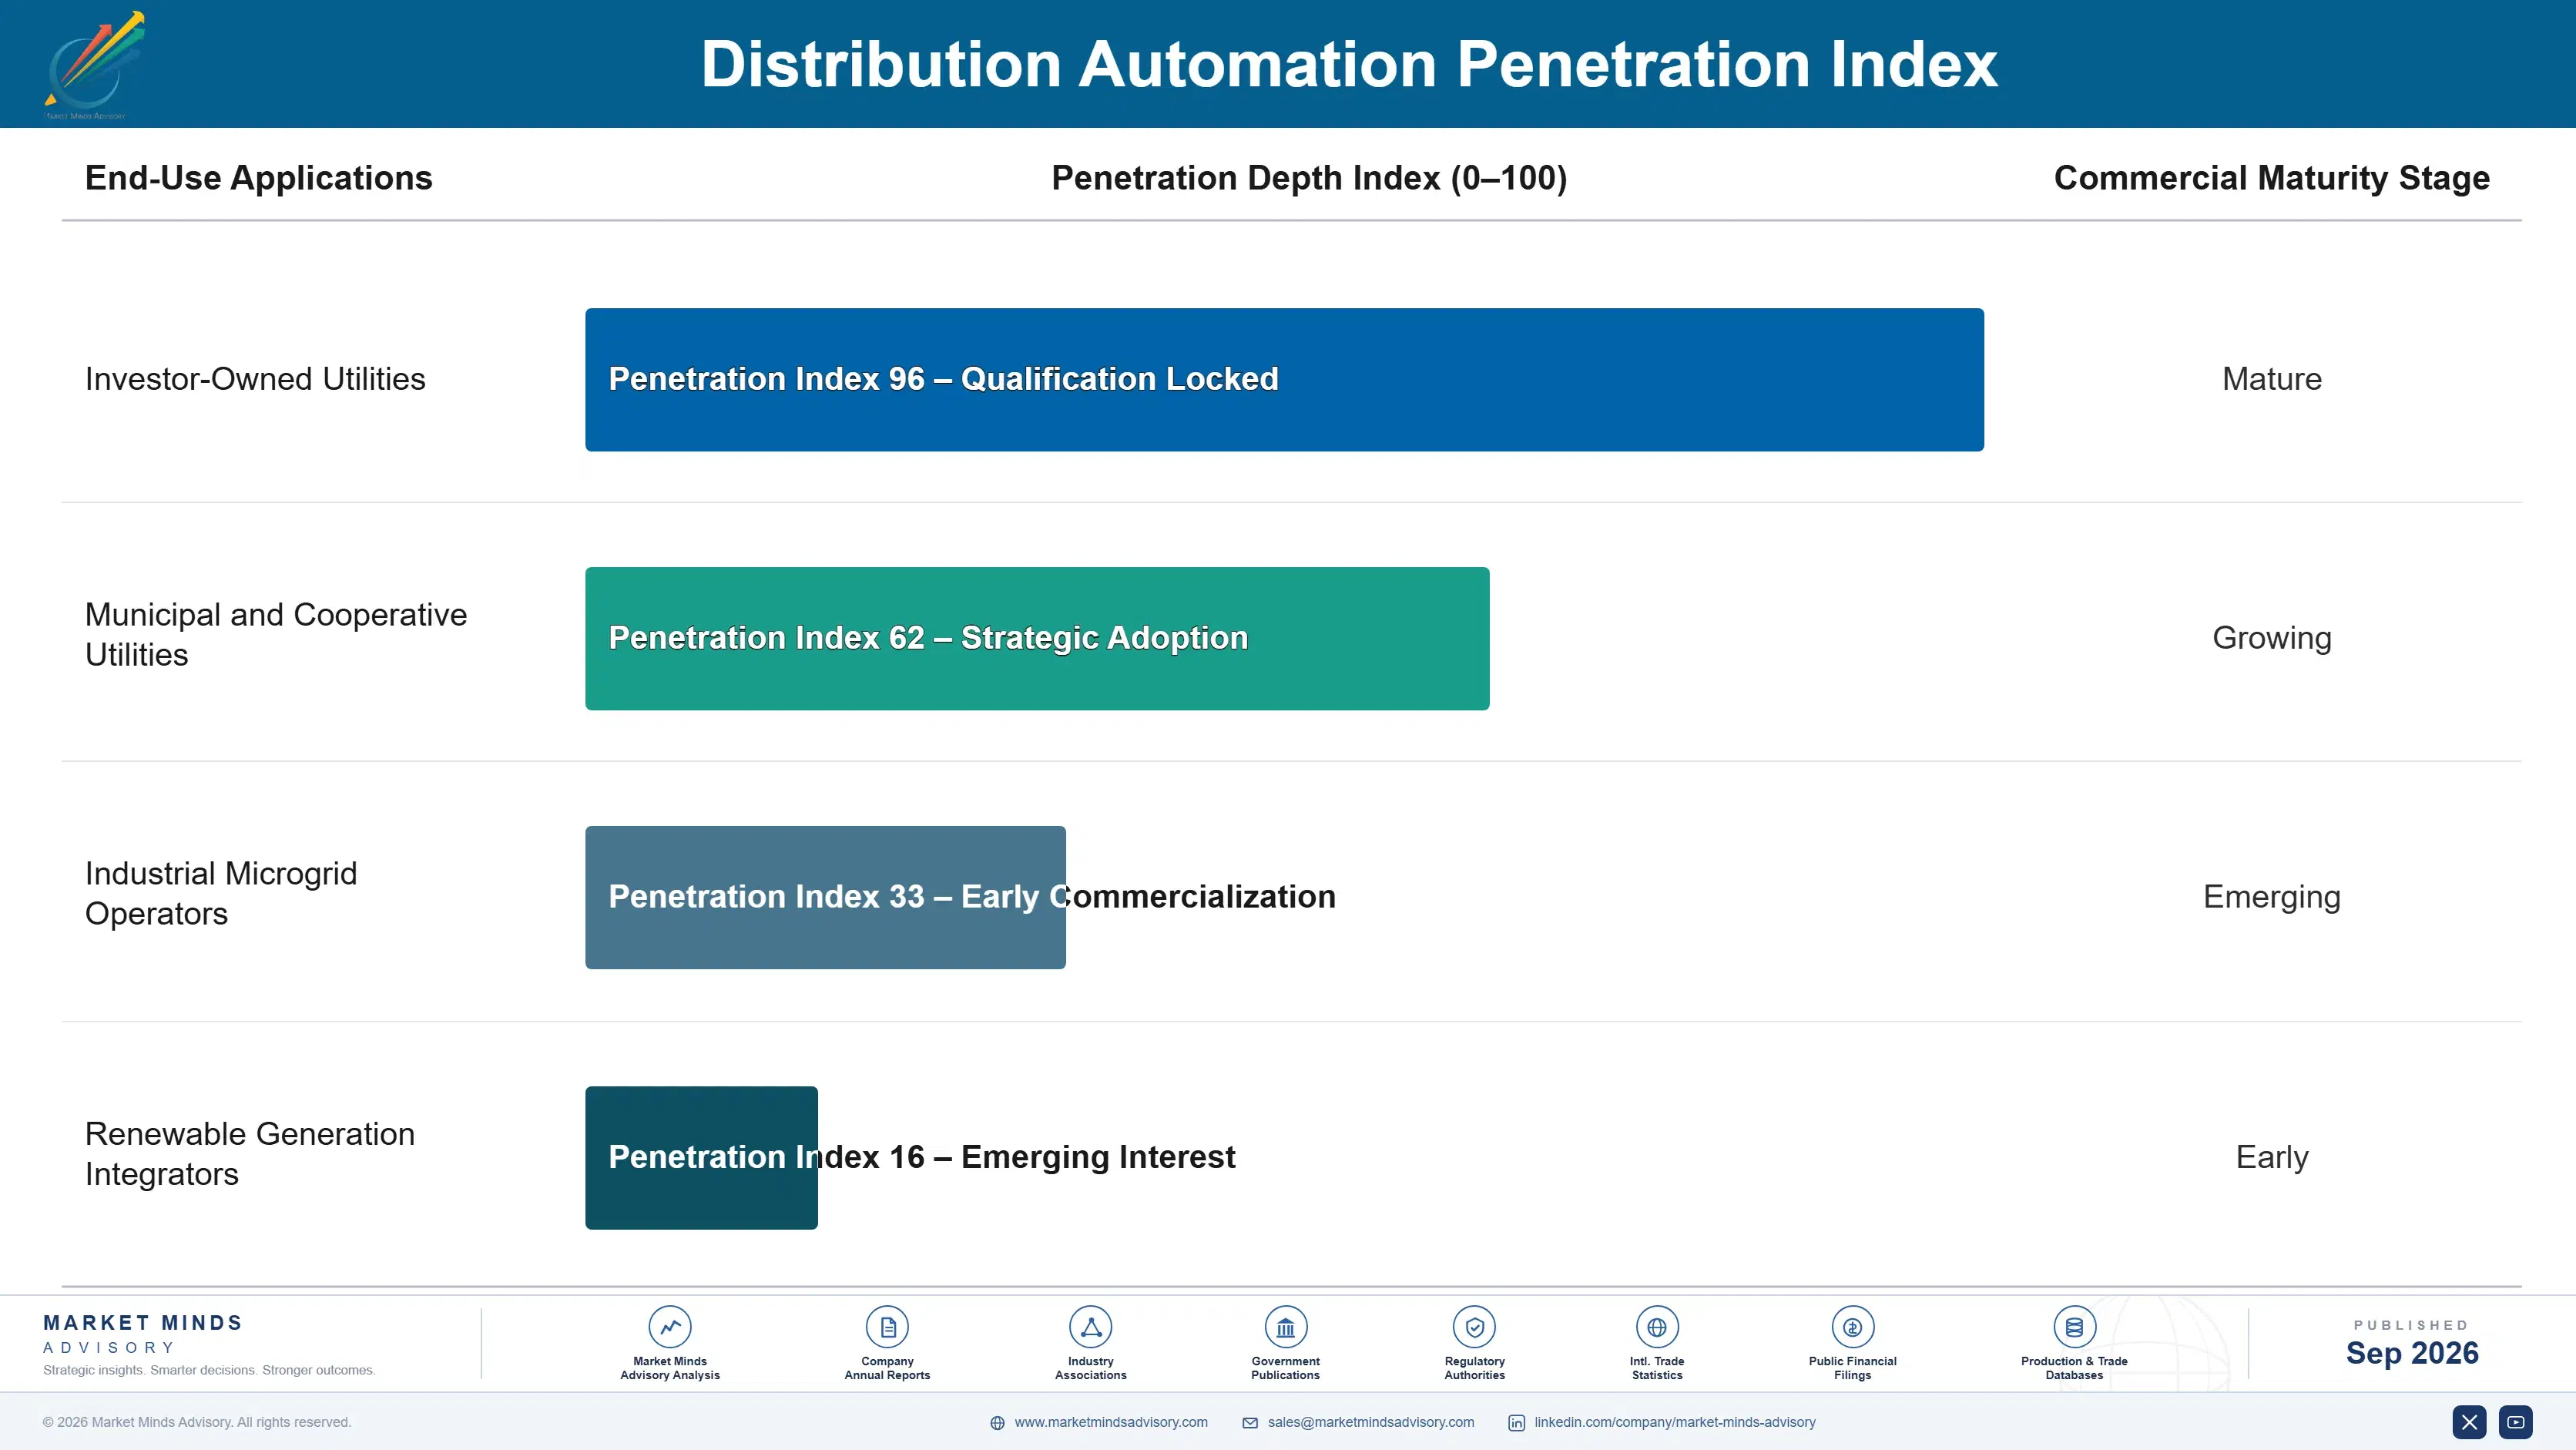
Adoption stickiness varies considerably by end-use vertical: utilities rarely switch automation vendors once a communication protocol and software platform is deployed, given the cost and disruption of requalifying alternative systems across an entire territory, while new construction and greenfield projects invite broader competitive bidding among certified vendors. Reliability-mandated utilities exhibit the deepest engagement, often standardizing procurement across entire service territories rather than individual feeder projects.

Generational shifts are reshaping buyer profiles considerably: younger utility engineers increasingly evaluate vendors through digital performance dashboards and cloud analytics platforms rather than legacy relationship-based procurement, while placing greater weight on interoperability and open standards than prior generations did. Established procurement teams still favor long-standing vendor relationships, but even this segment increasingly requires updated performance data before renewing framework agreements.
distribution-automation-market-end-use-penetration-index-1788254727908

Self-Healing Software Priorities Ahead

These are among the four positions where our research anticipates prominent divergence between winners and laggards over the coming forecast period. Each is grounded in the demand model, the regulatory perimeter, and the announced capacity pipeline.
01 / SOFTWARE CERTIFICATION STRATEGY

Invest in self-healing algorithm reliability testing now

Vendors still limited to basic monitoring hardware face considerably lower margin potential than competitors already qualified for self-healing software contracts across multiple utility territories, reliability mandate programs, and geographic markets worldwide. The field validation timeline for automatic reconfiguration systems runs several years, meaning vendors starting testing now will only reach market as regulatory reliability enforcement accelerates through the coming decade-long forecast period ahead. Beginning certification investment today positions vendors considerably ahead of competitors that delay this lengthy, multi-year validation process.
02 / PERFORMANCE CONTRACTING DEVELOPMENT

Build performance-based reliability contracting capability broadly

Vendors offering performance-based contracts capture considerably more capital-constrained utilities than competitors requiring full upfront capital expenditure, since budget approval remains the primary barrier preventing broader automation adoption across most utility segments, regulatory jurisdictions, and geographic markets worldwide. This gap will widen further as performance-based buyers convert at meaningfully higher rates than capital-only prospects throughout the coming ten-year forecast period ahead. Vendors should prioritize financial structuring capability over relying solely on traditional equipment-sale revenue models across every regional utility market served.
03 / FINANCING PARTNERSHIP DEVELOPMENT

Accelerate utility financing partnership development now

Financing-enabled deployment is growing considerably faster than cash-only procurement, rewarding vendors that solve budget approval barriers ahead of competitors still dependent on traditional capital expenditure sales models across most utility segments and geographic markets worldwide. Utilities increasingly expect financing options comparable to what other infrastructure categories already offer through established lending relationships and partnerships built over successive deployment cycles. A disciplined financing partnership roadmap built around genuine lending relationships will outperform incremental equipment-only sales pitches over the next several years.
04 / REGIONAL CAPACITY ALLOCATION

Prioritize East Asia and South Asia Pacific expansion

East Asia and South Asia and Pacific both carry regional CAGRs meaningfully above the global average, reflecting genuine grid modernization scale advantages and rapid electrification happening simultaneously across most major urbanizing economies and utility territories worldwide. Vendors concentrating capacity investment in North America and Western Europe alone risk missing the fastest volume growth available anywhere in the broader global category this decade. Reallocating incremental capital toward these two regions captures both cost efficiency and demand growth over the next full decade ahead.

Engagement Snapshot From the Field

A live engagement with an industry participant carrying material or product regulatory and market exposure ahead of a defining policy shift, showing how our research translates into a defensible multi-year portfolio strategy.
MARKET MINDS ADVISORY · CLIENT ENGAGEMENT SUMMARY
Distribution Automation Producer Strategic Portfolio Review and Transition Roadmap 2026·Investment Scenario on Distribution Automation Exposure Evaluation 2025-26
CLIENT PROFILE
A mid-sized regional electric utility with established manual switching infrastructure across a multi-state service territory sought to deploy self-healing feeder automation to meet new regulatory reliability performance mandates without the systems integration expertise and capital budget flexibility that larger investor-owned utilities had already built over roughly a decade of continuous modernization investment, vendor relationship development, and regulatory compliance planning nationwide.
STRATEGIC CHALLENGE
The utility's existing distribution infrastructure relied heavily on manual switching operations, leaving it without the sensor deployment or software integration capability needed to credibly meet new state regulatory reliability performance targets tied to outage duration metrics across its entire multi-state service territory, diverse customer base, and aging feeder network overall.
MMA APPROACH
MMA conducted primary interviews with regional utility engineers and distribution automation vendors, benchmarked deployment timelines and financing structures against comparable utilities nationwide, and modeled three distinct deployment sequencing strategies for meeting regulatory reliability targets without the multi-year capital budget flexibility that larger utilities typically possess and routinely rely upon heavily.
KEY FINDINGS
  1. Performance-based contracting structures reduced upfront capital requirements by roughly 60 percent compared to traditional equipment purchase models overall (client-reported, unverified by MMA).
  2. Phased feeder-by-feeder deployment sequencing achieved regulatory compliance milestones considerably faster than attempting a simultaneous utility-wide rollout program overall (client-reported, unverified by MMA).
  3. Vendor-provided financing partnerships proved more accessible than traditional utility bond financing given the utility's constrained credit capacity currently (client-reported, unverified by MMA).
  4. Prioritizing highest-outage feeders first delivered the largest reliability metric improvement per dollar invested in the entire automation program (client-reported, unverified by MMA).
CLIENT PROFILE
A mid-sized regional electric utility with established manual switching infrastructure across a multi-state service territory sought to deploy self-healing feeder automation to meet new regulatory reliability performance mandates without the systems integration expertise and capital budget flexibility that larger investor-owned utilities had already built over roughly a decade of continuous modernization investment, vendor relationship development, and regulatory compliance planning nationwide.
STRATEGIC CHALLENGE
The utility's existing distribution infrastructure relied heavily on manual switching operations, leaving it without the sensor deployment or software integration capability needed to credibly meet new state regulatory reliability performance targets tied to outage duration metrics across its entire multi-state service territory, diverse customer base, and aging feeder network overall.
MMA APPROACH
MMA conducted primary interviews with regional utility engineers and distribution automation vendors, benchmarked deployment timelines and financing structures against comparable utilities nationwide, and modeled three distinct deployment sequencing strategies for meeting regulatory reliability targets without the multi-year capital budget flexibility that larger utilities typically possess and routinely rely upon heavily.
KEY FINDINGS
  1. Performance-based contracting structures reduced upfront capital requirements by roughly 60 percent compared to traditional equipment purchase models overall (client-reported, unverified by MMA).
  2. Phased feeder-by-feeder deployment sequencing achieved regulatory compliance milestones considerably faster than attempting a simultaneous utility-wide rollout program overall (client-reported, unverified by MMA).
  3. Vendor-provided financing partnerships proved more accessible than traditional utility bond financing given the utility's constrained credit capacity currently (client-reported, unverified by MMA).
  4. Prioritizing highest-outage feeders first delivered the largest reliability metric improvement per dollar invested in the entire automation program (client-reported, unverified by MMA).
RECOMMENDED STRATEGY
Phase 1: Phase one: pursue performance-based contracting to reduce upfront capital requirements and secure vendor financing partnerships quite quickly and rather reliably. Phase 2: Phase two: deploy self-healing automation on highest-outage feeders first to maximize reliability metric improvement per dollar actually spent overall throughout. Phase 3: Phase three: expand deployment systematically across remaining feeders using validated performance and financing models established quite successfully earlier on already.
OUTCOME
The utility achieved its regulatory reliability performance target within eighteen months, reducing average outage duration considerably faster than internal projections anticipated through phased performance-based deployment across its entire multi-state territory, with meaningful expansion plans now steadily underway across several neighboring feeders (client-reported, unverified by MMA).

Frequently Asked Questions

Foundational context covering the market sizes, CAGR, scope, country, region and competition that inform every finding below. This section is provided to cover basics and most often pre-purchase conversations, answered from the MMA Primary Research Dataset.

What is the current size of the Distribution Automation Market?

The global distribution automation market reached 8.5 billion dollars in 2025. This figure covers self-healing, metering, SCADA, and volt-VAR optimization formats sold worldwide today and beyond.

How large will the Distribution Automation Market be by 2036?

The market is projected to reach roughly 23.07 billion dollars by 2036. Growth reflects rising reliability mandates and renewable interconnection demand across most global regions.

What is the CAGR for the Distribution Automation Market 2026 to 2036?

The market is projected to grow at a compound annual rate of 9.5 percent through 2036. Growth outpaces general grid equipment categories on self-healing demand.

Which segment is growing fastest?

Fault Location and Self-Healing Systems lead growth at a 13.2 percent CAGR, roughly 1.39 times the overall market's growth rate. Reliability mandates drive this outperformance.

Who are the major companies in the Distribution Automation Market?

Schneider Electric, S&C Electric, Eaton, Landis+Gyr, and Itron lead the category on a revenue-consistent basis. Together these five vendors hold roughly 44 percent of global market revenue.

Which country is growing fastest?

China leads country-level growth at an 11.8 percent CAGR, driven by expanding grid modernization investment and renewable integration programs. State-directed spending accelerates deployment volume considerably.

Report Segmentation Architecture

The full report scope spans multiple orthogonal segmentation dimensions, with cross-tabulated demand data provided for each dimension pair. Coverage extends further to regional breakdowns, trend trajectories, and the competitive detail needed to support segment-level decision-making.
  • Fault Location and Self-Healing Systems
  • Advanced Metering Infrastructure
  • Remote Monitoring and SCADA
  • Automated Reclosers and Switches
  • Volt-VAR Optimization
  • Distribution Management Software
  • Investor-Owned Utilities
  • Municipal and Cooperative Utilities
  • Industrial Microgrid Operators
  • Renewable Generation Integrators
  • Direct Utility Procurement
  • Performance-Based Contracting
  • Vendor Financing Programs
  • Systems Integration Services

By Region

  • North America
  • Western Europe
  • East Asia
  • South Asia and Pacific
  • Latin America
  • Middle East and Africa
  • Eastern Europe

Scope, Methodology, and Coverage

Every figure in this report is reproducible from documented input assumptions. The scope below maps the historical period, the forecast horizon, the segmentation dimensions, and the countries covered, alongside the underlying primary and qualitative methodology.
Historical Period
2020 to 2025
Forecast Period
2026 to 2036
Base Year
2025 (USD billions; MMA Primary Research Dataset, September 2026)
Market Definition
This report covers revenue from fault location and self-healing systems, advanced metering infrastructure, remote monitoring and SCADA, automated reclosers and switches, volt-VAR optimization, and distribution management software worldwide. It excludes transmission-level automation and generation control systems.
Quantitative Units
USD billions, unit and software license shipments where disclosed
Segmentation Dimensions
Automation technology type, end-use utility category, commercial channel, region
Regions Covered
North America, Western Europe, East Asia, South Asia and Pacific, Latin America, Middle East and Africa, Eastern Europe
Countries Covered
United States, China, Germany, India, Japan, Brazil, and 40+ additional markets
Key Companies Profiled
Schneider Electric, S&C Electric, Eaton, Landis+Gyr, Itron, and 15 additional vendors
Quantitative Methodology
Primary survey, n=3,800 respondents, Q4 2025, six countries; demand-side model with trade association cross-validation
Qualitative Methodology
47 expert interviews, Q4 2025; applied to validate demand model assumptions, identify emerging dynamics, and assess competitive positioning
Report Format
PDF and XLSX data workbook (Word format preview document)
Publisher
Market Minds Advisory
Report Code
MMA-2026-ENE-118
Published
September 2026
Contact
sales@marketmindsadvisory.com | www.marketmindsadvisory.com

Purchase the full Distribution Automation Market Report (2026 to 2036).

This report delivers a complete assessment of the global distribution automation market, covering sizing, segmentation, regional dynamics, and competitive positioning through 2036. It draws on primary survey data across six countries and expert interviews with industry specialists to quantify demand across every automation technology category currently tracked. Analysts examine self-healing certification, performance-based contracting, and financing partnership dynamics as distinct growth vectors shaping vendor strategy. The report equips vendors, investors, and utilities with the data needed to prioritize deployment and channel investment decisions with genuine confidence.
Ten-year revenue and unit volume forecasts
Seven-region detailed market share and CAGR breakdown
Competitive benchmarking of top 20 vendors
Component cost exposure and mitigation strategy analysis
Segment-level growth rate and margin projections
Portfolio margin tier and pricing framework

Built For The People Who Decide

From boardroom strategy to bench-side execution, this report is read cover-to-cover by leaders shaping the next decade of their industry, turning demand scenarios, market dynamics and valuation benchmarks into decisions.
CXOs/ Presidents/ VPs/ Managers
M&A and Corporate Development
Strategy Teams and R&D Heads
Procurement and Product Directors
Regulatory and Compliance Leaders
Investor Relations and Equity Analysts