Market Minds Advisory
Distributed Control System Market

Distributed Control System Market: Distributed Control System Market: Installed Base Lock-In, Migration Economics and Greenfield Awards, 2026 to 2036

Around 88% of migrations go back to the incumbent supplier, because the controller was never the barrier. Twenty years of application logic and operator habit is the real barrier instead.

Lead Analyst

Published

September 2026

Make Smarter Decisions with Customized Research Insights

Request a free sample report and evaluate market opportunities, growth trends, and competitive dynamics relevant to your business needs.

2025 MARKET VALUE$21.4BMarket Size 2025
2036 FORECAST VALUE$35.1BBase Case , 2026 to 2036
CAGR 2026 TO 20364.6 %Bull 5.8% / Bear 3.4%
INCREMENTAL OPPORTUNITY$12.7BNet 10- year value creation
EXPANSION MULTIPLE1.57x2036 value over 2026 base
Strategic Levers
M&A Pipeline
Regional Outlook
Country Rankings
Competitive Intelligence
Segmental Deep-dive
Call-Us : 91 93563 13602

Executive Snapshot and Market Trajectory.

This is the most locked-in market in industrial automation, and the lock-in is the product rather than a side effect. Around 88% of migrations are awarded back to the incumbent, because a plant cannot change control system without also changing twenty years of application logic and operator habit.
Virtualisation and edge control platforms grow at 6.9%, half again the market rate of 4.6%, because they shorten the outage a migration requires and outage duration is what decides whether a project happens at all. Advanced control software follows at 6.2%. East Asia holds 32% of system revenue, above the usual band, since greenfield process capacity additions rather than existing plants decide where new installed base goes.
The installed base averages 19 years old and migration already supplies 46% of supplier revenue. Roughly 27% of control logic has no documented purpose, existing only in the memory of engineers who are retiring, which is why migration is priced as risk rather than as equipment replacement. Five suppliers hold 71% of system revenue, and those positions largely reflect greenfield awards made a generation ago rather than anything competed for in the last decade.
Market Definition
This market covers distributed control systems for continuous and batch process industries, including controllers and input output hardware, operator stations and interface systems, engineering and configuration software, virtualisation and edge control platforms, control network and communication hardware, and advanced control and optimisation software. It excludes programmable logic controllers for discrete manufacturing, safety instrumented systems, field instrumentation and analysers, manufacturing execution and historian software, and standalone industrial networking equipment.
Base Year Value
$21.4B in 2025 (MMA Primary Research Dataset, September 2026)
Forecast Period
2026 to 2036, eleven discrete annual values
CAGR
4.6% base case. Bull 5.8%. Bear 3.4%.
Fastest Growth Segment
Virtualisation And Edge Control Platforms: 6.9% CAGR
Fastest Growth Country
India: 8.2% CAGR
Fastest Growth Region
South Asia and Pacific: 6.6% CAGR
Largest Region
East Asia: 32% of 2025 global value
Market Leaders
Honeywell, Emerson, ABB, Yokogawa, and Siemens lead the field. Source: MMA Primary Research Dataset, July 2026.
Primary Survey
n=3,800 procurement and R&D decision-makers, Q4 2025, six countries
Methodology
Demand-side build-up, cross-validated against public data, 47 expert interviews

Distributed Control System Market Forecast Scenarios

distributed-control-system-market-size-forecast-scenario-1790011060451
Between 2020 and 2025 greenfield awards moved decisively eastward while Western demand became almost entirely replacement work. Chemical, refining, and gas processing capacity was added at scale across East Asia and the Gulf, and barely at all in Europe or North America. Historical growth of 3.6% averages a slow replacement market against a considerably faster construction one, and describes neither accurately.
The base case at 4.6% rests on three mechanisms. An installed base averaging 19 years old reaches end of support in volume, and migration already supplies 46% of supplier revenue. Virtualisation shortens the outage a migration requires, which converts deferred projects into approved ones. And greenfield chemical and gas capacity continues being added where feedstock and demand growth are, which is not where the incumbent installed base sits. None depends on open architecture.
The bull case at 5.8% depends on migration projects being approved at the rate the installed base actually requires rather than deferred until failure, which would need outage windows that virtualisation is beginning to provide. The bear case at 3.4% is capital deferral in process industries: these are long-lived assets, a working control system can be nursed for years, and petrochemical margin pressure delays everything discretionary.

Why Nobody Ever Switches

Open control architectures have been discussed for over a decade and changed remarkably little, because the barrier was misidentified from the start. Controllers were never the obstacle. Application logic accumulated over twenty years, alarm rationalisation, operator training, insurance documentation, and regulatory records are the obstacle, and none of that transfers with a hardware standard. None of that transfers with a hardware standard, and it never did.
TOP FIVE CONCENTRATION71%Share of system revenue held by the leading suppliers
INSTALLED SYSTEM AGE19 yearsAverage age of control systems currently running plants
MIGRATION REVENUE SHARE46%Supplier revenue arising from replacing existing installed systems
INCUMBENT RETENTION RATE88%Migrations awarded back to the existing control system supplier
HOT CUTOVER PREMIUM2.4xPrice of migration without shutdown against conventional replacement
UNDOCUMENTED LOGIC SHARE27%Control logic whose original purpose exists only in memory
That is why 88% of migrations return to the incumbent. The supplier who won a greenfield award in the late nineties has collected lifecycle and replacement revenue ever since, and the customer's realistic alternative is not a competitor but deferral. Concentration at 71% across five suppliers is the arithmetic consequence of awards made a generation ago rather than of anything happening now.
The uncomfortable detail sits in the logic itself. Around 27% of control logic has no documented rationale, and the engineers who know why a particular interlock exists are retiring faster than the knowledge is being captured. Migration is therefore priced as a risk transfer rather than an equipment sale, and hot cutover without a shutdown commands roughly 2.4 times conventional replacement pricing.
"Somebody always asks why plants do not switch suppliers when the pricing is so uncomfortable. The honest answer is that the control system is the smallest part of what would have to change. A quarter of the logic is undocumented, the people who wrote it are retiring, and no procurement saving covers restarting that conversation."
Practice Director, Process Automation and Control Systems · MMA Industrial Equipment Practice · September 2026

Market Trends

Outage Duration Rather Than Price Decides Migration

A process plant loses more in a week of lost production than a control system costs, which makes shutdown length the governing variable in any replacement decision. Virtualisation and edge platforms grow at 6.9% because they shorten or remove that outage, and hot cutover approaches command roughly 2.4 times conventional pricing without much argument. Suppliers competing on equipment price are addressing a number that barely features in the approval, while the number that does receives far less engineering attention. Approval turns on a number most supplier organisations barely discuss internally.
Market Impact: Country grows at 8.2%
Retiring Engineers Take Undocumented Logic With Them

Roughly 27% of control logic has no recorded rationale, and the people who know why a particular interlock or override exists are leaving the workforce faster than the knowledge is being captured anywhere. This raises the risk of every migration and pushes work toward suppliers who can reverse engineer existing configurations credibly. It also lengthens projects, since discovery consumes engineering hours nobody scoped, and it is the reason migration is priced as risk transfer. Discovery consumes engineering hours nobody scoped, which is why projects overrun and why customers defer them further. Capture programmes are rare.
Market Impact: Migration supplies 46% of revenue

Market Opportunities and Growth Drivers

Greenfield Process Capacity Decides Future Installed Base

New chemical, refining, and gas processing capacity determines which supplier collects lifecycle revenue for the next quarter century, which makes greenfield awards disproportionately valuable relative to their contract size. Indian growth of 8.2% leads every country covered, driven by refining and petrochemical construction at scale. Gulf gas and petrochemical complexes account for some of the largest individual awards anywhere. None of that capacity is being added where the existing installed base sits. Awards are therefore contested well beyond their contract value, and bid at margins that look irrational in isolation.
Market Impact: Systems run past 19 years

Ageing Installed Base Reaches End Of Support

Control systems currently running plants average 19 years old, and suppliers are withdrawing support for hardware generations that customers have nursed well past any reasonable service life. Migration already supplies 46% of supplier revenue and that share continues rising. The trigger is rarely failure; it is spare part availability, an insurance requirement, or a regulatory expectation that the plant runs on a supported system rather than one held together with harvested components. Spare part availability, an insurance requirement, or a regulatory expectation usually triggers the decision rather than any failure.
Market Impact: Covers 27% of configurations

Market Restraints and Challenges

Capital Deferral Extends Systems Well Past Support

A control system that still runs the plant is difficult to replace on a business case, and the root cause is that nothing forces the decision until support genuinely ends or something fails badly. Commercially this makes demand lumpy and unforecastable, with projects deferred through several budget cycles then approved suddenly. Suppliers respond with phased migration that spreads spending, extended support agreements priced to encourage rather than punish, and virtualisation that shortens the outage. Petrochemical margin pressure delays everything discretionary, and a control system replacement is always discretionary until it is not.
Market Impact: Commands 2.4 times pricing

Migration Risk Concentrates In Poorly Documented Logic

Around 27% of control logic has no recorded purpose, and the root cause is that plants were configured under commissioning pressure by engineers who understood the intent and never wrote it down. Commercially this makes migration scope uncertain, projects overrun, and customers reluctant to start at all. Suppliers respond with automated configuration analysis, parallel running before cutover, and phased approaches that migrate well understood areas first while discovery continues elsewhere. Suppliers who will not price that uncertainty confidently simply decline the work, which narrows the field further. The field narrows accordingly.
Market Impact: Affects 27% of logic
3 additional market trends, 4 additional growth drivers, and 2 additional restraints and challenges are covered in the full report. Contact sales@marketmindsadvisory.com to access the complete intelligence.

Segment CAGR and Growth Architecture

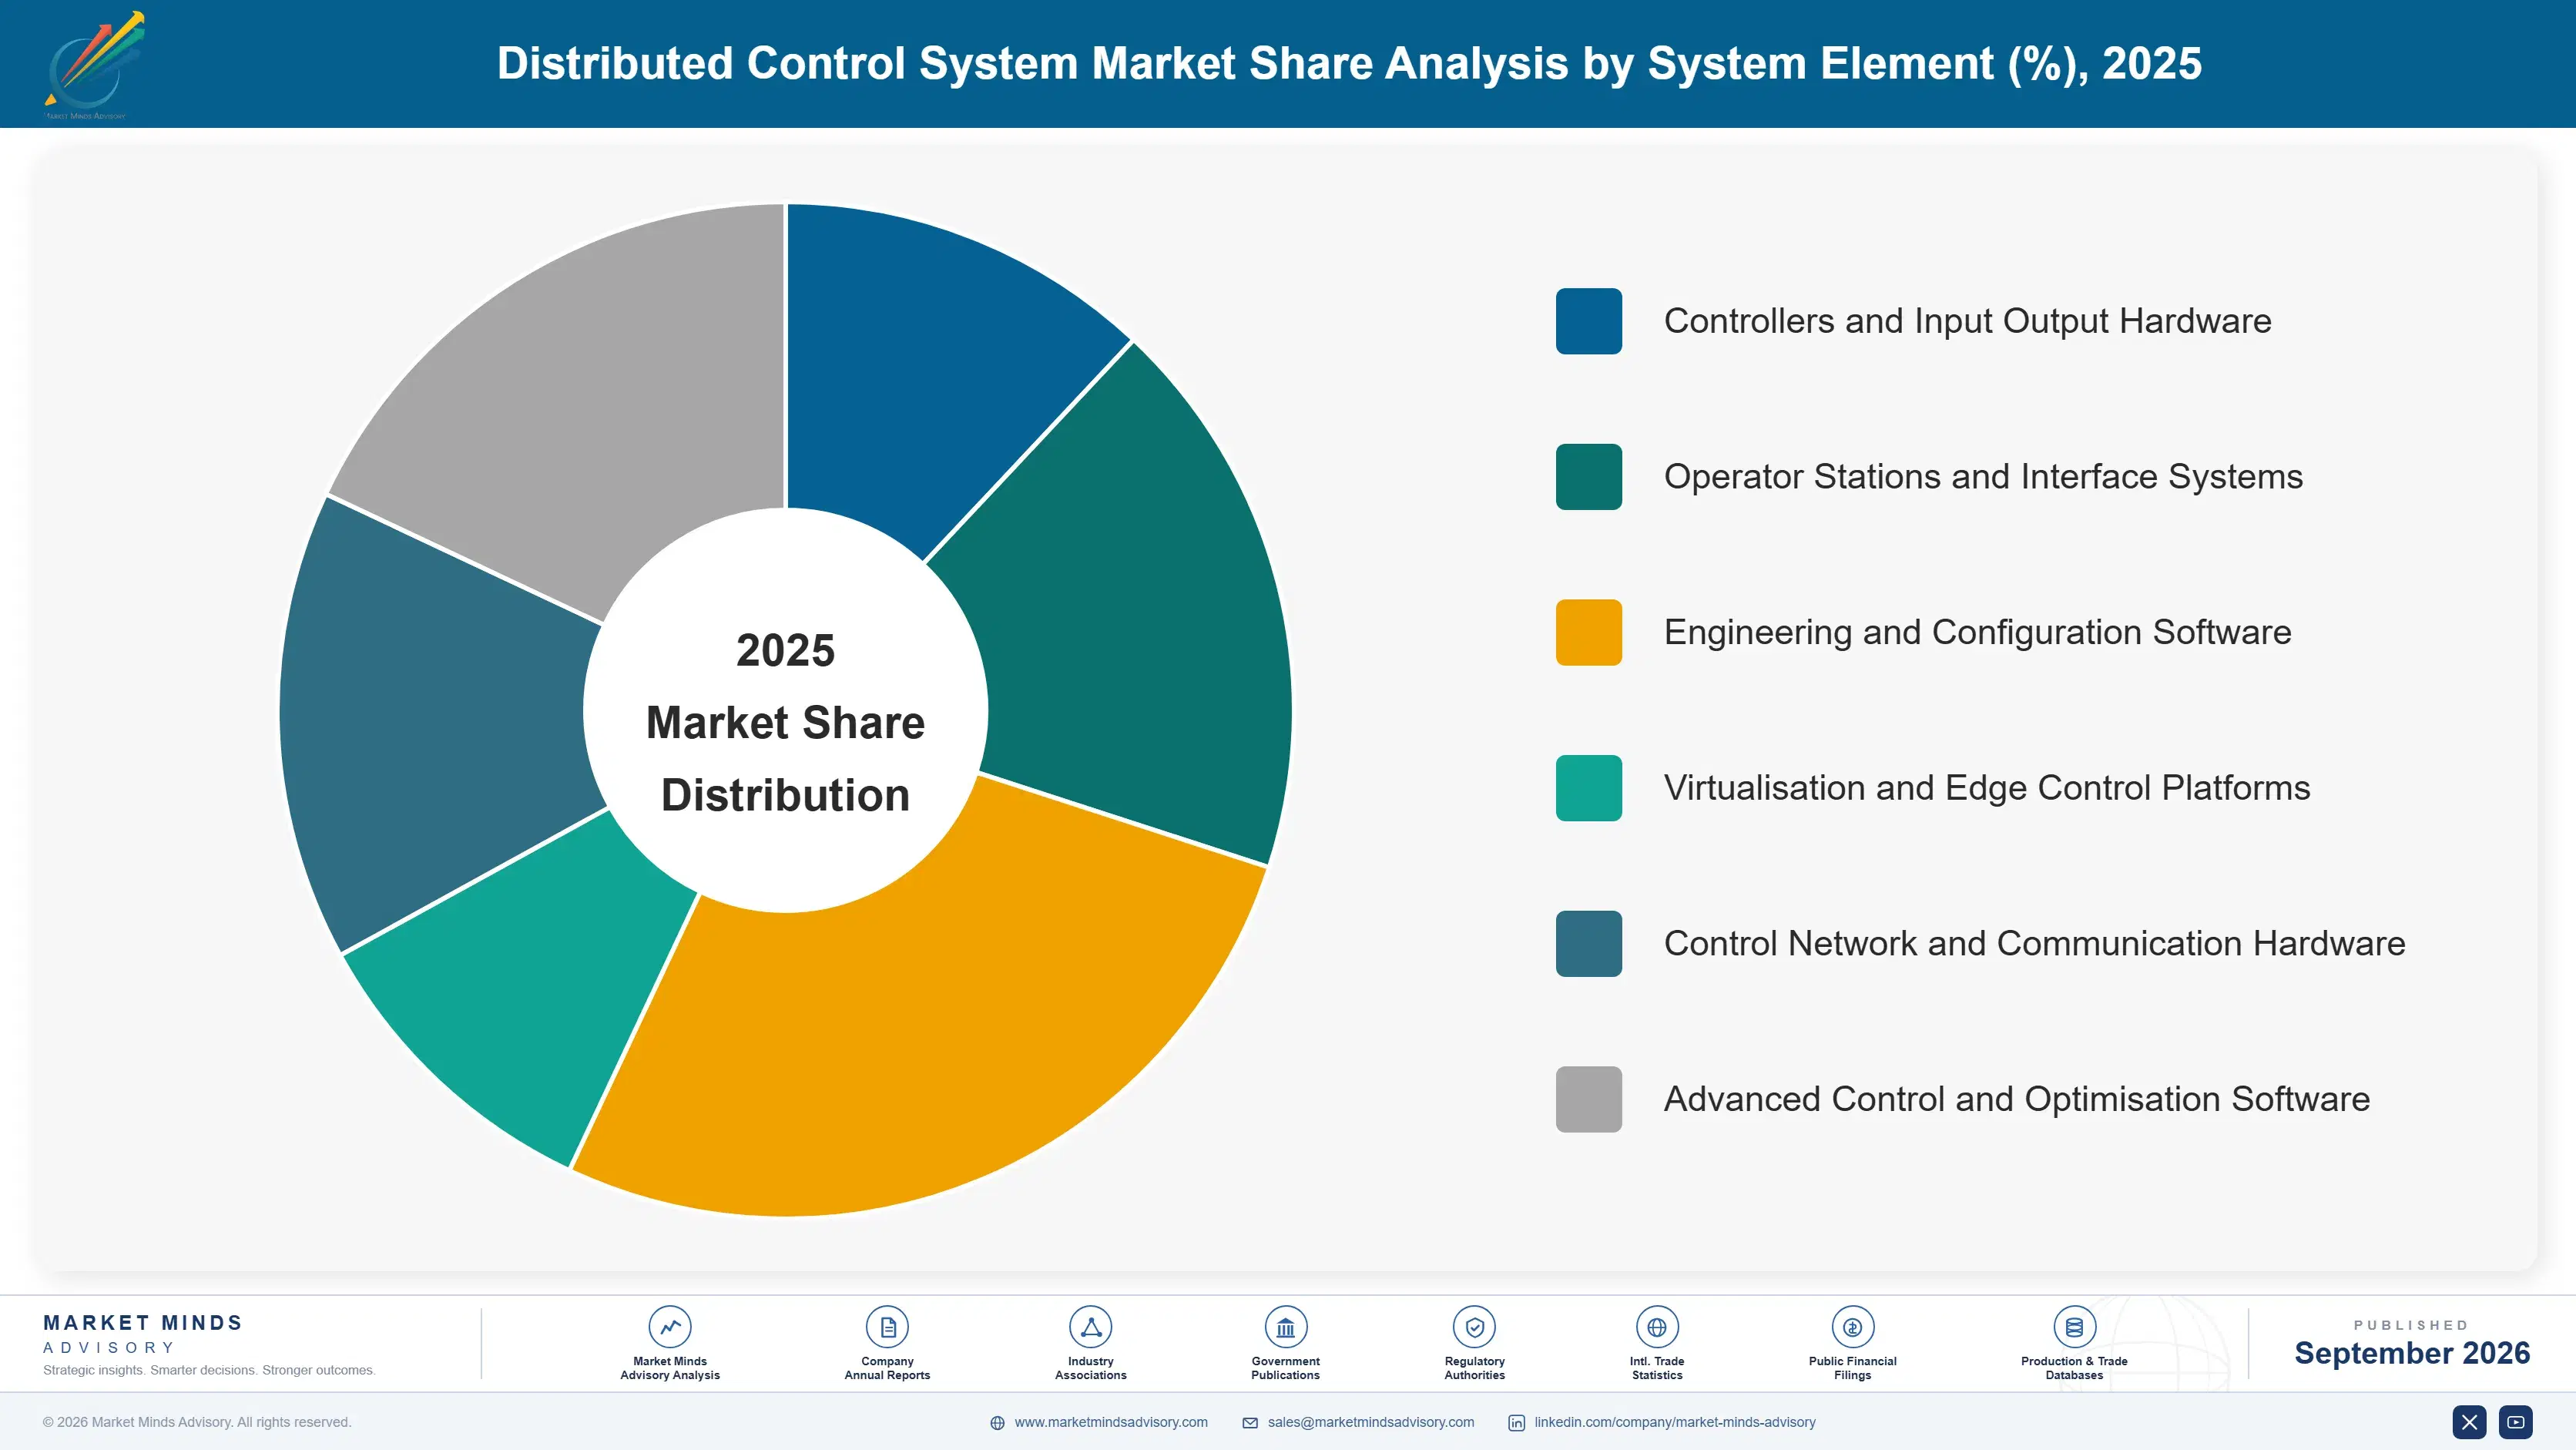
Segmentation follows system element. Six categories cover the market: controllers and input output hardware, operator stations and interface systems, engineering and configuration software, virtualisation and edge control platforms, control network and communication hardware, and advanced control and optimisation software. Migration and lifecycle services are counted within the element they deliver rather than separately. Spares fall within their hardware element.
distributed-control-system-market-market-share-analysis-1790011060998

Virtualisation And Edge Control Platforms

Virtualisation and edge platforms grow at 6.9%, half again the market rate of 4.6%, because they attack the variable that actually decides whether a migration is approved. A process plant loses more in a week of stopped production than the control system costs, so outage duration governs the decision and equipment price barely features. Running control functions on virtualised infrastructure allows parallel operation, staged transfer, and cutover in hours rather than weeks. Hot cutover approaches command roughly 2.4 times conventional pricing, and customers pay it without much argument at all. Suppliers competing on equipment price are addressing a number that barely features in the approval. Equipment price barely features in the approval, yet it absorbs most commercial attention.
CAGR 6.9%

Advanced Control And Optimisation Software

Advanced control and optimisation grows at 6.2% because it is the one element that produces measurable operating return rather than replacing something that already works. Tighter control of a distillation column or a reactor loop shows up in yield and energy consumption that a plant manager can verify against the previous quarter. It also deepens the incumbent position considerably, since optimisation models are tuned to a specific plant and rebuilding them for another supplier's system is a project nobody volunteers for. Adoption is limited mainly by the scarcity of engineers who can maintain the models. Suppliers with optimisation attached report migration retention above 94%. That is the difference between a strong position and one nobody attacks.
CAGR 6.2%
Full segment breakdown across 6 segments available in the complete report.

Regional Architecture and Country Demand Map

Regional shares track where process capacity is built and where ageing systems require replacement, and those two rarely coincide. Four regions sit outside the standard bands, each for a reason named in its paragraph and summarised for operator review below. Construction and replacement demand behave nothing alike.

East Asia

At 32% this region sits above the standard band, and the justification is construction rather than existing plant: Chinese chemical, refining, and gas processing capacity additions exceed the rest of the world combined in most years, and greenfield awards determine who collects lifecycle revenue for the following quarter century. Japanese and Korean demand is largely replacement work on well maintained assets. Growth of 5.6% exceeds the world rate. Domestic Chinese suppliers hold a substantial and rising share of local awards, particularly outside the largest international joint venture projects. Awards made here now determine lifecycle revenue through to the middle of the century, which is why international suppliers bid them at margins that look irrational in isolation.
Share: 32% | CAGR: 5.6% (2026 to 2036)

North America

At 21% this region sits just below the standard band, and the reason is the absence of greenfield capacity rather than any weakness in demand: almost nothing new is being built, so spending is migration of an ageing base. That work is high value per project and smaller in aggregate than the region's industrial scale suggests. Growth of 3.7% is modest. Gas processing and petrochemical assets built during the shale expansion are now themselves approaching migration age, which supports demand through the forecast period. Gas processing and petrochemical assets built during the shale expansion are themselves approaching migration age, which supports demand steadily through the forecast period. Migration work is high value per project and small in aggregate.
Share: 21% | CAGR: 3.7% (2026 to 2036)
Regional intelligence for 5 additional markets available in the complete report: Western Europe, South Asia and Pacific, Middle East and Africa, Latin America, Eastern Europe. Contact sales@marketmindsadvisory.com.
distributed-control-system-market-country-cagr-analysis-1790011061549

Where Suppliers Compound Their Position

Four commercial moves separate suppliers compounding an installed position from those competing on equipment price in a market where equipment price decides very little. Each recognises that lifecycle revenue follows the original award and that outage risk rather than capital cost governs replacement decisions. Equipment price decides remarkably little in either case. Both are widely known and rarely acted on.

Bid Greenfield Awards As Twenty Year Annuities

A greenfield award determines who collects migration, lifecycle, and optimisation revenue for the following quarter century, and 88% of migrations return to the incumbent. Suppliers pricing those awards against lifetime value rather than project margin win 2.9 times more of them, accepting thin initial returns for revenue that compounds. The discipline is difficult inside a business measured on project profitability, which is precisely why the suppliers who do it consistently have pulled ahead. Suppliers who apply it consistently have pulled ahead of those who cannot. The annuity is long and rarely contested afterwards.
Market Impact: Wins 2.9 times more greenfield project awards overall

Sell Outage Reduction Instead Of Equipment Value

A process plant loses more in a week of stopped production than a control system costs, so migration approval turns on shutdown length rather than capital price. Suppliers offering virtualised parallel running and staged cutover realise project values 2.4 times conventional replacement, and convert deferred projects into approved ones. Equipment pricing barely features in the approval discussion, yet it continues to absorb most of the commercial attention inside supplier organisations. Deferred projects become funded ones once the outage question has an answer. Attention inside supplier organisations sits elsewhere entirely. That gap is costly.
Market Impact: Realises values 2.4 times above conventional replacement pricing

Reverse Engineer Undocumented Configuration Credibly Beforehand

Around 27% of control logic has no recorded purpose and the engineers who understand it are retiring, which makes migration scope genuinely uncertain and frightens customers into deferral. Suppliers with automated configuration analysis and structured discovery reduce project overrun by 31 to 44% and win work competitors will not price confidently. It is unglamorous engineering that addresses the single largest reason a needed migration does not get approved by anybody. Competitors who will not price that uncertainty simply decline the work, which narrows the field considerably. It removes the largest reason a needed migration stalls.
Market Impact: Reduces project overrun by 31 to 44% overall

Attach Optimisation Models To Deepen Lock-In

Advanced control models tuned to a specific column or reactor produce yield and energy improvements a plant manager verifies directly, and they grow at 6.2% for that reason. They also make displacement considerably harder, since rebuilding models for another supplier's system is a project nobody volunteers to lead. Suppliers with optimisation attached report migration retention above 94% against 88% generally, which is the difference between a strong position and an unassailable one. Model maintenance skills are scarce, which limits adoption more than any commercial objection does. Displacement stops being seriously contemplated at all.
Market Impact: Lifts migration retention to 94% from 88% generally

Who Controls the Margin Pool

Concentration is the highest of any industrial automation category. Five suppliers hold 71% of system revenue, measured consistently on that basis across all participants, and the positions largely reflect greenfield awards made a generation ago rather than anything competed for recently. Chinese domestic suppliers have taken a substantial share of local projects, which is the only meaningful change in the field for years.
Competition currently turns on three things: outage reduction capability, which decides whether a migration is approved at all; configuration discovery for undocumented logic, which decides who will price the work confidently; and optimisation software attachment, which deepens a position that is already difficult to attack. Equipment specification decides comparatively little. Regional engineering capacity decides both delivered cost and schedule credibility, since every installation is configured rather than delivered and those engineers take years to develop.

Pressure comes from two directions. Chinese suppliers compete effectively on domestic greenfield awards that determine decades of future revenue. Meanwhile open architecture initiatives continue attracting attention without moving much installed base. Rankings will shift with greenfield awards in Asia and the Gulf, since those decide lifecycle revenue long after the projects finish. Suppliers without greenfield share face the weakest future.
distributed-control-system-market-company-positioning-matrix-1790011062078

Competitive Moat and Risk Dimensions

HONEYWELL

Moat: Installed Base And Continuity

A very large installed base built over decades generates migration and lifecycle revenue that arrives without competitive process, since 88% of migrations return to the incumbent and customers face logic, training, and documentation obstacles rather than a supplier choice. Continuity across hardware generations makes that transition credible rather than merely convenient.
HONEYWELL

Risk: Greenfield Position In Asia

Future installed base is decided by capacity being built in China, India, and the Gulf, where domestic and regional competitors bid aggressively for awards that determine decades of subsequent revenue. Losing greenfield share now removes lifecycle revenue that only becomes visible in the accounts many years afterwards.
EMERSON

Moat: Virtualisation And Cutover Capability

Capability that shortens or removes the outage a migration requires addresses the variable that actually governs approval, and it converts deferred projects into funded ones. Customers pay roughly 2.4 times conventional pricing for that, which makes the capability commercially valuable rather than merely technically interesting to engineers.
EMERSON

Risk: Process Industry Cycle Exposure

Revenue concentrated in chemical, refining, and gas processing rises and falls with petrochemical margins and capital cycles the company cannot influence, and discretionary migration is the first thing deferred. Diversifying toward less cyclical process industries means competing where other suppliers hold the installed positions. That is slow and expensive work.

Players Tracked

Prominent Players

Honeywell
Emerson
ABB
Yokogawa
Siemens

Other Key Players

Schneider Electric
Rockwell Automation
Hitachi
Toshiba
Mitsubishi Electric
Azbil
Supcon
Hollysys
Valmet
Metso
Andritz
GE Vernova
Omron
LS Electric
Novatech

Recent Developments

JANUARY 2026

Emerson Releases Virtualised Controller Platform Cutting Migration Outage

Emerson released a virtualised controller platform supporting parallel operation and staged transfer, reducing the shutdown a migration requires from weeks to hours and addressing the variable that governs whether such projects are approved. Pricing sits well above conventional replacement, and customers have accepted that without much argument.
Signal: Outage duration rather than equipment price decides these approvals, and suppliers are finally engineering for that.
SEPTEMBER 2025

Yokogawa Acquires Advanced Control And Optimisation Software Developer

Yokogawa completed an acquisition of an advanced control and optimisation software developer, adding models that produce verifiable yield and energy improvements and that deepen incumbency because rebuilding them elsewhere is a project nobody volunteers for. Yield and energy improvements are verifiable against the previous quarter's operating data.
Signal: Optimisation attachment raises migration retention well above the already high category average. Displacement becomes considerably harder afterwards.
MAY 2025

ABB Wins Control System Award For Gulf Petrochemical Complex

ABB received an award decision covering the distributed control system for a Gulf petrochemical complex, an award of the type that determines migration and lifecycle revenue for roughly the following quarter century. The national operator specified at length and expects permanent regional engineering presence throughout the asset's life.
Signal: Greenfield awards are contested well beyond their contract value because of what follows them. Lifecycle revenue follows the award.

What A Control System Costs

Three input groups dominate cost. Control hardware electronics, input output modules, and enclosures run 30% to 38% of cost of goods sold from industrial semiconductor and component suppliers. Application engineering, factory acceptance testing, and commissioning take 34% to 42%, which is unusually high and reflects that every installation is configured rather than delivered. Software development and lifecycle support add 18% to 25%.
Industrial semiconductor and passive component supply tightened through 2024 as demand across automation and energy applications absorbed capacity, and several suppliers described extended lead times in their annual reports for that year and the next. SEMI equipment data showed capacity additions arriving behind requirement. Long product lifecycle obligations compound the problem, since control hardware must remain available for decades rather than for a normal product generation.

The competitive disadvantage mechanism runs through application engineering capacity rather than component cost. Every project consumes configuration, testing, and commissioning engineers who take years to develop, and a supplier without that capacity cannot bid work regardless of product quality. Exposure varies sharply by supplier type: those with regional engineering centres deliver projects at competitive cost, while those flying engineers to sites carry expense competitors do not.
distributed-control-system-market-cost-volatility-analysis-1790011062285

Build Regional Application Engineering Centres

Application configuration, testing, and commissioning consume more cost than the hardware and cannot be performed remotely in full. Suppliers with engineering centres near their project geography deliver at costs competitors flying specialists across continents cannot match, and they also retain engineers who would otherwise leave rather than travel continuously. Retention improves as a side effect.

Commit Component Volumes Across Long Lifecycle Obligations

Control hardware must remain available for decades, which is an unusual obligation in electronics and one that component suppliers price accordingly when volumes are uncommitted. Long-term agreements covering committed volumes protect both availability and price through the shortages that periodically leave competitors quoting lead times customers will not accept. Customers will not accept those lead times.

Automate Configuration Analysis To Reduce Engineering Hours

Discovery of undocumented logic consumes engineering hours nobody scoped, and those hours come from a workforce that takes years to develop and is retiring faster than it is replaced. Automated analysis of existing configurations converts uncertain discovery into structured work, which reduces both project overrun and the engineering capacity each project consumes. Overrun falls at the same time.

Portfolio Architecture for Margin Defence

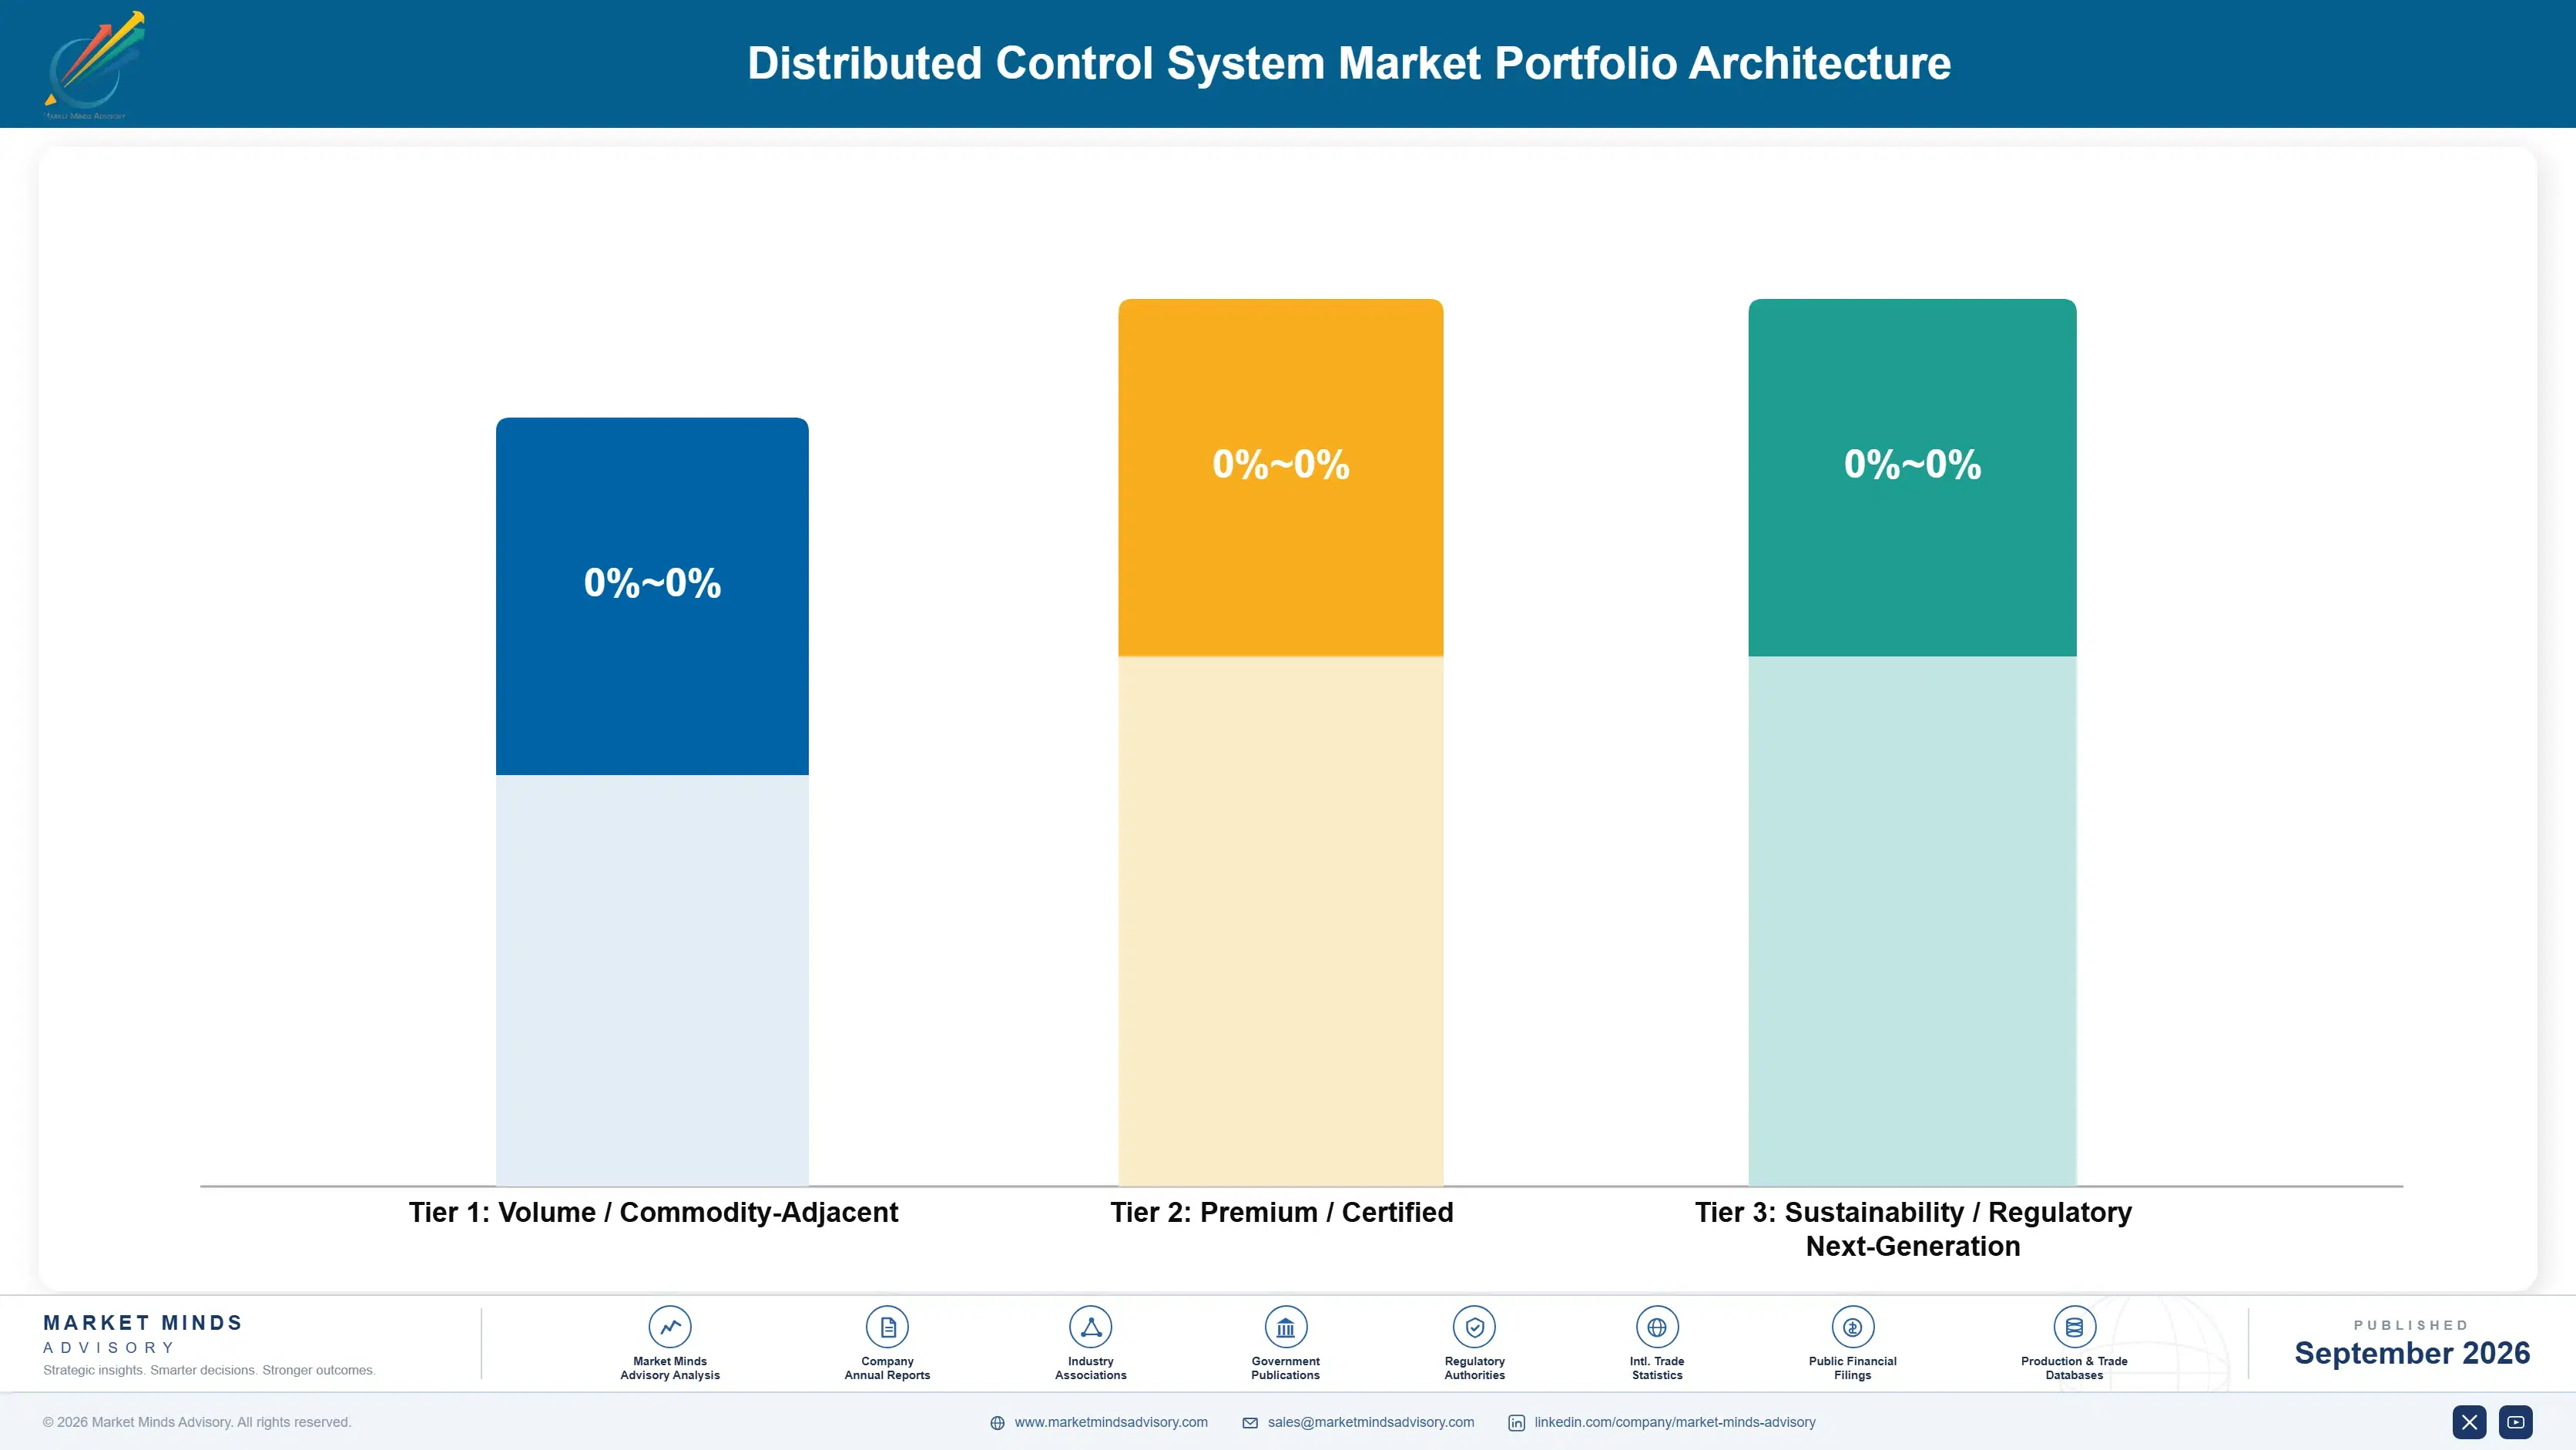
Margin follows how difficult the element is to displace. Controllers, input output, and network hardware are close to commodity within a system award, since the customer is buying continuity rather than comparing specifications. Engineering software earns better. Optimisation models and outage reduction capability earn most, because the first is tuned to a specific plant and the second addresses the variable that decides approval. Displacement difficulty rather than technical content decides this entire hierarchy.
The tension between volume and premium runs through project type. Greenfield awards are bid thin because lifecycle revenue follows and everyone knows it, which turns the initial project into an investment. Migration work on an installed base is priced entirely differently, since the customer has no realistic alternative supplier and is buying risk reduction rather than equipment.

High-value pools concentrate where an outage is expensive and the logic is poorly understood: refining, petrochemical, and gas processing assets running continuously with decades of accumulated configuration. Those buyers are not price led at all. Where a plant is simple, well documented, and can shut down for a fortnight anyway, the work is competitive and priced much closer to equipment value. Those projects are genuinely competitive.

Volume / Commodity-Adjacent

Controllers, input output modules, and network hardware supplied within a system award, where continuity rather than specification decides the choice. The ten-point range reflects component purchasing scale and manufacturing footprint rather than any capability difference between suppliers.
Gross Margin: 22% to 32%

Premium / Certified

Engineering software, operator systems, and configured application delivery where regional engineering capacity decides both cost and schedule credibility. The twelve-point range separates suppliers with local engineering centres from those flying specialists to project sites.
Gross Margin: 38% to 50%

Sustainability / Regulatory / Next-Generation

Optimisation models, virtualised cutover capability, and configuration discovery, none of which a competitor can supply into another supplier's installed system. The sixteen-point range reflects how deeply models are tuned to specific plant assets.
Gross Margin: 54% to 70%
distributed-control-system-market-portfolio-architecture-1790011062796

High-value Sub-segments and Strategic Watch-out

Optimisation Model Attachment

Highest value in the category, producing verifiable yield and energy gains while raising migration retention above 94% against 88% generally. The sixteen-point range reflects how specifically each model is tuned to an individual plant and its economics. Rebuilding them elsewhere is a project nobody leads.
Gross Margin: 58% to 74%

Virtualised Cutover Capability

Fastest growth at 6.9%, addressing outage duration rather than capital cost and commanding roughly 2.4 times conventional replacement pricing. The twelve-point range separates suppliers offering genuine parallel running from those merely shortening a conventional shutdown sequence. Approval depends on this rather than on price. Deferred projects become funded ones.
Gross Margin: 50% to 62%

Installed Base Migration Delivery

Volume core supplying 46% of supplier revenue, priced as risk transfer because the customer has no realistic alternative supplier. The twelve-point range reflects configuration discovery capability, which decides whether projects overrun or complete as scoped. Customers have no realistic alternative supplier here. Discovery capability decides whether projects overrun.
Gross Margin: 40% to 52%

Commodity Control Hardware

The strategic watch-out. Customers buy continuity rather than specification, Chinese suppliers compete hard on domestic awards, and long lifecycle obligations raise cost without raising price. The ten-point range reflects purchasing scale and nothing commercially defensible. Long lifecycle obligations raise cost without raising price. Continuity rather than specification decides selection.
Gross Margin: 20% to 30%

How This Revenue Compounds

A greenfield award is the entry point to a revenue stream lasting roughly a quarter century, covering support, spares, expansions, optimisation, and eventually a migration that returns to the same supplier 88% of the time. That is why greenfield projects are bid at margins that look irrational in isolation. The annuity is real, it is long, and it accrues to whoever configured the plant originally.
Attachment depth follows application logic and operator familiarity rather than any commercial arrangement. A plant whose control philosophy, alarm strategy, interlocks, and operator procedures were built around one system cannot change without rebuilding all four, and around 27% of the logic has no documented rationale to rebuild from. Optimisation models deepen that further, since they are tuned to a specific asset.

The buyer has shifted from plant engineering toward capital projects and corporate reliability functions. Site engineers once specified control systems on technical merit and maintained relationships with local supplier teams. Greenfield awards are now decided by capital project organisations evaluating lifetime cost, and migrations by corporate reliability groups assessing outage risk across a portfolio of sites. Suppliers still selling to site engineering are addressing a participant whose authority has narrowed considerably.
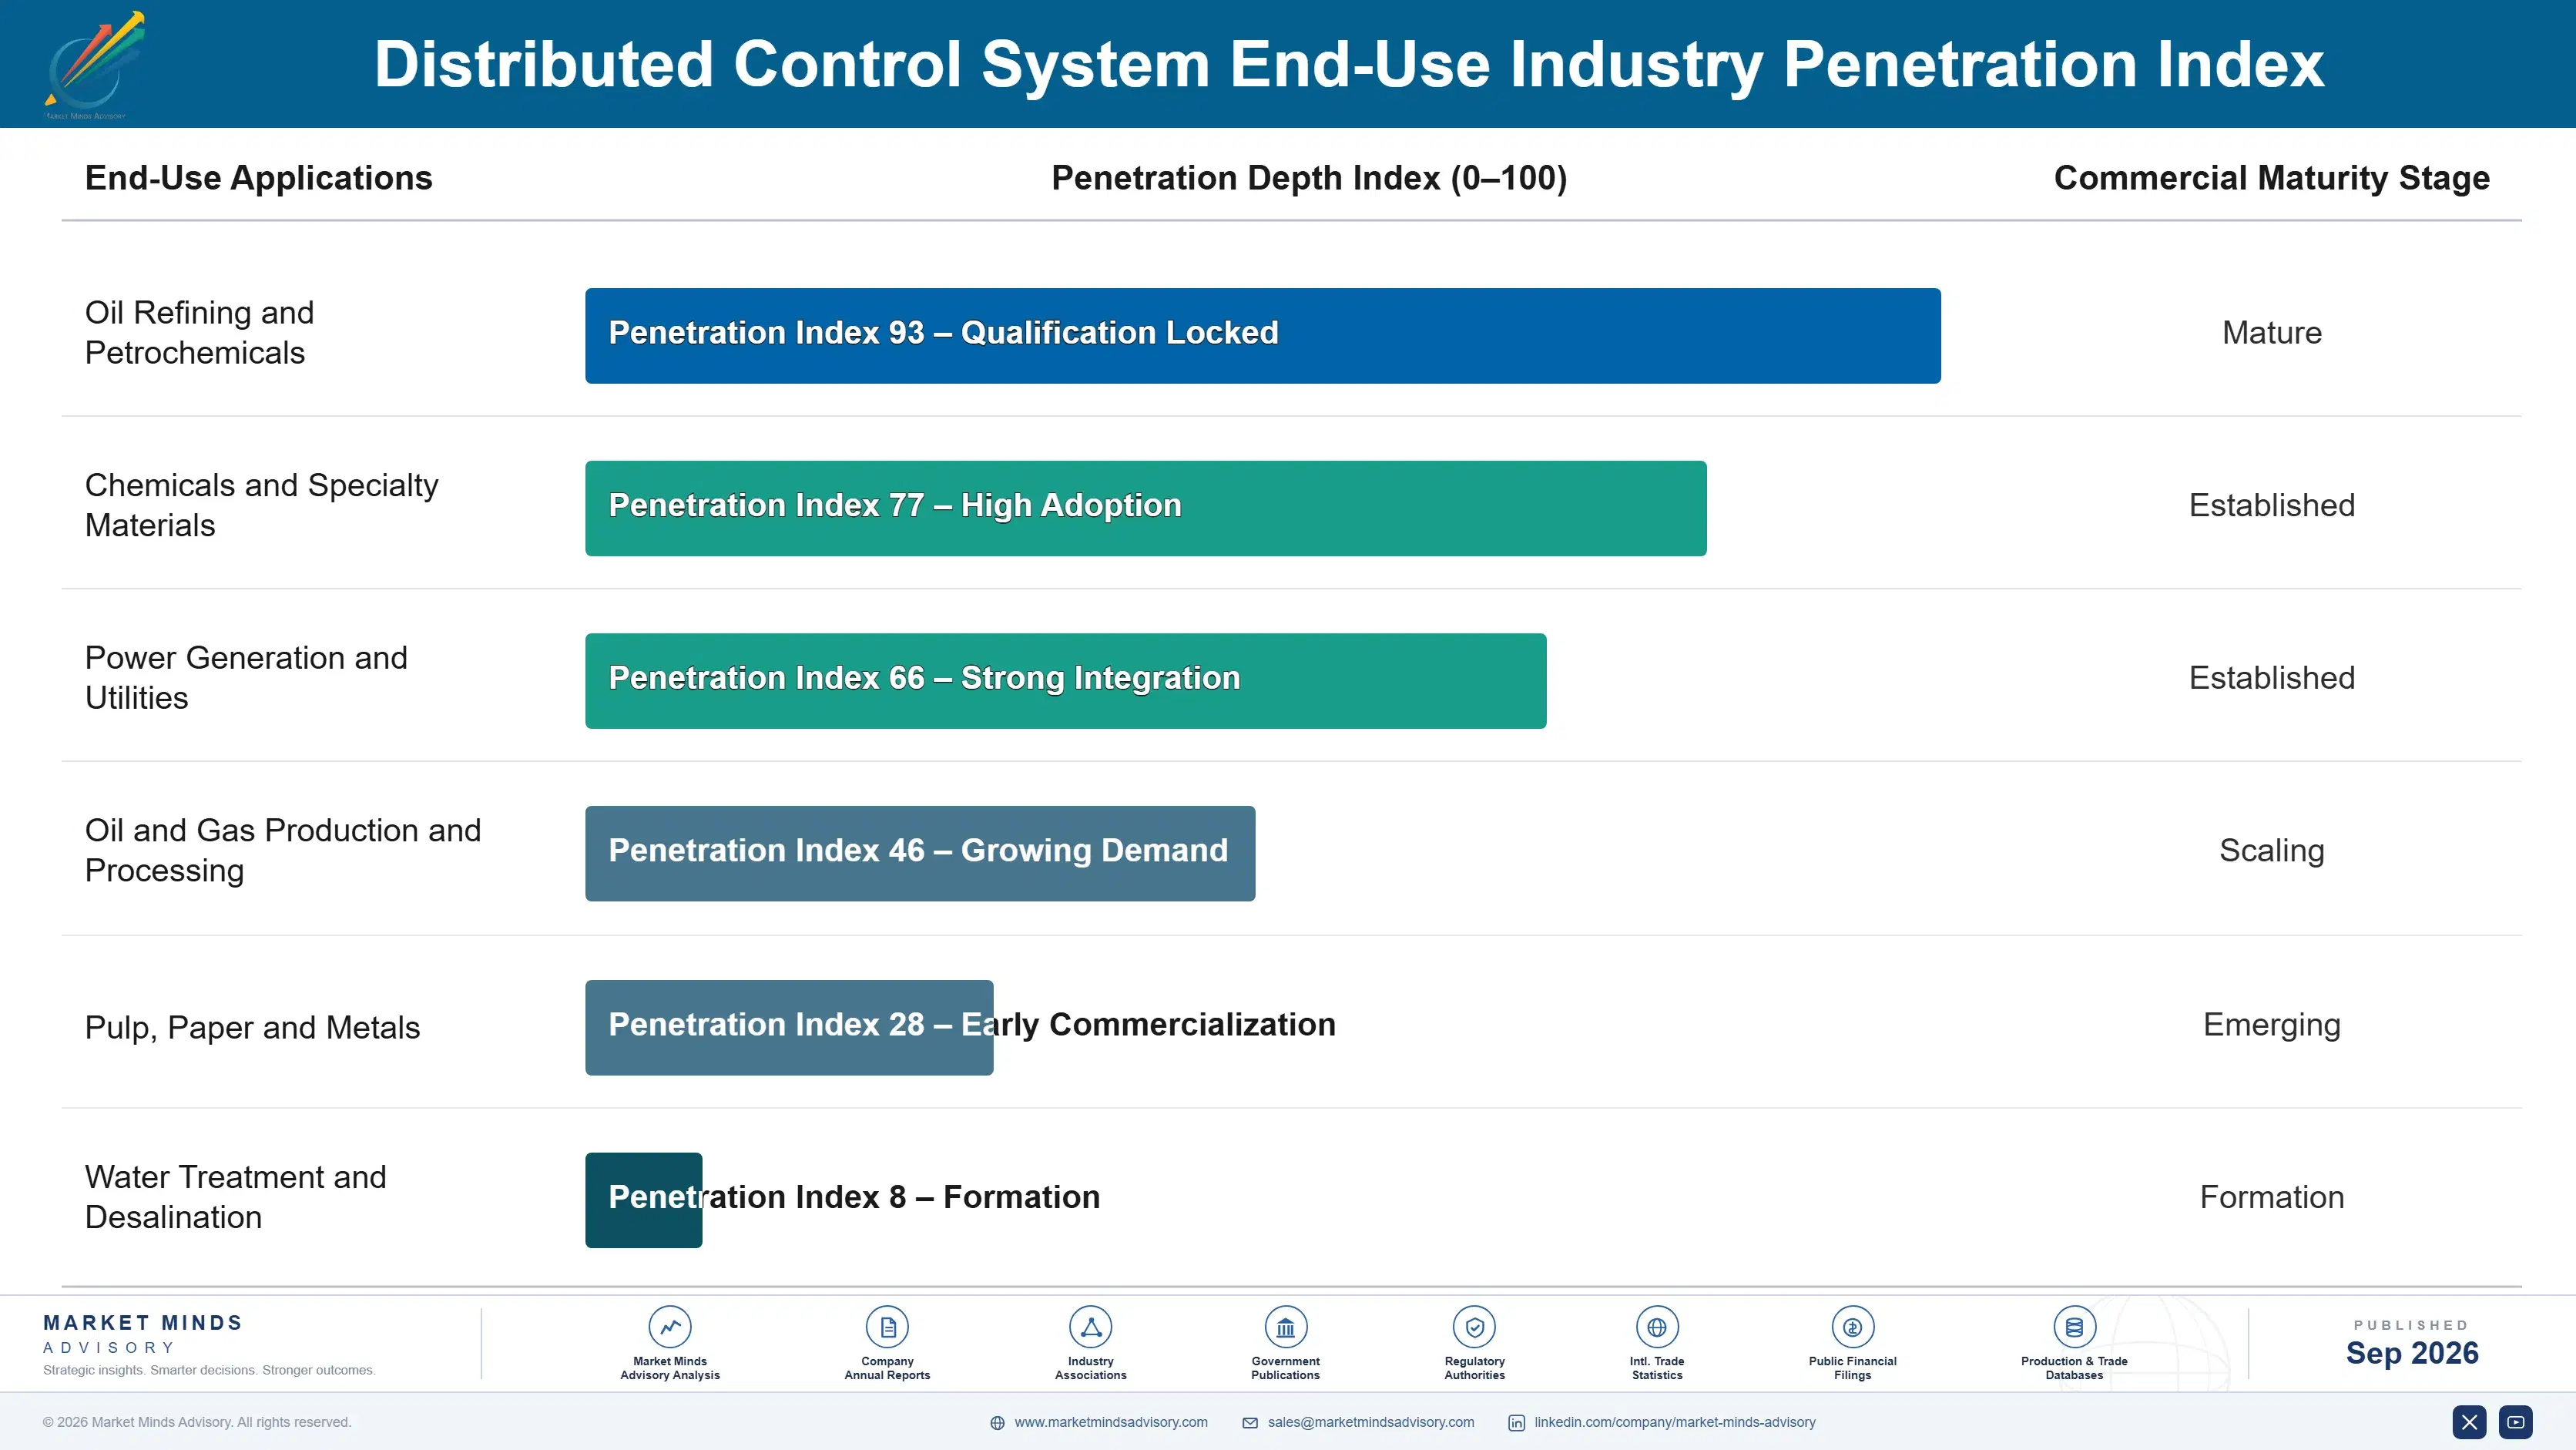
distributed-control-system-market-end-use-penetration-index-1790011063295

Where This Market Rewards

These are among the four positions where our research anticipates prominent divergence between winners and laggards over the coming forecast period. Each is grounded in the demand model, the regulatory perimeter, and the announced capacity pipeline.
01 / GREENFIELD ANNUITY PRICING

Win the project, collect for decades

A greenfield award determines who receives migration, lifecycle, and optimisation revenue for roughly the following quarter century, and 88% of migrations return to the incumbent without meaningful competition. Suppliers pricing those awards against lifetime value rather than project margin win 2.9 times more of them. The discipline is genuinely hard inside a business measured on project profitability, which is exactly why consistent practitioners have pulled ahead, and the annuity behind it is long, real, and rarely contested, because nobody seriously bids against an incumbent here.
02 / OUTAGE RISK SELLING

Shutdown length decides the approval

A process plant loses more in a week of stopped production than the control system costs, so migration approval turns on outage duration rather than on capital price at any point. Suppliers offering virtualised parallel running realise project values around 2.4 times conventional replacement and convert deferred projects into funded ones. Equipment pricing absorbs most commercial attention inside supplier organisations while barely featuring in the customer's decision, which is a misallocation of attention worth correcting quickly, and the customer barely mentions equipment cost at all.
03 / CONFIGURATION DISCOVERY CAPABILITY

A quarter of the logic is unexplained

Around 27% of control logic has no documented purpose, and the engineers who understand why particular interlocks exist are retiring faster than the knowledge is being captured anywhere. Suppliers with automated configuration analysis reduce project overrun by 31 to 44% and price work competitors decline to quote. It is unglamorous engineering that removes the single largest reason a genuinely needed migration never gets approved, and competitors who will not price it simply decline to bid, which narrows the field to those who invested in discovery.
04 / OPTIMISATION MODEL ANCHORING

Tuned models nobody wants to rebuild

Advanced control models tuned to a specific column or reactor deliver yield and energy improvements a plant manager verifies against the previous quarter, and they grow at 6.2% on that evidence alone. They also make displacement far harder, since rebuilding models on another supplier's system is a project nobody volunteers to lead. Suppliers with optimisation attached report migration retention above 94% against 88% generally, which turns a strong position into one nobody bothers attacking, and scarce modelling skills limit adoption more than price does.

Engagement Snapshot From the Field

A live engagement with an industry participant carrying material or product regulatory and market exposure ahead of a defining policy shift, showing how our research translates into a defensible multi-year portfolio strategy.
MARKET MINDS ADVISORY · CLIENT ENGAGEMENT SUMMARY
Distributed Control System Producer Strategic Portfolio Review and Transition Roadmap 2026·Investment Scenario on Distributed Control System Exposure Evaluation 2025-26
CLIENT PROFILE
A petrochemical operator running four production sites in two countries, with control systems averaging 22 years old and one plant on a hardware generation whose support had already ended. Annual control system spending including support and spares ran near USD 14 million (client-reported, unverified by MMA), almost entirely with a single incumbent supplier. No knowledge capture programme existed at any site.
STRATEGIC CHALLENGE
Procurement wanted to tender the migration competitively, arguing the incumbent's pricing was untested after two decades. Engineering warned that nobody could scope the work accurately, and neither position had been examined because no one had established how much of the existing configuration was actually documented. The disagreement had blocked the decision for a year.
MMA APPROACH
MMA audited control configurations across all four sites against available documentation, quantified undocumented logic by area, and modelled migration cost and outage duration for incumbent continuation against a competitive alternative including the discovery work a new supplier would have to perform first. Retirement timelines for key engineers were mapped against the proposed project schedule.
KEY FINDINGS
  1. Across the four sites, 31% of control logic had no documented rationale, rising to 44% in areas modified repeatedly during past debottlenecking projects.
  2. A competing supplier would require an estimated seven additional months of discovery before quoting firmly, and would price that uncertainty into the proposal regardless.
  3. Outage duration rather than capital cost dominated total exposure: each additional shutdown week at the largest site cost roughly 2.8 times the entire control hardware value.
  4. Three engineers approaching retirement held most of the undocumented knowledge, and no capture programme existed at any of the four sites. Their retirement dates fell inside the project window.
CLIENT PROFILE
A petrochemical operator running four production sites in two countries, with control systems averaging 22 years old and one plant on a hardware generation whose support had already ended. Annual control system spending including support and spares ran near USD 14 million (client-reported, unverified by MMA), almost entirely with a single incumbent supplier. No knowledge capture programme existed at any site.
STRATEGIC CHALLENGE
Procurement wanted to tender the migration competitively, arguing the incumbent's pricing was untested after two decades. Engineering warned that nobody could scope the work accurately, and neither position had been examined because no one had established how much of the existing configuration was actually documented. The disagreement had blocked the decision for a year.
MMA APPROACH
MMA audited control configurations across all four sites against available documentation, quantified undocumented logic by area, and modelled migration cost and outage duration for incumbent continuation against a competitive alternative including the discovery work a new supplier would have to perform first. Retirement timelines for key engineers were mapped against the proposed project schedule.
KEY FINDINGS
  1. Across the four sites, 31% of control logic had no documented rationale, rising to 44% in areas modified repeatedly during past debottlenecking projects.
  2. A competing supplier would require an estimated seven additional months of discovery before quoting firmly, and would price that uncertainty into the proposal regardless.
  3. Outage duration rather than capital cost dominated total exposure: each additional shutdown week at the largest site cost roughly 2.8 times the entire control hardware value.
  4. Three engineers approaching retirement held most of the undocumented knowledge, and no capture programme existed at any of the four sites. Their retirement dates fell inside the project window.
RECOMMENDED STRATEGY
Phase 1: Phase one: capture undocumented control rationale from the three retiring engineers before any migration begins, treating it as the critical path item. Phase 2: Phase two: tender the least complex site competitively to establish genuine market pricing, while continuing with the incumbent at the two most complex ones. Phase 3: Phase three: specify virtualised parallel running for the largest site, where outage cost dominates every other variable in the business case.
OUTCOME
The competitive tender came in 11% below the incumbent's initial quotation, which the incumbent then matched across the remaining sites (client-reported, unverified by MMA). Knowledge capture produced documentation for 71% of previously unrecorded logic. Planned outage at the largest site fell from three weeks to four days.

Frequently Asked Questions

Foundational context covering the market sizes, CAGR, scope, country, region and competition that inform every finding below. This section is provided to cover basics and most often pre-purchase conversations, answered from the MMA Primary Research Dataset.

What is the current size of the Distributed Control System Market?

The market was worth USD 21.4 billion in 2025 and reaches USD 22.4 billion in 2026. Value covers control system hardware, software, and associated engineering delivery.

How large will the Distributed Control System Market be by 2036?

MMA forecasts USD 35.1 billion by 2036, an increase of USD 12.7 billion across the forecast period. That represents 1.57 times the 2026 base of USD 22.4 billion.

What is the CAGR for the Distributed Control System Market 2026 to 2036?

The base case compound annual growth rate is 4.6%, with a bull case at 5.8% and a bear case at 3.4%. Historical growth from 2020 to 2025 ran at 3.6%.

Which segment is growing fastest?

Virtualisation and edge control platforms grow at 6.9%, half again the market rate of 4.6%. They shorten the outage a migration requires, which governs approval.

Who are the major companies in the Distributed Control System Market?

Honeywell, Emerson, ABB, Yokogawa, and Siemens lead, together holding 71% of system revenue. Those positions largely reflect greenfield awards made a full generation ago now.

Which country is growing fastest?

India grows at 8.2%, driven by refining and petrochemical construction at a scale unmatched outside China, where greenfield awards decide lifecycle revenue for decades afterwards.

Report Segmentation Architecture

The full report scope spans multiple orthogonal segmentation dimensions, with cross-tabulated demand data provided for each dimension pair. Coverage extends further to regional breakdowns, trend trajectories, and the competitive detail needed to support segment-level decision-making.

By System Element

  • Controllers and Input Output Hardware
  • Operator Stations and Interface Systems
  • Engineering and Configuration Software
  • Virtualisation and Edge Control Platforms
  • Control Network and Communication Hardware
  • Advanced Control and Optimisation Software

By End-Use Industry

  • Oil Refining and Petrochemicals
  • Chemicals and Specialty Materials
  • Power Generation and Utilities
  • Oil and Gas Production and Processing
  • Pulp, Paper and Metals
  • Water Treatment and Desalination

By Commercial Dimension

  • Greenfield Project Award
  • Installed Base Migration Contract
  • Extended Lifecycle Support Agreement
  • Engineering Contractor Procurement
  • Optimisation Services Contract
  • Spares and Obsolescence Management

By Region

  • East Asia
  • North America
  • Western Europe
  • South Asia and Pacific
  • Middle East and Africa
  • Latin America
  • Eastern Europe

Scope, Methodology, and Coverage

Every figure in this report is reproducible from documented input assumptions. The scope below maps the historical period, the forecast horizon, the segmentation dimensions, and the countries covered, alongside the underlying primary and qualitative methodology.
Historical Period
2020 to 2025
Forecast Period
2026 to 2036
Base Year
2025 (USD billions; MMA Primary Research Dataset, September 2026)
Market Definition
This market covers distributed control systems for continuous and batch process industries, including controllers and input output hardware, operator stations and interface systems, engineering and configuration software, virtualisation and edge control platforms, control network and communication hardware, and advanced control and optimisation software. It excludes programmable logic controllers for discrete manufacturing, safety instrumented systems, field instrumentation, manufacturing execution software, and standalone industrial networking equipment.
Quantitative Units
USD billions, system, software, and engineering delivery revenue
Segmentation Dimensions
System element, end-use industry, commercial dimension, region
Regions Covered
East Asia, North America, Western Europe, South Asia and Pacific, Middle East and Africa, Latin America, Eastern Europe
Countries Covered
China, Japan, South Korea, Taiwan, United States, Canada, Mexico, Germany, Netherlands, United Kingdom, France, Italy, Belgium, Norway, Spain, India, Indonesia, Malaysia, Singapore, Australia, Brazil, Chile, Peru, Argentina, Saudi Arabia, United Arab Emirates, Qatar, Egypt, Poland, Hungary
Key Companies Profiled
Honeywell, Emerson, ABB, Yokogawa, Siemens, Schneider Electric, Rockwell Automation, Hitachi, Toshiba, Mitsubishi Electric, Azbil, Supcon, Hollysys, Valmet, Metso, Andritz, GE Vernova, Omron, LS Electric, Novatech
Quantitative Methodology
Primary survey, n=3,800 respondents, Q4 2025, six countries; demand-side model with trade association cross-validation
Qualitative Methodology
47 expert interviews, Q4 2025; applied to validate demand model assumptions, identify emerging dynamics, and assess competitive positioning
Report Format
PDF and XLSX data workbook (Word format preview document)
Publisher
Market Minds Advisory
Report Code
MMA-2026-CON-791
Published
September 2026
Contact
sales@marketmindsadvisory.com | www.marketmindsadvisory.com

Purchase the full Distributed Control System Market Report (2026 to 2036).

The full report sizes the distributed control system market across six system elements, seven regions, and thirty countries, with forecasts to 2036 under base, bull, and bear cases. It examines why open architecture has moved almost no installed base, how outage duration rather than capital cost governs migration approval, and what undocumented control logic means for project risk. Competitive analysis covers twenty participants evaluated consistently on system revenue, with detailed treatment of greenfield award economics and optimisation attachment. Cost structure, margin architecture, and regional capacity drivers are analysed throughout. Primary research includes 3,800 survey responses and 47 expert interviews.
Six system elements sized and forecast separately
Twenty participants evaluated on system and engineering revenue
Regional greenfield and migration drivers across seven distinct geographies
Margin architecture by element and displacement difficulty
Installed base age and documentation quality benchmarking across process sites
Greenfield award lifetime value modelled against project margin economics

Built For The People Who Decide

From boardroom strategy to bench-side execution, this report is read cover-to-cover by leaders shaping the next decade of their industry, turning demand scenarios, market dynamics and valuation benchmarks into decisions.
CXOs/ Presidents/ VPs/ Managers
M&A and Corporate Development
Strategy Teams and R&D Heads
Procurement and Product Directors
Regulatory and Compliance Leaders
Investor Relations and Equity Analysts