Market Minds Advisory
Disinfection Cap Market

Disinfection Cap Market: Disinfection Cap Market: A Compliance Product Sold As Chemistry, Capping Audits and Evidence Without Control Arms, 2026 to 2036

The chemistry inside is the same alcohol that the wipe already carried. What the cap actually removes is a nurse scrubbing a hub for fifteen seconds while somebody is waiting.

Lead Analyst

Published

September 2026

Make Smarter Decisions with Customized Research Insights

Request a free sample report and evaluate market opportunities, growth trends, and competitive dynamics relevant to your business needs.

2025 MARKET VALUE$0.6BMarket Size 2025
2036 FORECAST VALUE$1.6BBase Case , 2026 to 2036
CAGR 2026 TO 20368.8 %Bull 10.0% / Bear 7.6%
INCREMENTAL OPPORTUNITY$0.9BNet 10- year value creation
EXPANSION MULTIPLE2.29x2036 value over 2026 base
Strategic Levers
M&A Pipeline
Regional Outlook
Country Rankings
Competitive Intelligence
Segmental Deep-dive
Call-Us : 91 93563 13602

Executive Snapshot and Market Trajectory.

Manual hub scrubbing achieves the full recommended contact time in about 18% of observed disinfections. The cap does not clean better than a wipe; it removes the decision to spend fifteen seconds doing it properly. Very few institutions measure their own scrub rate before deciding. Almost nobody checks.
Catheter hub and dialysis caps grow at 13.2%, half again the market rate of 8.8%, because dialysis access carries the highest infection consequence of any routine line and the population needing it keeps expanding. Implanted port caps follow at 11.4%. Needleless connector caps remain the largest segment and grow far more slowly. Cap geometry differs between access points and the products are genuinely not interchangeable.
The category has replaced one compliance problem with a smaller one rather than eliminating it. Unannounced ward audits find roughly 74% of ports capped, which is a substantial improvement on manual scrubbing and is not the universal protection that purchase decisions tend to assume it is. Institutions that audit their own capping rate achieve materially better outcomes from identical products than those assuming complete coverage from the order date onward. The difference is administrative.
Market Definition
This market covers single-use antiseptic-impregnated caps that disinfect and protect vascular and enteral access points, including catheter hub and dialysis caps, implanted port and access device caps, male luer and intravenous tubing end caps, enteral and alternative line port protectors, needleless connector caps, and syringe and medication delivery caps. It excludes alcohol prep pads and swabs, antiseptic wipes, catheter securement devices, dressings, and disinfectant sprays or liquids.
Base Year Value
$0.6B in 2025 (MMA Primary Research Dataset, September 2026)
Forecast Period
2026 to 2036, eleven discrete annual values
CAGR
8.8% base case. Bull 10.0%. Bear 7.6%.
Fastest Growth Segment
Catheter Hub And Dialysis Caps: 13.2% CAGR
Fastest Growth Country
India: 14.6% CAGR
Fastest Growth Region
South Asia and Pacific: 10.8% CAGR
Largest Region
North America: 41% of 2025 global value
Market Leaders
Solventum, Becton Dickinson, ICU Medical, Merit Medical Systems, and B Braun Melsungen lead the field. Source: MMA Primary Research Dataset, July 2026.
Primary Survey
n=3,800 procurement and R&D decision-makers, Q4 2025, six countries
Methodology
Demand-side build-up, cross-validated against public data, 47 expert interviews

Disinfection Cap Market Forecast Scenarios

disinfection-cap-market-size-forecast-scenario-1790016760658
Between 2020 and 2025 the category grew at 7.4% on infection prevention attention that rose sharply and then settled at a higher baseline than before. American hospitals adopted caps most completely, driven by reporting tied to reimbursement, and the product moved from intensive care into general wards. Adoption elsewhere followed at a considerable distance. Adoption elsewhere still trails considerably.
The base case at 8.8% rests on three mechanisms. Dialysis populations expand faster than acute bed numbers in almost every market, and dialysis access carries the highest infection consequence of any routine line. Indian and Southeast Asian private hospital accreditation formalises infection control protocols that previously varied by ward. And cap use spreads from critical care into general wards where line numbers are far larger. None of the three requires acute bed numbers to grow at all.
The bull case at 10.0% depends on capping compliance becoming an audited metric in its own right, since a measured programme performs very differently from an unmeasured one. The bear case at 7.6% is evidence scrutiny: around 12% of published evaluations used a concurrent control arm, and a value analysis committee examining that literature carefully reaches a less comfortable conclusion than the marketing suggests.

What The Cap Actually Replaces

Scrubbing a needleless connector with an alcohol wipe works perfectly well when it is done for the full contact time and allowed to dry. Observed compliance with that runs at around 18%. The cap contains the same isopropyl alcohol, sits on the port between accesses, and disinfects passively while nobody is watching. Its advantage is behavioural rather than chemical, and the category rarely describes itself that way.
TOP FIVE CONCENTRATION68%Share of category revenue held by the leading manufacturers
MANUAL SCRUB COMPLIANCE18%Hub disinfections performed for the full recommended contact time
CAP APPLICATION COMPLIANCE74%Ports found capped during unannounced ward audit visits
CONCURRENT CONTROL STUDIES12%Published evaluations using a control arm rather than before-and-after
ANNUAL COST PER BEDUSD 210Cap spend attributed to a single acute inpatient bed
PORTS PER PATIENT DAY4.6Access events requiring disinfection in a typical critical care day
That reframing matters commercially because it identifies the real competitor, which is not another cap but a properly executed manual protocol. Hospitals achieving genuinely high scrub compliance gain far less from capping than those achieving typical compliance. Very few institutions measure their own scrub rates before deciding, which means the business case is usually built on an assumption nobody in the room has tested.
Caps also have to be applied, and unannounced audits find roughly 74% of ports carrying one. That is a large improvement on manual scrubbing and it is not the complete coverage that a purchasing conversation tends to imply. A programme that measures capping compliance and one that does not produce measurably different outcomes from identical products, which is the finding this industry discusses least.
"We sell alcohol in a plastic cap and describe it as a disinfection technology. It is a compliance technology. The chemistry has not changed since the wipe, and what changed is that nobody has to decide to scrub for fifteen seconds while a patient is waiting on them."
Practice Director, Infection Prevention and Vascular Access · MMA Medical Devices Practice · September 2026

Market Trends

Dialysis Access Drives The Fastest Growing Demand

Catheter hub and dialysis caps grow at 13.2%, the fastest rate here, because dialysis access is repeatedly opened, carries an unusually high infection consequence, and serves a population expanding faster than acute beds in almost every market. Outpatient dialysis units also run standardised protocols across many patients, which makes cap adoption a single operational decision rather than a ward-by-ward negotiation. Uptake is correspondingly faster than in general acute settings. Cap geometry for dialysis access differs from needleless connector products, so the two are not interchangeable and a supplier serving only one cannot follow the demand into the other.
Market Impact: Country grows at 14.6%

Capping Compliance Becomes A Measured Metric

Unannounced audits find around 74% of ports capped, and institutions that measure that figure achieve materially better results than those assuming complete coverage from the moment they place an order. Measuring turns a purchased product into an operated programme, which is the difference between the outcomes reported in successful implementations and the outcomes reported in disappointing ones. Very few purchasing conversations currently include any discussion of how compliance would be monitored afterwards. Measuring converts a purchased product into an operated programme, which is the difference between the outcomes reported in successful implementations and those reported in disappointing ones.
Market Impact: Generates 4.6 events daily

Market Opportunities and Growth Drivers

Indian Private Hospital Accreditation Formalises Protocols

Indian growth of 14.6% leads every country covered, driven by private hospital chains expanding rapidly while accreditation programmes formalise infection control practices that previously varied considerably between wards within a single institution. Accreditation converts an individual clinician preference into a documented protocol with an audit attached. Domestic manufacturers supply much of that demand at prices well below imported product, which removes cost as the objection it remains elsewhere. Accreditation turns individual clinician preference into a documented protocol with an audit attached, which is what actually changes consumable volume rather than any clinical persuasion.
Market Impact: Only 12% use controls

Line Numbers Rather Than Bed Numbers Drive Volume

A critical care patient generates around 4.6 access events requiring disinfection each day, and general wards carry far more lines in total than intensive care does despite lower intensity per patient. Cap consumption therefore follows line-days rather than admissions, and the expansion from critical care into general wards multiplies volume considerably. Manufacturers sizing opportunity on intensive care beds alone consistently understate what an institution actually consumes. Expansion out of critical care into general wards multiplies consumption considerably, and manufacturers sizing opportunity on intensive care beds alone consistently understate what an institution uses.
Market Impact: Costs USD 210 per bed

Market Restraints and Challenges

Published Evidence Rarely Carries A Control Arm

About 12% of published evaluations used a concurrent control group rather than a before-and-after comparison, and the root cause is that caps are almost always introduced alongside other bundle changes that nobody can separate afterwards. Commercially it leaves value analysis committees weighing a six-figure annual line item against an effect they cannot attribute cleanly. Manufacturers respond with registry data, with stepped-wedge study designs, and with compliance-linked outcome reporting. A committee reading that literature carefully reaches a less comfortable conclusion than the marketing around it suggests. Bundle confounding is genuine and nobody has solved it.
Market Impact: Segment grows at 13.2%

Annualised Spend Rather Than Unit Price Decides

A cap costs very little and an acute bed consumes around USD 210 of them annually, which becomes a substantial institutional line item at any real scale. The root cause is that value analysis committees evaluate annualised category spend rather than the cost of a single item. Commercially it turns a trivial unit price into a contested budget decision. Manufacturers respond with total cost modelling against infection episode cost and length of stay. The committee is already performing that arithmetic without any supplier in the room, which changes who frames the conversation.
Market Impact: Audits find 74% capped
4 additional market trends, 3 additional growth drivers, and 2 additional restraints and challenges are covered in the full report. Contact sales@marketmindsadvisory.com to access the complete intelligence.

Segment CAGR and Growth Architecture

Segmentation follows access point across six categories: catheter hub and dialysis caps, implanted port and access device caps, male luer and intravenous tubing end caps, enteral and alternative line port protectors, needleless connector caps, and syringe and medication delivery caps. Antiseptic chemistry, care setting, and purchasing route are treated as separate dimensions. Cap geometry follows the access point served.
disinfection-cap-market-market-share-analysis-1790016761199

Catheter Hub And Dialysis Caps

Dialysis and catheter hub caps grow at 13.2%, half again the market rate of 8.8%, on a combination that no other access point matches. The line is opened repeatedly on a fixed schedule, the infection consequence is unusually severe, and the patient population is expanding faster than acute bed numbers almost everywhere. Outpatient dialysis units also standardise protocols across many patients at once, which makes adoption a single operational decision rather than a ward-by-ward negotiation. Cap geometry differs from needleless connector products and the two are not interchangeable, which segments supply more than most purchasers expect. Outpatient units decide once for many patients at a time. Supply segments more than purchasers expect.
CAGR 13.2%

Implanted Port And Access Device Caps

Implanted port caps grow at 11.4% as oncology and long-term infusion populations expand and as access devices remain in place for months rather than days. A port infection generally means device removal and a treatment interruption, which raises the consequence of a single failed disinfection well above a peripheral line. That severity makes the purchasing argument straightforward where it is understood, and understanding varies considerably by institution. Access frequency is lower than dialysis, so consumption per patient is smaller while the value attached to each individual event is considerably higher. Understanding of that severity varies considerably between institutions, which is why adoption in oncology is far less uniform than the clinical case would predict.
CAGR 11.4%
Full segment breakdown across 6 segments available in the complete report.

Regional Architecture and Country Demand Map

Regional shares here reflect where disinfection caps are actually being used in clinical practice rather than where any of them simply happen to be manufactured. Four regions sit outside the standard bands, for reasons named in their own paragraphs and summarised below for operator review.

North America

At 41% this sits far above the standard band, and the justification is that the product category was created and commercialised here and that bloodstream infection reporting is tied directly to hospital reimbursement in a way no other market replicates. Growth of 7.8% is moderate against a base where penetration is already high. Cap use has moved well beyond intensive care into general wards. Value analysis committees scrutinise annualised spend more rigorously here than anywhere else covered. Group purchasing organisation contracts renew rather than being contested annually, which entrenches incumbents considerably more than the underlying product difference would justify. Nursing familiarity is itself a barrier. Ward-by-ward switching is slow and expensive.
Share: 41% | CAGR: 7.8% (2026 to 2036)

Western Europe

Infection prevention practice is strong and cap adoption trails American penetration considerably, largely because reimbursement is not linked to infection reporting in the same direct way. Growth of 7.2% is the slowest of the seven regions. Nordic and Dutch institutions achieve unusually high manual scrub compliance, which genuinely reduces the incremental benefit a cap provides and makes the business case harder to construct honestly there than elsewhere. Adoption trails American penetration substantially, and the gap is a reimbursement structure difference rather than any disagreement about the underlying clinical reasoning behind capping. Nordic and Dutch institutions achieve unusually high manual scrub compliance, which genuinely reduces the incremental benefit a cap can provide there.
Share: 22% | CAGR: 7.2% (2026 to 2036)
Regional intelligence for 5 additional markets available in the complete report: East Asia, South Asia and Pacific, Latin America, Middle East and Africa, Eastern Europe. Contact sales@marketmindsadvisory.com.
disinfection-cap-market-country-cagr-analysis-1790016761762

Where Manufacturers Build Real Programmes

Four commercial moves separate manufacturers building measured programmes from those selling a consumable into a budget line. Each addresses something this category understands and rarely states: what the cap actually replaces, that capping itself needs auditing, that the evidence is uncontrolled, and that spend is evaluated annually. Three of the four are services rather than products.

Measure Their Scrub Compliance Before Quoting

Manual disinfection achieves full contact time in around 18% of observed events, and institutions vary enormously around that figure without knowing where they sit. Manufacturers conducting baseline observation before proposing report conversion rates 2.8 times higher, because the business case is built on that hospital's actual practice rather than a published average. It also identifies the minority of institutions where capping genuinely adds little, which is worth knowing early. Published averages persuade nobody who has measured their own ward. It also identifies where capping genuinely adds little, which is worth knowing early.
Market Impact: Raises purchase conversion rates to 2.8 times higher

Sell An Audited Programme Not A Product

Unannounced audits find roughly 74% of ports capped, and institutions measuring that figure achieve materially better outcomes than those assuming complete coverage. Manufacturers supplying audit tools and compliance reporting alongside the caps report account retention 3.2 times higher than product-only suppliers. A measured programme also produces the local evidence that a value analysis committee finds far more persuasive than any published study. An unmeasured implementation and a measured one produce visibly different results from exactly the same product. Local evidence persuades a committee far more reliably than any published study.
Market Impact: Raises account retention rates to 3.2 times higher

Fund Studies With Concurrent Control Arms

About 12% of published evaluations used a concurrent control group, which leaves committees weighing a substantial line item against an effect nobody can attribute cleanly. Manufacturers funding stepped-wedge or controlled designs report tender win rates 2.4 times higher against competitors citing before-and-after data. One properly designed study costs less than a year of promotional activity and produces evidence the whole field currently lacks. The whole field currently lacks that evidence entirely. One properly designed study costs less than a year of promotional activity and produces evidence competitors cannot answer quickly.
Market Impact: Raises tender win rates to 2.4 times higher

Model Annual Spend Against Episode Cost

An acute bed consumes around USD 210 of caps annually and value analysis committees evaluate that total rather than the trivial unit price. Manufacturers presenting annualised spend against attributable infection episode cost and length of stay report approval rates 2.1 times higher than those quoting price per cap. The committee is already doing that arithmetic, and arriving with it prepared changes which side of the conversation frames the decision. Arriving with the arithmetic prepared changes which side of the table frames the decision, which matters more than any individual number within it.
Market Impact: Raises committee approval rates to 2.1 times higher

Who Controls the Margin Pool

Concentration is high. Five manufacturers hold 68% of category revenue, measured consistently on that basis across all participants, and the leaders occupy positions built on early market creation and on group purchasing organisation contracts that renew rather than being contested annually across most American institutions. Barriers to entry in manufacturing are low and in clinical programme capability considerably higher, which is where the field genuinely separates.
Competition currently turns on three dimensions: compliance programme capability, which decides whether an implementation succeeds or disappoints; evidence quality, where controlled study data is scarce enough to differentiate; and cap geometry compatibility, since dialysis, port, and needleless connector products are genuinely not interchangeable. Group purchasing contract position has become a fourth dimension, and it entrenches incumbents in American institutions considerably more than product difference alone would.

Pressure builds from two directions. Indian and Chinese manufacturers supply equivalent caps at prices Western producers cannot match. Meanwhile committees scrutinise annualised spend more carefully. Rankings will shift toward manufacturers supplying audited programmes, since a measured implementation performs visibly better. Controlled evidence remains the clearest unclaimed position anywhere in this category. Nobody has claimed it at meaningful scale so far.
disinfection-cap-market-company-positioning-matrix-1790016762595

Competitive Moat and Risk Dimensions

SOLVENTUM

Moat: Category Creation And Contracts

Having established the category commercially, the business holds group purchasing organisation contracts and protocol embedding across a large installed base of American institutions where switching means rewriting documented procedures. Familiarity among nursing staff who trained on the product is itself a barrier competitors have to overcome ward by ward.
SOLVENTUM

Risk: Price Exposure To Asian Supply

The product is a moulded housing with an alcohol-saturated sponge, and Indian and Chinese manufacturers supply functionally equivalent caps at substantially lower prices. Defending premium pricing on a consumable that committees evaluate by annual spend depends increasingly on programme support rather than on the cap itself.
BECTON DICKINSON

Moat: Vascular Access Portfolio Breadth

Supplying catheters, connectors, and caps together lets the business guarantee geometry compatibility across an entire access system and negotiate as a portfolio rather than a line item. That breadth also positions it where protocol decisions are made rather than where consumables are simply reordered by a ward.
BECTON DICKINSON

Risk: Compliance Programme Capability Gap

Portfolio breadth does not produce the audit tools and compliance reporting that separate a successful capping implementation from a disappointing one. Institutions increasingly want a programme rather than a product, and building that capability requires clinical support resource rather than manufacturing scale. Clinical resource is not manufacturing scale.

Players Tracked

Prominent Players

Solventum
Becton Dickinson
ICU Medical
Merit Medical Systems
B Braun Melsungen

Other Key Players

Baxter International
Teleflex
Nexus Medical
Medline Industries
Cardinal Health
Terumo Corporation
Fresenius Medical Care
Nipro Corporation
Vygon
Poly Medicure
Romsons Group
Smiths Medical
Amsino International
Zhejiang Kindly Medical
JMS Co

Recent Developments

FEBRUARY 2026

Solventum Publishes Capping Compliance Data Alongside Efficacy Claims

Solventum began publishing audited capping compliance rates from customer institutions alongside its efficacy data, disclosing the application gap that determines whether an implementation delivers the outcomes the literature reports. Figures are reported by site rather than aggregated into an average. Customers see the range rather than an average.
Signal: Compliance measurement moves from an internal metric to a published one. Competitors must now measure or explain the omission.
SEPTEMBER 2025

Poly Medicure Expands Disinfection Cap Production In India

Poly Medicure completed an organic capacity expansion for disinfection cap manufacture, funded internally with no partner involved, after private hospital accreditation demand and export orders together outran available moulding and sterile packaging throughput. Sterile packaging rather than moulding had been the constraint. Export orders were served alongside.
Signal: Indian capacity now serves domestic accreditation demand and export simultaneously. Domestic supply removes the cost objection entirely.
MAY 2025

ICU Medical Acquires Implanted Port Protector Specialist

ICU Medical completed an acquisition of an implanted port protector specialist, adding cap geometries for oncology and long-term infusion access that its needleless connector range could not physically serve. Oncology channel relationships came with the geometries and mattered nearly as much to the rationale. Geometries were the stated rationale.
Signal: Geometry coverage is being bought because caps are not interchangeable. Full geometry coverage turns partial accounts into whole ones.

What A Cap Costs To Make

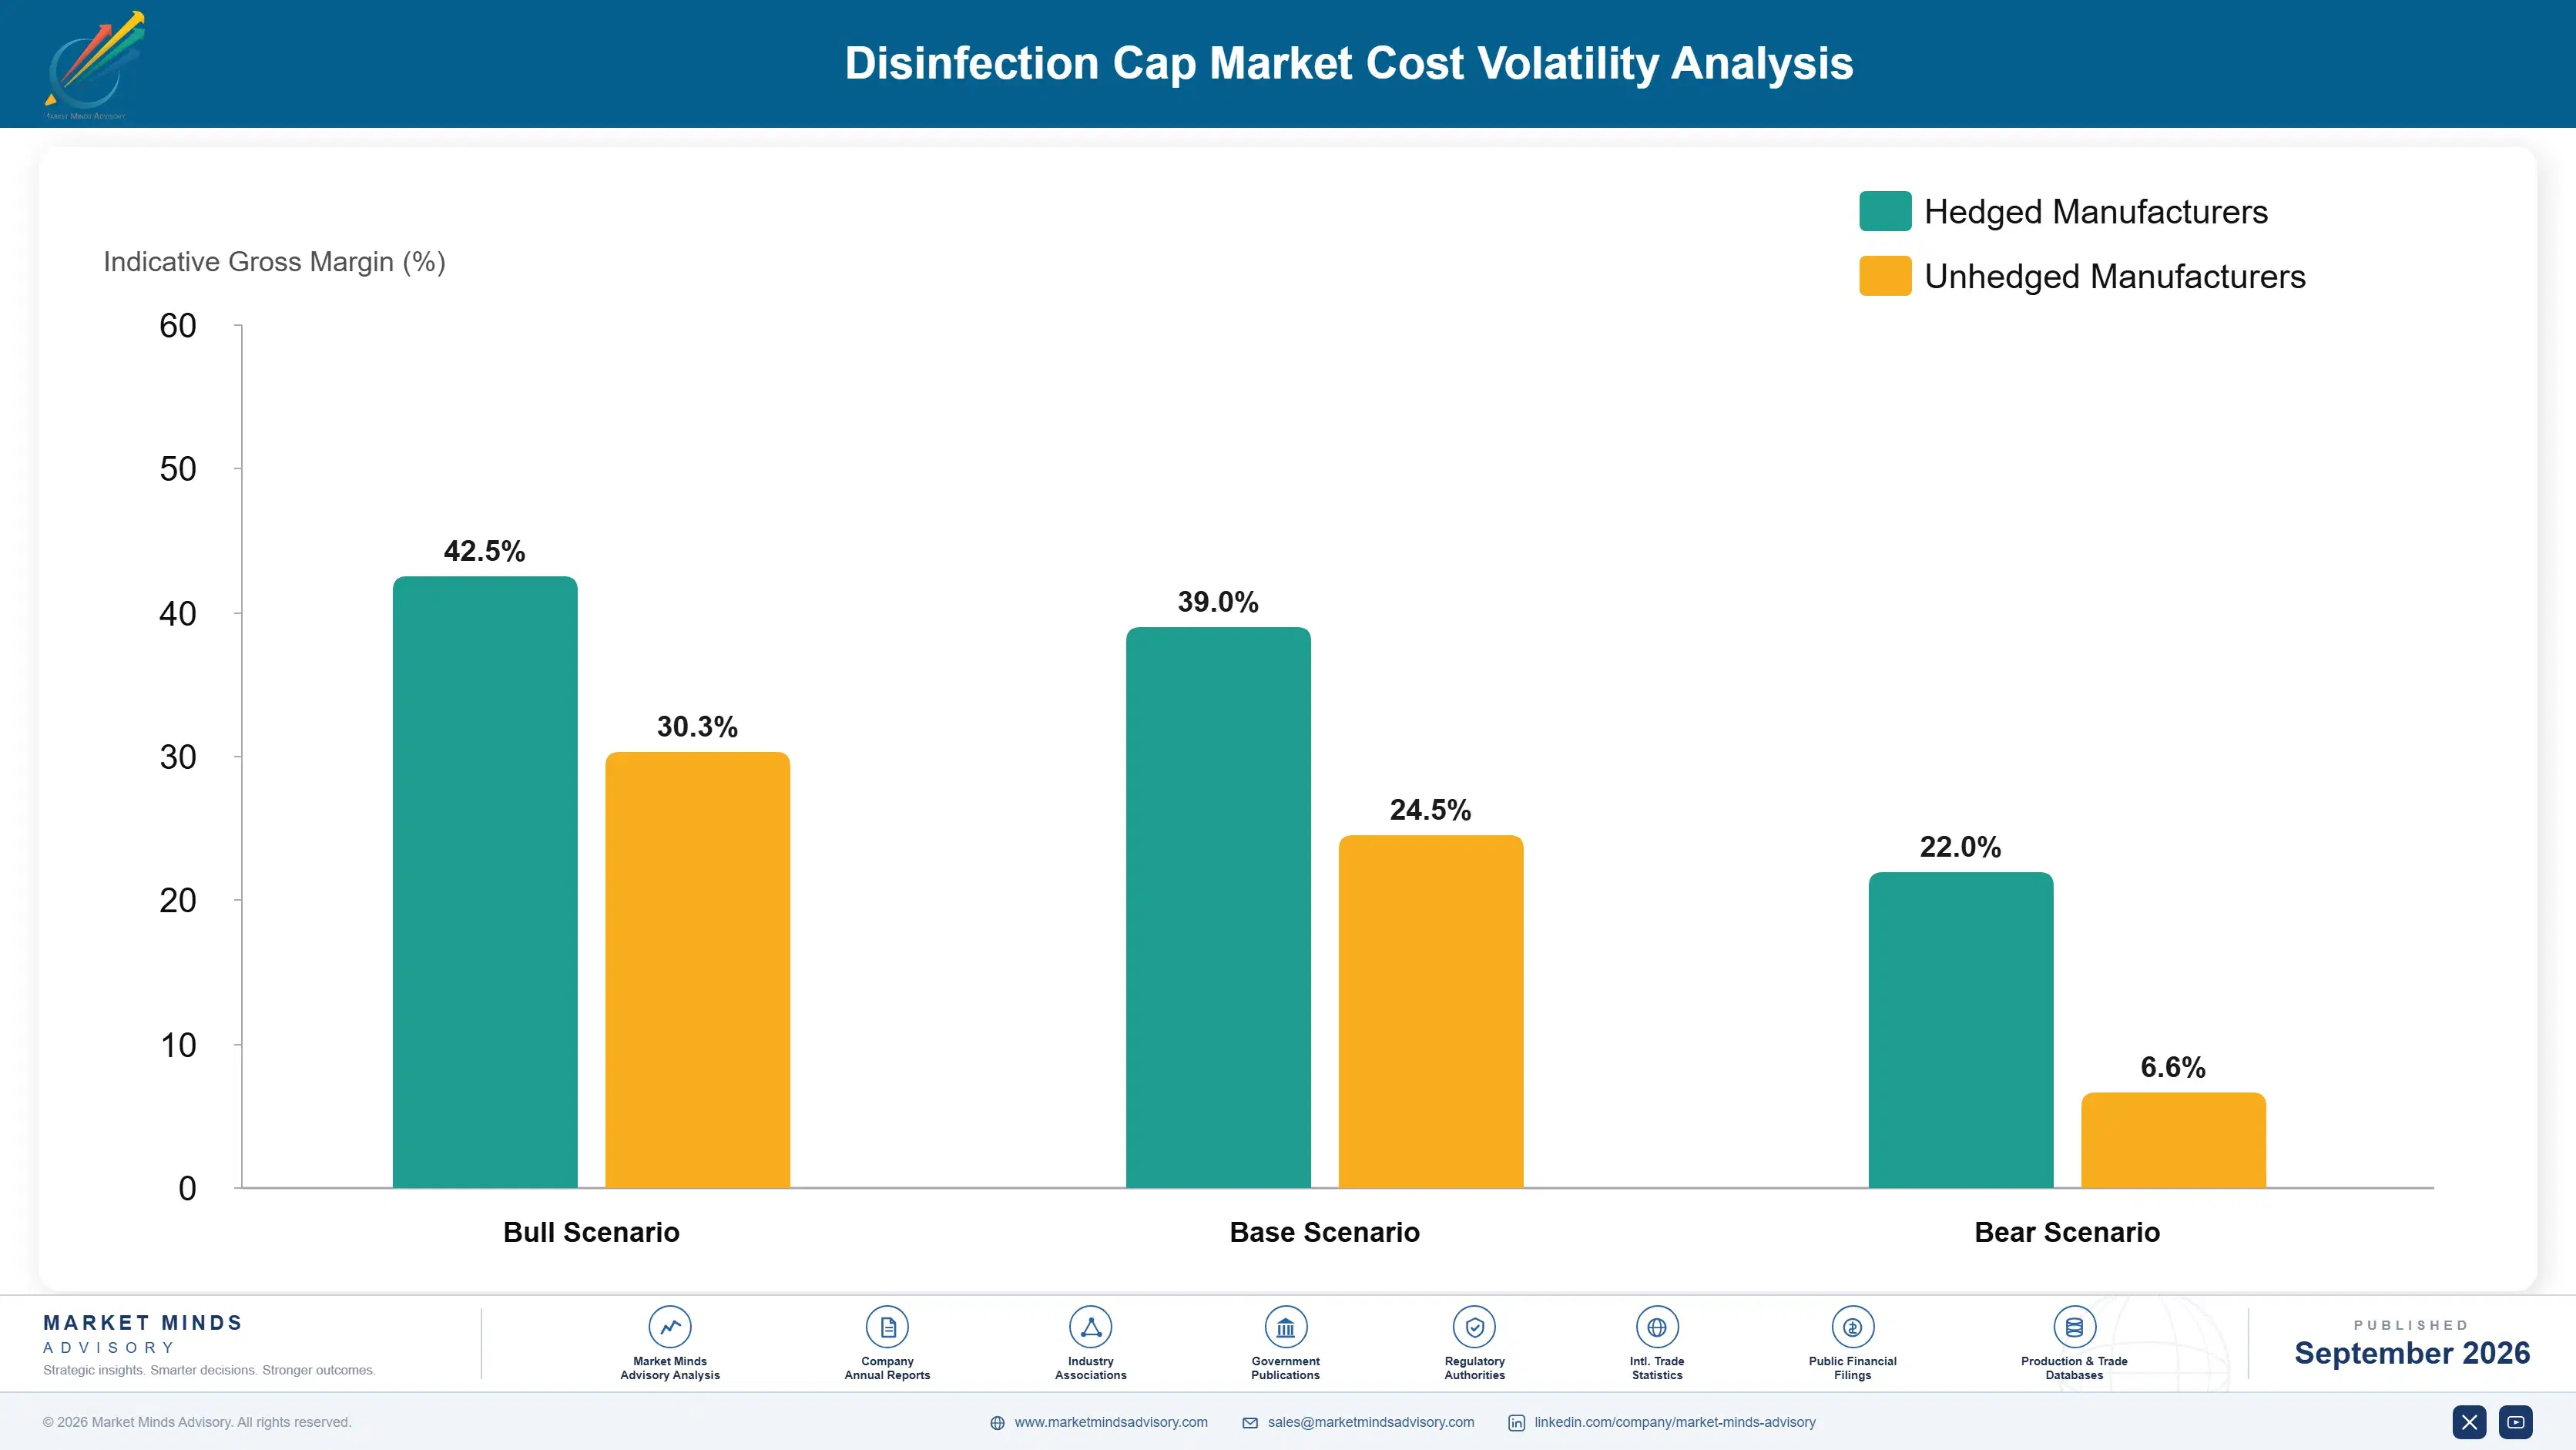
Three cost groups dominate. Sterile packaging, sterilisation, and validation run 34% to 42% of cost of goods sold, which is high relative to the item and follows from single-use sterile device requirements. Injection-moulded housing takes 30% to 38%. Antiseptic loading and the carrier sponge add 22% to 30%, with chlorhexidine formulations at the upper end of that range.
Isopropyl alcohol and polypropylene pricing moved through 2024 and 2025 as petrochemical feedstock and solvent demand shifted across several unrelated sectors, and American Chemistry Council statistics documented the underlying movements. Several manufacturers described the resulting margin pressure in their annual reports. Sterilisation capacity costs followed an entirely separate path tied to facility availability rather than to any input price. Neither movement had anything to do with clinical demand.

The competitive disadvantage mechanism runs through clinical support resource rather than through manufacturing. A cap costing a few cents to make is sold into a programme requiring baseline observation, training, and compliance auditing, and a manufacturer without that resource competes purely on price against Asian supply. Exposure varies by commercial model rather than by moulding efficiency or purchasing scale.
disinfection-cap-market-cost-volatility-analysis-1790016762906

Build Clinical Support Rather Than Moulding Capacity

The cap itself is a moulded housing and a saturated sponge that many manufacturers can produce competently at low cost. What distinguishes a successful implementation is baseline observation, training, and compliance auditing, and that resource is what a purchasing committee is actually buying when it selects a supplier. That resource is what a committee is genuinely buying.

Secure Sterilisation Capacity Under Contract

Sterile packaging and sterilisation approach two fifths of cost of goods sold, and capacity availability rather than price is the constraint that periodically disrupts supply across the whole medical consumable sector. Contracted capacity protects continuity on a product whose absence from a ward interrupts a documented protocol immediately. An absent cap interrupts a documented protocol immediately.

Match Geometry Coverage To Access Device Ranges

Dialysis, implanted port, and needleless connector caps are not interchangeable, and an institution with mixed access devices needs several geometries or several suppliers. Covering the full range converts a partial supply relationship into the whole account, which is worth considerably more than the incremental manufacturing complexity involved. Mixed access devices otherwise require several suppliers.

Portfolio Architecture for Margin Defence

Margin follows programme content rather than the cap itself. Basic needleless connector caps compete close to commodity terms against Asian supply of equivalent construction. Syringe and tubing end caps earn moderately on lower competitive intensity. Specialised dialysis and port geometries earn better on limited substitution, and audited programmes with compliance reporting earn most, because the institution is buying support rather than plastic. The margin spread across those four groups is wide for a sterile consumable.
The tension between volume and premium runs through who is making the decision. A procurement team reordering an established consumable compares price per cap and switches on a tender. A value analysis committee approving a new protocol evaluates evidence, support, and total annual spend, and that decision holds for years once documented procedures reference a specific product.

High-value pools concentrate where the consequence of a single failure is highest: dialysis access, implanted ports in oncology, and neonatal and paediatric intensive care. Where the requirement is capping peripheral lines on a general ward at scale, price decides and functionally equivalent supply is widely available at considerably lower cost. That divide follows consequence rather than volume.

Volume / Commodity-Adjacent

Basic needleless connector and tubing end caps supplied on tender against Asian manufacturers of equivalent construction. The ten-point range reflects moulding scale and sterilisation contracting rather than any performance property a clinician could distinguish in use.
Gross Margin: 34% to 44%

Premium / Certified

Dialysis, implanted port, and specialised geometry caps where substitution options are genuinely limited by physical compatibility. The twelve-point range separates manufacturers covering a full geometry range from those serving only the highest volume access points.
Gross Margin: 48% to 60%

Sustainability / Regulatory / Next-Generation

Audited capping programmes with baseline observation, training, compliance reporting, and controlled study evidence behind them. The fourteen-point range reflects clinical support depth, which is what a value analysis committee is genuinely purchasing.
Gross Margin: 62% to 76%
disinfection-cap-market-portfolio-architecture-1790016763728

High-value Sub-segments and Strategic Watch-out

Audited Compliance Programmes

Highest value in the category, since a measured implementation performs visibly better than an identical product used unmonitored. The fourteen-point range reflects support resource depth, which competitors selling only caps cannot supply at any price. Local evidence persuades committees far better than published studies do.
Gross Margin: 64% to 78%

Dialysis And Port Geometries

High value growing at 13.2% where access frequency and infection consequence are both highest across clinical practice. The twelve-point range reflects geometry coverage, since these caps are physically incompatible with needleless connector products. Substitution options are genuinely limited by physical fit. Access frequency is highest here.
Gross Margin: 50% to 62%

Controlled Evidence Supported Ranges

Volume core where a concurrent control study distinguishes a supplier in a field where roughly one evaluation in eight has one. The twelve-point range reflects study design quality rather than simply whether any published data exists. Bundle confounding makes attribution difficult for everybody. Design quality decides persuasion.
Gross Margin: 44% to 56%

Basic Needleless Connector Caps

The strategic watch-out. Construction is a moulded housing and a saturated sponge, Asian supply matches it, and committees compare annual spend. The ten-point range reflects moulding scale and sterilisation contracting alone. Annual spend rather than unit price decides the tender. Asian supply matches construction exactly.
Gross Margin: 32% to 42%

How This Demand Recurs

Consumption follows line-days rather than admissions, which makes it unusually predictable once a protocol is documented. A critical care patient generates around 4.6 access events daily and a general ward carries far more lines in total at lower intensity. An institution that has written capping into procedure consumes on a schedule that varies only with census, and the supplier holding that protocol reference holds the volume.
Attachment depth follows documentation rather than satisfaction. Once a specific product appears in a written procedure and nursing staff have trained on it, switching means rewriting the procedure and retraining wards, which nobody undertakes to save a few cents per cap. Institutions without that documentation reorder on tender and switch freely, and the difference between the two situations is entirely administrative. Documentation predicts retention almost exactly.

The buyer has moved from clinical champions toward value analysis committees, which changed what the conversation contains. A clinician discusses infection risk and protocol. A committee discusses annualised spend, attributable outcome, and evidence quality, and a supplier arriving with efficacy claims and no controlled data is answering questions that person is not asking.
disinfection-cap-market-end-use-penetration-index-1790016764568

Where This Market Rewards

These are among the four positions where our research anticipates prominent divergence between winners and laggards over the coming forecast period. Each is grounded in the demand model, the regulatory perimeter, and the announced capacity pipeline.
01 / BASELINE PRACTICE OBSERVATION

Measure their scrubbing before selling

Manual hub disinfection achieves the full recommended contact time in roughly 18% of observed events, and individual institutions vary enormously around that figure without knowing where they actually sit. Manufacturers conducting baseline observation before proposing anything report conversion rates 2.8 times higher than competitors quoting published averages instead. It also identifies the minority of institutions where capping genuinely adds little, which is worth establishing early rather than late, and published averages persuade nobody who has already measured their own wards.
02 / PROGRAMME RATHER THAN PRODUCT

A quarter of ports sit uncapped

Unannounced ward audits find around 74% of ports carrying a cap, and institutions that measure that figure achieve materially better outcomes than those assuming complete coverage from the order date. Manufacturers supplying audit tools and compliance reporting alongside the caps report account retention 3.2 times higher than suppliers offering the product alone. A measured programme also generates local evidence that committees find far more persuasive than published studies, which is what a value analysis committee finds hardest to argue with in practice.
03 / CONTROLLED EVIDENCE GENERATION

One evaluation in eight has controls

About 12% of published evaluations used a concurrent control arm, because caps are almost always introduced alongside other bundle changes nobody can separate afterwards. Manufacturers funding stepped-wedge or otherwise controlled designs report tender win rates 2.4 times higher than competitors citing before-and-after data alone. A single properly designed study costs less than a year of promotional activity and produces evidence the entire field currently lacks, and being first with it in a tender is a position competitors cannot quickly answer.
04 / ANNUALISED COST FRAMING

Nobody buys one cap

An acute inpatient bed consumes around USD 210 of caps each year, and value analysis committees evaluate that annual total rather than the trivial price of any single item. Manufacturers presenting annualised spend against attributable infection episode cost and length of stay report approval rates 2.1 times higher than competitors simply quoting unit price. The committee is already doing that arithmetic without the supplier in the room, so arriving prepared decides which side of the table frames the whole decision.

Engagement Snapshot From the Field

A live engagement with an industry participant carrying material or product regulatory and market exposure ahead of a defining policy shift, showing how our research translates into a defensible multi-year portfolio strategy.
MARKET MINDS ADVISORY · CLIENT ENGAGEMENT SUMMARY
Disinfection Cap Producer Strategic Portfolio Review and Transition Roadmap 2026·Investment Scenario on Disinfection Cap Exposure Evaluation 2025-26
CLIENT PROFILE
A hospital network operating fourteen acute sites with annual disinfection cap spend near USD 4.1 million (client-reported, unverified by MMA). Bloodstream infection rates had improved at four sites and remained unchanged at the other ten following a network-wide capping rollout using identical products and identical written protocols throughout. The board wanted the variation explained before any further procurement decision was taken.
STRATEGIC CHALLENGE
Infection prevention leadership attributed the variation to case mix and had proposed switching to a higher specification cap across the network. Nobody had audited whether ports were actually being capped at the sites where results had not improved, or how the four successful sites differed operationally. Case mix and compliance imply entirely different remedies.
MMA APPROACH
MMA conducted unannounced capping audits across all fourteen sites, compared audit results against infection rate change, reviewed implementation and training records site by site, and modelled outcomes under product substitution, compliance auditing, and targeted retraining programmes. Staff turnover since implementation was reviewed alongside, since nobody had arranged training for anybody joining after the original rollout.
KEY FINDINGS
  1. Capping compliance ranged from 41% to 92% across the network on identical protocols, and the four improved sites were the four with the highest measured compliance.
  2. The ten unchanged sites had never audited capping compliance after implementation, and staff at several believed coverage was near complete. Nobody had checked the assumption.
  3. Training had been delivered once at rollout across all sites, with no refresher and no arrangement for staff who joined afterwards to receive it at all.
  4. Switching to a higher specification cap would have changed the product at sites where the existing product was frequently not being applied.
CLIENT PROFILE
A hospital network operating fourteen acute sites with annual disinfection cap spend near USD 4.1 million (client-reported, unverified by MMA). Bloodstream infection rates had improved at four sites and remained unchanged at the other ten following a network-wide capping rollout using identical products and identical written protocols throughout. The board wanted the variation explained before any further procurement decision was taken.
STRATEGIC CHALLENGE
Infection prevention leadership attributed the variation to case mix and had proposed switching to a higher specification cap across the network. Nobody had audited whether ports were actually being capped at the sites where results had not improved, or how the four successful sites differed operationally. Case mix and compliance imply entirely different remedies.
MMA APPROACH
MMA conducted unannounced capping audits across all fourteen sites, compared audit results against infection rate change, reviewed implementation and training records site by site, and modelled outcomes under product substitution, compliance auditing, and targeted retraining programmes. Staff turnover since implementation was reviewed alongside, since nobody had arranged training for anybody joining after the original rollout.
KEY FINDINGS
  1. Capping compliance ranged from 41% to 92% across the network on identical protocols, and the four improved sites were the four with the highest measured compliance.
  2. The ten unchanged sites had never audited capping compliance after implementation, and staff at several believed coverage was near complete. Nobody had checked the assumption.
  3. Training had been delivered once at rollout across all sites, with no refresher and no arrangement for staff who joined afterwards to receive it at all.
  4. Switching to a higher specification cap would have changed the product at sites where the existing product was frequently not being applied.
RECOMMENDED STRATEGY
Phase 1: Phase one: halt the product switch and introduce monthly unannounced capping audits with results reported to each ward directly. Product was never the variable. Phase 2: Phase two: rebuild training as a recurring programme covering new staff rather than a single event at implementation. Turnover had eroded the original training. Phase 3: Phase three: make capping compliance a reported quality metric alongside the infection rate it is intended to influence. Wards respond to their own numbers.
OUTCOME
Network capping compliance reached 86% within three quarters of audit introduction (client-reported, unverified by MMA). Infection rates improved at seven of the ten previously unchanged sites. The product substitution programme was cancelled entirely. Capping compliance is now reported monthly alongside the infection rate at every site.

Frequently Asked Questions

Foundational context covering the market sizes, CAGR, scope, country, region and competition that inform every finding below. This section is provided to cover basics and most often pre-purchase conversations, answered from the MMA Primary Research Dataset.

What is the current size of the Disinfection Cap Market?

The market was worth USD 0.6 billion in 2025 and reaches USD 0.7 billion in 2026. Value covers single-use antiseptic caps for vascular and enteral access points.

How large will the Disinfection Cap Market be by 2036?

MMA forecasts USD 1.6 billion by 2036, an increase of USD 0.9 billion across the forecast period. That represents 2.29 times the 2026 base of USD 0.7 billion.

What is the CAGR for the Disinfection Cap Market 2026 to 2036?

The base case compound annual growth rate is 8.8%, with a bull case at 10.0% and a bear case at 7.6%. Historical growth from 2020 to 2025 ran at 7.4%.

Which segment is growing fastest?

Catheter hub and dialysis caps grow at 13.2%, half again the market rate of 8.8%. Dialysis access is opened repeatedly and carries the highest infection consequence of any routine line.

Who are the major companies in the Disinfection Cap Market?

Solventum, Becton Dickinson, ICU Medical, Merit Medical Systems, and B Braun Melsungen lead the category. Together they hold 68% of revenue, making this among the most concentrated markets covered.

Which country is growing fastest?

India grows at 14.6%, the fastest of any country covered here. Private hospital chain expansion runs alongside accreditation programmes that convert individual clinician preference into documented and audited protocol.

Report Segmentation Architecture

The full report scope spans multiple orthogonal segmentation dimensions, with cross-tabulated demand data provided for each dimension pair. Coverage extends further to regional breakdowns, trend trajectories, and the competitive detail needed to support segment-level decision-making.

By Access Point

  • Catheter Hub and Dialysis Caps
  • Implanted Port and Access Device Caps
  • Male Luer and Intravenous Tubing End Caps
  • Enteral and Alternative Line Port Protectors
  • Needleless Connector Caps
  • Syringe and Medication Delivery Caps

By End-Use Industry

  • Critical Care and Intensive Care Units
  • General Acute Inpatient Wards
  • Outpatient Dialysis Centres
  • Oncology and Infusion Centres
  • Neonatal and Paediatric Care
  • Home Infusion and Community Care

By Commercial Dimension

  • Group Purchasing Organisation Contracts
  • Direct Hospital Tender Supply
  • Medical Distributor Networks
  • Dialysis Provider Contracts
  • Value Analysis Committee Approval
  • Clinical Programme and Audit Services

By Region

  • North America
  • Western Europe
  • East Asia
  • South Asia and Pacific
  • Latin America
  • Middle East and Africa
  • Eastern Europe

Scope, Methodology, and Coverage

Every figure in this report is reproducible from documented input assumptions. The scope below maps the historical period, the forecast horizon, the segmentation dimensions, and the countries covered, alongside the underlying primary and qualitative methodology.
Historical Period
2020 to 2025
Forecast Period
2026 to 2036
Base Year
2025 (USD billions; MMA Primary Research Dataset, September 2026)
Market Definition
This market covers single-use antiseptic-impregnated caps that disinfect and protect vascular and enteral access points, across catheter hub and dialysis caps, implanted port and access device caps, male luer and intravenous tubing end caps, enteral and alternative line port protectors, needleless connector caps, and syringe and medication delivery caps. It excludes alcohol prep pads and swabs, antiseptic wipes, catheter securement devices, dressings, and disinfectant sprays or liquids.
Quantitative Units
USD billions, revenue at manufacturer selling price
Segmentation Dimensions
Access point, care setting, commercial dimension, region
Regions Covered
North America, Western Europe, East Asia, South Asia and Pacific, Latin America, Middle East and Africa, Eastern Europe
Countries Covered
United States, Canada, Mexico, Germany, United Kingdom, France, Netherlands, Italy, Spain, Sweden, Poland, Czechia, Japan, South Korea, China, Taiwan, India, Australia, Indonesia, Thailand, Vietnam, Brazil, Colombia, Chile, Argentina, Saudi Arabia, United Arab Emirates, Qatar, Egypt, South Africa
Key Companies Profiled
Solventum, Becton Dickinson, ICU Medical, Merit Medical Systems, B Braun Melsungen, Baxter International, Teleflex, Nexus Medical, Medline Industries, Cardinal Health, Terumo Corporation, Fresenius Medical Care, Nipro Corporation, Vygon, Poly Medicure, Romsons Group, Smiths Medical, Amsino International, Zhejiang Kindly Medical, JMS Co
Quantitative Methodology
Primary survey, n=3,800 respondents, Q4 2025, six countries; demand-side model with trade association cross-validation
Qualitative Methodology
47 expert interviews, Q4 2025; applied to validate demand model assumptions, identify emerging dynamics, and assess competitive positioning
Report Format
PDF and XLSX data workbook (Word format preview document)
Publisher
Market Minds Advisory
Report Code
MMA-2026-MED-441
Published
September 2026
Contact
sales@marketmindsadvisory.com | www.marketmindsadvisory.com

Purchase the full Disinfection Cap Market Report (2026 to 2036).

The full report sizes the disinfection cap market across six access points, seven regions, and thirty countries, with forecasts to 2036 under base, bull, and bear cases. It establishes what the cap actually replaces in clinical practice, measures capping compliance against the coverage that purchasing decisions assume, and assesses how much published evidence carries a concurrent control arm. Competitive analysis covers twenty participants evaluated consistently on category revenue, with detailed treatment of clinical support and audit capability. Cost structure, annualised institutional spend, and geometry compatibility are analysed throughout. Primary research includes 3,800 survey responses and 47 expert interviews.
Six access point categories sized and forecast separately
Twenty participants evaluated on category revenue consistently
Manual scrub compliance compared against capping compliance rates
Published evidence assessed by study design and control arm
Annualised institutional spend modelled against infection episode cost
Cap geometry compatibility mapped across access device ranges

Built For The People Who Decide

From boardroom strategy to bench-side execution, this report is read cover-to-cover by leaders shaping the next decade of their industry, turning demand scenarios, market dynamics and valuation benchmarks into decisions.
CXOs/ Presidents/ VPs/ Managers
M&A and Corporate Development
Strategy Teams and R&D Heads
Procurement and Product Directors
Regulatory and Compliance Leaders
Investor Relations and Equity Analysts