Market Minds Advisory
Disinfectant Chemicals Market

Disinfectant Chemicals Market: Contact Time Claims, Registration Economics, and Material Compatibility Nobody Budgets For

What a hospital buys is a registered efficacy claim with a contact time short enough that staff will actually observe it, and the chemistry underneath is rarely the deciding factor at all.

Lead Analyst

Bilal Shaikh

Published

September 2026

Make Smarter Decisions with Customized Research Insights

Request a free sample report and evaluate market opportunities, growth trends, and competitive dynamics relevant to your business needs.

2025 MARKET VALUE$11.4BMarket Size 2025
2036 FORECAST VALUE$20.1BBase Case , 2026 to 2036
CAGR 2026 TO 20365.3 %Bull 6.5% / Bear 4.1%
INCREMENTAL OPPORTUNITY$8.1BNet 10- year value creation
EXPANSION MULTIPLE1.68x2036 value over 2026 base
Strategic Levers
M&A Pipeline
Regional Outlook
Country Rankings
Competitive Intelligence
Segmental Deep-dive
Call-Us : 91 93563 13602

Executive Snapshot and Market Trajectory

The pandemic gave this industry three extraordinary years and a hangover that took two more to clear. What remains underneath is a market driven by infection control protocol and registration status rather than by any surge in hygiene awareness. Protocol, not panic, is what sustains it now. Registration decides everything.
Commercial power sits with suppliers holding registered efficacy claims at short contact times rather than with anyone able to formulate an effective disinfectant. Advanced oxidation and silver-based systems grow fastest at 9.8%, roughly 1.85 times the market, on residual activity claims conventional chemistry cannot make. East Asia holds 29% of global value, carried by healthcare expansion and food processing scale across the region.
Concentration is low at roughly 34% for the top five, because registration is national and distribution is local. A single efficacy claim costs around USD 850,000 to register per market. Material compatibility failures destroy more equipment than most buyers ever budget for, and that quietly shapes which products get approved for use. Device makers publish approved product lists, and a chemical absent from them cannot enter that facility whatever its efficacy dossier demonstrates.
Market Definition
The market comprises disinfectant active chemicals and formulated disinfectant products for professional, institutional, and industrial surface and instrument use, covering quaternary ammonium compounds, chlorine-based disinfectants, hydrogen peroxide and peracetic acid, alcohol-based disinfectants, phenolic and aldehyde disinfectants, and advanced oxidation and silver-based systems. Value is measured at supplier level. Cooling water treatment biocides, drinking water treatment chemicals, cosmetic preservatives, antibiotic pharmaceuticals, sterilisation equipment, and personal antiseptics fall outside scope.
Base Year Value
$11.4B in 2025 (MMA Primary Research Dataset, August 2026)
Forecast Period
2026 to 2036, eleven discrete annual values
CAGR
5.3% base case. Bull 6.5%. Bear 4.1%.
Fastest Growth Segment
Advanced Oxidation and Silver-Based Systems: 9.8% CAGR
Fastest Growth Country
India: 8.4% CAGR
Fastest Growth Region
South Asia and Pacific: 7.5% CAGR
Largest Region
East Asia: 29% of 2025 global value
Market Leaders
Ecolab, Diversey, Reckitt Benckiser, Lonza, and Stepan Company lead on disinfectant chemical revenue. Source: company annual reports and MMA Analysis, July 2026.
Primary Survey
n=3,800 procurement and R&D decision-makers, Q4 2025, six countries
Methodology
Demand-side build-up, cross-validated against public data, 47 expert interviews

Disinfectant Chemicals Market Forecast Scenarios

disinfectant-chemicals-market-size-forecast-scenario-1787549229602
Between 2020 and 2025 the market rose violently and then fell back. Demand roughly doubled in some categories through 2020 and 2021 as institutions disinfected surfaces continuously, capacity was added everywhere, and prices spiked. Volumes then collapsed as evidence shifted toward airborne transmission and protocols relaxed. The 4.2% historical growth averages a boom and a correction, and says little about underlying demand.
The 5.3% base case rests on three mechanisms. Healthcare-associated infection reduction targets keep tightening in hospital accreditation and reimbursement frameworks, which converts disinfection from a housekeeping cost into a clinical requirement with audit consequences. Food processing regulation continues to drive peracetic acid use where no-rinse operation matters. And regulatory attrition among quaternary ammonium compounds and aldehydes keeps pushing volume toward newer chemistry at higher cost per litre. None of the three depends on hygiene awareness holding at pandemic levels.
The 6.5% bull case assumes infection control targets tighten further and antimicrobial resistance concerns extend formally to biocide stewardship. The 4.1% bear case reflects institutional budget pressure, protocol simplification after the pandemic overcorrection, and private label products taking share in commercial cleaning where efficacy claims matter less than price. Institutional budgets decide more than clinical evidence in either case.

Buying a Registered Claim, Not a Chemical

Three things set the commercial shape of this market. Registered claims come first, because a disinfectant may only be sold against the organisms and contact times its dossier supports, and each claim in each jurisdiction costs real money to establish. Contact time comes second, and it is where products genuinely differentiate. Material compatibility comes third and causes more commercial trouble than anyone expects. Each eliminates products before commercial discussion begins.
TOP-FIVE CONCENTRATION34%Share of global disinfectant supply held by leading producers
AVERAGE SELLING PRICEUSD 3.80 per litreBlended concentrate pricing across professional and institutional grades
HEALTHCARE DEMAND SHARE31%Portion of value consumed by hospital and clinical settings
REGISTRATION DOSSIER COSTUSD 850,000Typical dossier cost per efficacy claim in one market
CONTACT TIME REQUIREMENT4 minutesTypical wet contact needed for full spectrum efficacy
CONCENTRATE DILUTION RATIO1 to 128Typical dilution applied at point of use professionally
The contact time point deserves emphasis. A product claiming full spectrum efficacy at ten minutes and one claiming it at one minute are not competing on equal terms, because nobody in a working hospital keeps a surface visibly wet for ten minutes. The shorter claim is therefore the only one that describes what actually happens, and infection control teams have grown sophisticated about that.
Material compatibility is the quiet destroyer. Aggressive disinfectants crack plastic housings, degrade touchscreen coatings, corrode metal fittings, and void warranties on equipment costing far more than a decade of disinfectant supply. Device manufacturers now publish approved product lists, and a chemical absent from those lists cannot be used in that facility whatever its efficacy data shows. Efficacy data cannot substitute for a listing.
"Ask an infection control nurse what matters and she will not say log reduction. She will say whether the wipe dries before the contact time is up, and whether the last product ate the seals on twelve thousand pounds worth of monitors. Efficacy is the entry ticket; everything commercial happens after that."
Practice Director, Hygiene Chemicals and Infection Prevention · MMA Chemicals and Materials Practice · August 2026

Market Trends

Short Contact Time Claims Reset Competitive Positioning

Full spectrum efficacy at one minute rather than ten changes what a product actually delivers in a working environment, because staff cannot keep surfaces visibly wet for extended periods and rarely try. Infection control teams have become sophisticated about the gap between label claim and observed practice, and audit protocols increasingly check achieved contact time rather than product selection alone. Suppliers who invested in generating short contact time data hold positions competitors cannot reach without repeating the full registration process. The typical requirement now sits near four minutes and continues falling as newer chemistry demonstrates faster kill.
Market Impact: Healthcare takes 31% of value
Material Compatibility Lists Now Gate Product Selection

Medical device and equipment manufacturers publish approved disinfectant lists because aggressive chemistry cracks housings, clouds displays, and corrodes fittings on assets costing far more than years of consumable supply. A product absent from those lists cannot be used in facilities running that equipment, regardless of what its efficacy dossier demonstrates. That has turned compatibility testing from a technical afterthought into a commercial gating requirement. Suppliers who test against major device platforms and secure listing hold access that no efficacy advantage can substitute for, and the testing itself is neither difficult nor expensive.
Market Impact: Peroxide chemistry grows at 7.4%

Market Opportunities and Growth Drivers

Infection Control Targets Convert Disinfection Into a Clinical Requirement

Hospital accreditation frameworks and reimbursement rules increasingly penalise healthcare-associated infection rates, which moves surface disinfection from a housekeeping line item into a clinical protocol with audit consequences attached. Healthcare already takes 31% of market value and buys on documented efficacy rather than on price per litre. Protocols specify products by name, contact time, and application method, and changing one requires infection control committee approval rather than a purchasing decision. That makes each specification durable and each loss slow to reverse, which is why suppliers invest so heavily in clinical evidence.
Market Impact: Dossiers cost $850,000 each

Peracetic Acid Adoption Grows Wherever No-Rinse Operation Matters

Food and beverage processing needs disinfection between production runs without a rinse step that would add time and water, and peracetic acid decomposes to acetic acid, water, and oxygen leaving nothing requiring removal. That property makes it difficult to displace in dairy, brewing, meat, and produce washing operations regardless of its handling requirements. Regulatory acceptance for no-rinse use is well established across major markets. Volume grows with processing capacity rather than with any hygiene trend, which makes it steadier than healthcare demand and far steadier than commercial cleaning. Handling requirements deter nobody who needs it.
Market Impact: Reviews cover over 20 substances

Market Restraints and Challenges

Registration Costs Multiply Across Claims and Jurisdictions

A dossier supporting one efficacy claim in one market costs around USD 850,000, and a professional product typically carries several claims across several jurisdictions before it can be sold internationally. The root cause is regulatory design, since each organism claim requires its own test data and each authority reviews independently. That cost falls per claim regardless of the volume it eventually supports, which makes niche applications and smaller markets uneconomic to register for. Suppliers mitigate by prioritising claims by addressable volume, sharing data across related formulations, and licensing registrations to regional partners.
Market Impact: Contact times fall below 4 minutes

Quaternary Ammonium Compounds Face Widening Regulatory Pressure

Quats remain the workhorse of institutional disinfection and face growing scrutiny over environmental persistence, aquatic toxicity, and possible contribution to antimicrobial resistance through sublethal exposure. The root cause is that they persist by design, since residual activity on surfaces is precisely what makes them useful. Several formulations have already been restricted and reviews continue in Europe and North America. Suppliers mitigate by developing peroxide and advanced oxidation alternatives, reformulating to lower concentrations, and funding environmental fate studies that address specific regulatory concerns rather than defending the category generally. Residual activity is precisely the property regulators find hardest to accept.
Market Impact: Listing gates above 30% of facilities
4 additional market trends, 3 additional growth drivers, and 2 additional restraints and challenges are covered in the full report. Contact sales@marketmindsadvisory.com to access the complete intelligence.

Segment CAGR and Growth Architecture

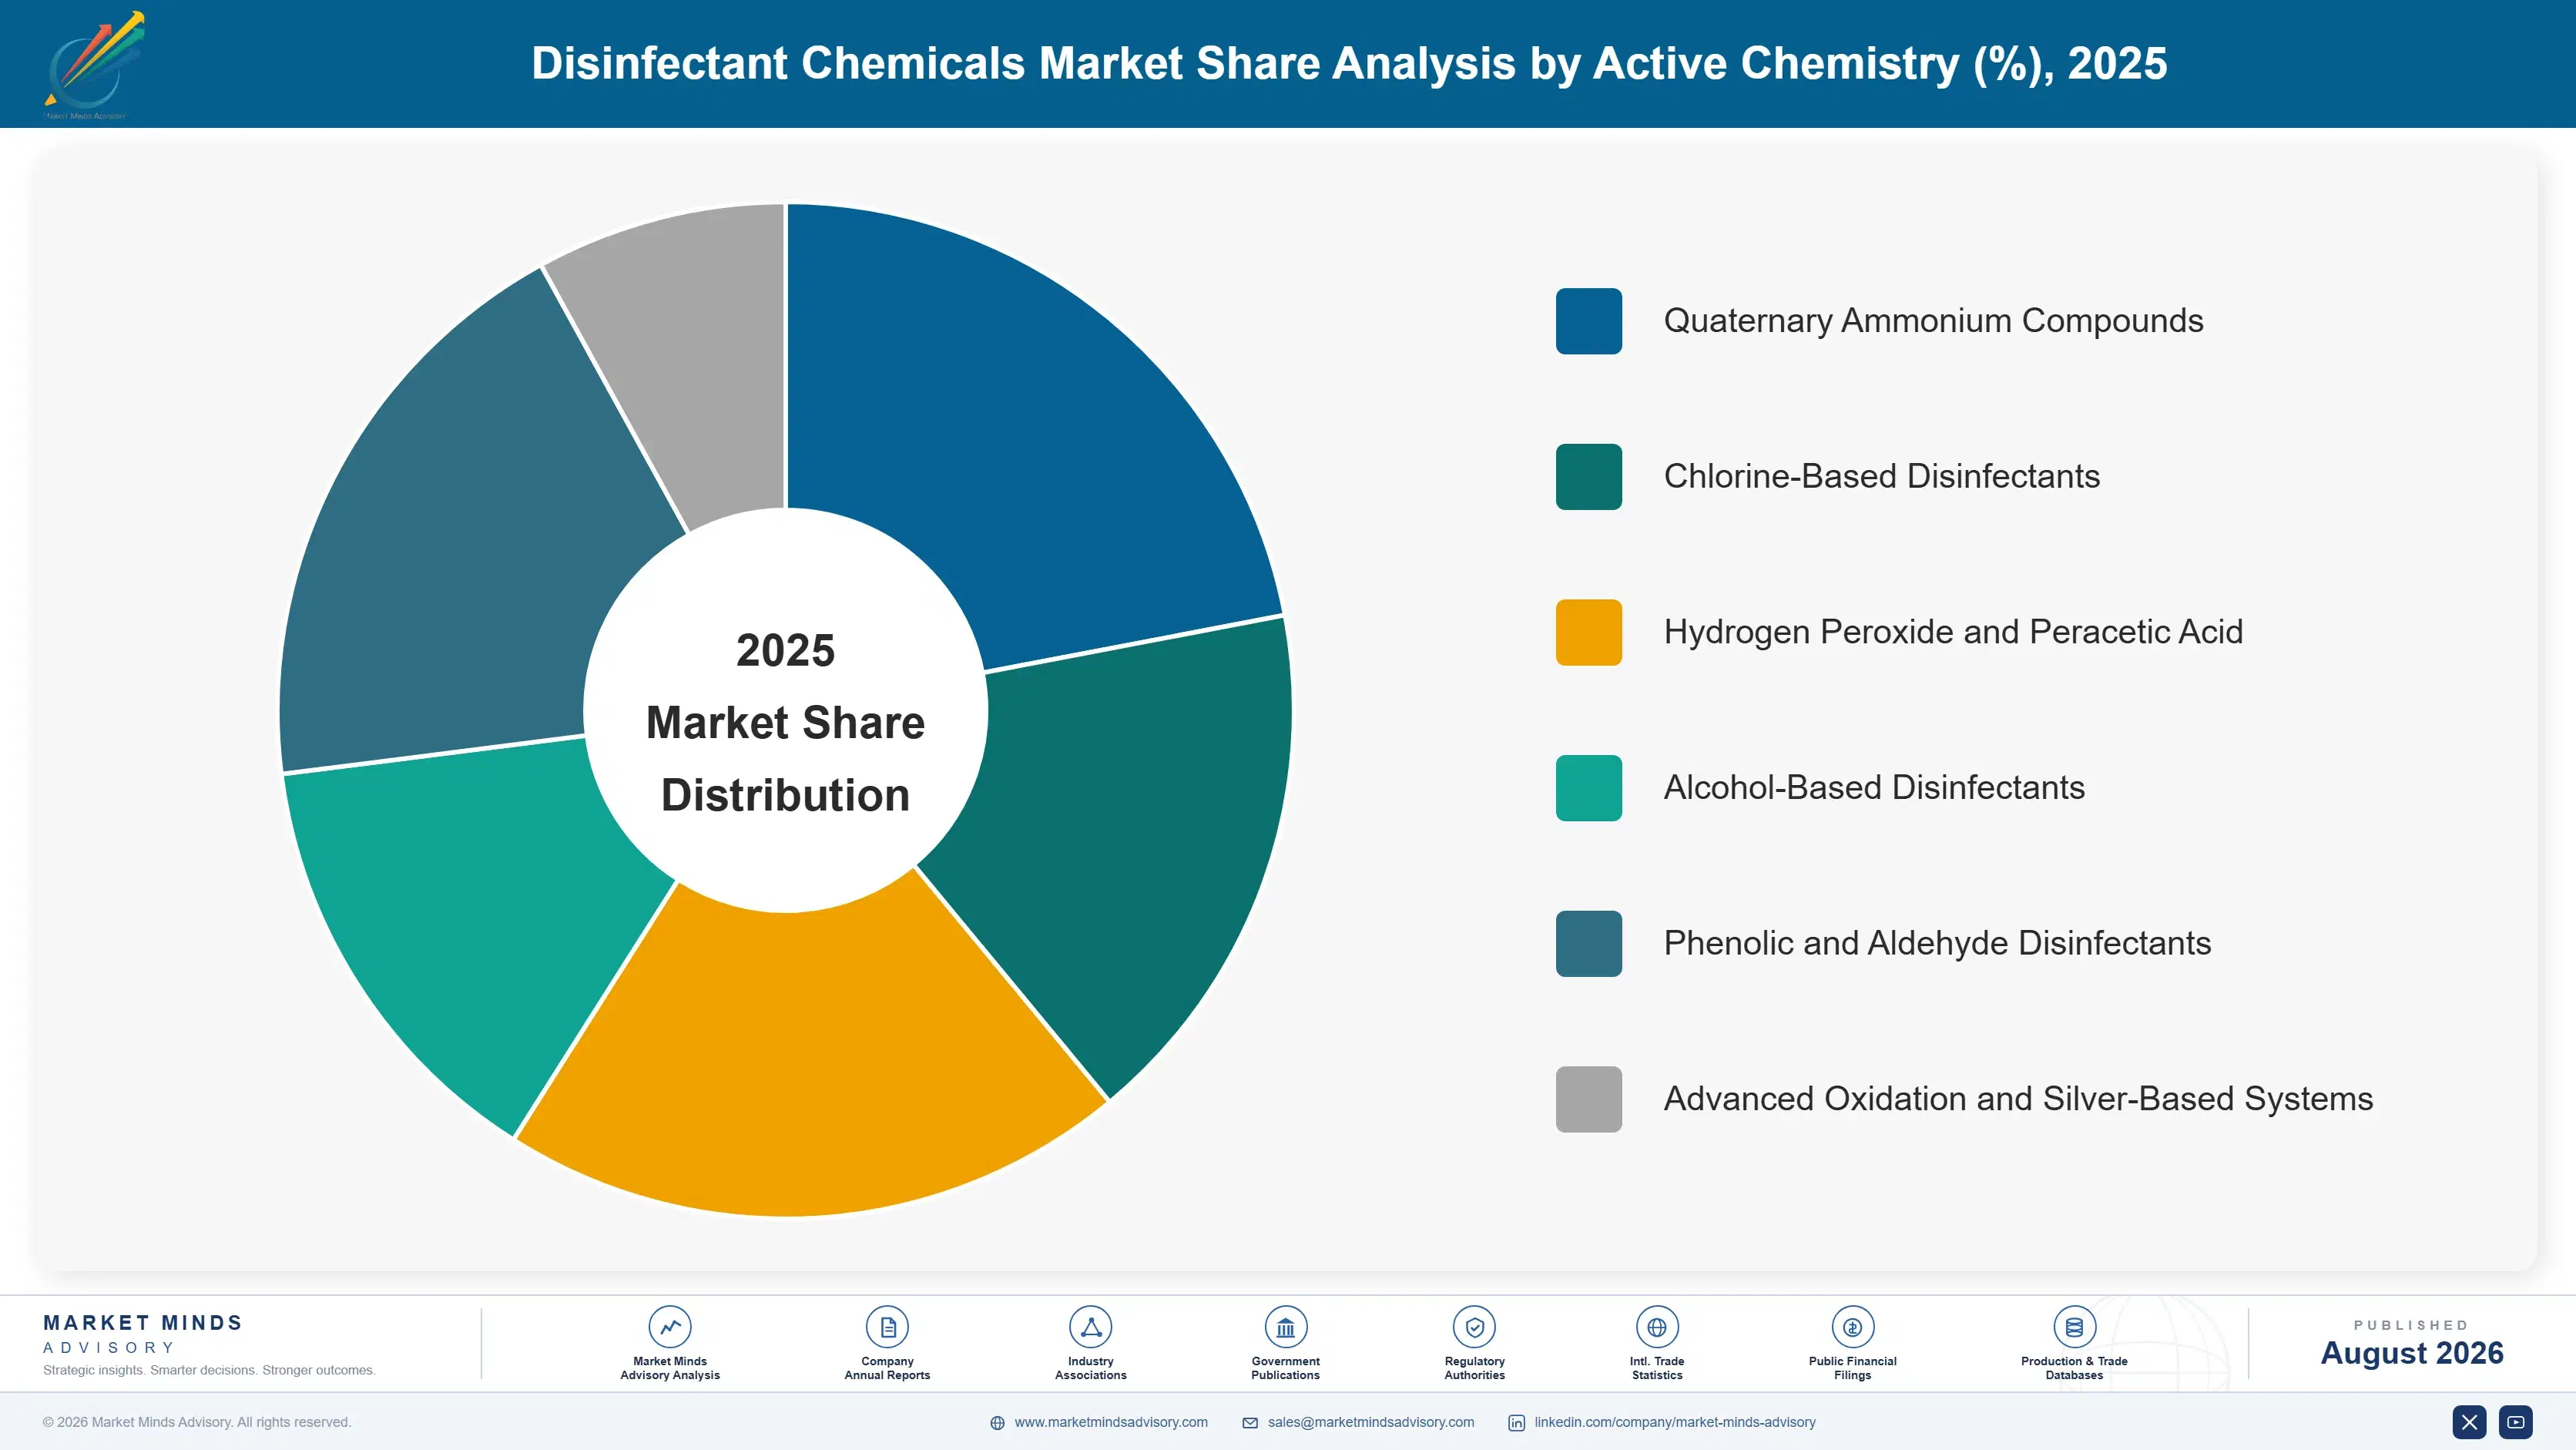
Segmentation follows active chemistry, because the active determines spectrum of activity, contact time, material compatibility, regulatory status, and residue behaviour after application. Six chemistries cover commercial supply, and they compete only partially, since food contact, instrument reprocessing, and general surface disinfection each rule several of them out on residue or compatibility grounds. Registration status varies as much as chemistry.
disinfectant-chemicals-market-market-share-analysis-1787549230135

Advanced Oxidation and Silver-Based Systems

The fastest-growing chemistry at 9.8%, roughly 1.85 times the market, and the one making claims conventional products cannot. Stabilised hydrogen peroxide with silver, activated peroxide systems, and related oxidative chemistries offer residual antimicrobial activity between cleaning cycles alongside good material compatibility and benign breakdown products. Cost per litre runs well above quaternary ammonium alternatives, and facilities accept it where infection rates carry financial consequences. Registration of residual activity claims is demanding, since regulators scrutinise persistence claims closely and the data requirements exceed those for simple contact kill. That difficulty is precisely what protects the pricing of products that have secured them. Facilities where infection rates carry financial consequences accept the cost readily.
CAGR 9.8%

Hydrogen Peroxide and Peracetic Acid

Second fastest at 7.4%, and dominant wherever no-rinse operation is required. Decomposition to acetic acid, water, and oxygen leaves nothing needing removal, which makes peracetic acid effectively irreplaceable in dairy, brewing, meat processing, and produce washing. Regulatory acceptance for food contact is well established and the sporicidal activity that peroxide chemistry provides matters increasingly in healthcare instrument reprocessing. Handling is the drawback, since concentrated peracetic acid is corrosive and requires engineered dosing and ventilation. Suppliers providing dosing equipment alongside the chemistry hold positions that competitors selling drums alone cannot displace on price. Sporicidal activity matters increasingly in healthcare instrument reprocessing, which adds a second demand pool alongside food processing entirely.
CAGR 7.4%
Full segment breakdown across 6 segments available in the complete report.

Regional Architecture and Country Demand Map

Regional shares follow healthcare capacity, food processing scale, and how formally infection control is regulated. Registration requirements are national rather than regional, which fragments supply and explains why concentration in this market stays unusually low for a chemicals business. Distribution reach matters as much as any registration held.

North America

Infection control is more formally regulated here than almost anywhere, with reimbursement penalties attached to healthcare-associated infection rates that make surface disinfection a clinical rather than housekeeping concern. Environmental Protection Agency registration governs efficacy claims and is demanding, expensive, and slow, which raises the barrier and protects those who have cleared it. Food processing is enormous and consumes peracetic acid at scale under established no-rinse acceptance. Ecolab and Diversey both hold dense service and distribution networks reaching institutional accounts directly. Commercial cleaning is more price-sensitive and increasingly served by private label. Growth of 5.6% reflects healthcare protocol tightening rather than any expansion in treated area. Compatibility listing has become a routine purchasing requirement.
Share: 26% | CAGR: 5.6% (2026 to 2036)

Western Europe

The Biocidal Products Regulation has reshaped this market more than any clinical development, requiring active substance approval and product authorisation at costs that removed numerous formulations from sale entirely. That consolidated supply toward companies able to fund dossiers and left smaller regional formulators licensing registrations rather than holding them. Quaternary ammonium compounds face the closest scrutiny anywhere, and peroxide chemistry has gained share accordingly. Healthcare infection control is well developed with national surveillance programmes across most member states. Food processing is substantial and technically demanding. Growth of 3.9% is the slowest in the report and reflects regulatory attrition alongside mature healthcare capacity rather than any weakness in standards. Licensed registrations sustain most smaller regional formulators.
Share: 21% | CAGR: 3.9% (2026 to 2036)
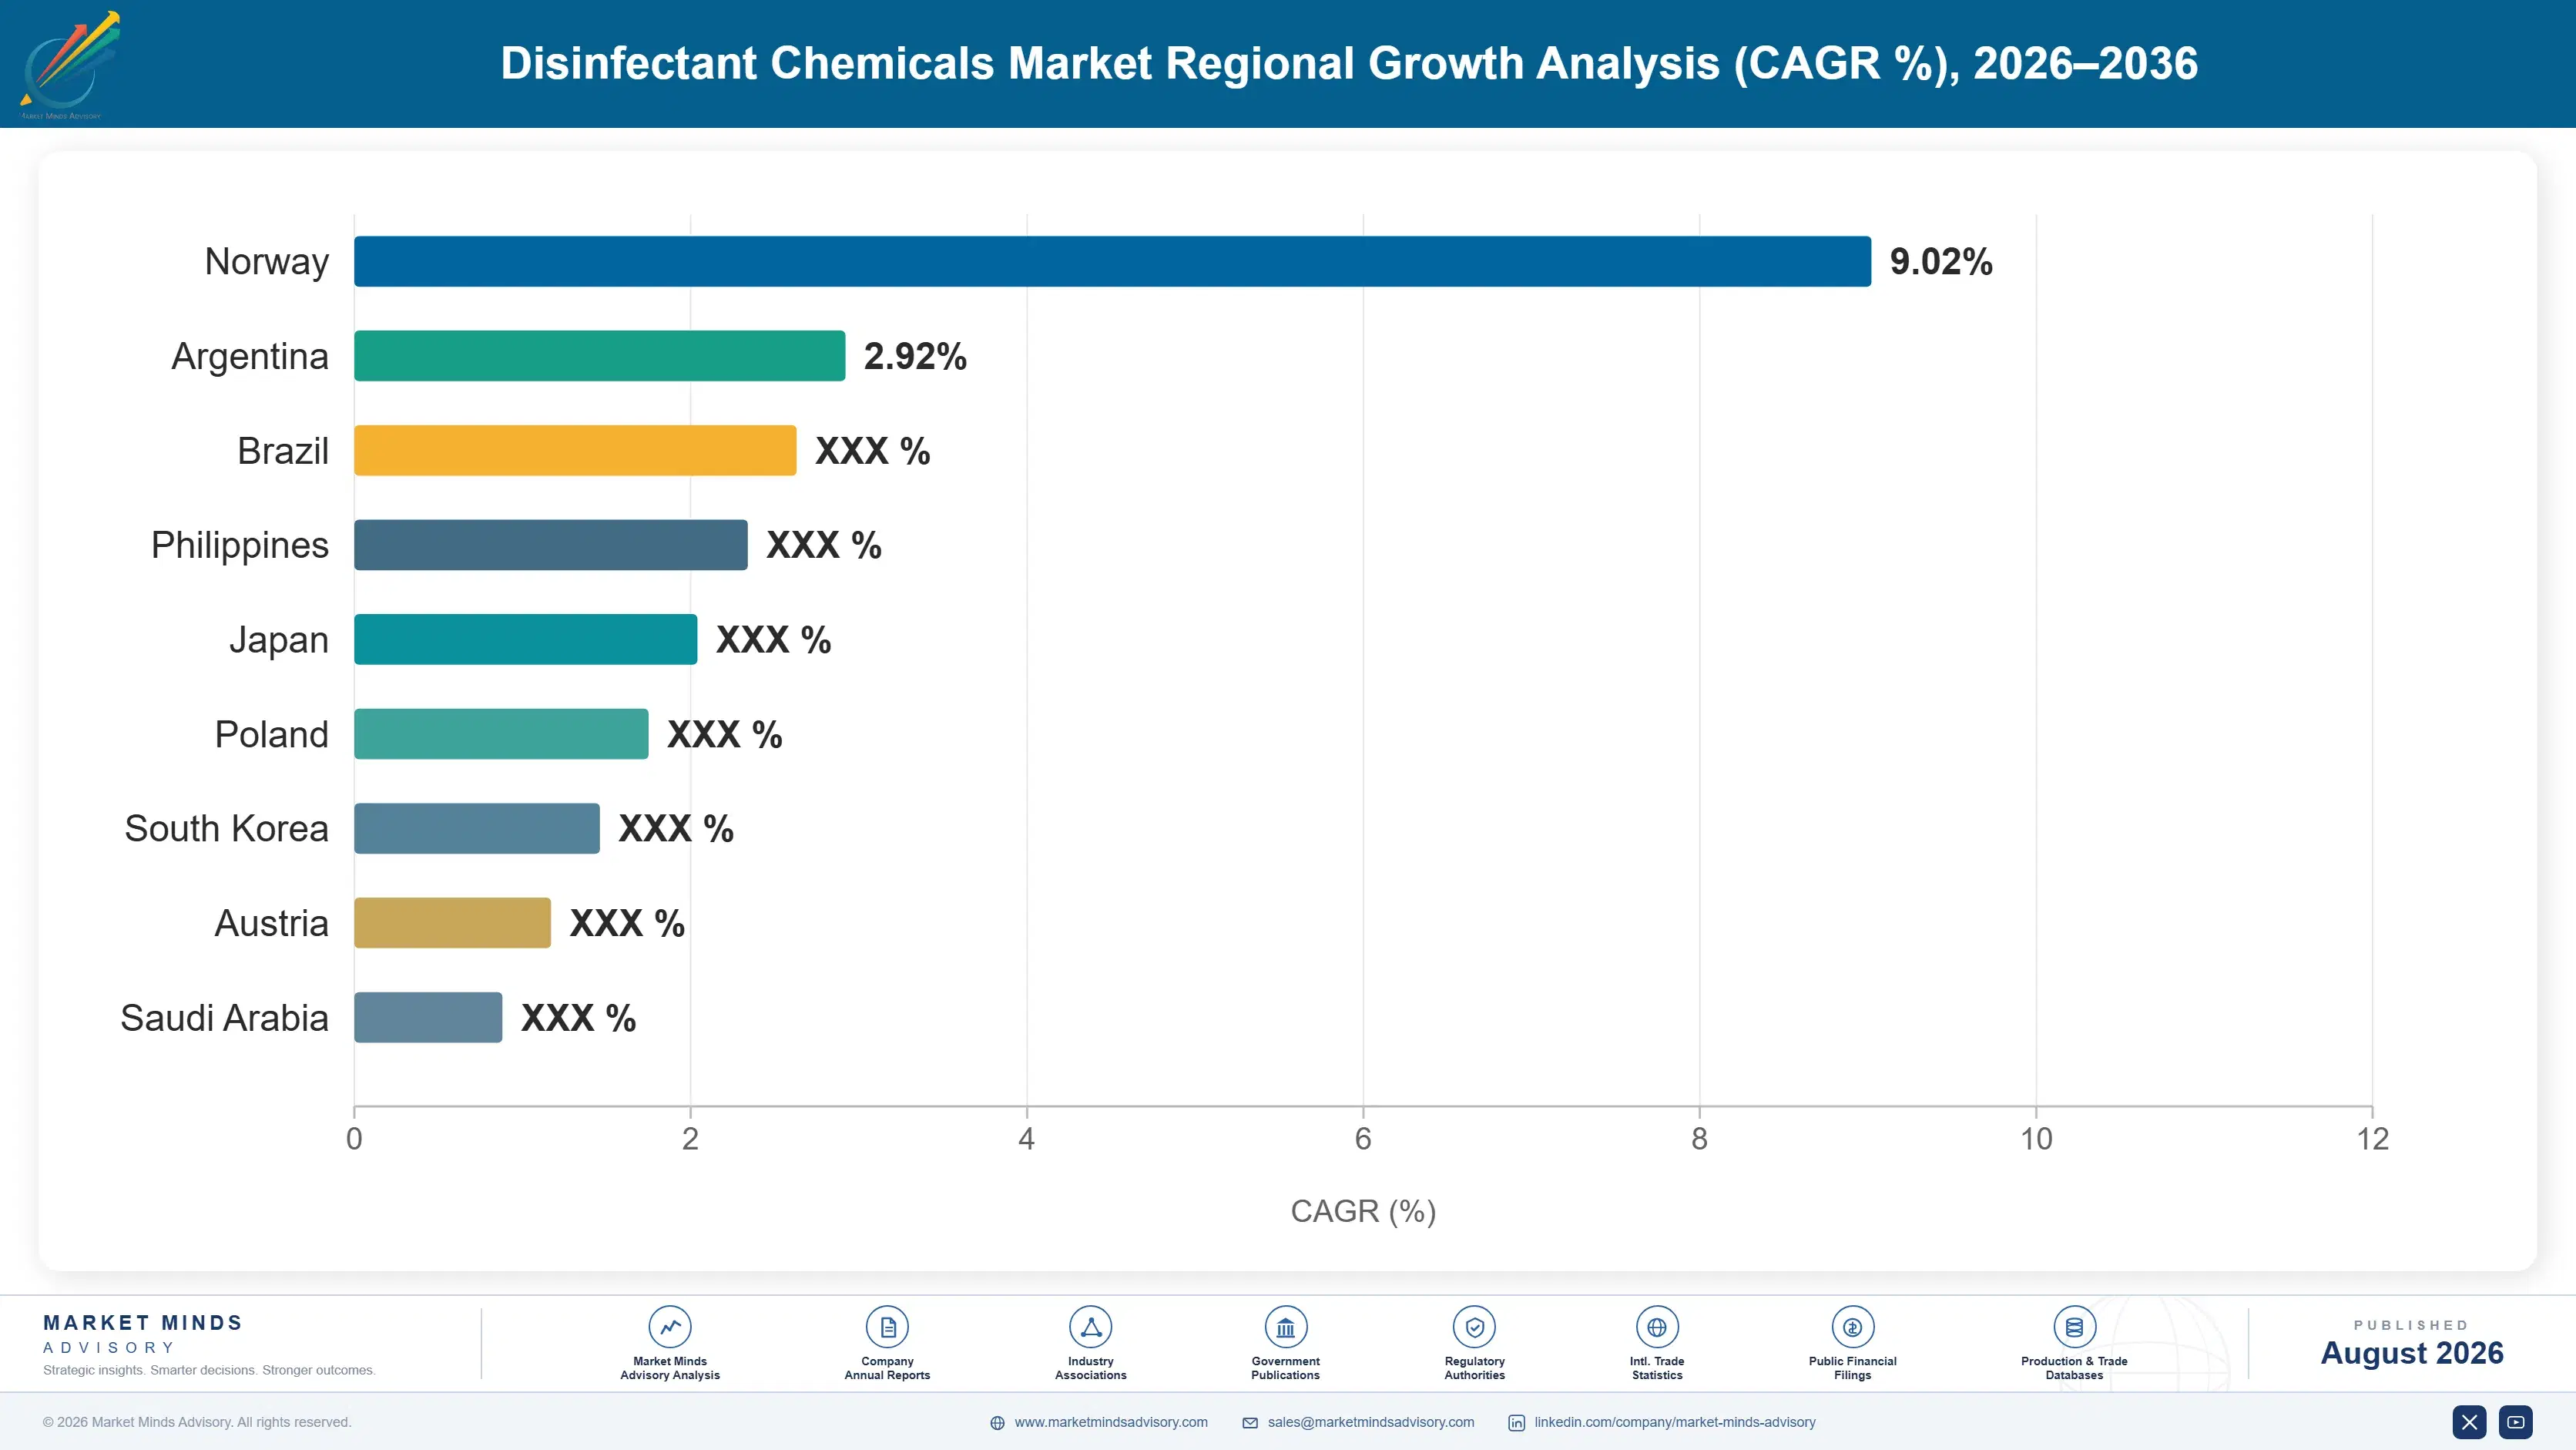
Regional intelligence for 5 additional markets available in the complete report: East Asia, South Asia and Pacific, Latin America, Middle East and Africa, Eastern Europe. Contact sales@marketmindsadvisory.com.
disinfectant-chemicals-market-country-cagr-analysis-1787549230703

Four Moves That Change the Economics

Advantage here comes from registered claims, contact time data, and equipment compatibility listings rather than from formulation, which competent chemists match readily. Four moves are worth capital and management attention across the forecast period, and three of them are documentation exercises rather than laboratory work. Each of them costs far less than the revenue it protects or opens.

Generate short contact time efficacy data deliberately

A one minute full spectrum claim and a ten minute claim describe different products in practice, because nobody keeps a surface visibly wet for ten minutes and infection control teams now audit achieved contact time rather than product choice. Generating shortened contact time data costs perhaps $150,000 to $400,000 per claim on an existing formulation and commands price premiums of 20 to 35% against longer-contact competitors. It also cannot be matched without repeating the entire registration process, which takes competitors years rather than months to complete. Registration cannot be shortcut by any competitor responding on price.
Market Impact: Commands 20 to 35% higher price premiums overall

Secure listing on device manufacturer compatibility schedules

Equipment makers publish approved disinfectant lists because aggressive chemistry damages assets worth far more than years of consumable supply, and a product absent from those lists cannot be used in facilities running that equipment. Compatibility testing costs relatively little and takes months rather than years, yet it gates access to above 30% of institutional facilities. Suppliers treating it as a technical afterthought lose accounts they never learn they were excluded from. Securing listing across major device platforms is among the cheapest access investments available in this market. It is the cheapest access investment available in this market.
Market Impact: Opens above 30% of all institutional facilities globally

Bundle dosing systems with concentrate supply

Professional products ship as concentrates diluted around one to one hundred and twenty-eight at point of use, and dilution accuracy determines whether the applied product actually meets its efficacy claim. Supplying wall-mounted dosing equipment, training, and verification alongside concentrate makes the account genuinely sticky and lifts gross margin 8 to 14 percentage points above drum-only supply. It also protects the supplier from efficacy failures caused by incorrect dilution that would otherwise be blamed on the product itself rather than on the practice. Dilution errors otherwise become efficacy complaints against the product.
Market Impact: Lifts gross margin by 8 to 14 points

Sequence registrations by addressable claim volume

Each efficacy claim in each jurisdiction costs around USD 850,000, and a professional product typically needs several before it can be sold internationally at all. Prioritising claims by the volume they actually address, rather than registering comprehensively by default, gets revenue moving years earlier and avoids spending on organisms and territories that will never repay the dossier. Licensing registrations to regional partners covers smaller markets without direct expenditure. Suppliers who register everything everywhere consistently exhaust their regulatory budget before reaching the claims that matter commercially. Comprehensive filing exhausts regulatory budgets before reaching the claims that matter.
Market Impact: Each claim costs about $850,000 to register properly

Who Controls the Margin Pool

Concentration is low: the top five hold roughly 34% of global disinfectant chemical revenue, unusually fragmented for a chemicals market and a direct consequence of registration being national while distribution stays local. Ecolab leads through service network density reaching institutional accounts directly. Diversey competes on comparable terms with different sector weighting, while Reckitt brings consumer brand strength into professional channels and Lonza and Stepan supply actives that many competitors formulate with.
Competitive activity runs on three fronts. Registered claim breadth is the first, because a product can only be sold against the organisms and contact times its dossier supports in that jurisdiction. Contact time performance is the second, and it is where genuine differentiation now sits. Device compatibility listing is the third, and it silently determines which facilities a product can enter at all.

Pressure is building from two directions. Private label products are taking commercial cleaning volume where efficacy claims matter less than price. And regional formulators licensing registrations rather than funding them compete effectively without carrying the dossier costs that international suppliers do. Both pressures hit the commodity end hardest, and both leave healthcare positions built on registered claims relatively well protected for now.
disinfectant-chemicals-market-company-positioning-matrix-1787549231225

Competitive Moat and Risk Dimensions

ECOLAB

Moat: Service density and protocol integration

Field service reaching institutional accounts directly, combined with dosing equipment installed on site and training delivered to cleaning staff, makes Ecolab part of a facility's operating protocol rather than a supplier of drums. Displacing that means changing documented procedures and retraining people, which infection control committees approve reluctantly and rarely for price alone.
ECOLAB

Risk: Exposure to institutional budget pressure

A service-inclusive model carries cost that procurement targets whenever institutional budgets tighten, and public healthcare systems across several markets are under sustained financial pressure. Where buyers succeed in separating chemical supply from service, regional formulators with licensed registrations and no service overhead become genuinely competitive on the product alone.
DIVERSEY

Moat: Registered claim portfolio breadth

A wide portfolio of efficacy claims across organisms, contact times, and jurisdictions represents accumulated regulatory expenditure that competitors cannot shortcut, since each dossier costs real money and years of review. That breadth lets Diversey serve healthcare, food processing, and commercial cleaning from one registration base rather than funding separate programmes.
DIVERSEY

Risk: Quaternary chemistry regulatory exposure

Portfolio weighting toward quaternary ammonium compounds carries genuine exposure as environmental persistence and resistance concerns advance through European and North American reviews. Reformulating toward peroxide and advanced oxidation chemistry means regenerating efficacy data across the whole affected range, which repeats registration expenditure already made once.

Players Tracked

Prominent Players

Ecolab
Diversey
Reckitt Benckiser
Lonza
Stepan Company

Other Key Players

Solvay
Evonik Industries
BASF
Clariant
Arxada
Kersia
Christeyns
Zep Inc
STERIS
Neogen
Nouryon
PCC Group
Solenis
Sanosil
Tristel

Recent Developments

MARCH 2025

Supplier registers one minute full spectrum claim

A shortened contact time claim covering bacteria, viruses, and fungi was registered for an existing formulation, following test work designed specifically to demonstrate rapid kill. Infection control teams had increasingly questioned whether longer label contact times were being achieved in routine practice at all. Pricing moved upward.
Signal: Contact time is becoming the differentiator, because label claims and observed practice had drifted far apart
JULY 2025

Device maker publishes narrowed compatibility list

A medical equipment manufacturer reduced its approved disinfectant list after warranty claims linked to surface damage and display degradation, excluding several widely used products. Facilities running that equipment had to change disinfectant despite having no efficacy concern with the products removed. Replacement products had to be requalified against protocols.
Signal: Compatibility listing now gates facility access more decisively than efficacy data does in fully equipped environments
OCTOBER 2025

Regulatory review restricts additional quaternary formulations

Further quaternary ammonium formulations were restricted following environmental persistence assessment, continuing a review process that has removed products steadily over several years. Suppliers with peroxide and advanced oxidation alternatives already registered absorbed the affected volume most readily. Reformulation programmes accelerated across the industry in response to the decision.
Signal: Quaternary attrition keeps redistributing volume toward the suppliers who prepared alternatives well before each restriction landed

What Sets the Cost Base

Active ingredients account for roughly 33% of formulated product cost, with quaternary compounds, hydrogen peroxide, peracetic acid, and hypochlorite all tracking different petrochemical and industrial gas markets. Surfactants, chelants, and stabilisers contribute 17%, and stabiliser chemistry matters disproportionately for peroxide products whose shelf life depends on it. Packaging is unusually significant at 12%. Registration maintenance, distribution, and service absorb the balance.
The pandemic period distorted every input line. Alcohol, hydrogen peroxide, and packaging all went on allocation as demand roughly doubled, and some inputs tripled before capacity caught up and overshot. Ecolab and Reckitt both referenced extraordinary demand followed by significant destocking across their reporting for those years. Suppliers who added capacity at the peak carried it through the correction, and several wrote down assets that had looked essential a year earlier.

Exposure divides on chemistry mix and registration burden rather than on scale. Peroxide-weighted portfolios carry hydrogen peroxide and stabiliser exposure with genuine shelf life risk attached, while quaternary-weighted producers face regulatory rather than input cost pressure. Registration maintenance falls hardest on suppliers holding many claims across many jurisdictions, which is exactly the position that confers commercial advantage. Portfolio design determines exposure more than procurement skill.
disinfectant-chemicals-market-cost-volatility-analysis-1787549231422

Improve peroxide stabilisation to extend usable shelf life

Hydrogen peroxide and peracetic acid products degrade in storage, and shelf life determines both distribution reach and write-off exposure across a channel. Improved stabiliser systems extend usable life meaningfully and reduce returns from slow-moving accounts. Reformulation requires efficacy data to be regenerated where the change is material, which is the deterrent, and the write-off saving usually justifies it comfortably.

Share registration data across related formulation families

Dossier cost falls per claim rather than per unit sold, which punishes narrow portfolios severely. Designing formulations as families sharing active substances and supporting data lets one test programme support several products across several jurisdictions. It requires regulatory planning to sit inside product development from the beginning rather than being applied to finished formulations afterwards.

License registrations into smaller markets rather than filing

Registering directly in a market that will never repay an USD 850,000 dossier destroys value however attractive the strategic logic sounds. Licensing to regional formulators who hold local distribution generates royalty income without regulatory expenditure. The trade-off is losing direct customer relationships in those territories, which matters less where the supplier would never have built a service organisation regardless.

Portfolio Architecture for Margin Defence

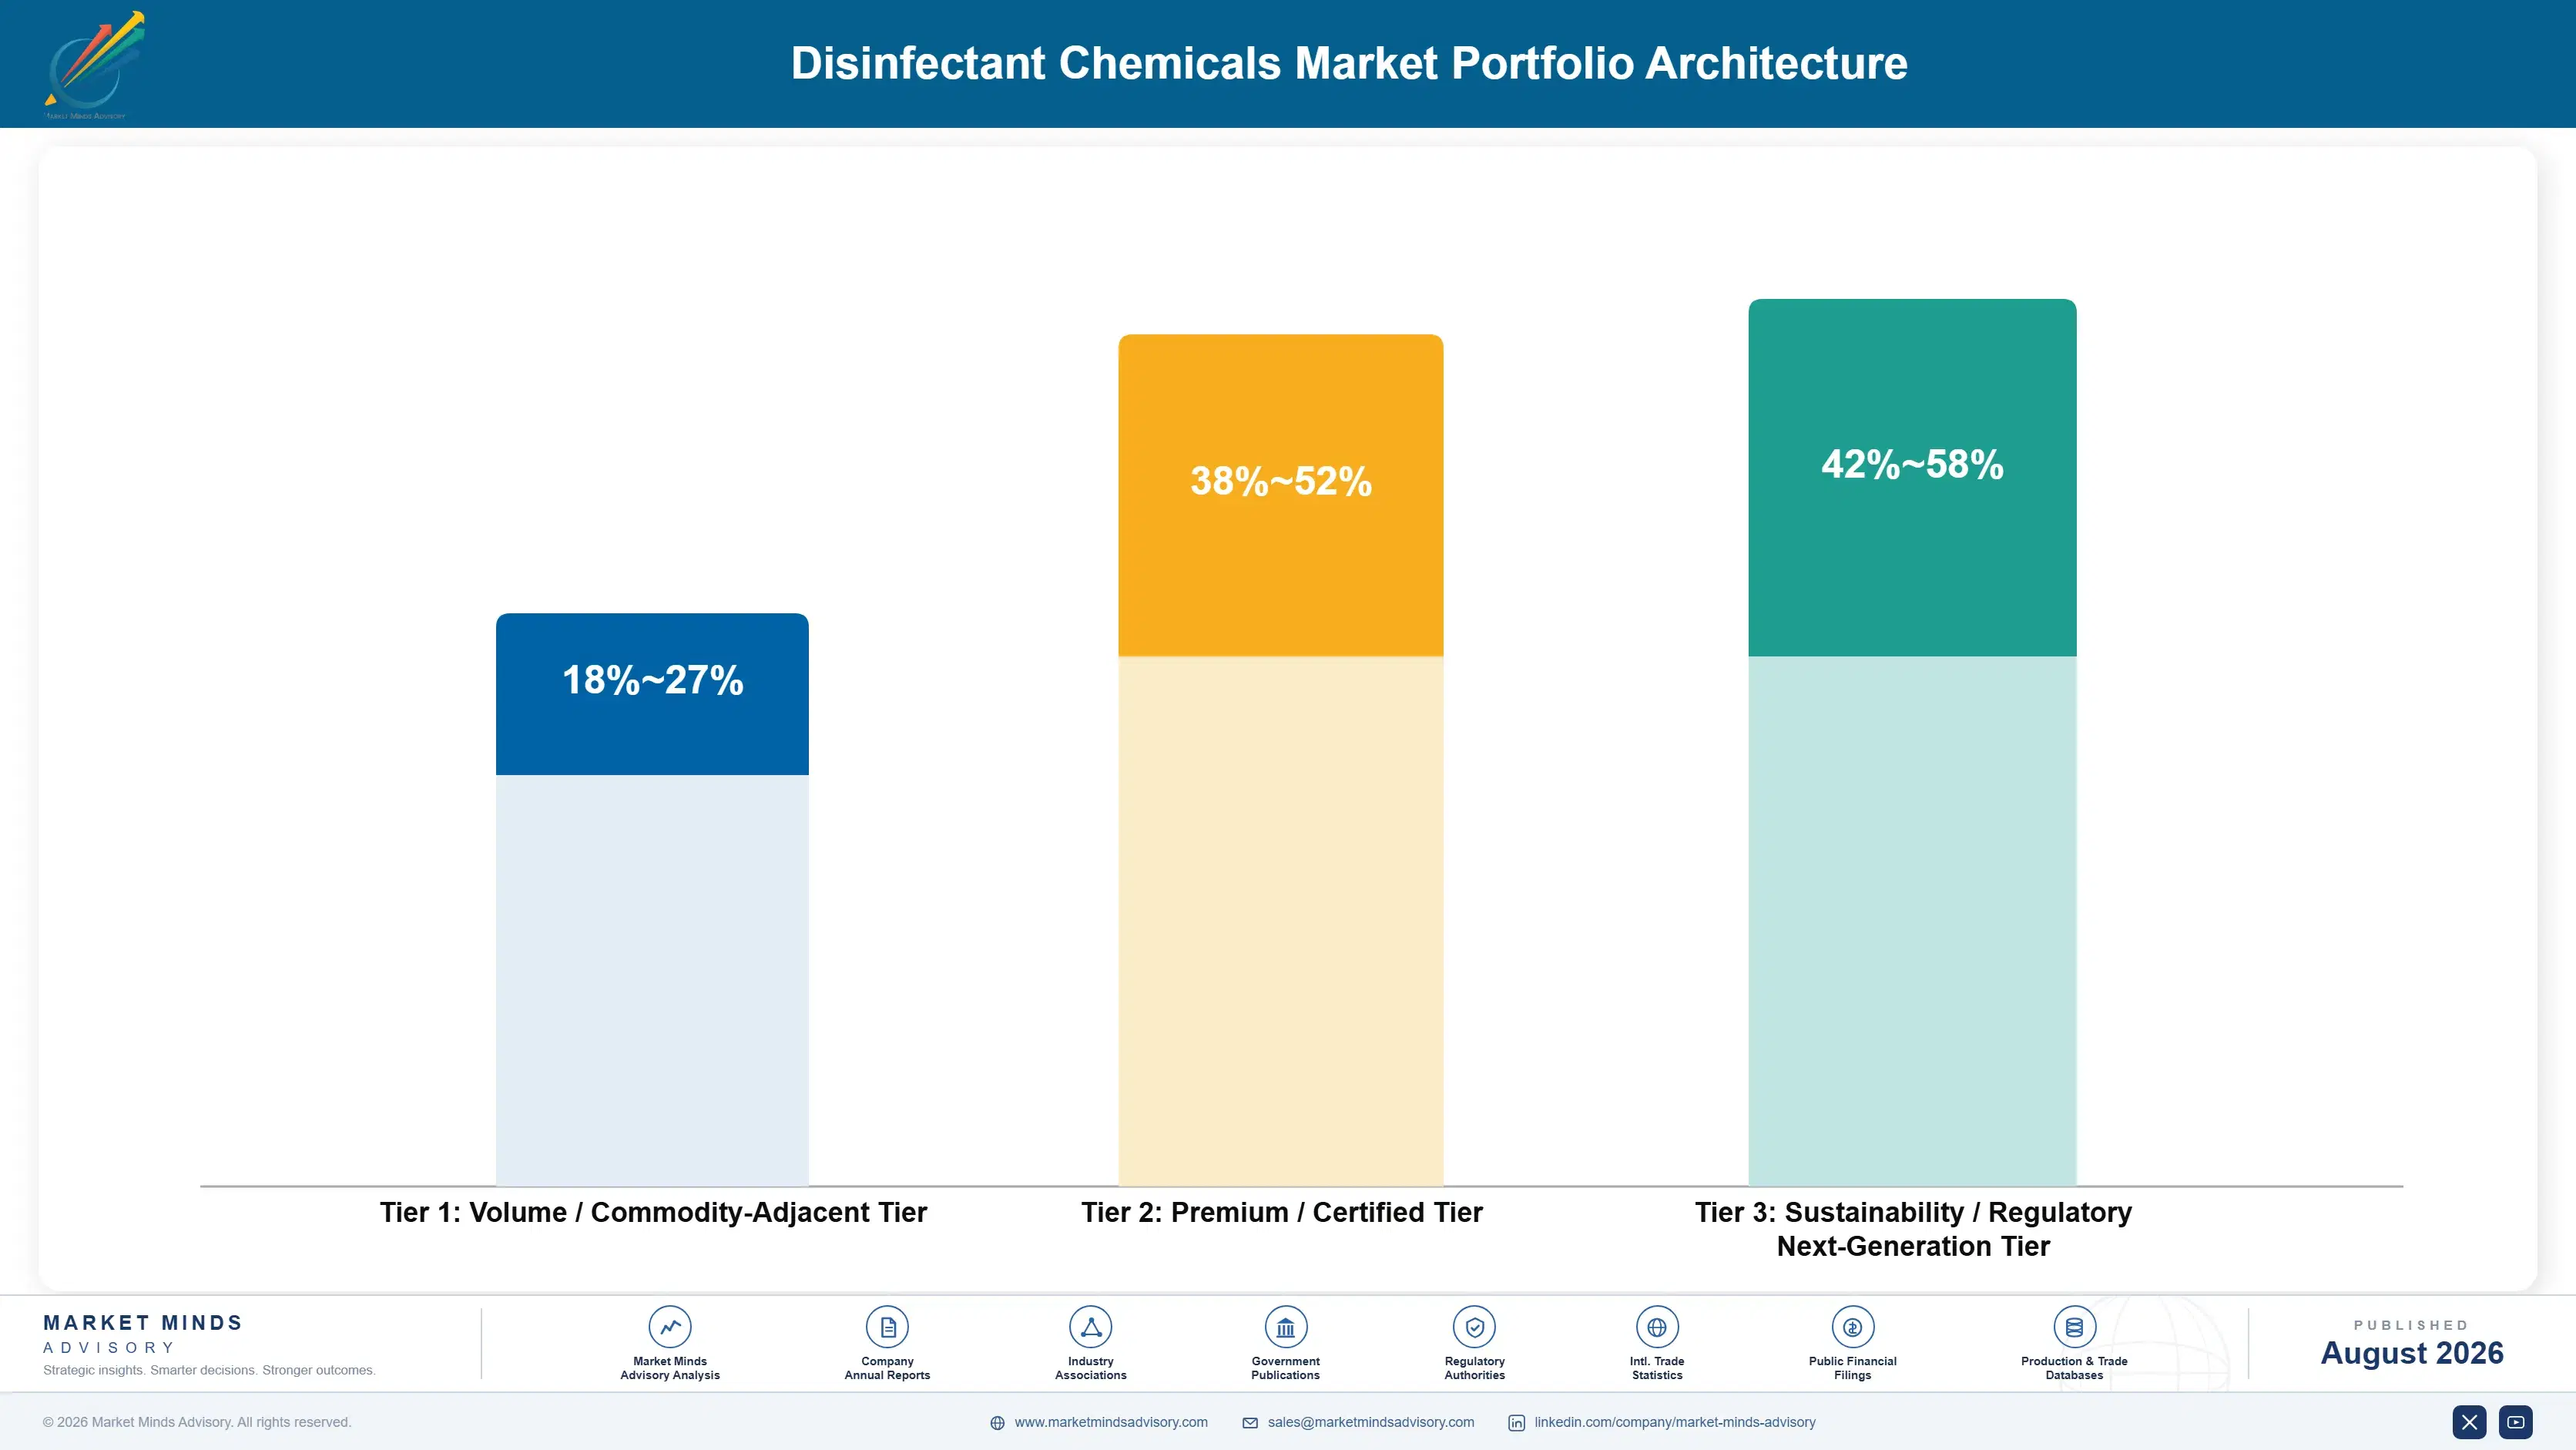
Margin follows claim status and service attachment rather than volume. Commodity chlorine and basic quaternary products sold into commercial cleaning through distribution earn modest returns, because efficacy expectations are undemanding and private label sits directly alongside. Healthcare products carrying short contact time claims and device compatibility listings earn several times that, since the buyer is purchasing protocol compliance and equipment protection rather than disinfection.
The volume and premium tension shows in registration economics rather than in manufacturing. Dossier costs are fixed per claim and must be spread across whatever volume the product achieves, so suppliers take commercial cleaning business to amortise registrations that healthcare accounts alone would not support. That works until private label takes the volume while leaving the registration burden entirely with the branded supplier.

High-value pools concentrate in three places: healthcare products with short contact time claims, peracetic acid systems for food processing supplied with dosing equipment, and advanced oxidation chemistry carrying residual activity claims. Each is defended by registration, equipment integration, or data rather than by price. Price competition arrives only when a competitor funds the registration, secures the listing, or installs equipment.

Volume / Commodity-Adjacent Tier

Chlorine solutions and basic quaternary products sold through distribution into commercial cleaning and general institutional use. Competes against private label on price. The wide range reflects large differences in active sourcing and packaging cost.
Gross Margin: 18%-27%

Premium / Certified Tier

Healthcare products with registered short contact time claims and device manufacturer compatibility listings. The facility purchases protocol compliance and equipment protection, and changing product requires infection control committee approval. Retraining staff is part of the switching cost.
Gross Margin: 38%-52%

Sustainability / Regulatory / Next-Generation Tier

Advanced oxidation and silver systems with residual activity claims, plus peroxide chemistry replacing restricted quaternary formulations. Regulation and infection outcomes drive adoption. The range is wide because residual claim pricing has not settled.
Gross Margin: 42%-58%
disinfectant-chemicals-market-portfolio-architecture-1787549231913

High-value Sub-segments and Strategic Watch-out

Short Contact Time Healthcare Products

The clearest differentiation available, because a one minute claim describes what actually happens while a ten minute claim describes what does not. Registration cannot be matched quickly by any competitor. Infection control committees change protocols reluctantly once set. Fund the data before competitors do. Move first.
Gross Margin: 40%-54%

Peracetic Acid Food Processing Systems

No-rinse operation makes this chemistry effectively irreplaceable in dairy, brewing, meat, and produce washing. Supplying engineered dosing alongside handles the corrosivity that would otherwise deter buyers. Volume grows with processing capacity rather than hygiene trends. Equipment supply is what secures the account. Bundle it. Supply dosing.
Gross Margin: 36%-48%

Advanced Oxidation Residual Systems

Residual activity between cleaning cycles is a claim conventional chemistry cannot make, and regulators scrutinise persistence claims hard enough to keep the field narrow. Facilities with infection rate consequences accept the cost. Growth runs at 9.8% annually. Claim scrutiny keeps the field usefully narrow. Register early.
Gross Margin: 44%-58%

Commodity Chlorine and Quaternary Supply

The strategic watch-out. Private label competes directly, efficacy expectations are undemanding, and quaternary chemistry faces regulatory attrition on top. It amortises registration costs across volume, and that is the only real argument for keeping it. Price it for registration amortisation only. Nothing more. Manage it down.
Gross Margin: 18%-26%

How Demand Actually Reaches Suppliers

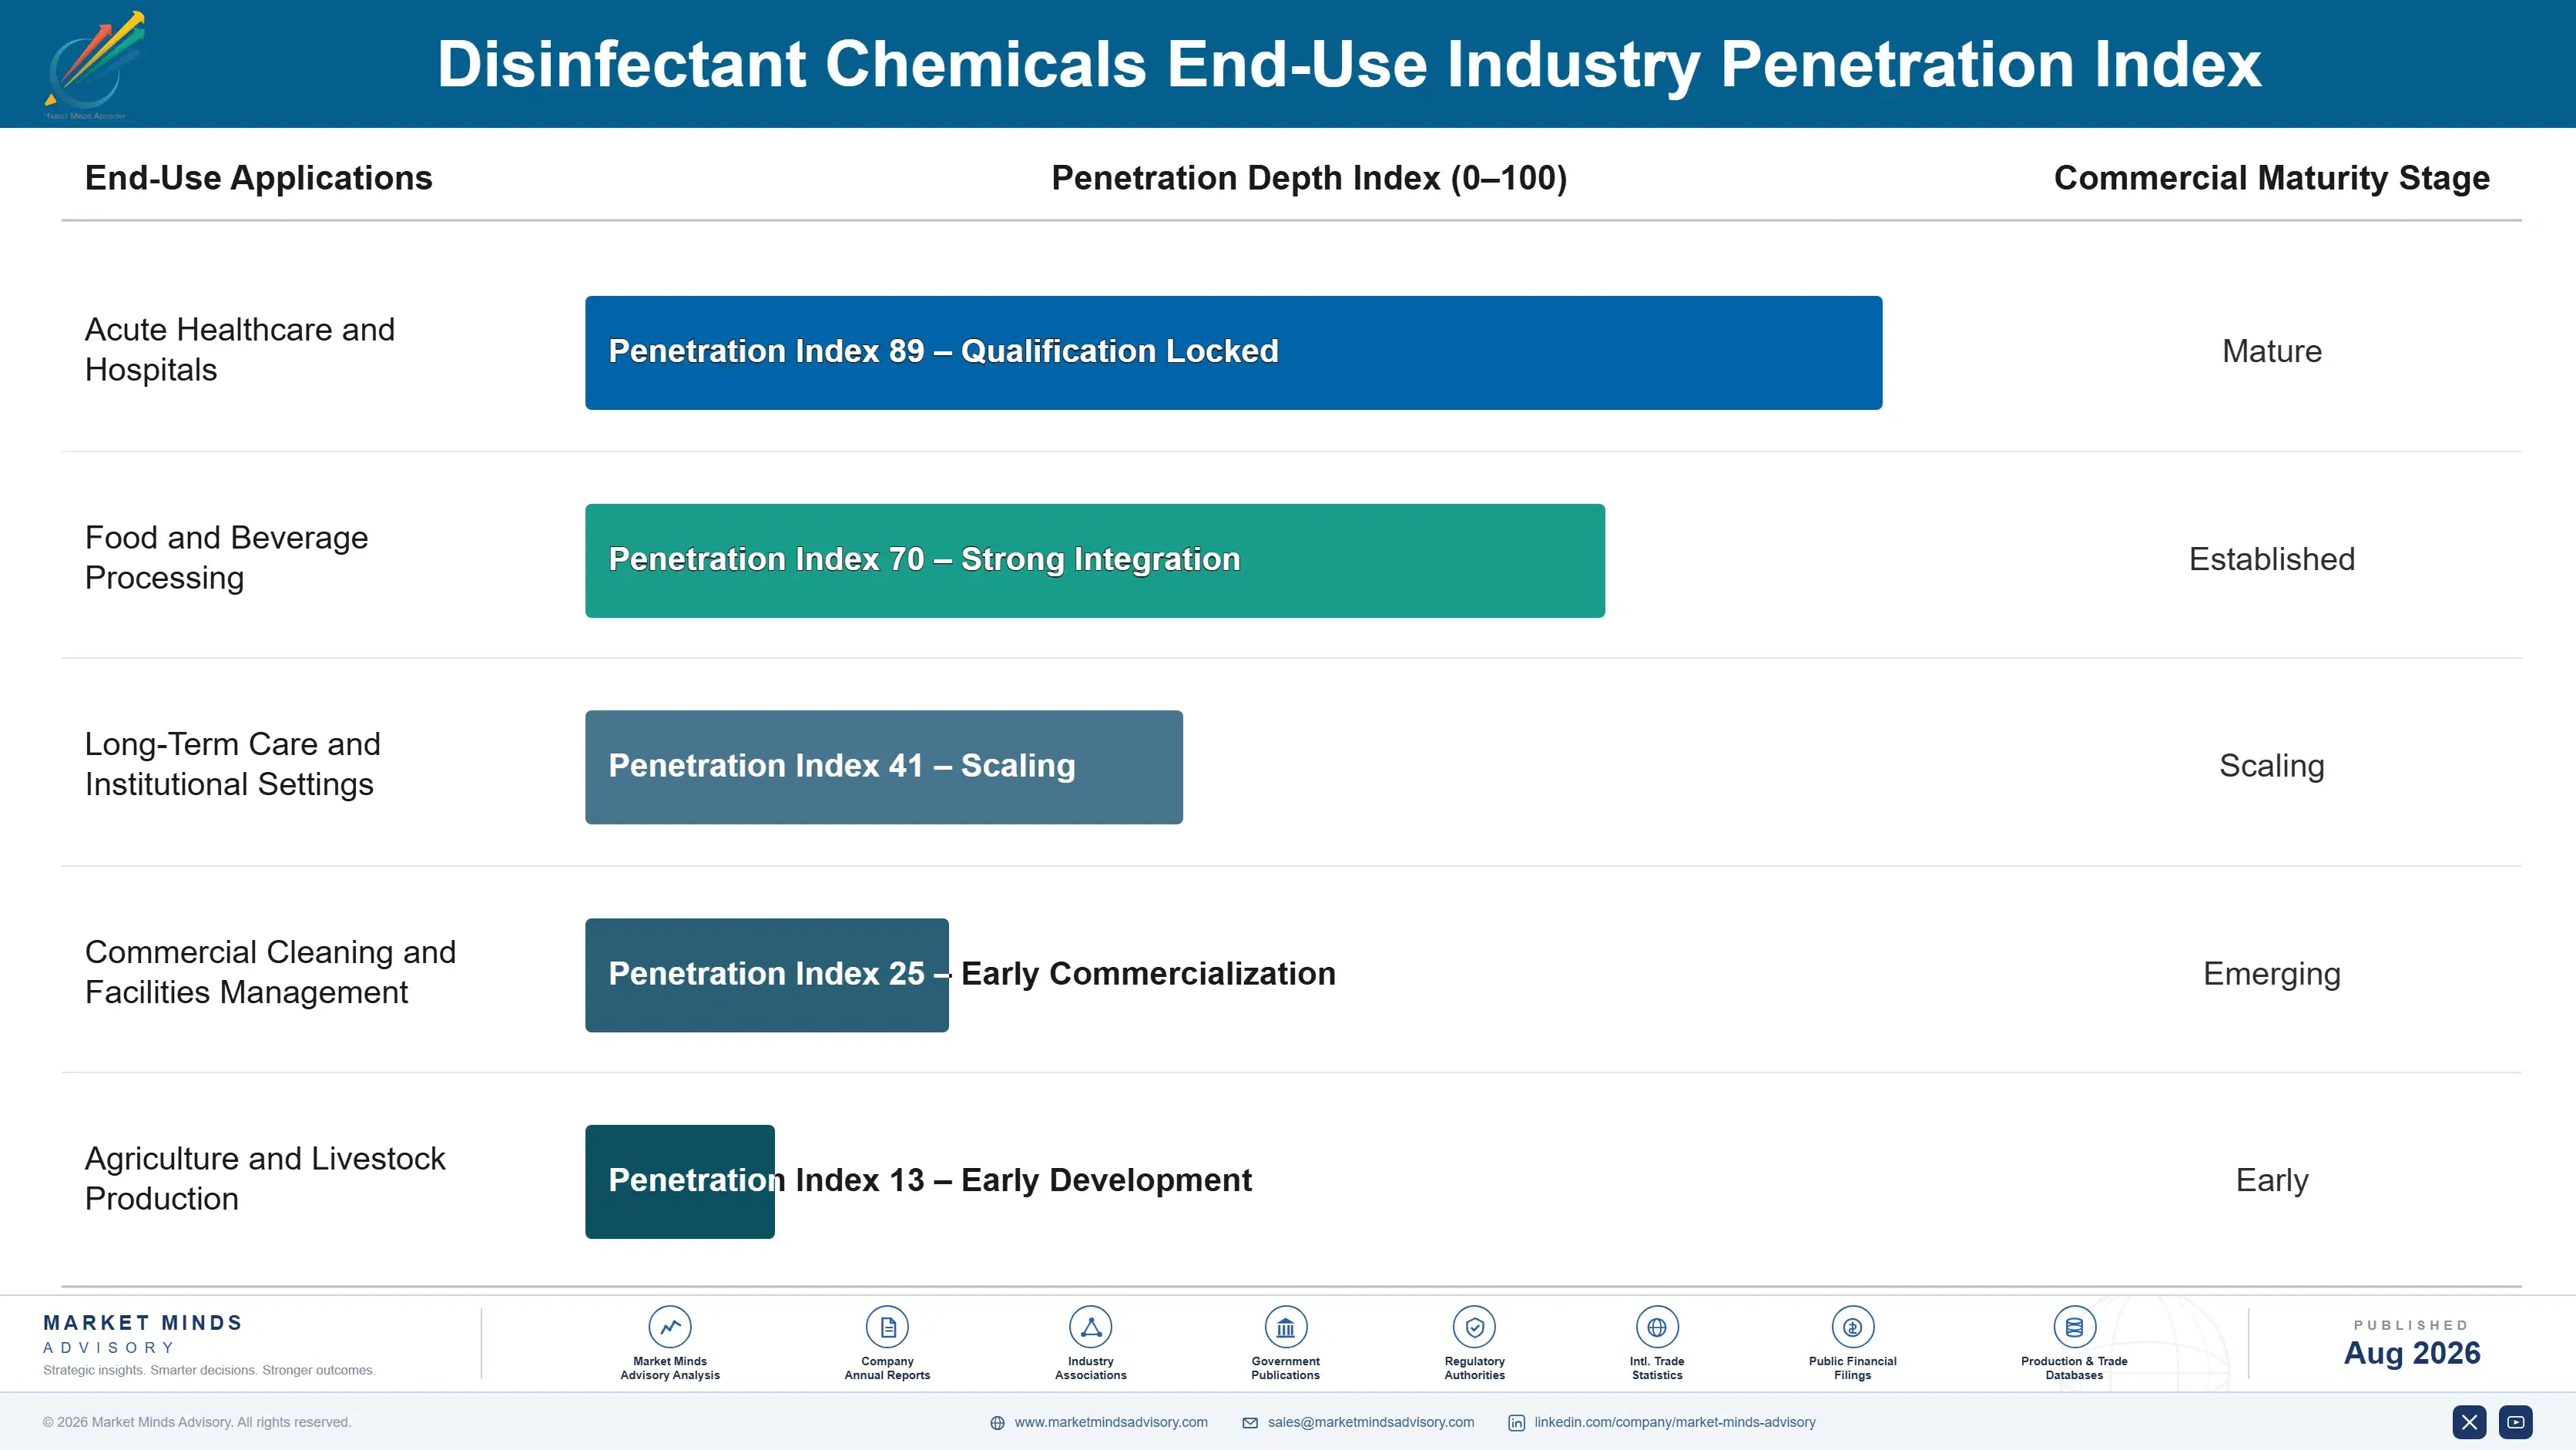
The annuity here is protocol rather than consumption. A hospital writes a product into its infection control procedure by name, contact time, and application method, trains staff against it, and audits compliance, which means changing supplier requires committee approval and retraining rather than a purchase order amendment. Consumption itself is continuous and predictable, tied to bed occupancy and cleaning frequency rather than to any seasonal or cyclical pattern. Once written in, a product stays written in for years.
Adoption depth varies sharply by setting. Acute healthcare runs the deepest protocols and buys on documented efficacy, contact time, and compatibility. Food processing specifies to regulatory and customer audit requirements and rarely deviates. Long-term care sits between the two with tighter budgets. Commercial cleaning contractors buy on price and switch freely, and private label serves them well.

The buyer has shifted toward infection prevention and control specialists rather than facilities procurement. Those clinicians read efficacy data and compatibility lists rather than price schedules. Procurement still signs the order, but by then the specification has already been written, and a supplier who has not persuaded the clinical team is competing for a decision that was made without them.
disinfectant-chemicals-market-end-use-penetration-index-1787549232412

Where the Money Sits

These are among the four positions where our research anticipates prominent divergence between winners and laggards over the coming forecast period. Each is grounded in the demand model, the regulatory perimeter, and the announced capacity pipeline.
01 / CONTACT TIME DIFFERENTIATION

Register the short claim, because the long one describes nothing

A product claiming full spectrum efficacy at ten minutes describes performance nobody achieves, because staff do not keep surfaces visibly wet that long and infection control teams have started auditing what actually happens. Generating shortened contact time data on an existing formulation costs $150,000 to $400,000 per claim and commands 20 to 35% price premiums against longer-contact competitors. Competitors cannot match it without repeating the whole registration process, which takes them years rather than the months a pricing response would need.
02 / COMPATIBILITY LISTING ACCESS

Get on the device lists, because absence excludes you silently

Equipment manufacturers publish approved disinfectant schedules because aggressive chemistry damages assets worth far more than years of consumable supply, and facilities running that equipment cannot use unlisted products whatever their efficacy data demonstrates. Compatibility testing is genuinely inexpensive and takes only months to complete, yet it gates access to above 30% of institutional facilities across most developed markets. Suppliers who treat it as a technical afterthought end up losing accounts they never even discover they had been excluded from competing for.
03 / DOSING SYSTEM ATTACHMENT

Install the dispenser, because dilution decides whether it works

Professional concentrates are diluted around one to one hundred and twenty-eight at point of use, and dilution accuracy determines whether the applied solution meets the efficacy claim printed on its label. Supplying wall-mounted dosing, training, and verification alongside the concentrate lifts gross margin 8 to 14 percentage points and makes the whole account genuinely difficult to displace. It also protects the supplier whenever an efficacy failure caused by careless dilution would otherwise have been blamed squarely on the product itself.
04 / REGISTRATION BUDGET PRIORITISATION

Register selectively, because comprehensive filing exhausts the budget

Each efficacy claim in each jurisdiction costs around USD 850,000, and a professional product typically needs several before international sale becomes possible at all. Prioritising by addressable volume rather than registering comprehensively by default gets revenue moving years earlier and avoids funding dossiers for organisms and territories that will never repay them. Licensing registrations to regional partners covers smaller markets without direct expenditure, and the suppliers who file everywhere by default consistently run out of regulatory budget before their competitors do.

Engagement Snapshot From the Field

A live engagement with an industry participant carrying material or product regulatory and market exposure ahead of a defining policy shift, showing how our research translates into a defensible multi-year portfolio strategy.
MARKET MINDS ADVISORY · CLIENT ENGAGEMENT SUMMARY
Disinfectant Chemicals Producer Strategic Portfolio Review and Transition Roadmap 2026·Investment Scenario on Disinfectant Chemicals Exposure Evaluation 2025-26
CLIENT PROFILE
A European supplier of institutional disinfectant products serving healthcare, long-term care, and commercial cleaning customers across five countries, with revenue near EUR 88 million (client-reported, unverified by MMA). The portfolio was weighted heavily toward quaternary ammonium chemistry, carried mainly ten minute contact time claims, and appeared on no device manufacturer compatibility lists. Healthcare accounts had been slipping steadily.
STRATEGIC CHALLENGE
Two hospital groups had switched to competitors offering shorter contact time claims, and a third had excluded the client's products after its medical equipment supplier narrowed its compatibility list. Regulatory review was meanwhile threatening several quaternary formulations. Management needed to know which problem to address first and what each would cost.
MMA APPROACH
MMA analysed account losses against claim profiles and compatibility status, sized the healthcare and food processing opportunities by contact time requirement, and modelled the cost and timeline of new efficacy data against reformulation toward peroxide chemistry. Forty-seven expert interviews with infection control specialists, procurement leads, and cleaning managers established what actually drives switching.
KEY FINDINGS
  1. Every healthcare account lost in three years had gone to a competitor offering a shorter contact time claim, and none had cited price as any part of the decision they made.
  2. Compatibility testing against the four dominant device platforms in the client's markets would cost under two hundred thousand euros and open facilities representing a third of regional healthcare beds.
  3. Quaternary formulations under active regulatory review represented 44% of client revenue, and no peroxide alternative existed in the portfolio to absorb that volume if restrictions landed.
  4. Commercial cleaning accounts contributed volume that amortised registration costs but earned under a third of healthcare margin, and private label was taking that channel steadily.
CLIENT PROFILE
A European supplier of institutional disinfectant products serving healthcare, long-term care, and commercial cleaning customers across five countries, with revenue near EUR 88 million (client-reported, unverified by MMA). The portfolio was weighted heavily toward quaternary ammonium chemistry, carried mainly ten minute contact time claims, and appeared on no device manufacturer compatibility lists. Healthcare accounts had been slipping steadily.
STRATEGIC CHALLENGE
Two hospital groups had switched to competitors offering shorter contact time claims, and a third had excluded the client's products after its medical equipment supplier narrowed its compatibility list. Regulatory review was meanwhile threatening several quaternary formulations. Management needed to know which problem to address first and what each would cost.
MMA APPROACH
MMA analysed account losses against claim profiles and compatibility status, sized the healthcare and food processing opportunities by contact time requirement, and modelled the cost and timeline of new efficacy data against reformulation toward peroxide chemistry. Forty-seven expert interviews with infection control specialists, procurement leads, and cleaning managers established what actually drives switching.
KEY FINDINGS
  1. Every healthcare account lost in three years had gone to a competitor offering a shorter contact time claim, and none had cited price as any part of the decision they made.
  2. Compatibility testing against the four dominant device platforms in the client's markets would cost under two hundred thousand euros and open facilities representing a third of regional healthcare beds.
  3. Quaternary formulations under active regulatory review represented 44% of client revenue, and no peroxide alternative existed in the portfolio to absorb that volume if restrictions landed.
  4. Commercial cleaning accounts contributed volume that amortised registration costs but earned under a third of healthcare margin, and private label was taking that channel steadily.
RECOMMENDED STRATEGY
Phase 1: Phase one: commission device compatibility testing immediately, since it costs least, completes fastest, and opens facilities currently closed to the business entirely. Phase 2: Phase two: generate shortened contact time data on the strongest existing formulations, prioritising claims by the healthcare volume each one actually addresses. Phase 3: Phase three: develop peroxide alternatives for the quaternary products under review, sequencing development against the regulatory timetable rather than commercial convenience.
OUTCOME
The client completed compatibility testing within five months and secured listing on all four platforms. Shortened contact time claims followed on three formulations, healthcare revenue grew 29% across two years at improved pricing, and blended gross margin rose 6.4 percentage points (client-reported, unverified by MMA).

Frequently Asked Questions

Foundational context covering the market sizes, CAGR, scope, country, region and competition that inform every finding below. This section is provided to cover basics and most often pre-purchase conversations, answered from the MMA Primary Research Dataset.

What is the current size of the Disinfectant Chemicals Market?

The market was valued at USD 11.4 billion in 2025, rising to an estimated USD 12.00 billion in 2026. East Asia holds the largest regional share at 29% of global value.

How large will the Disinfectant Chemicals Market be by 2036?

MMA forecasts USD 20.12 billion by 2036 under the base case, an expansion multiple of 1.68 times the 2026 value. That represents USD 8.12 billion of incremental value across the forecast period.

What is the CAGR for the Disinfectant Chemicals Market 2026 to 2036?

The base case CAGR is 5.3%, with a bull case of 6.5% and a bear case of 4.1%. The spread reflects uncertainty over infection control protocol tightening and institutional budget pressure.

Which segment is growing fastest?

Advanced oxidation and silver-based systems grow fastest at 9.8%, roughly 1.85 times the market rate. Hydrogen peroxide and peracetic acid follow at 7.4% on no-rinse food processing demand.

Who are the major companies in the Disinfectant Chemicals Market?

Ecolab, Diversey, Reckitt Benckiser, Lonza, and Stepan Company lead on disinfectant chemical revenue. The top five hold only 34% of global value, since registration is national and distribution local.

Which country is growing fastest?

India grows fastest at 8.4%, driven by private hospital construction and accreditation frameworks specifying infection control protocols that were previously informal. Export food processing adds peracetic acid demand.

Report Segmentation Architecture

The full report scope spans multiple orthogonal segmentation dimensions, with cross-tabulated demand data provided for each dimension pair. Coverage extends further to regional breakdowns, trend trajectories, and the competitive detail needed to support segment-level decision-making.

By Active Chemistry

  • Quaternary Ammonium Compounds
  • Chlorine-Based Disinfectants
  • Hydrogen Peroxide and Peracetic Acid
  • Alcohol-Based Disinfectants
  • Phenolic and Aldehyde Disinfectants
  • Advanced Oxidation and Silver-Based Systems

By End-Use Industry

  • Acute Healthcare and Hospitals
  • Food and Beverage Processing
  • Long-Term Care and Institutional Settings
  • Commercial Cleaning and Facilities Management
  • Agriculture and Livestock Production

By Sales Model

  • Direct Institutional Supply with Service
  • Dosing System Inclusive Contracts
  • Distributor and Janitorial Channel
  • Private Label Manufacturing
  • Registration Licensing to Regional Partners

By Region

  • North America
  • Western Europe
  • East Asia
  • South Asia and Pacific
  • Latin America
  • Middle East and Africa
  • Eastern Europe

Scope, Methodology, and Coverage

Every figure in this report is reproducible from documented input assumptions. The scope below maps the historical period, the forecast horizon, the segmentation dimensions, and the countries covered, alongside the underlying primary and qualitative methodology.
Historical Period
2020 to 2025
Forecast Period
2026 to 2036
Base Year
2025 (USD billions; MMA Primary Research Dataset, August 2026)
Market Definition
The market comprises disinfectant active chemicals and formulated disinfectant products for professional, institutional, and industrial surface, instrument, and equipment use, covering quaternary ammonium compounds, chlorine-based disinfectants, hydrogen peroxide and peracetic acid, alcohol-based disinfectants, phenolic and aldehyde disinfectants, and advanced oxidation and silver-based systems. Value is measured at supplier level across healthcare, food processing, institutional, commercial, and agricultural applications. Cooling water treatment biocides, drinking and wastewater treatment chemicals, cosmetic and industrial preservatives, antibiotic pharmaceuticals, sterilisation equipment and autoclaves, and personal antiseptics fall outside scope.
Quantitative Units
USD billions (current prices); million litres of concentrate supplied annually; USD per litre by chemistry and application
Segmentation Dimensions
By Active Chemistry; By End-Use Industry; By Sales Model; By Region
Regions Covered
North America, Western Europe, East Asia, South Asia and Pacific, Latin America, Middle East and Africa, Eastern Europe
Countries Covered
United States, Canada, Mexico, Germany, France, United Kingdom, Netherlands, Italy, Spain, Belgium, Poland, Czechia, Romania, Hungary, China, Japan, South Korea, India, Australia, Indonesia, Thailand, Brazil, Mexico, Chile, Colombia, Saudi Arabia, United Arab Emirates, Egypt, South Africa
Key Companies Profiled
Ecolab, Diversey, Reckitt Benckiser, Lonza, Stepan Company, Solvay, Evonik Industries, BASF, Clariant, Arxada, Kersia, Christeyns, Zep Inc, STERIS, Neogen, Nouryon, PCC Group, Solenis, Sanosil, Tristel
Quantitative Methodology
Primary survey, n=3,800 respondents, Q4 2025, six countries; demand-side model with trade association cross-validation
Qualitative Methodology
47 expert interviews, Q4 2025; applied to validate demand model assumptions, identify emerging dynamics, and assess competitive positioning
Report Format
PDF and XLSX data workbook (Word format preview document)
Publisher
Market Minds Advisory
Report Code
MMA-2026-CHM-192
Published
August 2026
Contact
sales@marketmindsadvisory.com | www.marketmindsadvisory.com

Purchase the full Disinfectant Chemicals Market Report (2026 to 2036).

The full report sizes disinfectant chemical demand across six active chemistries, five end-use categories, and seven regions with 2026 to 2036 forecasts under base, bull, and bear cases. It separates registered healthcare demand from commercial cleaning volume, which behave as different businesses with different buyers and margins. Competitive profiles cover twenty suppliers assessed consistently on disinfectant revenue, registered claim breadth, and compatibility listing status. Cost analysis traces active ingredient and registration maintenance exposure by portfolio mix. Commercial guidance addresses contact time differentiation, compatibility listing access, dosing system attachment, and registration prioritisation.
Six active chemistries sized separately by region
Healthcare demand separated from commercial cleaning volume
Contact time claims compared across twenty suppliers
Device compatibility listing mapped as facility access
Quaternary regulatory attrition tracked by jurisdiction and timetable
Registration cost economics modelled against addressable claim volume

Built For The People Who Decide

From boardroom strategy to bench-side execution, this report is read cover-to-cover by leaders shaping the next decade of their industry, turning demand scenarios, market dynamics and valuation benchmarks into decisions.
CXOs/ Presidents/ VPs/ Managers
M&A and Corporate Development
Strategy Teams and R&D Heads
Procurement and Product Directors
Regulatory and Compliance Leaders
Investor Relations and Equity Analysts