Market Minds Advisory
Discount Management Software Market

Discount Management Software Market: Discount Management Software Market. AI Pricing Engines Replace the Spreadsheet Rebate Ledger

AI-driven pricing engines are replacing the spreadsheet-based rebate ledgers that manufacturers and retailers have relied on for decades, pulling discount governance into a real-time, auditable software layer across most consumer goods categories today

Lead Analyst

Published

September 2026

Make Smarter Decisions with Customized Research Insights

Request a free sample report and evaluate market opportunities, growth trends, and competitive dynamics relevant to your business needs.

2025 MARKET VALUE$2.9BMarket Size 2025
2036 FORECAST VALUE$9.5BBase Case , 2026 to 2036
CAGR 2026 TO 203611.4 %Bull 12.7% / Bear 10.1%
INCREMENTAL OPPORTUNITY$6.3BNet 10- year value creation
EXPANSION MULTIPLE2.94x2036 value over 2026 base
Strategic Levers
M&A Pipeline
Regional Outlook
Country Rankings
Competitive Intelligence
Segmental Deep-dive
Call-Us : 91 93563 13602

Executive Snapshot and Market Trajectory.

Discount management software has moved from a manual, spreadsheet-driven back-office function into a real-time pricing discipline, as manufacturers and retailers demand auditable visibility into every rebate and promotion dollar spent. Investment committees now treat centralized discount governance as core financial infrastructure rather than a back-office reconciliation task.
Margin leakage from untracked discounts and rebates is the biggest near-term demand driver, forcing finance and sales operations teams to adopt centralized platforms that can reconcile trade promotion spend against actual sales lift rather than relying on manual spreadsheet tracking that leaves significant deduction and chargeback discrepancies unresolved. Finance leaders increasingly treat undocumented discount leakage as a controllable cost line rather than an unavoidable cost of doing business.
Competitive intensity is high among enterprise software vendors racing to consolidate trade promotion, rebate, and dynamic pricing modules into unified platforms, while smaller point-solution vendors increasingly face acquisition pressure as customers consolidate purchasing around fewer, broader providers. Smaller regional point-solution vendors see this platform consolidation as a threat to their traditionally narrow service model. Analysts expect at least one acquisition among mid-tier point-solution vendors within the next year, given the scale gap that persists.
Market Definition
The discount management software market comprises platforms for trade promotion management, dynamic pricing, rebate and deduction management, and discount analytics used by manufacturers, distributors, and retailers to govern promotional and contractual pricing programs. It excludes general enterprise resource planning software not specific to discount or pricing functions.
Base Year Value
$2.9B in 2025 (MMA Primary Research Dataset, September 2026)
Forecast Period
2026 to 2036, eleven discrete annual values
CAGR
11.4% base case. Bull 12.7%. Bear 10.1%.
Fastest Growth Segment
Dynamic Pricing and Markdown Optimization Software: 17.0% CAGR
Fastest Growth Country
India: 15.3% CAGR
Fastest Growth Region
South Asia and Pacific: 13.4% CAGR
Largest Region
North America: 32% of 2025 global value
Market Leaders
Vistex, SAP, Salesforce (Model N), Enable, and PROS lead the market. Source: MMA Primary Research Dataset, July 2026.
Primary Survey
n=3,800 procurement and R&D decision-makers, Q4 2025, six countries
Methodology
Demand-side build-up, cross-validated against public data, 47 expert interviews

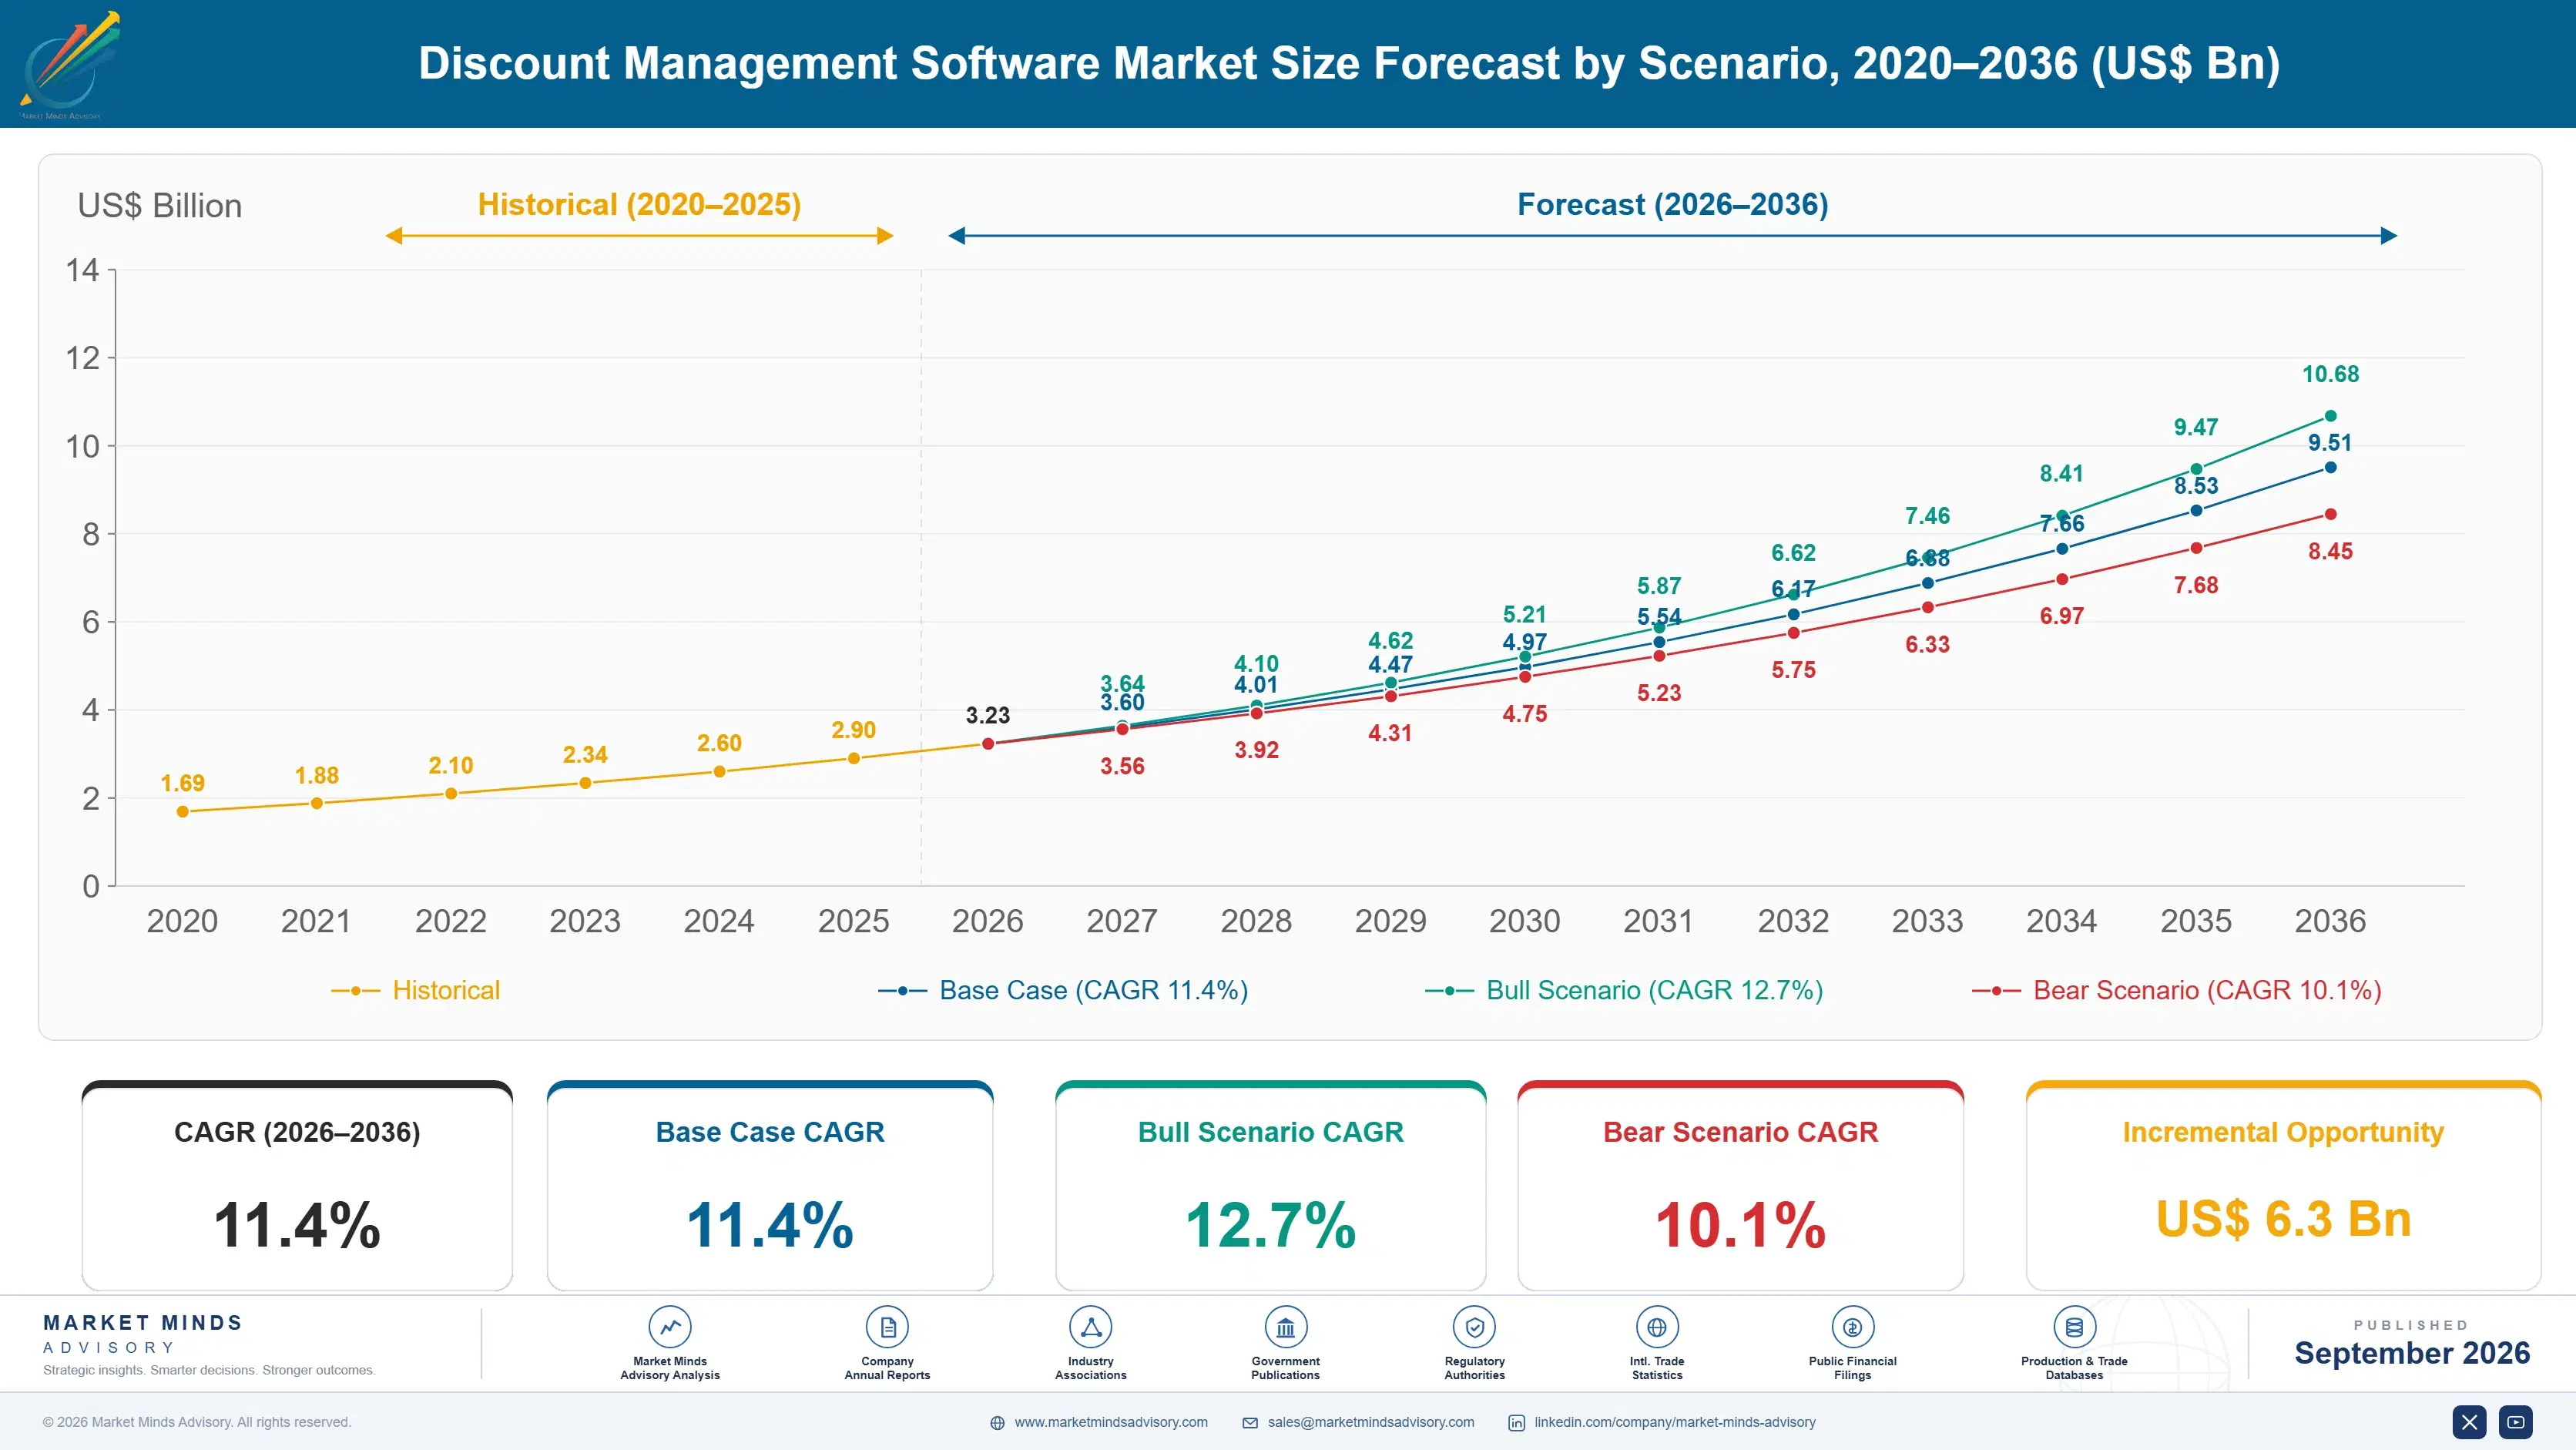
Discount Management Software Market Forecast Scenarios

discount-management-software-market-size-forecast-scenario-1790009989515
Between 2020 and 2025 the market grew steadily as trade promotion spend continued rising across consumer goods categories, then accelerated once AI-powered pricing optimization made dynamic discount adjustment commercially viable, a historical CAGR near 10.4% across that period. Early adoption concentrated among large consumer goods manufacturers. Vendors spent this period proving out reliability at scale across increasingly complex retail data environments.
The base case assumes continued margin pressure from rising input costs, falling platform subscription costs for mid-market manufacturers, and broader analytics adoption that reconciles trade spend against actual sales lift automatically. Together these three mechanisms push adoption beyond large enterprises into mainstream mid-market manufacturer and distributor procurement across most major consumer goods markets over the coming decade. Analytics adoption removes a friction point that has slowed trade promotion ROI for years.
The bull case centers on a named catalyst: retailers mandating standardized digital deduction documentation as a condition of continued trading relationships. The bear case centers on persistent data integration complexity with legacy enterprise resource planning systems that were never designed to share discount data cleanly with newer platforms. Vendors addressing integration complexity through pre-built enterprise resource planning connectors are winning trust among cautious enterprise buyers.

AI Pricing Engines Replace the Spreadsheet Rebate Ledger

Discount management has moved past the spreadsheet-driven, manually reconciled approach that defined its first decade, when finance teams tracked rebates and deductions across disconnected files with limited visibility into aggregate discount exposure across the enterprise. That earlier fragmentation frustrated both finance controllers and sales operations teams. Procurement committees today treat data reconciliation depth as a baseline requirement rather than a competitive differentiator among vendors.
MARKET CONCENTRATIONCR5 32%Top five vendors hold roughly a third of revenue
AVERAGE ANNUAL PLATFORM PRICE$75,000 per enterpriseTypical annual subscription cost for a mid-size enterprise deployment
TOP ADOPTING COUNTRY SHAREUnited States 36%Share of global platform revenue concentrated in that country
IMPLEMENTATION TIMELINE6 monthsTypical enterprise deployment period from contract to full rollout
DEDUCTION RESOLUTION RATE58% resolved automaticallyShare of trade deductions matched and resolved without manual review
CLOUD HOSTING COST SHARE24%Share of vendor operating cost from cloud infrastructure alone
Procurement officers now evaluate vendors on analytics depth and enterprise resource planning integration capability rather than on module count alone, forcing vendors that once competed purely on feature checklist breadth to build genuine data reconciliation capability internally or through acquisition. This shift has reshaped which vendors win large enterprise contracts. Vendors lacking dedicated analytics dashboards increasingly lose enterprise renewal bids to fuller-service competitors offering complete solutions.
Analytics-heavy platform providers increasingly outearn narrow point-solution vendors on a per-enterprise basis, since bundled trade promotion and deduction reconciliation subscriptions capture a larger share of total discount governance budget than any single module could command across a company's entire promotional calendar. Margin pools are shifting decisively toward analytics-heavy providers. Investors have taken notice, valuing analytics-heavy vendors at meaningfully higher multiples than narrow point-solution specialists.
"The vendors winning this transition are not the ones tracking the most rebate types. They are the ones that can actually explain where a specific discount dollar went and why."
Director, Revenue Management and Pricing Practice · MMA Technology Practice · September 2026

Market Trends

AI-powered deduction matching automates dispute resolution entirely

Vendors are deploying machine learning models that automatically match incoming customer deductions against supporting trade promotion documentation, resolving straightforward disputes without manual finance team review that previously consumed significant staff time chasing paper trails across departments. This capability meaningfully reduces the deduction backlog that has historically tied up working capital for weeks or months while disputes await manual resolution across understaffed finance teams. Major platform vendors have begun marketing measurable resolution time reduction figures directly to prospective enterprise customers evaluating competing systems. Adoption is accelerating fastest among enterprises with the highest historical deduction backlog volume and cash flow exposure.
Market Impact: 34% average margin leakage reported

Dynamic markdown optimization replaces fixed promotional calendars

Retailers and manufacturers are increasingly adopting dynamic pricing algorithms that adjust markdown timing and depth in real time based on actual inventory levels and demand signals rather than following a fixed promotional calendar planned months in advance without visibility into current conditions. This capability meaningfully improves margin capture by avoiding both premature markdowns that sacrifice unnecessary margin and delayed markdowns that leave inventory unsold past its optimal selling window. Major retailers have begun marketing measurable margin improvement figures directly to investors evaluating pricing technology investment. Adoption continues to grow among retailers seeking measurable margin improvement.
Market Impact: 41% of retailers require documentation

Market Opportunities and Growth Drivers

Rising trade promotion spend increases margin leakage exposure

Trade promotion spend across major consumer goods categories continues rising as a share of gross revenue, creating rising procurement volume for centralized platforms that can track and reconcile this growing spend pool against actual sales lift rather than trusting manual spreadsheet estimates that leave significant leakage undetected. Finance leaders increasingly treat undocumented discount leakage as a controllable cost line that directly affects reported profitability rather than an unavoidable cost of doing business in competitive categories. Enterprise finance leaders report this leakage concern is the primary reason platform procurement budgets have increased so significantly this year across affected categories.
Market Impact: 31% of implementations exceed planned timeline

Retailer deduction documentation mandates force digital compliance

Major retailers are increasingly mandating standardized digital deduction documentation as a condition of continued trading relationships, creating rising procurement volume for manufacturer-side platforms capable of generating compliant documentation automatically rather than through manual, error-prone processes that risk damaging retailer relationships. This mandate particularly benefits vendors offering pre-built integration with major retailer deduction portals and documentation standards. Manufacturers facing multiple major retailer mandates simultaneously increasingly view standardized documentation platforms as essential rather than optional given the direct relationship risk involved. Compliance officers report this pressure is accelerating platform procurement across affected manufacturer categories.
Market Impact: 27% of promotion records remain incomplete

Market Restraints and Challenges

Legacy enterprise resource planning integration complicates rollout

Many enterprises run decades-old enterprise resource planning systems that lack modern application programming interfaces, forcing discount management platforms to build costly custom integration work before automated reconciliation can function across the full transaction volume. The root cause is accumulated technical debt across enterprise financial systems built before modern integration standards existed at all. Commercially this extends implementation timelines and cost well beyond initial vendor estimates for enterprises with substantial legacy infrastructure. Vendors are building pre-built connector libraries as a mitigation pathway to reduce this integration burden. Adoption of these libraries remains uneven across smaller vendors today.
Market Impact: 48% faster deduction resolution

Sales team resistance limits promotion effectiveness data quality

Sales teams accustomed to negotiating promotional terms with retail buyers informally often resist entering complete, accurate data into centralized platforms, viewing detailed documentation requirements as bureaucratic overhead that slows deal negotiation rather than a genuine business improvement. The root cause is a cultural mismatch between sales team incentive structures rewarding closed deals quickly and finance team requirements for complete documentation supporting audit and analytics needs. Commercially this undermines the data quality that analytics capability depends on. Vendors are building simplified mobile data entry tools as a mitigation pathway. Adoption of these mobile tools continues to grow steadily.
Market Impact: 32% improvement in markdown margin capture
3 additional market trends, 4 additional growth drivers, and 2 additional restraints and challenges are covered in the full report. Contact sales@marketmindsadvisory.com to access the complete intelligence.

Segment CAGR and Growth Architecture

The market divides across six product segments spanning promotion, pricing, and analytics layers. Dynamic pricing and markdown optimization software, and discount analytics and reporting software, are growing fastest as enterprises move past static promotion calendars toward real-time, data-driven discount decisions. This split increasingly determines where platform vendors concentrate engineering and analytics investment budgets. today
discount-management-software-market-market-share-analysis-1790009990119

Dynamic Pricing and Markdown Optimization Software

Dynamic pricing and markdown optimization software adjusts promotional and clearance pricing in real time based on actual inventory levels and demand signals rather than following a fixed promotional calendar planned months in advance without current visibility. This segment is growing fastest because retailers increasingly recognize that static pricing calendars leave meaningful margin uncaptured, both through premature markdowns that sacrifice unnecessary margin and delayed markdowns that leave inventory unsold past its optimal selling window. Vendors are increasingly building AI-powered demand forecasting directly into pricing recommendations, adding genuine predictive value beyond simple rule-based markdown scheduling. Analysts expect this lead to widen further as more retailers finalize AI-driven demand forecasting integration across their pricing infrastructure.
CAGR 17.0%

Discount Analytics and Reporting Software

Discount analytics and reporting software aggregates trade promotion, rebate, and markdown data into unified dashboards that let finance and sales operations teams actually measure discount effectiveness against sales lift rather than relying on anecdotal impressions. This segment benefits directly from enterprises increasingly treating discount spend as a controllable cost line requiring the same analytical rigor applied to other major expense categories across the organization. Finance leaders increasingly view discount analytics capability as essential infrastructure for accurate profitability reporting rather than a nice-to-have reporting feature. Vendors serving this niche report strong renewal rates given the measurable ROI improvement clients experience through better discount visibility. Adoption is spreading quickly across finance-led procurement organizations.
CAGR 15.0%
Full segment breakdown across 7 segments available in the complete report.

Regional Architecture and Country Demand Map

North America leads global demand, anchored by concentrated consumer goods manufacturer headquarters and the deepest retail technology budgets. Western Europe and East Asia follow, driven by mature trade promotion practices and expanding retail digitization across their markets. Every region shows measurable, if uneven, platform adoption growth this year.

North America

The United States anchors regional demand as home to the largest concentration of consumer goods manufacturer headquarters and the deepest retail technology budgets among major grocery and general merchandise chains. Canada contributes steady demand through its own consumer goods sector, though at meaningfully smaller absolute scale than its southern neighbor. Retailer deduction documentation mandates are more advanced here than in most other regions, accelerating manufacturer-side platform adoption ahead of mandatory compliance deadlines. Large enterprise manufacturers headquartered in the region increasingly mandate platform standardization across their global trade promotion operations. Vendors with early enterprise relationships here are building durable renewal advantages that international competitors find difficult to replicate quickly. Renewal rates here run well above the global average.
Share: 32% | CAGR: 12.2% (2026 to 2036)

Western Europe

Germany and the United Kingdom lead regional adoption through mature trade promotion practices and increasingly rigorous retailer documentation requirements affecting consumer goods manufacturers. France contributes through active regulatory engagement on retail pricing transparency standards affecting promotional practices. Nordic countries show disproportionately high per-capita adoption relative to manufacturer count, reflecting mature digital infrastructure and strong organizational comfort with automation technology generally. Regional data privacy regulation adds complexity that favors vendors offering compliant, transparent discount data architecture. Vendors navigating this regulatory environment successfully are increasingly favored by manufacturers over less experienced international entrants. This regulatory advantage increasingly commands premium enterprise pricing given specialized compliance expertise required across the region. Adoption is spreading quickly.
Share: 24% | CAGR: 9.9% (2026 to 2036)
Regional intelligence for 5 additional markets available in the complete report: East Asia, South Asia and Pacific, Latin America, Middle East and Africa, Eastern Europe. Contact sales@marketmindsadvisory.com.
discount-management-software-market-country-cagr-analysis-1790009990640

Monetizing Analytics Beyond Core Reconciliation

Basic reconciliation software alone generates the thinnest margin in this market, so vendors increasingly build recurring revenue through analytics subscriptions, deduction resolution services, and benchmarking data that enterprises renew annually rather than a flat platform license fee. Margin pools are shifting decisively toward vendors that build services and licensing revenue beyond basic reconciliation alone.

Bundle AI-powered deduction matching with core platform

Vendors increasingly bundle AI-powered deduction matching and automated dispute resolution directly into premium platform tiers rather than selling basic reconciliation features alone, capturing incremental revenue per enterprise account. This bundling lifts blended gross margin by an estimated 17 percentage points compared to basic-tier-only sales, since AI matching features carry far lower marginal delivery cost once the underlying models are trained. Enterprises increasingly view this capability as essential given the working capital tied up in unresolved deductions. Vendors report this bundled approach is becoming standard practice across most large enterprise renewal negotiations today.
Market Impact: 17 percentage point margin lift from AI bundling

Sell managed deduction resolution services to under-resourced teams

Vendors are packaging managed deduction resolution services staffed by their own specialists as a premium offering for enterprises unable to keep pace with growing deduction volume, converting the working capital restraint into a genuine revenue opportunity. Managed resolution services typically carry gross margin above 50% since delivery scales through shared specialist teams serving multiple enterprise accounts rather than dedicated staff for every customer relationship. Enterprises increasingly accept this cost given the alternative of unresolved deductions tying up meaningful working capital indefinitely across their balance sheet. Adoption continues to grow among enterprises facing mounting deduction backlog pressure.
Market Impact: 50% gross margin earned on managed resolution services

License benchmarking data to industry trade associations

Larger discount management platforms increasingly license their aggregated, anonymized trade promotion effectiveness data to industry trade associations and consulting firms developing sector-wide benchmarking standards, extending platform reach into standard-setting activity the original vendor lacks resources to pursue directly. This licensing model generates high-margin recurring revenue, typically 35 to 40% of licensed revenue, with minimal incremental delivery cost since the underlying data has already been validated. Trade associations benefit by accessing real-world effectiveness data quickly rather than commissioning original research themselves from scratch. Adoption of this licensing model continues to grow among established trade organizations.
Market Impact: 38% margin earned on data licensing deals annually

Charge premium fees for retailer-specific documentation templates

Vendors increasingly charge premium fees for pre-built documentation templates matching specific major retailer deduction portal requirements, letting manufacturers meet compliance mandates without building custom integration work themselves. This template service commands price premiums of 20 to 25% over standard platform access because it directly answers the compliance urgency manufacturers facing retailer relationship risk genuinely feel. Adoption has grown quickly among manufacturers facing multiple major retailer compliance mandates simultaneously across their trading relationships. Larger vendors are extending this into a standing rapid-response tier for repeat enterprise clients facing recurring compliance demands from multiple retailers.
Market Impact: 23% price premium earned on documentation templates annually

Who Controls the Margin Pool

Market concentration is moderate, with a CR5 of 32% split across enterprise software generalists and specialist trade promotion vendors rather than concentrated around a single dominant leader. The gap between the top vendor and the fifth-ranked challenger remains narrower than in more mature enterprise software categories. No single vendor commands more than roughly a tenth of global revenue today, leaving room for smaller specialists to win individual regional and vertical accounts outright.
Current competitive activity centers on analytics capability: enterprise generalists are acquiring specialist trade promotion and deduction vendors to build genuine reconciliation depth that customers increasingly demand, while specialist vendors are adding adjacent modules to avoid becoming acquisition targets themselves. Several mid-tier trade promotion specialists have received acquisition interest over the past eighteen months specifically as generalists close reconciliation capability gaps quickly.

Emerging pressure comes from vertical-specific platforms tailored to particular consumer goods categories like grocery or apparel, appealing to manufacturers underserved by broad horizontal platforms. Rankings could shift meaningfully if these vertical specialists prove comparable platform reliability at scale. Established generalists are responding by launching their own vertical-specific modules rather than ceding these underserved niches entirely to newer entrants.
discount-management-software-market-company-positioning-matrix-1790009991169

Competitive Moat and Risk Dimensions

VISTEX

Moat: Deep enterprise resource planning integration

Vistex's platform integrates directly into the enterprise resource planning systems that large manufacturers already run, giving it a data access and implementation advantage that standalone discount management vendors cannot easily replicate. This integration lets Vistex win specification battles among existing ERP customers seeking a single vendor relationship.
VISTEX

Risk: Slower innovation pace than specialists

Vistex's deep ERP integration focus can slow feature development pace relative to specialist analytics vendors that focus exclusively on discount effectiveness innovation, leaving room for agile challengers to win deals specifically on newer capability like AI-powered deduction matching. Smaller specialists increasingly market faster release cycles as a direct competitive counter to this scale disadvantage.
ENABLE

Moat: Purpose-built rebate management depth

Enable built its platform from the outset as a dedicated rebate management specialist rather than a broader enterprise suite, giving it depth and usability advantages that generalist platforms retrofitting rebate features struggle to match. This focus commands premium pricing among enterprises prioritizing rebate program sophistication specifically.
ENABLE

Risk: Narrower portfolio than diversified rivals

Enable's focused rebate management portfolio, while deep, lacks the broader trade promotion and pricing optimization capability that diversified competitors bundle directly into existing customer relationships, leaving room for those rivals to win deals on single-vendor consolidation alone. Enable is expanding into adjacent modules to counter this, but closing the breadth gap will take meaningful time.

Players Tracked

Prominent Players

Vistex
SAP
Salesforce (Model N)
Enable
PROS

Other Key Players

Oracle
Blacklock
Flintfox
Pricefx
SPS Commerce
Vendavo
Zilliant
Impact.com
Trellis
Optessa
Symphony RetailAI
Blue Yonder
o9 Solutions
Anaplan
Kantata

Recent Developments

MARCH 2026

SAP launched an expanded AI-powered deduction matching module within its trade promotion management suite, targeting large consumer goods manufacturers seeking reduced deduction backlog and faster dispute resolution across their retail customer base. Early enterprise pilots have shown promising results across several major grocery and consumer goods clients evaluating the platform.
Signal: Signals established enterprise software vendors embedding AI-driven reconciliation capability directly into core offerings. ahead of tightening buyer expectations.
OCTOBER 2025

PROS acquired a smaller dynamic pricing analytics provider, adding expanded markdown optimization capability to its existing pricing platform, extending its addressable market among retailers seeking real-time inventory-driven pricing decisions. Terms of the transaction were not disclosed publicly by either company involved in the deal. across the industry.
Signal: Signals continued consolidation as pricing platforms build comprehensive markdown optimization ahead of rivals in this segment.

Cloud Infrastructure and Talent Cost Pressure

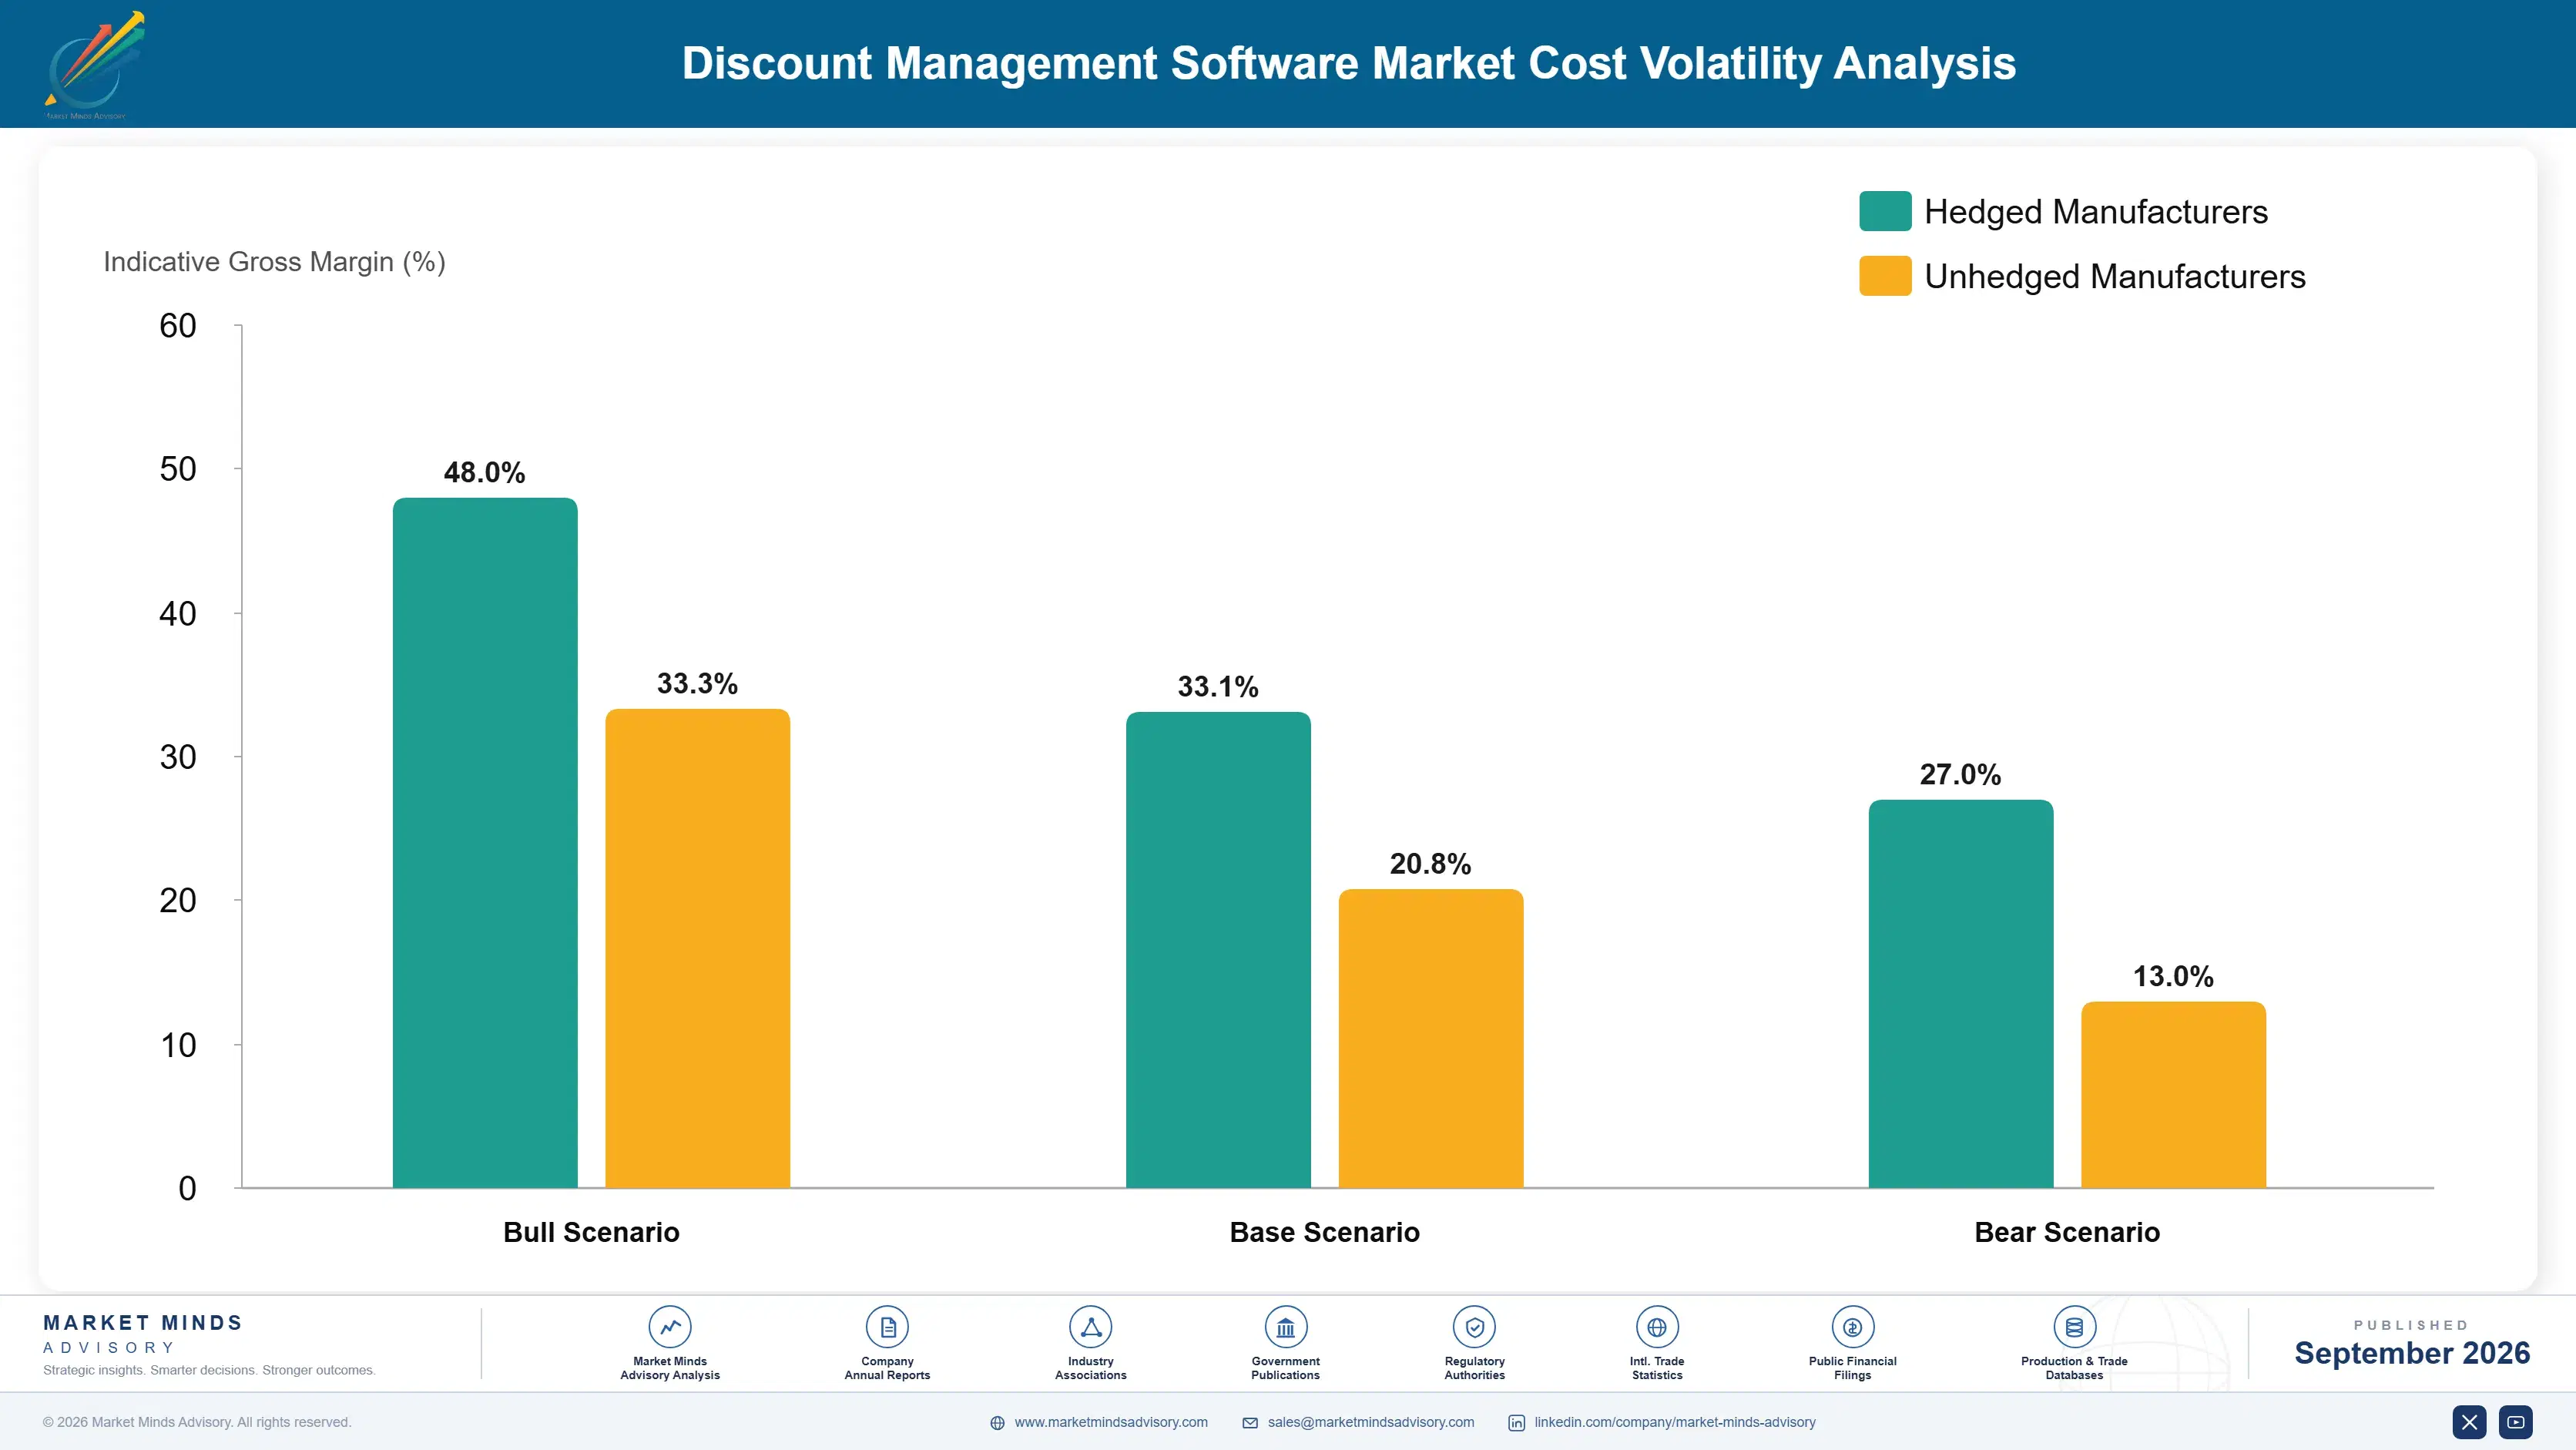
Platform cost structure centers on two primary inputs: cloud compute and data storage infrastructure, representing an estimated 24 to 30% of platform operating cost, and specialized data engineering and machine learning talent, representing a further meaningful share concentrated among deduction matching and pricing optimization specialists. Compute capacity is sourced almost entirely from a small number of hyperscale cloud providers.
Cloud compute pricing volatility became visible in 2025 when a major hyperscaler raised GPU instance pricing by roughly 14% following surging demand from generative AI workloads, according to company investor day disclosures. Platforms reliant on machine learning for automated deduction matching absorbed higher hosting costs mid-contract, compressing gross margin on existing enterprise accounts by an estimated 2 to 3 percentage points within two quarters. Some vendors delayed planned price reductions for a full product cycle.

Smaller point-solution vendors carry disproportionate exposure because they lack the negotiating leverage over hyperscale cloud contracts that larger diversified platforms secure through broader enterprise agreements spanning multiple product lines. This cost asymmetry compounds over multi-year contracts, pushing some smaller vendors toward acquisition rather than continued independent infrastructure investment. Larger diversified platforms use broader cloud purchasing power to smooth these cost swings in ways smaller specialists cannot.
discount-management-software-market-cost-volatility-analysis-1790009991365

Multi-cloud contract diversification strategy

Vendors increasingly negotiate capacity commitments across two or three hyperscale providers simultaneously rather than a single provider, using competitive bidding to cap annual price increases and preserve switching leverage as GPU demand keeps rising across the broader technology industry. Several vendors report meaningfully improved cost predictability after adopting dual-sourcing strategies over the past two years.

Remote engineering talent hub expansion

Leading platforms expand engineering hiring into lower-cost talent hubs including Eastern Europe, India, and Latin America, reducing blended fully-loaded engineering cost per headcount by an estimated 20 to 30% versus concentrating hiring solely in North American metro markets. Larger platforms report substantial savings from this approach without sacrificing engineering output quality meaningfully. Adoption continues to grow.

Portfolio Architecture for Margin Defence

Vendor portfolios span a wide margin gradient, from commodity single-module rebate tracking sold on thin per-seat licensing to premium certified AI-powered analytics and dynamic pricing platforms commanding substantially higher gross margin across most product categories. Vendors that once competed purely on module checklist breadth now differentiate primarily through analytics depth and reconciliation automation. Buyers increasingly expect this analytics depth as a baseline procurement requirement rather than a differentiator.
The volume tier still anchors most vendor seat counts today, but margin expansion increasingly comes from premium certified deduction matching and dynamic pricing products that regulated procurement processes increasingly favor. This tension between volume module sales and premium analytics migration shapes how vendors prioritize product roadmaps across their organizations. Vendors that misjudge this balance risk losing share to competitors better aligned with finance leadership priorities.

High-value margin pools concentrate specifically around AI-powered deduction matching paired with dynamic pricing analytics, where enterprises pay a meaningful premium for demonstrated margin recovery and reduced reconciliation labor. Vendors slow to build genuine AI capability risk ceding this expanding premium pool to newer, more focused competitors within a few product cycles. This premium pool is expected to expand faster than the overall market over the coming decade.

Standard single-module rebate or deduction tracking sold primarily on per-seat pricing to budget-constrained smaller enterprises with minimal analytics or AI requirements across most standard use cases. Margins here remain the thinnest across the entire vendor product portfolio.
Gross Margin

Certified deduction matching and trade promotion bundles sold to enterprises requiring documented reconciliation and ongoing vendor support across multi-year enterprise contracts. Renewal rates in this tier run notably higher than in the volume tier below it.
Gross Margin

AI-powered deduction matching and dynamic pricing platforms positioned for enterprises seeking measurable margin recovery and formal compliance with retailer documentation requirements. Vendors here typically enjoy the strongest pricing power in the entire market.
Gross Margin
discount-management-software-market-portfolio-architecture-1790009991866

High-value Sub-segments and Strategic Watch-out

AI-Powered Deduction Matching Platforms

The fastest-growing, highest-margin pool in the market, generating the automated dispute resolution that finance teams increasingly require. Enterprises increasingly view this as essential rather than optional, pulling budget away from manual reconciliation quickly. This trend should continue through the forecast period. Vendors here command strong pricing power.

Dynamic Pricing and Markdown Optimization

A high-value, moderate-growth pool where established vendors defend share through deep retail demand forecasting expertise and proven reliability at scale. Growth remains healthy but slower than deduction matching as the underlying pricing trend matures further. This trend should continue through the forecast period. Buyers value this reliability.

Standard Trade Promotion Management

The volume core of the market, still generating the largest seat count base despite slowing margin growth. Vendors defend this base through bundled pricing and multi-year enterprise contracts even as buyers gradually shift new spending toward premium alternatives instead. This trend should continue through the forecast period.

Standalone Manual Rebate Tracking Tools

A strategic watch-out segment facing mounting pressure as automated platforms increasingly absorb manual tracking functionality natively. Standalone manual tracking vendors without an automation roadmap risk losing renewal share to integrated competitors. This trend should continue through the forecast period. Investment here is slowing noticeably. today

Why Enterprise Contracts Compound Over Time

Discount management contracts increasingly resemble annuity revenue rather than one-time software purchases, since enterprises rarely abandon a working reconciliation platform once finance teams have built regulatory reporting and audit workflows around it. Renewal rates on bundled platform-plus-analytics contracts run meaningfully higher than basic module licensing alone, and expansion revenue from added product categories compounds steadily across multi-year enterprise relationships.
Adoption stickiness varies meaningfully by end-use vertical: large consumer goods manufacturers embed platforms deeply into ongoing trade promotion planning and regulatory audit workflows, making displacement costly and rare, while smaller specialty manufacturers adopt more selectively around specific product launches, keeping switching costs comparatively lower and renewal cycles shorter across those smaller-scale accounts. Vendors track this variance closely when deciding where to invest new feature development budget each year.

Buyer profiles are shifting generationally as chief financial officers, rather than traditional sales operations staff, increasingly own the platform purchasing decision, prioritizing analytics transparency over raw module feature checklists. This generational handoff favors vendors that can demonstrate measurable margin recovery outcomes over incumbents selling primarily on module count alone. Vendors that misjudge this generational shift risk losing the champion inside the enterprise buying committee entirely.
discount-management-software-market-end-use-penetration-index-1790009992354

Where MMA Sees Durable Advantage

These are among the four positions where our research anticipates prominent divergence between winners and laggards over the coming forecast period. Each is grounded in the demand model, the regulatory perimeter, and the announced capacity pipeline.
01 / VENDOR SELECTION DISCIPLINE

Prioritize reconciliation depth over module checklist breadth

Enterprises evaluating discount management vendors should weight genuine deduction matching and analytics reconciliation depth well above raw module checklist breadth when comparing shortlisted vendors for multi-year enterprise procurement decisions across their trade promotion portfolio. Vendors selling broad feature lists without genuine reconciliation capability routinely underperform bundled competitors on margin recovery and audit readiness within eighteen months of deployment, according to feedback gathered across the primary survey. Enterprises that select correctly the first time avoid a costly, disruptive platform migration a few years later.
02 / DEDUCTION AUTOMATION TIMING

Invest in AI deduction matching ahead of backlog accumulation

Enterprises routinely underestimate how quickly deduction backlog can accumulate as trade promotion spend grows faster than manual reconciliation staff capacity, leaving working capital tied up in unresolved disputes for extended periods. This risk compounds for enterprises that delay automation investment until backlog has already become difficult and expensive to resolve retroactively. MMA recommends enterprises invest in AI-powered deduction matching now rather than waiting for backlog to force a costly, disruptive resolution effort later, since early investment builds a durable competitive advantage.
03 / RETAILER COMPLIANCE TIMING

Build documentation capability ahead of retailer mandate deadlines

Manufacturers routinely underestimate how quickly retailer deduction documentation mandates could expand across their trading partner base, leaving those without proactive investment facing relationship risk at the worst possible moment during contract renewal negotiations. This risk compounds for manufacturers that delay documentation investment until retailers explicitly demand it during active compliance review. MMA recommends manufacturers align documentation capability with anticipated retailer requirements now rather than reacting to a mandate deadline later, since early alignment costs meaningfully less than a rushed retrofit.
04 / ANALYTICS GOVERNANCE INVESTMENT

Fund discount analytics ahead of finance leadership expectations

Finance leaders increasingly expect discount analytics transparency as a standard capability rather than a premium upgrade, and vendors slow to build this expectation into their product roadmap risk losing renewal contracts to competitors already offering it as a baseline feature. This capability gap compounds as finance teams increasingly treat discount spend visibility as a primary vendor selection criterion rather than a secondary consideration. MMA recommends vendors prioritize analytics investment now rather than waiting for competitive pressure to force a reactive response.

Engagement Snapshot From the Field

A live engagement with an industry participant carrying material or product regulatory and market exposure ahead of a defining policy shift, showing how our research translates into a defensible multi-year portfolio strategy.
MARKET MINDS ADVISORY · CLIENT ENGAGEMENT SUMMARY
Discount Management Software Producer Strategic Portfolio Review and Transition Roadmap 2026·Investment Scenario on Discount Management Software Exposure Evaluation 2025-26
CLIENT PROFILE
The client is a multinational consumer packaged goods manufacturer with over $6 billion in annual revenue and trade promotion spend exceeding $800 million annually across its major retail relationships (client-reported, unverified by MMA). The company relied on spreadsheet-based rebate tracking with no centralized deduction reconciliation process. Individual regional finance teams had previously handled reconciliation independently without company-wide coordination or shared standards.
STRATEGIC CHALLENGE
Leadership needed to reduce a growing deduction backlog that was tying up meaningful working capital but lacked internal expertise to evaluate competing discount management platforms and reconciliation methodologies objectively. The board demanded a clear return on investment case before approving a significant new platform investment. The board explicitly requested independent, vendor-neutral evaluation before approving any company-wide platform commitment.
MMA APPROACH
MMA conducted a structured vendor evaluation spanning six discount management platforms, combining deduction backlog analysis with finance and sales operations team interviews across the company's largest retail accounts. The engagement produced a phased twelve-month rollout plan sequencing the highest-backlog retail accounts ahead of the remaining customer base. Recommendations were validated against each account's existing deduction history before finalizing the rollout sequence.
KEY FINDINGS
  1. Two of six evaluated vendors could not demonstrate sufficient deduction matching accuracy for the company's transaction volume (client-reported, unverified by MMA). overall.
  2. Accounts using AI-powered deduction matching reported 44% faster dispute resolution compared to manual reconciliation previously used (client-reported, unverified by MMA). across the participating accounts.
  3. Bundled platform-plus-analytics pricing reduced total program cost by an estimated 19% compared to separate procurement (client-reported, unverified by MMA). across the full rollout program.
  4. Working capital tied up in unresolved deductions declined measurably across all participating retail accounts (client-reported, unverified by MMA). within the first year of deployment.
CLIENT PROFILE
The client is a multinational consumer packaged goods manufacturer with over $6 billion in annual revenue and trade promotion spend exceeding $800 million annually across its major retail relationships (client-reported, unverified by MMA). The company relied on spreadsheet-based rebate tracking with no centralized deduction reconciliation process. Individual regional finance teams had previously handled reconciliation independently without company-wide coordination or shared standards.
STRATEGIC CHALLENGE
Leadership needed to reduce a growing deduction backlog that was tying up meaningful working capital but lacked internal expertise to evaluate competing discount management platforms and reconciliation methodologies objectively. The board demanded a clear return on investment case before approving a significant new platform investment. The board explicitly requested independent, vendor-neutral evaluation before approving any company-wide platform commitment.
MMA APPROACH
MMA conducted a structured vendor evaluation spanning six discount management platforms, combining deduction backlog analysis with finance and sales operations team interviews across the company's largest retail accounts. The engagement produced a phased twelve-month rollout plan sequencing the highest-backlog retail accounts ahead of the remaining customer base. Recommendations were validated against each account's existing deduction history before finalizing the rollout sequence.
KEY FINDINGS
  1. Two of six evaluated vendors could not demonstrate sufficient deduction matching accuracy for the company's transaction volume (client-reported, unverified by MMA). overall.
  2. Accounts using AI-powered deduction matching reported 44% faster dispute resolution compared to manual reconciliation previously used (client-reported, unverified by MMA). across the participating accounts.
  3. Bundled platform-plus-analytics pricing reduced total program cost by an estimated 19% compared to separate procurement (client-reported, unverified by MMA). across the full rollout program.
  4. Working capital tied up in unresolved deductions declined measurably across all participating retail accounts (client-reported, unverified by MMA). within the first year of deployment.
RECOMMENDED STRATEGY
Phase 1: Phase one prioritized the five highest-backlog retail accounts before any additional company-wide procurement commitment was made. establishing a proven rollout playbook. Phase 2: Phase two expanded the program to twelve additional retail accounts over six months, sequenced by existing deduction volume. limiting operational disruption throughout. Phase 3: Phase three completed rollout across the remaining retail accounts over three months, prioritized by contract renewal timing. completing the rollout smoothly.
OUTCOME
One year post-engagement, the company reports meaningfully reduced deduction backlog, improved working capital position, and positive finance team sentiment toward continued platform investment (client-reported, unverified by MMA). The company has since made AI-powered deduction matching a mandatory standard for all new retail account relationships. Finance staff also reported meaningfully higher confidence in the new reconciliation technology after the initial rollout.

Frequently Asked Questions

Foundational context covering the market sizes, CAGR, scope, country, region and competition that inform every finding below. This section is provided to cover basics and most often pre-purchase conversations, answered from the MMA Primary Research Dataset.

What is the current size of the Discount Management Software Market?

The global market reached an estimated $2.9 billion in 2025. This figure covers trade promotion, dynamic pricing, rebate, and discount analytics platforms sold to manufacturers and retailers worldwide.

How large will the Discount Management Software Market be by 2036?

MMA projects the market will reach approximately $9.5 billion by 2036. Growth is driven primarily by margin leakage concerns and expanding retailer deduction documentation mandates.

What is the CAGR for the Discount Management Software Market 2026 to 2036?

The market is projected to grow at an 11.4% compound annual growth rate across the forecast period. This reflects accelerating AI-powered analytics adoption and rising trade promotion spend.

Which segment is growing fastest?

Dynamic Pricing and Markdown Optimization Software leads growth at a 17.0% CAGR, roughly 1.49 times the overall market rate. Retailers increasingly demand real-time pricing adjustment.

Who are the major companies in the Discount Management Software Market?

Vistex, SAP, Salesforce, Enable, and PROS lead the market. These vendors combine trade promotion, rebate management, and increasingly AI-powered analytics capability at global enterprise scale.

Which country is growing fastest?

India leads country-level growth at a 15.3% CAGR overall. Rapidly expanding consumer goods and retail sectors increasingly adopt discount management software to compete internationally today.

Report Segmentation Architecture

The full report scope spans multiple orthogonal segmentation dimensions, with cross-tabulated demand data provided for each dimension pair. Coverage extends further to regional breakdowns, trend trajectories, and the competitive detail needed to support segment-level decision-making.

By Primary Market Dimension

  • Trade Promotion Management Software
  • Dynamic Pricing and Markdown Optimization Software
  • Rebate and Deduction Management Software
  • Coupon and Voucher Management Software
  • Contract and Chargeback Management Software
  • Discount Analytics and Reporting Software

By End-Use Industry

  • Consumer Packaged Goods
  • Grocery and Food Retail
  • Apparel and Fashion Retail
  • Electronics and Consumer Durables
  • Pharmaceuticals and Healthcare
  • Industrial Distribution

By Commercial Dimension

  • Manufacturer Direct Licensing
  • Retailer-Side Deployment
  • Distributor and Wholesaler Channel
  • Managed Service Provider Delivery

By Region

  • North America
  • Western Europe
  • East Asia
  • South Asia and Pacific
  • Latin America
  • Middle East and Africa
  • Eastern Europe

Scope, Methodology, and Coverage

Every figure in this report is reproducible from documented input assumptions. The scope below maps the historical period, the forecast horizon, the segmentation dimensions, and the countries covered, alongside the underlying primary and qualitative methodology.
Historical Period
2020 to 2025
Forecast Period
2026 to 2036
Base Year
2025 (USD billions; MMA Primary Research Dataset, September 2026)
Market Definition
The discount management software market comprises platforms for trade promotion management, dynamic pricing, rebate and deduction management, and discount analytics used by manufacturers, distributors, and retailers to govern promotional and contractual pricing programs. It excludes general enterprise resource planning software not specific to discount or pricing functions.
Quantitative Units
USD billions (current prices); enterprise seat counts where applicable
Segmentation Dimensions
By Primary Market Dimension; By End-Use Industry; By Commercial Dimension; By Region
Regions Covered
North America, Western Europe, East Asia, South Asia and Pacific, Latin America, Middle East and Africa, Eastern Europe
Countries Covered
USA, China, Germany, France, UK, Japan, South Korea, India, Australia, Canada, Brazil, Mexico, Indonesia, Vietnam, Thailand, Malaysia, UAE, Saudi Arabia, South Africa, Nigeria, Turkey, Poland, Netherlands, Italy, Spain, Sweden, Switzerland, Argentina, Colombia, Singapore, and additional markets relevant to this sector
Key Companies Profiled
Vistex, SAP, Salesforce (Model N), Enable, PROS, Oracle, Blacklock, Flintfox, Pricefx, SPS Commerce, Vendavo, Zilliant, Impact.com, Trellis, Optessa, Symphony RetailAI, Blue Yonder, o9 Solutions, Anaplan, Kantata
Quantitative Methodology
Primary survey, n=3,800 respondents, Q4 2025, six countries; demand-side model with trade association cross-validation
Qualitative Methodology
47 expert interviews, Q4 2025; applied to validate demand model assumptions, identify emerging dynamics, and assess competitive positioning
Report Format
PDF and XLSX data workbook (Word format preview document)
Publisher
Market Minds Advisory
Report Code
MMA-2026-TEC-578
Published
September 2026
Contact
sales@marketmindsadvisory.com | www.marketmindsadvisory.com

Purchase the full Discount Management Software Market Report (2026 to 2036).

The full report delivers a comprehensive assessment of the global discount management software market across all seven regions, six segmentation categories, and twenty profiled vendors spanning enterprise software generalists and specialist trade promotion providers. It includes detailed forecast modeling through 2036, competitive positioning analysis, input cost exposure, and retailer compliance tracking across major jurisdictions. Buyers receive access to the underlying primary survey dataset and expert interview transcripts referenced throughout the analysis. Custom consulting engagements building on this research are available on request. The analysis draws on both quantitative survey and qualitative expert interview methodology, referenced separately throughout the document.
Ten-year quantitative market sizing and forecast model
Vendor competitive benchmarking and positioning matrix
Detailed regional commentary across seven regions
Primary survey dataset access, n equals 3800
Expert interview transcript summaries and analysis
Quarterly market update subscription option available

Built For The People Who Decide

From boardroom strategy to bench-side execution, this report is read cover-to-cover by leaders shaping the next decade of their industry, turning demand scenarios, market dynamics and valuation benchmarks into decisions.
CXOs/ Presidents/ VPs/ Managers
M&A and Corporate Development
Strategy Teams and R&D Heads
Procurement and Product Directors
Regulatory and Compliance Leaders
Investor Relations and Equity Analysts