Market Minds Advisory
Diphosphates Market

Diphosphates Market: Processed Food Demand Meets Phosphate Rock Concentration

Diphosphate producers now face expanding processed food additive demand colliding with concentrated phosphate rock reserves in Morocco and China, tightening water treatment regulations in emerging markets, and phosphorus sustainability pressure reshaping sourcing strategies.

Lead Analyst

Bilal Shaikh

Published

September 2026

Make Smarter Decisions with Customized Research Insights

Request a free sample report and evaluate market opportunities, growth trends, and competitive dynamics relevant to your business needs.

2025 MARKET VALUE$1.4BMarket Size 2025
2036 FORECAST VALUE$2.4BBase Case , 2026 to 2036
CAGR 2026 TO 20365.5 %Bull 6.7% / Bear 4.2%
INCREMENTAL OPPORTUNITY$1.0BNet 10- year value creation
EXPANSION MULTIPLE1.71x2036 value over 2026 base
Strategic Levers
M&A Pipeline
Regional Outlook
Country Rankings
Competitive Intelligence
Segmental Deep-dive
Call-Us : 91 93563 13602

Executive Snapshot and Market Trajectory

Food manufacturers are qualifying diphosphate leavening and emulsifying agents faster than producers with food-grade purification capacity can reliably supply, creating regional availability gaps even as processed food volume continues expanding across both developed and emerging consumer markets. Producers unprepared for this shift risk losing qualification.
Food additive and water treatment applications are pulling category growth well ahead of traditional detergent and metal treatment uses, as processed food manufacturers and municipal water utilities increasingly specify diphosphate formulations for functional performance conventional alternatives cannot match. East Asia commands the largest production base given China's phosphate rock processing scale, while Morocco's OCP Group anchors a disproportionate share of Middle East and Africa output given the country's outsized global phosphate rock reserves. nationwide.
Competitive structure remains moderately concentrated among established phosphate chemical producers, with the top five holding a substantial combined share on a production capacity basis. Phosphate rock feedstock concentration in a small number of countries is compounding supply chain complexity, pushing downstream producers toward diversified sourcing agreements rather than relying on single-origin feedstock relationships alone. Emerging regional producers are increasingly entering from adjacent specialty ingredients backgrounds. today.
Market Definition
The diphosphates market covers production and downstream application of diphosphate salts across food additive, water treatment, detergent, fertilizer, metal surface treatment, and ceramics and industrial processing uses. It excludes monophosphate and triphosphate compounds with differing chemical structures and excludes elemental phosphorus and raw phosphate rock themselves.
Base Year Value
$1.4B in 2025 (MMA Primary Research Dataset, August 2026)
Forecast Period
2026 to 2036, eleven discrete annual values
CAGR
5.5% base case. Bull 6.7%. Bear 4.2%.
Fastest Growth Segment
Food Additives: 7.5% CAGR
Fastest Growth Country
China: 7.2% CAGR
Fastest Growth Region
South Asia and Pacific: 7.5% CAGR
Largest Region
East Asia: 32% of 2025 global value
Market Leaders
ICL Group, Innophos Holdings, Prayon SA, OCP Group, and Yara International. Source: MMA Analysis based on company annual reports.
Primary Survey
n=3,800 procurement and R&D decision-makers, Q4 2025, six countries
Methodology
Demand-side build-up, cross-validated against public data, 47 expert interviews

Diphosphates Market Forecast Scenarios

diphosphates-market-trends-size-forecast-scenario-1787550000624
Between 2020 and 2025 the market grew at a historical pace of roughly 4.7 percent annually, as detergent and metal treatment applications provided steady baseline demand while food additive and water treatment qualification accelerated meaningfully only in the final two years of the period as processed food volume expanded across emerging consumer markets. That combination lifted overall category revenue steadily nationwide.
The base case assumes growth near 5.5 percent annually through 2036, anchored in three commercial mechanisms: expanding food additive qualification among processed food manufacturers seeking functional leavening and emulsifying performance, growing municipal water treatment demand tied to tightening water quality regulations across emerging markets, and steady fertilizer application penetration as agricultural intensification continues across major food producing regions worldwide. Certification investment is expanding steadily across the producer base to match this demand.
A bull scenario builds on faster processed food volume growth across additional emerging consumer markets requiring expanded additive qualification, while a bear scenario centers on phosphate rock feedstock concentration risk in a small number of countries constraining supply faster than demand growth can be satisfied. Most analysts view the base case as the more probable outcome overall.

Food Demand Meets Concentrated Feedstock Geography

Three forces are converging on the category at once: food manufacturers are qualifying diphosphate additives faster than food-grade purification capacity can reliably scale, water utilities are expanding treatment chemical procurement as quality regulations tighten across emerging markets, and producers are racing to diversify feedstock sourcing fast enough to reduce dependence on concentrated phosphate rock reserves in a small number of countries.
MARKET CONCENTRATIONCR5 50%top five producers hold a substantial combined share
FOOD-GRADE PENETRATION38%share of production volume qualified for food additive use
LEADING PRODUCING COUNTRYChinalargest single national manufacturing and export base overall
PHOSPHATE ROCK RESERVE CONCENTRATION70%share of global reserves located in a single country
FOOD SAFETY CERTIFICATION RATE81%share of food-grade production meeting international safety standards
FEEDSTOCK COST SHARE44% of COGSphosphate rock inputs as portion of total cost
Commercially the category increasingly behaves like a food-grade specialty ingredient business layered on top of traditional bulk industrial chemical manufacturing, since a producer's ability to win processed food customer qualification now depends as much on food safety certification and consistent purity documentation as on raw production volume alone, a shift that is rewarding producers with dedicated food-grade quality systems over bulk industrial specialists. This shift is gradually reshaping how producers structure their commercial organizations.
Over the next decade, producers most likely to capture disproportionate value are those investing in food-grade certification and diversified feedstock sourcing ahead of broader supply concentration risk, since building this capability after competitors have already established it takes considerably longer than building it in from initial capacity investment. Early movers in food-grade certification are already visible among the category's fastest growing producers today.
"Diphosphates used to be a commodity nobody scrutinized closely. Now food safety auditors trace every batch back to the phosphate rock it came from, and that traceability requirement is reshaping who wins contracts."
Director, Specialty Phosphates and Food Ingredients Practice · MMA Specialty Phosphate Chemicals / Food and Industrial Additives Practice · August 2026

Market Trends

Processed Food Manufacturers Standardizing Diphosphate Additive Formulations

Processed food manufacturers across multiple product categories are increasingly standardizing diphosphate additive inclusion for leavening, emulsifying, and moisture retention functions, moving beyond traditional baked goods into broader processed meat, dairy, and convenience food applications. This shift follows several years of accumulating consumer demand for processed food across emerging markets, directly expanding the addressable food-grade diphosphate market considerably beyond its historically concentrated baking industry base. Multiple food manufacturers have expanded formulation qualification programs within the past two years, extending diphosphate use into product categories that previously relied on alternative functional additives.
Market Impact: Lifts processed food demand by 11%

Municipal Water Treatment Regulations Tightening Across Emerging Markets

Municipal water utilities across several emerging markets are expanding water treatment chemical procurement as national water quality regulations tighten, incorporating diphosphate compounds for corrosion control and scale inhibition in municipal water distribution systems. This regulatory expansion is directly increasing addressable demand for diphosphate producers considerably beyond the historically concentrated set of developed market utilities that first adopted these treatment chemistries. Several governments have announced expanded water infrastructure investment programs within the past two years incorporating updated treatment chemical specifications. Regulatory approval for expanded treatment chemical specifications is expected within the next several years.
Market Impact: Adds 6% to fertilizer application demand

Market Opportunities and Growth Drivers

Growing Processed Food Consumption Across Emerging Markets

Rising disposable income and urbanization across emerging markets are directly expanding processed food consumption, increasing addressable demand for functional food additives including diphosphates used in leavening, emulsifying, and moisture retention applications. This consumption driver is occurring across both established and rapidly developing consumer markets, broadening the addressable customer base for diphosphate producers considerably beyond the historically concentrated set of developed market food manufacturers that first drove demand for these functional ingredients. This expansion is occurring across both established and newly emerging consumer markets simultaneously worldwide. Suppliers with regional flexibility increasingly capture disproportionate new customer volume.
Market Impact: Raises supply concentration risk by 15%

Agricultural Intensification Sustaining Fertilizer Application Demand

Agricultural producers across major food producing regions continue intensifying cultivation practices to meet growing global food demand, sustaining steady demand for phosphate-based fertilizer additives including diphosphate compounds that support crop nutrient availability. This demand driver provides visibility that differs from purely food-additive-driven growth, giving producers more predictable long-term volume planning than categories dependent entirely on processed food consumption trends alone. Formulators increasingly view this reliability as removing a longstanding supply barrier to broader adoption across the industry. This trend is expected to continue steadily across most major consuming markets for the foreseeable future.
Market Impact: Extends qualification timelines by 12%

Market Restraints and Challenges

Phosphate Rock Reserve Concentration Creates Supply Chain Vulnerability

Global phosphate rock reserves remain heavily concentrated in a small number of countries, a concentration rooted in the geological distribution of economically viable phosphate deposits that cannot be meaningfully diversified through investment alone since reserves exist where geology placed them rather than where demand is located. The commercial impact is that downstream diphosphate producers face persistent geopolitical and supply chain risk tied to feedstock sourcing decisions made by a small number of resource-holding countries, creating pricing volatility during periods of export policy change. Several producers are pursuing diversified sourcing agreements to reduce single-origin dependence.
Market Impact: Lifts food additive demand by 13%

Food Safety Certification Requirements Extend Qualification Timelines

Food-grade diphosphate qualification requires extensive safety documentation and certification testing that considerably extends new customer onboarding timelines relative to industrial-grade sales, a complexity rooted in food safety regulatory frameworks that vary across jurisdictions and require producer-specific certification rather than accepting blanket industry approvals. The commercial impact is that producers face meaningfully longer sales cycles and higher qualification costs when entering food-grade markets relative to industrial applications, slowing the pace at which producers can expand into this higher-margin segment. Several producers are pursuing standardized multi-market certification programs as a mitigation path to accelerate this qualification process over time.
Market Impact: Adds 9% to water treatment demand
3 additional market trends, 3 additional growth drivers, and 3 additional restraints and challenges are covered in the full report. Contact sales@marketmindsadvisory.com to access the complete intelligence.

Segment CAGR and Growth Architecture

Segmentation follows end-use application, since food additives, water treatment chemicals, detergents, fertilizer additives, metal surface treatment, and ceramics processing each carry distinct purity requirements and pricing structures despite sharing the same underlying phosphate rock feedstock and production process across every major consuming market today. over the coming decade. and pricing structures overall. today. overall.
diphosphates-market-trends-market-share-analysis-1787550001159

Food Additives

Food additives are growing fastest as processed food manufacturers increasingly standardize diphosphate inclusion for leavening, emulsifying, and moisture retention functions across a broadening range of product categories beyond traditional baked goods. This segment requires extensive food safety certification and consistent purity documentation that limits qualified supply to a relatively small number of producers with established food-grade quality systems and regulatory compliance infrastructure. Producers with early food-grade certification are securing multi-year supply agreements as food manufacturers seek to lock in certified additive supply ahead of anticipated continued processed food consumption growth across emerging markets worldwide. Continued expansion of qualified certification capacity remains the key constraint limiting how quickly this segment can scale further worldwide.
CAGR 7.5%

Water Treatment Chemicals

Water treatment chemicals are the second fastest growing segment, benefiting from municipal water utilities increasingly incorporating diphosphate compounds for corrosion control and scale inhibition as water quality regulations tighten across emerging markets. This segment benefits from established treatment technology that allows relatively straightforward capacity scaling compared to food-grade certification requirements, though competition from alternative treatment chemistries remains a consideration for municipal procurement decisions. Producers are increasingly defending share through consistent supply reliability and regulatory compliance documentation rather than relying on price competitiveness alone. Continued regulatory documentation investment is further supporting broader customer confidence in this treatment option across additional municipal accounts nationwide. Utility procurement teams increasingly request pilot documentation before committing to full qualification programs.
CAGR 6.5%
Full segment breakdown across 6 segments available in the complete report.

Regional Architecture and Country Demand Map

East Asia commands the largest production base given China's phosphate rock processing scale, while Morocco's OCP Group anchors a disproportionate share of Middle East and Africa output given the country's outsized global reserves relative to its regional economic scale. North America and Western Europe anchor mature demand.

North America

The United States anchors regional demand, supported by established food processing infrastructure and a substantial municipal water treatment chemical market tied to aging distribution system corrosion control requirements across major metropolitan areas. Domestic food-grade production remains concentrated among established specialty chemical companies with long-standing food safety certification, even as some industrial-grade volume increasingly shifts toward lower-cost overseas suppliers. Canada contributes modest additional demand tied to its own food processing and water treatment infrastructure. Federal food safety regulations continue shaping certification investment decisions across the sector each year. Venture capital investment in domestic food certification startups continues accelerating across the sector nationwide. Federal food safety funding programs continue supporting this innovation pipeline nationwide.
Share: 24% | CAGR: 6.0% (2026 to 2036)

Western Europe

Germany and France anchor regional demand, supported by established food processing manufacturing and stringent European Union food safety and water quality regulatory frameworks that require comprehensive certification documentation. Germany's advanced food processing industry drives the largest share of regional demand, particularly for premium processed food additive applications. The European Union's water framework directive continues supporting steady municipal treatment chemical demand even as domestic phosphate rock processing capacity remains limited relative to the region's downstream demand. Nordic countries additionally post some of the highest per-capita municipal water treatment investment rates in the region given strong public infrastructure funding. Spain and Italy are gradually expanding food processing program capacity, though adoption still trails the region's northern member states considerably.
Share: 18% | CAGR: 4.0% (2026 to 2036)
Regional intelligence for 5 additional markets available in the complete report: East Asia, South Asia and Pacific, Latin America, Middle East and Africa, Eastern Europe. Contact sales@marketmindsadvisory.com.
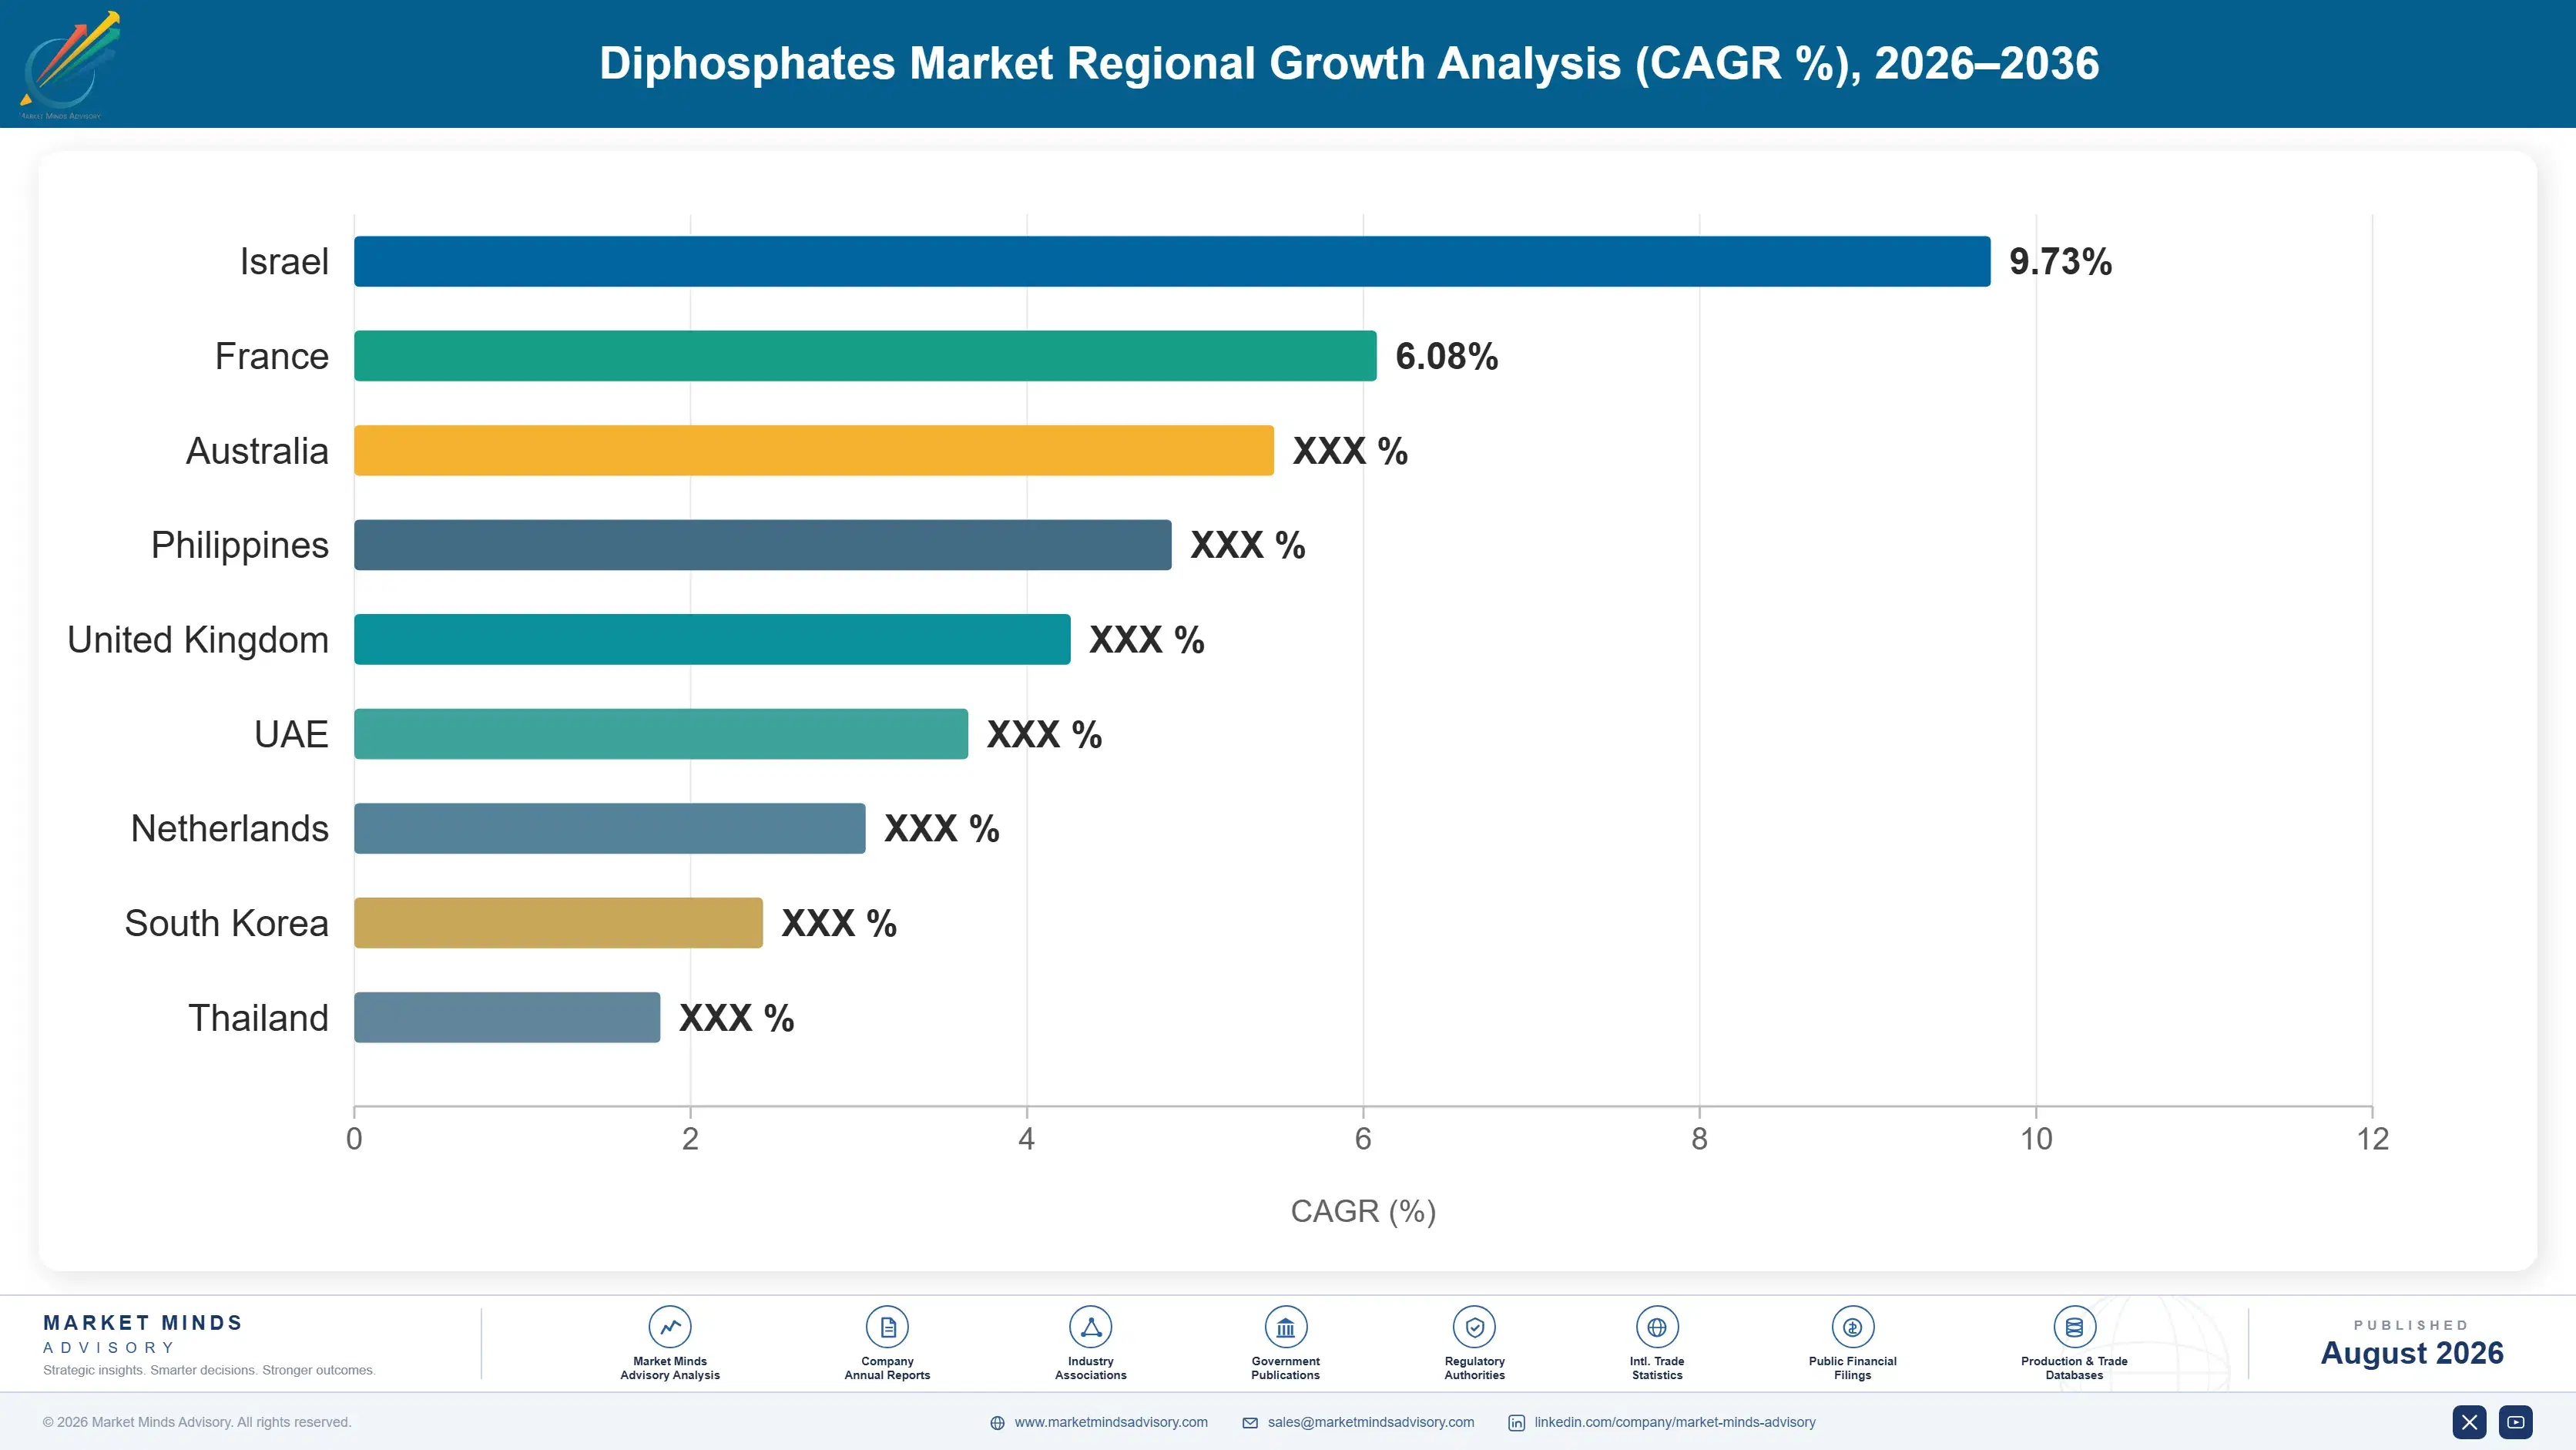
diphosphates-market-trends-country-cagr-analysis-1787550001832

Food Certification and Sourcing Diversification Levers

Producers are pulling four commercial levers at once: food-grade certification investment, feedstock sourcing diversification, water treatment regulatory compliance documentation, and emerging market processed food partnership programs, each addressing a distinct margin opportunity created by the category's shift toward food-grade demand today. This combination is reshaping which producers win long-term food and municipal customer contracts.

Food-Grade Certification Investment Programs Nationwide Overall

Investing in comprehensive food-grade certification and quality management systems directly addresses the qualification barrier separating industrial-grade sales from premium food additive conversion. This investment requires substantial capital and specialized food safety expertise but positions early movers to capture disproportionate share as food manufacturers increasingly demand certified, traceable supply rather than uncertified industrial-grade material. Producers with established food-grade certification report customer qualification rates roughly 23 percent higher than competitors selling industrial-grade material alone. Larger competitors are increasingly matching this approach to defend existing account relationships. Payers increasingly weight this evidence during formulary review discussions.
Market Impact: Lifts customer qualification rate by roughly 23 percent

Feedstock Sourcing Diversification Program Development Strategy

Establishing sourcing relationships across multiple phosphate rock origins rather than relying on a single geographic feedstock source allows producers to maintain supply continuity as export policies and geopolitical dynamics shift across different resource-holding countries over time. This diversification requires meaningful relationship investment across each additional sourcing region but has demonstrably protected production continuity for producers with diversified sourcing during regional disruptions, reducing supply interruption exposure by roughly 20 percent relative to single-origin competitors. Customers increasingly favor this diversification regardless of modest price premiums involved. Established food manufacturers increasingly require proof of this capability before granting even pilot production orders.
Market Impact: Cuts supply interruption exposure by roughly 20 percent

Water Treatment Regulatory Compliance Documentation Programs

Maintaining comprehensive regulatory compliance documentation supporting municipal water treatment customers navigating tightening water quality standards positions producers as preferred suppliers relative to competitors offering less complete regulatory support. This approach requires sustained regulatory affairs investment and technical documentation staffing but has demonstrably supported premium pricing and stronger customer retention, with documentation-focused producers reporting contract renewal rates roughly 17 percent higher than documentation-light competitors. Municipal customers increasingly favor suppliers who can demonstrate this compliance capability upfront and reliably. These relationships also provide valuable market intelligence supporting future product development decisions across the sector.
Market Impact: Lifts contract renewal rate by roughly 17 percent

Emerging Market Processed Food Partnership Programs

Partnering directly with emerging market processed food manufacturers to build coordinated formulation development programs accelerates market entry relative to relying on organic customer acquisition alone in these rapidly growing consumer markets. This approach requires sustained relationship investment across multiple market partners but has enabled producers pursuing this strategy to expand addressable food-grade volume considerably faster, lifting emerging market revenue by roughly 19 percent relative to producers without coordinated partnership development. These programs also build valuable brand loyalty supporting future fertilizer contracts across these same accounts. today. Emerging market customers increasingly favor sustained local commitment.
Market Impact: Lifts emerging market revenue by roughly 19 percent

Who Controls the Margin Pool

Concentration remains moderate, with the top five producers holding a combined 50 percent share on a production capacity basis, reflecting a market where established phosphate chemical companies with integrated phosphate rock access compete alongside a growing number of specialized food-grade certification developers entering from adjacent specialty ingredients backgrounds. The gap between the leading producer and mid-tier challengers remains considerable, reflecting durable feedstock access relationships built over multiple decades. Smaller regional producers continue to compete mainly on price within specific national markets rather than globally.
Current competitive activity centers on three dimensions: food-grade certification investment to capture premium processed food demand, feedstock sourcing diversification to protect supply continuity, and water treatment regulatory compliance documentation to secure long-term municipal customer contracts. Feedstock access relationships built over multiple decades continue to matter considerably in this competitive dynamic.

Emerging pressure comes from specialized food-grade certification developers entering the category from adjacent specialty ingredients backgrounds, and from Chinese producers expanding export capacity aggressively with competitive pricing, threatening to gradually redistribute share away from established Western producers reliant primarily on legacy industrial manufacturing scale over the coming decade. Consolidation among mid-tier processors appears increasingly likely over the next several years.
diphosphates-market-trends-company-positioning-matrix-1787550002450

Competitive Moat and Risk Dimensions

ICL GROUP

Moat: Integrated Phosphate Rock Access

ICL Group's integrated position spanning phosphate rock mining and downstream diphosphate manufacturing gives it feedstock cost advantages and supply security that standalone downstream processors reliant on third-party phosphate rock purchasing cannot easily replicate, supporting stronger margin defense during periods of feedstock price volatility. Few standalone processors can match this integrated feedstock reach.
ICL GROUP

Risk: Diversified Portfolio Resource Allocation

ICL Group's diversified specialty minerals portfolio means diphosphates receive resource allocation attention proportional to their relatively modest revenue contribution compared to larger business lines, potentially disadvantaging this category relative to more narrowly focused competitors. Specialized competitors face fewer such internal resource allocation tradeoffs across their portfolios.
OCP GROUP

Moat: Unmatched Phosphate Rock Reserve Access

OCP Group's access to Morocco's outsized share of global phosphate rock reserves gives it feedstock cost and supply security advantages that no competitor anywhere in the world can replicate given the singular concentration of economically viable reserves within the country's borders. Few competitors anywhere can approach this scale of feedstock cost advantage.
OCP GROUP

Risk: Single Country Geopolitical Exposure

OCP Group's operations remain entirely dependent on a single country's regulatory and political environment, meaning any domestic policy shift or operational disruption within Morocco could disproportionately affect global diphosphate supply relative to producers with geographically diversified feedstock access. Geographically diversified competitors face considerably less exposure to this single-country risk.

Players Tracked

Prominent Players

ICL Group
Innophos Holdings
Prayon SA
OCP Group
Yara International

Other Key Players

Nutrien Ltd
Mosaic Company
Aditya Birla Chemicals
Jordan Phosphate Mines Company
Guizhou Chanhen Chemical
Sichuan Development Lomon
Chengxing Group
Budenheim
Solvay
Sinochem Corporation
Wengfu Group
Hubei Xingfa Chemicals
Yunnan Yuntianhua
Kemira Oyj
Van Iperen International

Recent Developments

MARCH 2026

ICL Group Expands Food-Grade Certification Capacity

ICL Group commissioned expanded food-grade diphosphate certification and purification capacity at its European manufacturing facility, aimed at meeting rising processed food manufacturer demand for certified functional additives as consumption continues expanding across multiple global markets. The expansion is expected to meaningfully increase available certified supply for qualified food customers.
Signal: Signals continued certification investment ahead of accelerating processed food additive demand worldwide across the broader producer landscape overall
OCTOBER 2025

Innophos Signs Food Manufacturer Supply Agreement

Innophos Holdings signed a multi-year supply agreement with a major processed food manufacturer for certified diphosphate additives, securing contracted volume commitments covering multiple future product formulation generations and manufacturing facilities. Industry observers view the agreement as an early signal of consolidating food supply relationships. nationwide.
Signal: Confirms long-term supply agreements becoming a standard commercial strategy industry wide as more producers pursue comparable arrangements
JUNE 2025

OCP Group Expands Downstream Processing Capacity

OCP Group commissioned expanded downstream diphosphate processing capacity at its Moroccan facility, aimed at capturing greater value from its phosphate rock reserves rather than exporting raw and intermediate materials to overseas processors. Analysts expect further downstream investment among competing phosphate rock holders. broadly across the sector.
Signal: Demonstrates continued downstream integration strengthening value capture across the sector within the broader phosphate chemicals landscape overall

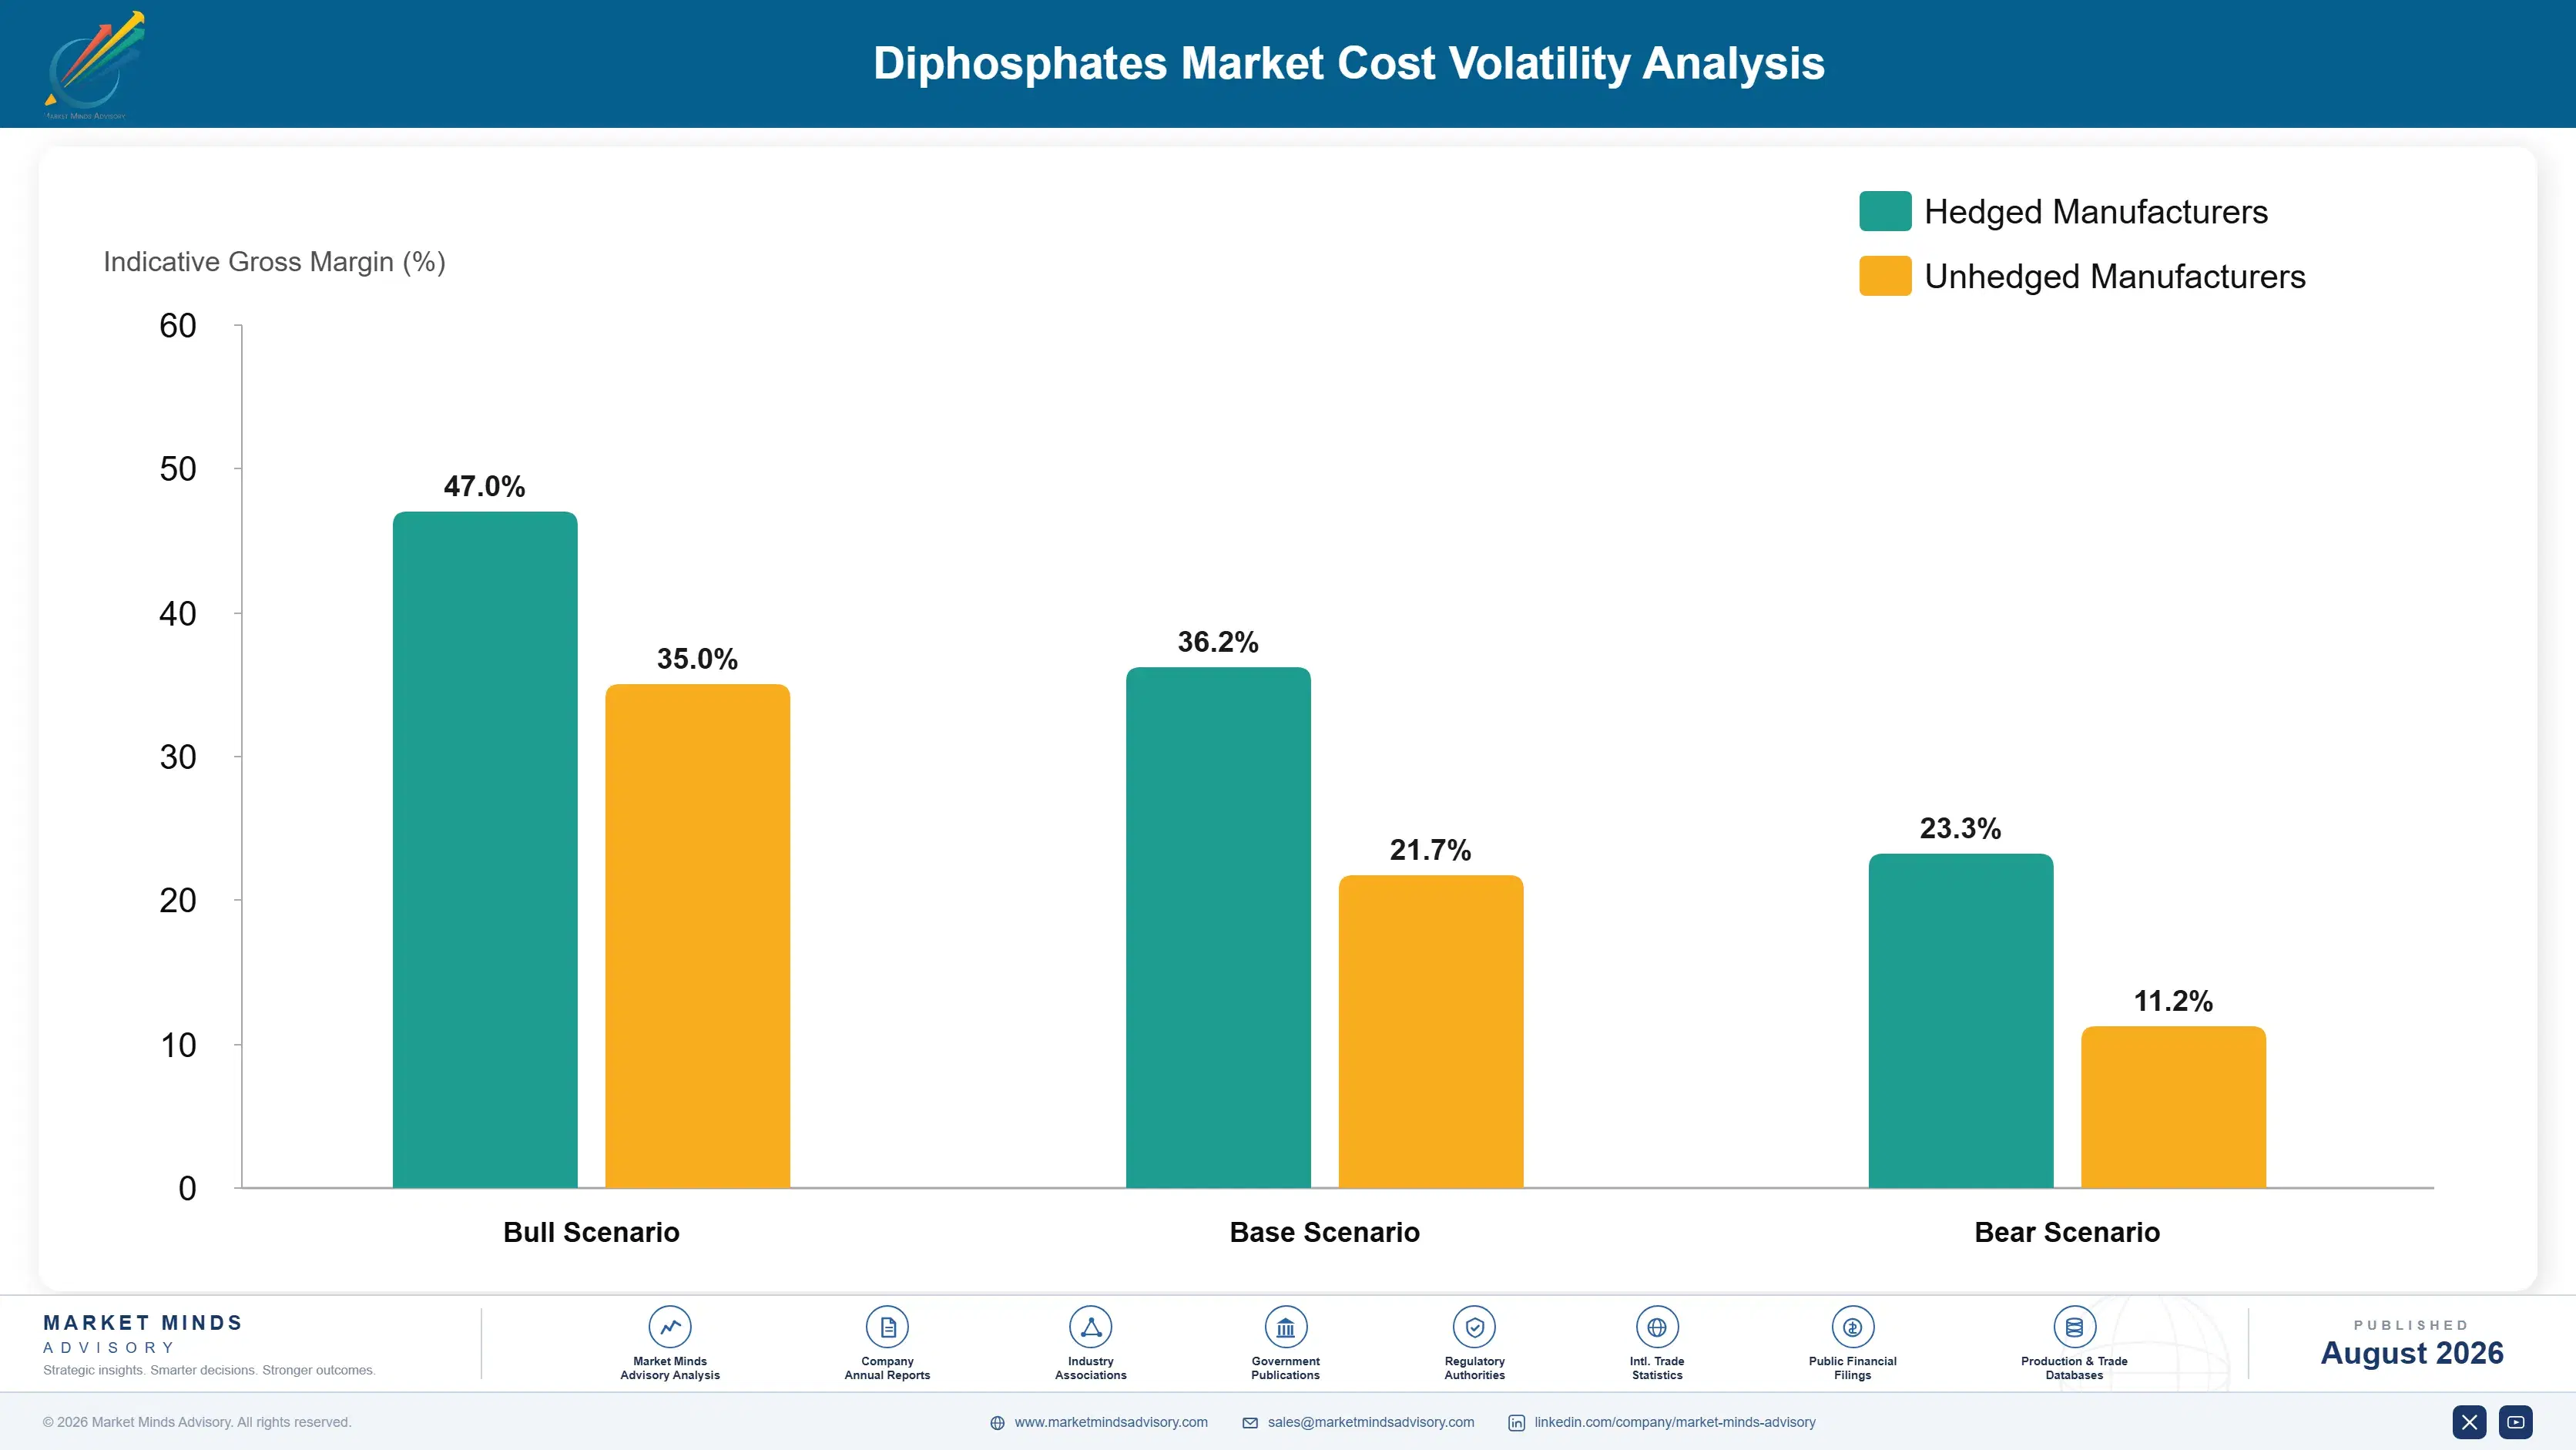
Phosphate Rock Feedstock Exposure

Phosphate rock and phosphoric acid feedstock together represent roughly 44 percent of cost of goods sold for diphosphate production, sourced primarily from mining operations in Morocco, China, and the United States, with additional feedstock sourced from Russian and Middle Eastern phosphate rock producers. Currency fluctuations further influence landed cost for internationally sourced feedstock volume nationwide.
Phosphate rock and phosphoric acid prices spiked considerably in 2022 following broader commodity market disruption, a volatility event documented in company annual report disclosures across the sector, temporarily compressing producer margins and forcing several producers to renegotiate customer pricing contracts before feedstock costs stabilized over the following year. Several producers report feedstock costs have only partially normalized since the disruption began. Contract manufacturers have since added redundant processing capacity to reduce future exposure.

Exposure varies considerably by player type: large integrated producers with direct phosphate rock mining access have absorbed volatility more easily than smaller downstream processors reliant on spot market purchasing, a disadvantage that is accelerating consolidation of smaller processors into larger integrated phosphate chemical company operations. Smaller processors increasingly pursue merger or acquisition to gain comparable purchasing scale.
diphosphates-market-trends-cost-volatility-analysis-1787550002645

Direct Phosphate Rock Mining Integration

Larger producers are pursuing direct ownership or long-term supply agreements with phosphate rock mining operations, protecting feedstock continuity and pricing stability, though this approach requires substantial capital investment that smaller processors typically cannot justify given current production scale. Larger companies with stronger balance sheets absorb this forecasting risk more comfortably than smaller rivals. overall

Multi-Origin Feedstock Sourcing Portfolio Development

Qualifying feedstock relationships across multiple phosphate rock origins reduces exposure to any single country's export policy or supply disruption, though it requires meaningful relationship investment across each additional sourcing region that smaller processors often cannot justify given current production volume. Processors pursuing this path typically require several years to reach meaningful sourcing diversity across major supply regions.

Recycled Phosphorus Recovery Process Investment

Investing in phosphorus recovery from wastewater and agricultural byproduct streams reduces dependence on continuous virgin phosphate rock purchasing, though it requires meaningful upfront process engineering investment that most producers pursue only gradually across multiple facility upgrade cycles. Most large producers now maintain pilot recovery programs covering at least a portion of their annual feedstock requirements.

Portfolio Architecture for Margin Defence

Portfolio economics split across three tiers: commodity industrial-grade diphosphates competing largely on price and phosphate rock access, mid-tier detergent and fertilizer additive products commanding meaningful premium pricing tied to formulation consistency, and premium food-grade additives capturing the highest margin as customers pay for both purity certification and dedicated food safety documentation. Customers increasingly negotiate bundled contracts spanning multiple tiers simultaneously to secure better overall terms with large suppliers.
The tension between volume and premium positioning is sharpest as food manufacturers increasingly demand certified consistency regardless of price sensitivity elsewhere in their supply chain, compressing commodity industrial-grade producers' pricing power even as premium food-grade products command substantial price premiums tied to certification investment rather than raw feedstock cost alone. Producers without a credible food-grade offering increasingly struggle to defend even their traditional commodity accounts against new entrants.

High value margin pools concentrate in food-grade products sold with dedicated safety documentation and certification support, where purity specifications and customer qualification requirements limit meaningful competition to producers with established food-grade quality systems and sustained certification investment. New entrants without established certification and quality infrastructure find this tier especially difficult to penetrate meaningfully at scale.

Volume / Commodity-Adjacent Tier

Commodity industrial-grade diphosphates competing primarily on price and phosphate rock access across industrial applications. Purchasing decisions here favor incumbents with the lowest delivered cost per unit nationwide. across industrial segments.
Gross Margin: 18-26%

Premium / Certified Tier

Detergent and fertilizer additive products commanding premium pricing tied to formulation consistency and regulatory compliance. Buyers value proven regulatory compliance over marginal cost savings alone today. across most formulator accounts today.
Gross Margin: 28-36%

Sustainability / Regulatory / Next-Generation Tier

Food-grade additives serving premium processed food applications, commanding the strongest margins given certification requirements. Customers here view certification consistency as essential to qualification success overall. throughout the qualification and renewal process.
Gross Margin: 40-48%
diphosphates-market-trends-portfolio-architecture-1787550003152

High-value Sub-segments and Strategic Watch-out

Food Additives

Scaling as processed food consumption expands across emerging markets, this segment commands the highest margins but remains constrained by food-grade certification capacity concentrated among a limited number of qualified producers. Certification cost and audit timelines remain the key variable determining pace of adoption growth here today.
Gross Margin: 40-48%

Water Treatment Chemicals

Continued regulatory tightening supports durable volume growth for producers with established compliance documentation over competitors lacking comparable regulatory affairs infrastructure worldwide. Compliance documentation increasingly determines which producers win preferred supplier status across regional municipal accounts. Municipal budget cycles often determine when new contracts become available for competitive bidding.
Gross Margin: 30-36%

Fertilizer and Agricultural Additives

The largest volume segment by shipment weight, competing primarily on price across mainstream agricultural applications, with steady but unremarkable growth tied to cultivation intensification. Volume scale remains the primary lever for defending margin here. Producers here compete heavily on logistics and delivery reliability rather than pure product differentiation today.
Gross Margin: 20-26%

Commodity Detergent and Industrial Applications

Facing gradual substitution pressure as alternative formulation chemistries gain favor in some detergent applications, this segment requires continued volume scale or faces ongoing margin compression. Producers here increasingly diversify into higher-margin categories to escape this sustained pricing pressure. Volume scale remains the primary lever for defending margin here.
Gross Margin: 16-22%

Certification-Driven Qualification Economics

Demand in this category increasingly resembles a multi-year customer qualification relationship for food-grade applications rather than a spot commodity purchase, since processed food manufacturers require extensive safety testing and certification documentation before committing to a diphosphate supplier, creating durable multi-year revenue visibility for producers embedded early in a customer's formulation development roadmap. This dynamic increasingly resembles subscription-style economics more common in specialty ingredients than in traditional bulk chemical manufacturing.
Adoption depth varies considerably by end use vertical: premium processed food manufacturers show the deepest and most consistent willingness to pay for certified food-grade material, mid-tier water treatment and fertilizer customers show moderate but steady adoption tied to regulatory compliance requirements, and traditional industrial detergent buyers remain the shallowest adopters, still treating diphosphates as an interchangeable bulk commodity. Regional certification investment increasingly determines where along this adoption curve a given customer segment falls given supply chain constraints.

Younger food scientists and formulation specialists entering product development roles increasingly treat certified diphosphate sourcing as a baseline design consideration rather than a premium differentiator, a generational shift that is gradually normalizing broader food-grade adoption across a wider range of processed food categories beyond the historically dominant baking segment.
diphosphates-market-trends-end-use-penetration-index-1787550003647

Where Producer Investment Should Concentrate

These are among the four positions where our research anticipates prominent divergence between winners and laggards over the coming forecast period. Each is grounded in the demand model, the regulatory perimeter, and the announced capacity pipeline.
01 / FOOD-GRADE CERTIFICATION INVESTMENT

Build certification capability before food customers standardize elsewhere

Processed food manufacturers are increasingly standardizing formulation specifications around certified, food-grade diphosphates faster than producers relying on industrial-grade sales currently plan for within their commercial roadmaps and capital budgets across comparable production accounts. Producers with established food-grade certification already report meaningfully higher customer qualification rates than competitors selling industrial-grade material alone across comparable production volume. This advantage compounds as more food manufacturers require certified material, a gap unlikely to close soon without deliberate and sustained investment across their production and certification networks.
02 / FEEDSTOCK SOURCING DIVERSIFICATION

Diversify phosphate rock sourcing before the next export policy disruption

Phosphate rock export policies have already demonstrated meaningful volatility this decade, and producers without diversified sourcing remain persistently exposed to the next disruption regardless of current feedstock availability across their supplier networks. Producers with diversified sourcing already report winning new customer contracts at meaningfully higher rates than single-origin competitors still dependent on a narrow supply base. Building this resilience now, before the next disruption, costs considerably less than attempting to build it reactively during an active shortage rather than preparing for it in advance.
03 / WATER TREATMENT COMPLIANCE DOCUMENTATION

Strengthen documentation before water quality standards tighten further

Water quality regulations continue tightening across major consuming markets faster than producers relying on minimal regulatory documentation can efficiently satisfy within typical customer compliance timelines and audit requirements across their supply chains and account bases. Producers with comprehensive compliance documentation already report meaningfully higher contract renewal rates than documentation-light competitors across comparable customer accounts. Producers delaying this investment risk losing preferred supplier status as compliance requirements continue tightening across additional consuming regions worldwide over the coming several years without exception.
04 / EMERGING MARKET PARTNERSHIP DEVELOPMENT

Build processed food partnerships before disease burden outpaces treatment penetration

Emerging markets carry a disproportionate share of global processed food consumption growth relative to their current share of category revenue, a gap that producers focused exclusively on developed markets are not positioned to capture as processed food adoption continues expanding. Producers pursuing emerging market partnership development already report meaningfully higher revenue growth than producers focused exclusively on developed markets alone. This advantage compounds further as processed food consumption continues expanding across these regions over the coming decade across every major consuming region.

Engagement Snapshot From the Field

A live engagement with an industry participant carrying material or product regulatory and market exposure ahead of a defining policy shift, showing how our research translates into a defensible multi-year portfolio strategy.
MARKET MINDS ADVISORY · CLIENT ENGAGEMENT SUMMARY
Diphosphates Producer Strategic Portfolio Review and Transition Roadmap 2026·Investment Scenario on Diphosphates Exposure Evaluation 2025-26
CLIENT PROFILE
The client is a mid-sized industrial phosphate producer generating approximately 120 million dollars in annual revenue (client-reported, unverified by MMA), historically focused on detergent and fertilizer additive applications without dedicated food-grade certification capability, facing declining margins as commodity pricing continued to compress across its traditional customer base. Its competitors were rapidly securing food-grade contracts. nationwide.
STRATEGIC CHALLENGE
Facing eroding commodity margins as industrial-grade pricing continued declining, the client needed to evaluate whether to invest in food-grade certification capability to access premium processed food pricing, without clear visibility into food manufacturer qualification requirements or realistic timelines for securing meaningful contracted volume. Leadership disagreed internally on the right path forward.
MMA APPROACH
MMA conducted a food market entry feasibility assessment incorporating food manufacturer qualification requirement interviews, capital investment modeling, and competitive benchmarking against established food-grade suppliers, then developed a phased certification capability investment roadmap sequenced to the client's available capital and existing production infrastructure nationwide. Interviews focused specifically on certification timeline expectations.
KEY FINDINGS
  1. Food manufacturers required a minimum of twelve months of certification testing before considering a new diphosphate supplier for qualification. and market entry
  2. Two regional food manufacturers expressed preliminary interest in evaluating the client's certified output once developed to specification and audited. directly to formulation teams
  3. Existing production infrastructure could be adapted for food-grade certification with moderate capital investment rather than requiring an entirely new facility. rather than an entirely new facility
  4. Competitive food-grade pricing offered meaningfully higher margins than the client's existing commodity industrial business despite higher certification costs. despite meaningfully higher certification costs
CLIENT PROFILE
The client is a mid-sized industrial phosphate producer generating approximately 120 million dollars in annual revenue (client-reported, unverified by MMA), historically focused on detergent and fertilizer additive applications without dedicated food-grade certification capability, facing declining margins as commodity pricing continued to compress across its traditional customer base. Its competitors were rapidly securing food-grade contracts. nationwide.
STRATEGIC CHALLENGE
Facing eroding commodity margins as industrial-grade pricing continued declining, the client needed to evaluate whether to invest in food-grade certification capability to access premium processed food pricing, without clear visibility into food manufacturer qualification requirements or realistic timelines for securing meaningful contracted volume. Leadership disagreed internally on the right path forward.
MMA APPROACH
MMA conducted a food market entry feasibility assessment incorporating food manufacturer qualification requirement interviews, capital investment modeling, and competitive benchmarking against established food-grade suppliers, then developed a phased certification capability investment roadmap sequenced to the client's available capital and existing production infrastructure nationwide. Interviews focused specifically on certification timeline expectations.
KEY FINDINGS
  1. Food manufacturers required a minimum of twelve months of certification testing before considering a new diphosphate supplier for qualification. and market entry
  2. Two regional food manufacturers expressed preliminary interest in evaluating the client's certified output once developed to specification and audited. directly to formulation teams
  3. Existing production infrastructure could be adapted for food-grade certification with moderate capital investment rather than requiring an entirely new facility. rather than an entirely new facility
  4. Competitive food-grade pricing offered meaningfully higher margins than the client's existing commodity industrial business despite higher certification costs. despite meaningfully higher certification costs
RECOMMENDED STRATEGY
Phase 1: Phase 1 (Months 1 to 6): Invest in certification infrastructure and begin internal food-grade formulation development. across priority formulation targets Phase 2: Phase 2 (Months 7 to 12): Complete food manufacturer qualification testing across target customer accounts. ahead of formal contract discussions Phase 3: Phase 3 (Months 13 to 18): Secure initial supply agreements and begin scaled food-grade production. across its expanding customer base
OUTCOME
Within eighteen months of implementation, the client reported securing an initial food-grade supply agreement representing roughly 20 percent of projected future revenue and establishing durable certification capability beyond its historical commodity industrial business (client-reported, unverified by MMA). Leadership described the shift as validating its strategic pivot decision.

Frequently Asked Questions

Foundational context covering the market sizes, CAGR, scope, country, region and competition that inform every finding below. This section is provided to cover basics and most often pre-purchase conversations, answered from the MMA Primary Research Dataset.

What is the current size of the Diphosphates Market?

The Diphosphates Market is valued at approximately 1.35 billion dollars in 2025, spanning food additive, water treatment, detergent, and fertilizer application categories. This spans food, water treatment, and industrial application categories worldwide.

How large will the Diphosphates Market be by 2036?

The market is projected to reach roughly 2.43 billion dollars by 2036, driven by expanding processed food demand and tightening water treatment regulations worldwide. That reflects steady food-driven growth momentum nationwide.

What is the CAGR for the Diphosphates Market 2026 to 2036?

The market is expected to grow at a compound annual growth rate of approximately 5.5 percent between 2026 and 2036, reflecting steady specialty chemical demand.

Which segment is growing fastest?

Food additives are the fastest growing segment, expanding at roughly 1.4 times the overall market rate as processed food manufacturers standardize diphosphate formulations. across their certification and formulation qualification programs worldwide

Who are the major companies in the Diphosphates Market?

Leading companies include ICL Group, Innophos Holdings, Prayon SA, OCP Group, and Yara International, each investing in certification and sourcing diversification. across their certification and sourcing diversification programs worldwide

Which country is growing fastest?

China is the fastest growing single country, supported by its substantial phosphate rock reserves and rapidly expanding processed food manufacturing capacity nationwide. and rapidly expanding processed food manufacturing capacity nationwide

Report Segmentation Architecture

The full report scope spans multiple orthogonal segmentation dimensions, with cross-tabulated demand data provided for each dimension pair. Coverage extends further to regional breakdowns, trend trajectories, and the competitive detail needed to support segment-level decision-making.

By End-Use Application

  • Food Additives
  • Water Treatment Chemicals
  • Detergents and Cleaning Formulations
  • Fertilizer and Agricultural Additives
  • Metal Surface Treatment
  • Ceramics and Industrial Processing

By End-Use Industry

  • Food and Beverage Processing
  • Municipal Water Utilities
  • Agriculture and Fertilizer
  • Industrial Manufacturing

By Commercial Dimension

  • Direct Manufacturer Supply Agreements
  • Distributor and Broker Channels
  • Joint Formulation Development Partnerships

By Region

  • North America
  • Western Europe
  • East Asia
  • South Asia and Pacific
  • Latin America
  • Middle East and Africa
  • Eastern Europe

Scope, Methodology, and Coverage

Every figure in this report is reproducible from documented input assumptions. The scope below maps the historical period, the forecast horizon, the segmentation dimensions, and the countries covered, alongside the underlying primary and qualitative methodology.
Historical Period
2020 to 2025
Forecast Period
2026 to 2036
Base Year
2025 (USD billions; MMA Primary Research Dataset, August 2026)
Market Definition
The diphosphates market covers production and downstream application of diphosphate salts across food additive, water treatment, detergent, fertilizer, metal surface treatment, and ceramics and industrial processing uses. It excludes monophosphate and triphosphate compounds with differing chemical structures and excludes elemental phosphorus and raw phosphate rock themselves.
Quantitative Units
USD billions (current prices); production volumes in metric tons for select operating metrics
Segmentation Dimensions
By End-Use Application; By End-Use Industry; By Commercial Dimension; By Region
Regions Covered
North America, Western Europe, East Asia, South Asia and Pacific, Latin America, Middle East and Africa, Eastern Europe
Countries Covered
USA, Canada, China, Japan, South Korea, Germany, France, UK, India, Indonesia, Australia, Brazil, Mexico, Argentina, Morocco, UAE, Saudi Arabia, South Africa, Poland, Russia, Czech Republic, and additional markets relevant to this sector
Key Companies Profiled
ICL Group, Innophos Holdings, Prayon SA, OCP Group, Yara International, Nutrien Ltd, Mosaic Company, Aditya Birla Chemicals, Jordan Phosphate Mines Company, Guizhou Chanhen Chemical, Sichuan Development Lomon, Chengxing Group, Budenheim, Solvay, Sinochem Corporation, Wengfu Group, Hubei Xingfa Chemicals, Yunnan Yuntianhua, Kemira Oyj, Van Iperen International
Quantitative Methodology
Primary survey, n=3,800 respondents, Q4 2025, six countries; demand-side model with trade association cross-validation
Qualitative Methodology
47 expert interviews, Q4 2025; applied to validate demand model assumptions, identify emerging dynamics, and assess competitive positioning
Report Format
PDF and XLSX data workbook (Word format preview document)
Publisher
Market Minds Advisory
Report Code
MMA-2026-CHM-314
Published
August 2026
Contact
sales@marketmindsadvisory.com | www.marketmindsadvisory.com

Purchase the full Diphosphates Market Report (2026 to 2036).

The full report delivers a complete quantitative and qualitative assessment of the diphosphates market, including detailed segment level forecasts through 2036, regional analyses across all seven covered geographies, and profiles of twenty leading producers. It incorporates primary survey data from 3,800 respondents and 47 expert interviews conducted in the fourth quarter of 2025. Buyers receive editable data tables, a customizable Excel forecast model, and access to MMA analysts for follow up questions during a defined post purchase support window. The report also includes a detailed phosphate rock reserve landscape assessment calibrated to current sourcing benchmarks.
Detailed segment-level market forecasts through 2036
All seven regional market analyses included
Twenty profiled leading phosphate chemical producers
Editable Excel based forecast data model
Primary survey and expert interview data
Extended post-purchase analyst support access window

Built For The People Who Decide

From boardroom strategy to bench-side execution, this report is read cover-to-cover by leaders shaping the next decade of their industry, turning demand scenarios, market dynamics and valuation benchmarks into decisions.
CXOs/ Presidents/ VPs/ Managers
M&A and Corporate Development
Strategy Teams and R&D Heads
Procurement and Product Directors
Regulatory and Compliance Leaders
Investor Relations and Equity Analysts