Market Minds Advisory
Digital Transformation in Manufacturing Market

Digital Transformation in Manufacturing Market: Digital Transformation in Manufacturing: Capability Classes, Implementation Reality and Workforce Constraint 2026 to 2036

A plant's actual process differs from its documented process in ways nobody has ever written down. Software enforces the documented one, operators work around it, and the system then records a fiction.

Lead Analyst

Published

September 2026

Make Smarter Decisions with Customized Research Insights

Request a free sample report and evaluate market opportunities, growth trends, and competitive dynamics relevant to your business needs.

2025 MARKET VALUE$42.0BMarket Size 2025
2036 FORECAST VALUE$143.3BBase Case , 2026 to 2036
CAGR 2026 TO 203611.8 %Bull 13.1% / Bear 10.5%
INCREMENTAL OPPORTUNITY$96.3BNet 10- year value creation
EXPANSION MULTIPLE3.05x2036 value over 2026 base
Strategic Levers
M&A Pipeline
Regional Outlook
Country Rankings
Competitive Intelligence
Segmental Deep-dive
Call-Us : 91 93563 13602

Executive Snapshot and Market Trajectory.

Around 55% of manufacturing digitisation projects deliver the business case approved for them, and the industry rarely publishes the other figure. The software is usually not the problem. A plant runs a process that differs from its documentation, and enforcing the documentation produces workarounds.
The market reaches USD 46.96 billion in 2026 and USD 143.27 billion by 2036, a 3.05 times expansion at 11.8%. Connected worker and frontline enablement grows at 17.7%, half again the market rate of 11.8%, because plants across the developed world cannot fill production roles and median operator tenure has fallen to 2.4 years. East Asia holds 34% of platform revenue and India compounds fastest at 18.4% on greenfield construction.
Five suppliers hold 29% of platform revenue, which makes this among the most fragmented enterprise software categories at this scale. Siemens, Rockwell Automation and Schneider Electric arrived from automation hardware. SAP came from enterprise systems and PTC from engineering software. Specialists including Tulip Interfaces, Augury and Samsara reach plant budgets directly and deploy in weeks rather than in years, which is a different sale entirely. Nobody has consolidated any part of this category yet.
Market Definition
This report covers software and platforms that digitise manufacturing operations: connected worker and frontline enablement, predictive maintenance and asset analytics, production digital twins and simulation, manufacturing execution and operations management, quality and traceability systems, and industrial data platforms and historians. It excludes automation hardware and control systems, enterprise resource planning suites, product design software, supply chain planning platforms, and industrial robotics or machinery.
Base Year Value
$42.0B in 2025 (MMA Primary Research Dataset, September 2026)
Forecast Period
2026 to 2036, eleven discrete annual values
CAGR
11.8% base case. Bull 13.1%. Bear 10.5%.
Fastest Growth Segment
Connected Worker And Frontline Enablement: 17.7% CAGR
Fastest Growth Country
India: 18.4% CAGR
Fastest Growth Region
South Asia and Pacific: 14.0% CAGR
Largest Region
East Asia: 34% of 2025 global value
Market Leaders
Siemens, Rockwell Automation, SAP, Schneider Electric and PTC lead on manufacturing digital transformation software and platform revenue. Source: MMA Analysis.
Primary Survey
n=3,800 procurement and R&D decision-makers, Q4 2025, six countries
Methodology
Demand-side build-up, cross-validated against public data, 47 expert interviews

Digital Transformation in Manufacturing Market Forecast Scenarios

digital-transformation-in-manufacturing-market-size-forecast-scenario-1789991970373
Between 2020 and 2025 the category compounded at 10.6%, and the pandemic did more for adoption than any vendor campaign had achieved in a decade. Plants that could not staff a control room discovered which processes genuinely required a person present, and remote visibility stopped being an efficiency argument. Much of that spending was reactive, and several programmes stalled once the immediate pressure lifted.
The base case holds 11.8% on three mechanisms. Workforce shortage across every developed manufacturing economy makes connected worker tooling an operational requirement rather than a productivity improvement, since median operator tenure has fallen to 2.4 years. Greenfield construction across South Asia digitises at build for around 62% less than a retrofit costs. And unplanned downtime near 7% of production hours keeps justifying predictive maintenance on arithmetic that finance departments accept without argument.
The bull case at 13.1% assumes implementation success rates improve as deployments shorten from years to weeks, which would restore confidence that repeated failures have eroded. The bear case at 10.5% is manufacturing capital investment slowing: these are discretionary programmes competing against equipment and capacity, and they lose that competition whenever margins tighten across an industrial customer base.

What Plants Actually Do Versus Document

Around 45% of these programmes fail to deliver what was approved, and the diagnosis is almost never the software. Every plant runs a process that differs from its documented process, accumulated through decades of undocumented adjustment by people who understood why. A system that enforces the documentation collides with that reality immediately, operators build workarounds to keep production moving, and the resulting data describes something that is not happening.
TOP FIVE CONCENTRATION29%Highly fragmented across automation vendors and independent software specialists
IMPLEMENTATION SUCCESS RATE55%Projects delivering the business case originally approved for them
OPERATOR TENURE MEDIAN2.4 yearsTime in role across production positions in developed economies
GREENFIELD COST ADVANTAGE62%Lower deployment cost when digitised during plant construction itself
UNPLANNED DOWNTIME SHARE7%Production hours lost to unscheduled equipment stoppage each year
DATA HISTORIAN UTILISATION18%Collected process data ever accessed for any analysis
The constraint moved from the machine to the person and most vendors have not repositioned. Manufacturing spent twenty years instrumenting equipment while median operator tenure across developed economies fell to 2.4 years, which means the knowledge that made undocumented processes work is walking out of plants faster than anybody is capturing it. Connected worker tooling addresses that directly and compounds at 17.7% while execution systems grow at 6.8%.
Greenfield plants are a completely different economic proposition and nobody prices it properly. Digitising during construction costs around 62% less than retrofitting the same capability, because processes get written around the system rather than the system fitted around undocumented practice. That is why India compounds at 18.4% while mature manufacturing economies grow slowest despite owning far more machines than anybody else does.
"I have watched three MES go live and the same thing happens every time. Within a fortnight there is a spreadsheet on the line supervisor's desk that reconciles what the system says with what the plant did. Nobody mentions it in the steering committee."
Director, Industrial Software and Manufacturing Operations Practice · MMA Technology Practice · September 2026

Market Trends

Workforce Turnover Replaced Efficiency As The Driver

Manufacturing spent two decades instrumenting machines while the binding constraint quietly became the people operating them. Median operator tenure across developed economies has fallen to 2.4 years, which means the undocumented knowledge that made plants work is leaving faster than anybody captures it. Connected worker tooling, digital work instructions and guided procedures address that directly rather than improving throughput, and the segment compounds at 17.7% against 11.8% for the market. The buyer is a plant manager who cannot staff a shift rather than an engineer chasing efficiency percentage points. Efficiency arguments no longer carry the sale.
Market Impact: Greenfield costs 62% less overall
Deployment Timescales Collapsed From Years To Weeks

Traditional manufacturing execution implementations run for years, cost more in consulting than in licences and deliver the approved business case around 55% of the time. A newer group of vendors deploys in weeks by fitting the plant's actual process rather than enforcing a documented one, at a fraction of the cost and with results a plant manager can see inside a quarter. That shortens the payback period enough to move approval from a capital committee to a plant budget, which is a completely different sale with a completely different cycle attached.
Market Impact: Downtime costs 7% of hours

Market Opportunities and Growth Drivers

Greenfield Construction Digitises At A Fraction Of Cost

Digitising a plant during construction costs around 62% less than retrofitting the same capability afterwards, because processes get designed around the system instead of the system being fitted around undocumented practice built up across decades. Network infrastructure, sensor placement and data architecture all cost far less when specified before anything is poured. India compounds at 18.4%, ahead of any other country, on production linked incentive construction that digitises from the start. Mature manufacturing economies own more machines and face the more expensive problem by a wide margin. Retrofit is the more expensive problem by far.
Market Impact: Around 45% miss the business case

Downtime Arithmetic Convinces Finance Without Argument

Unplanned equipment stoppage costs around 7% of production hours across most manufacturing sectors, and unlike almost every other digitisation benefit that number is already measured, already reported and already understood by the finance function. Predictive maintenance therefore arrives with a business case nobody has to construct from assumptions, which is why it compounds at 15.2% while capabilities requiring a productivity argument grow considerably slower. Vibration, thermal and current signature monitoring have all become cheap enough that the payback arrives within a single budget year. No assumption model has to be defended to anybody here.
Market Impact: Only 18% of data gets used

Market Restraints and Challenges

Documented Process And Actual Process Rarely Match

Around 45% of these programmes fail to deliver their approved business case, and the recurring cause is that the plant does not run the way its documentation says it does. The root cause is decades of undocumented adjustment made by people who understood the equipment and never wrote any of it down. Commercially this means implementations collide with reality on day one and operators build workarounds to keep production moving. Mitigation runs through observing actual practice before configuring anything, and through systems that adapt rather than enforce. Enforcement fails where adaptation succeeds here.
Market Impact: Operator tenure fell to 2.4 years

Collected Data Mostly Goes Nowhere At All

Plants have been installing historians and collecting process data for twenty years, and roughly 18% of what is stored is ever accessed for any purpose whatsoever. The root cause is that collection was justified on future analytical possibility rather than on any defined question, so nobody ever formulated the question. Commercially this undermines every subsequent data platform proposal, because the last one produced a very expensive archive. Mitigation runs through starting from specific operational questions rather than from comprehensive collection that nobody will use. The previous programme produced a very expensive archive that nobody opens.
Market Impact: Success runs at only 55%
3 additional market trends, 4 additional growth drivers, and 2 additional restraints and challenges are covered in the full report. Contact sales@marketmindsadvisory.com to access the complete intelligence.

Segment CAGR and Growth Architecture

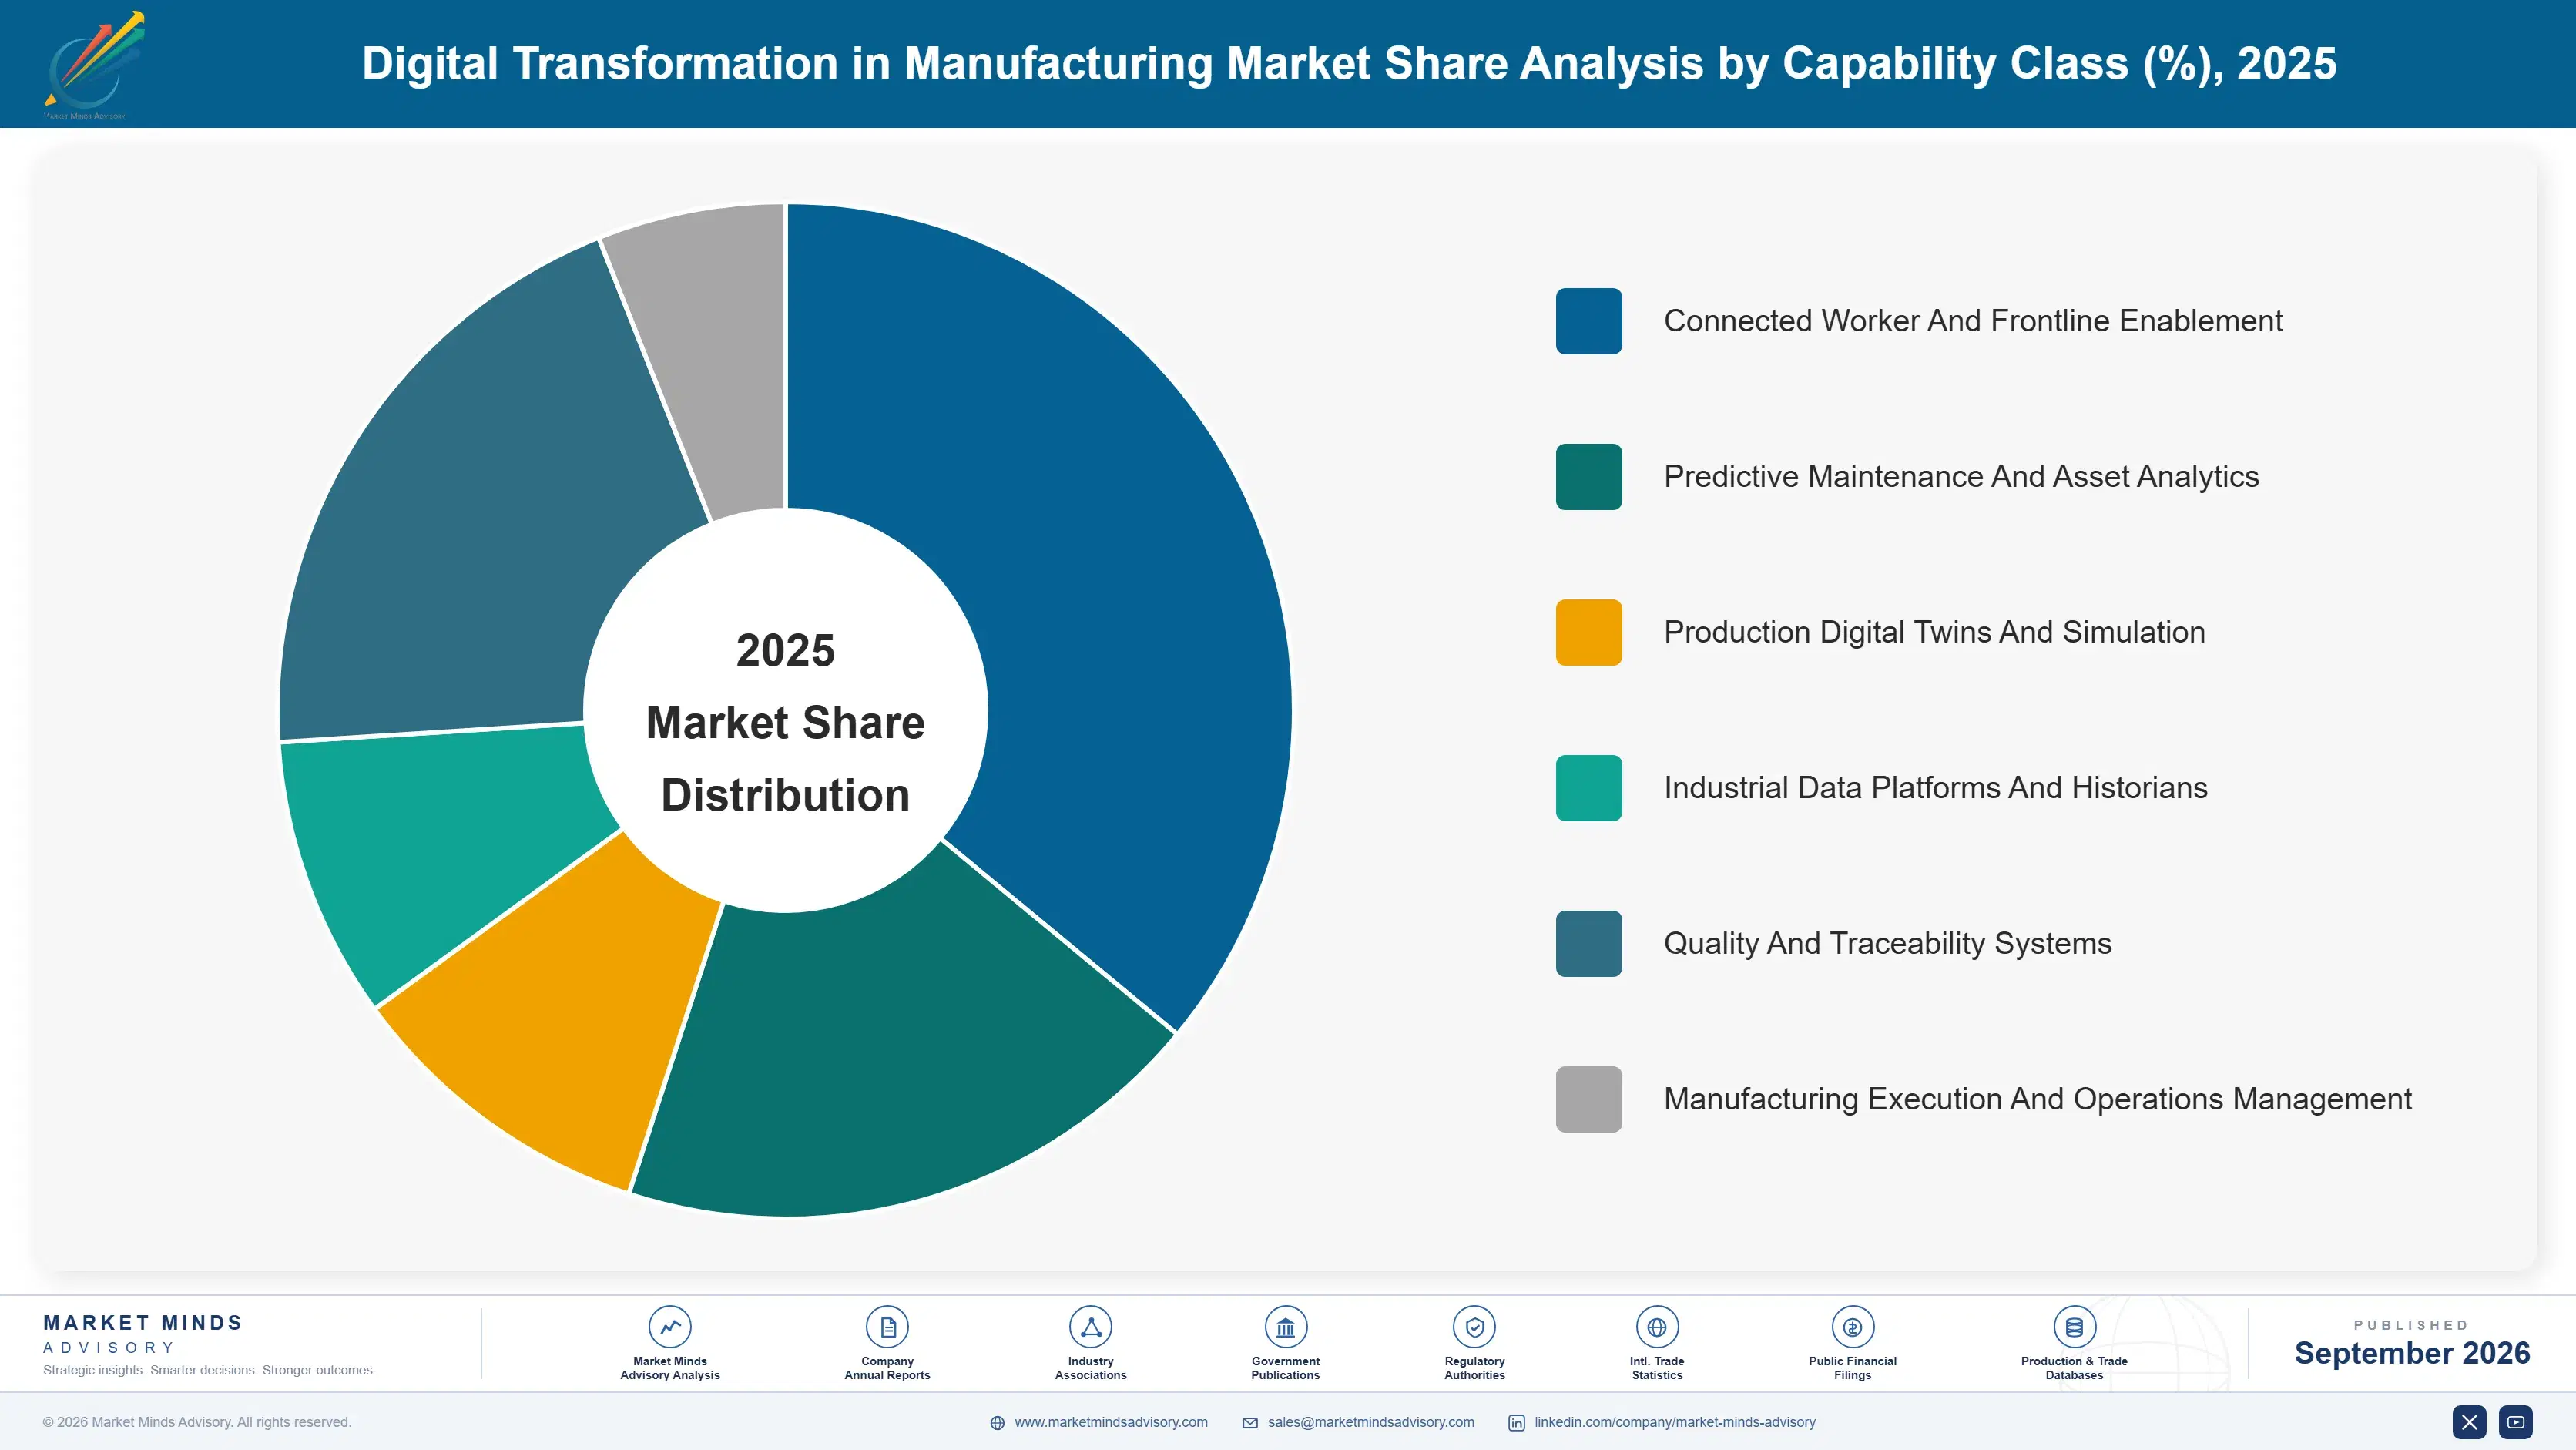
Segmentation follows capability class, since what a system does on the plant floor determines who sponsors it and whether it survives contact with actual practice. Six classes cover the market: connected worker enablement, predictive maintenance and asset analytics, production digital twins, industrial data platforms, quality and traceability, and manufacturing execution systems. Industry sector is a separate dimension.
digital-transformation-in-manufacturing-market-market-share-analysis-1789991970936

Connected Worker And Frontline Enablement

Connected worker enablement grows at 17.7%, half again the market rate of 11.8%, because the constraint in manufacturing stopped being the machine some years ago. Median operator tenure across developed economies has fallen to 2.4 years, which means plants are losing the undocumented knowledge that made their processes work faster than anybody is capturing it anywhere. Digital work instructions, guided procedures and skills capture address that directly rather than improving throughput. The buyer is a plant manager who cannot staff a shift rather than a continuous improvement engineer chasing percentage points, and that buyer approves considerably faster and argues considerably less about payback periods. Payback arguments barely arise at all.
CAGR 17.7%

Predictive Maintenance And Asset Analytics

Predictive maintenance compounds at 15.2% on the only business case in this category that finance departments accept without construction. Unplanned equipment stoppage already costs around 7% of production hours, that number is already measured and already reported, and nobody has to build an assumption model to justify addressing it. Vibration, thermal and motor current signature monitoring have all become cheap enough that payback arrives inside a single budget year. The recurring implementation difficulty is that a model trained on one plant's equipment transfers poorly to another, so each deployment carries tuning work that vendors consistently understate during the sale. Each deployment therefore carries tuning work on top of the software itself.
CAGR 15.2%
Full segment breakdown across 6 segments available in the complete report.

Regional Architecture and Country Demand Map

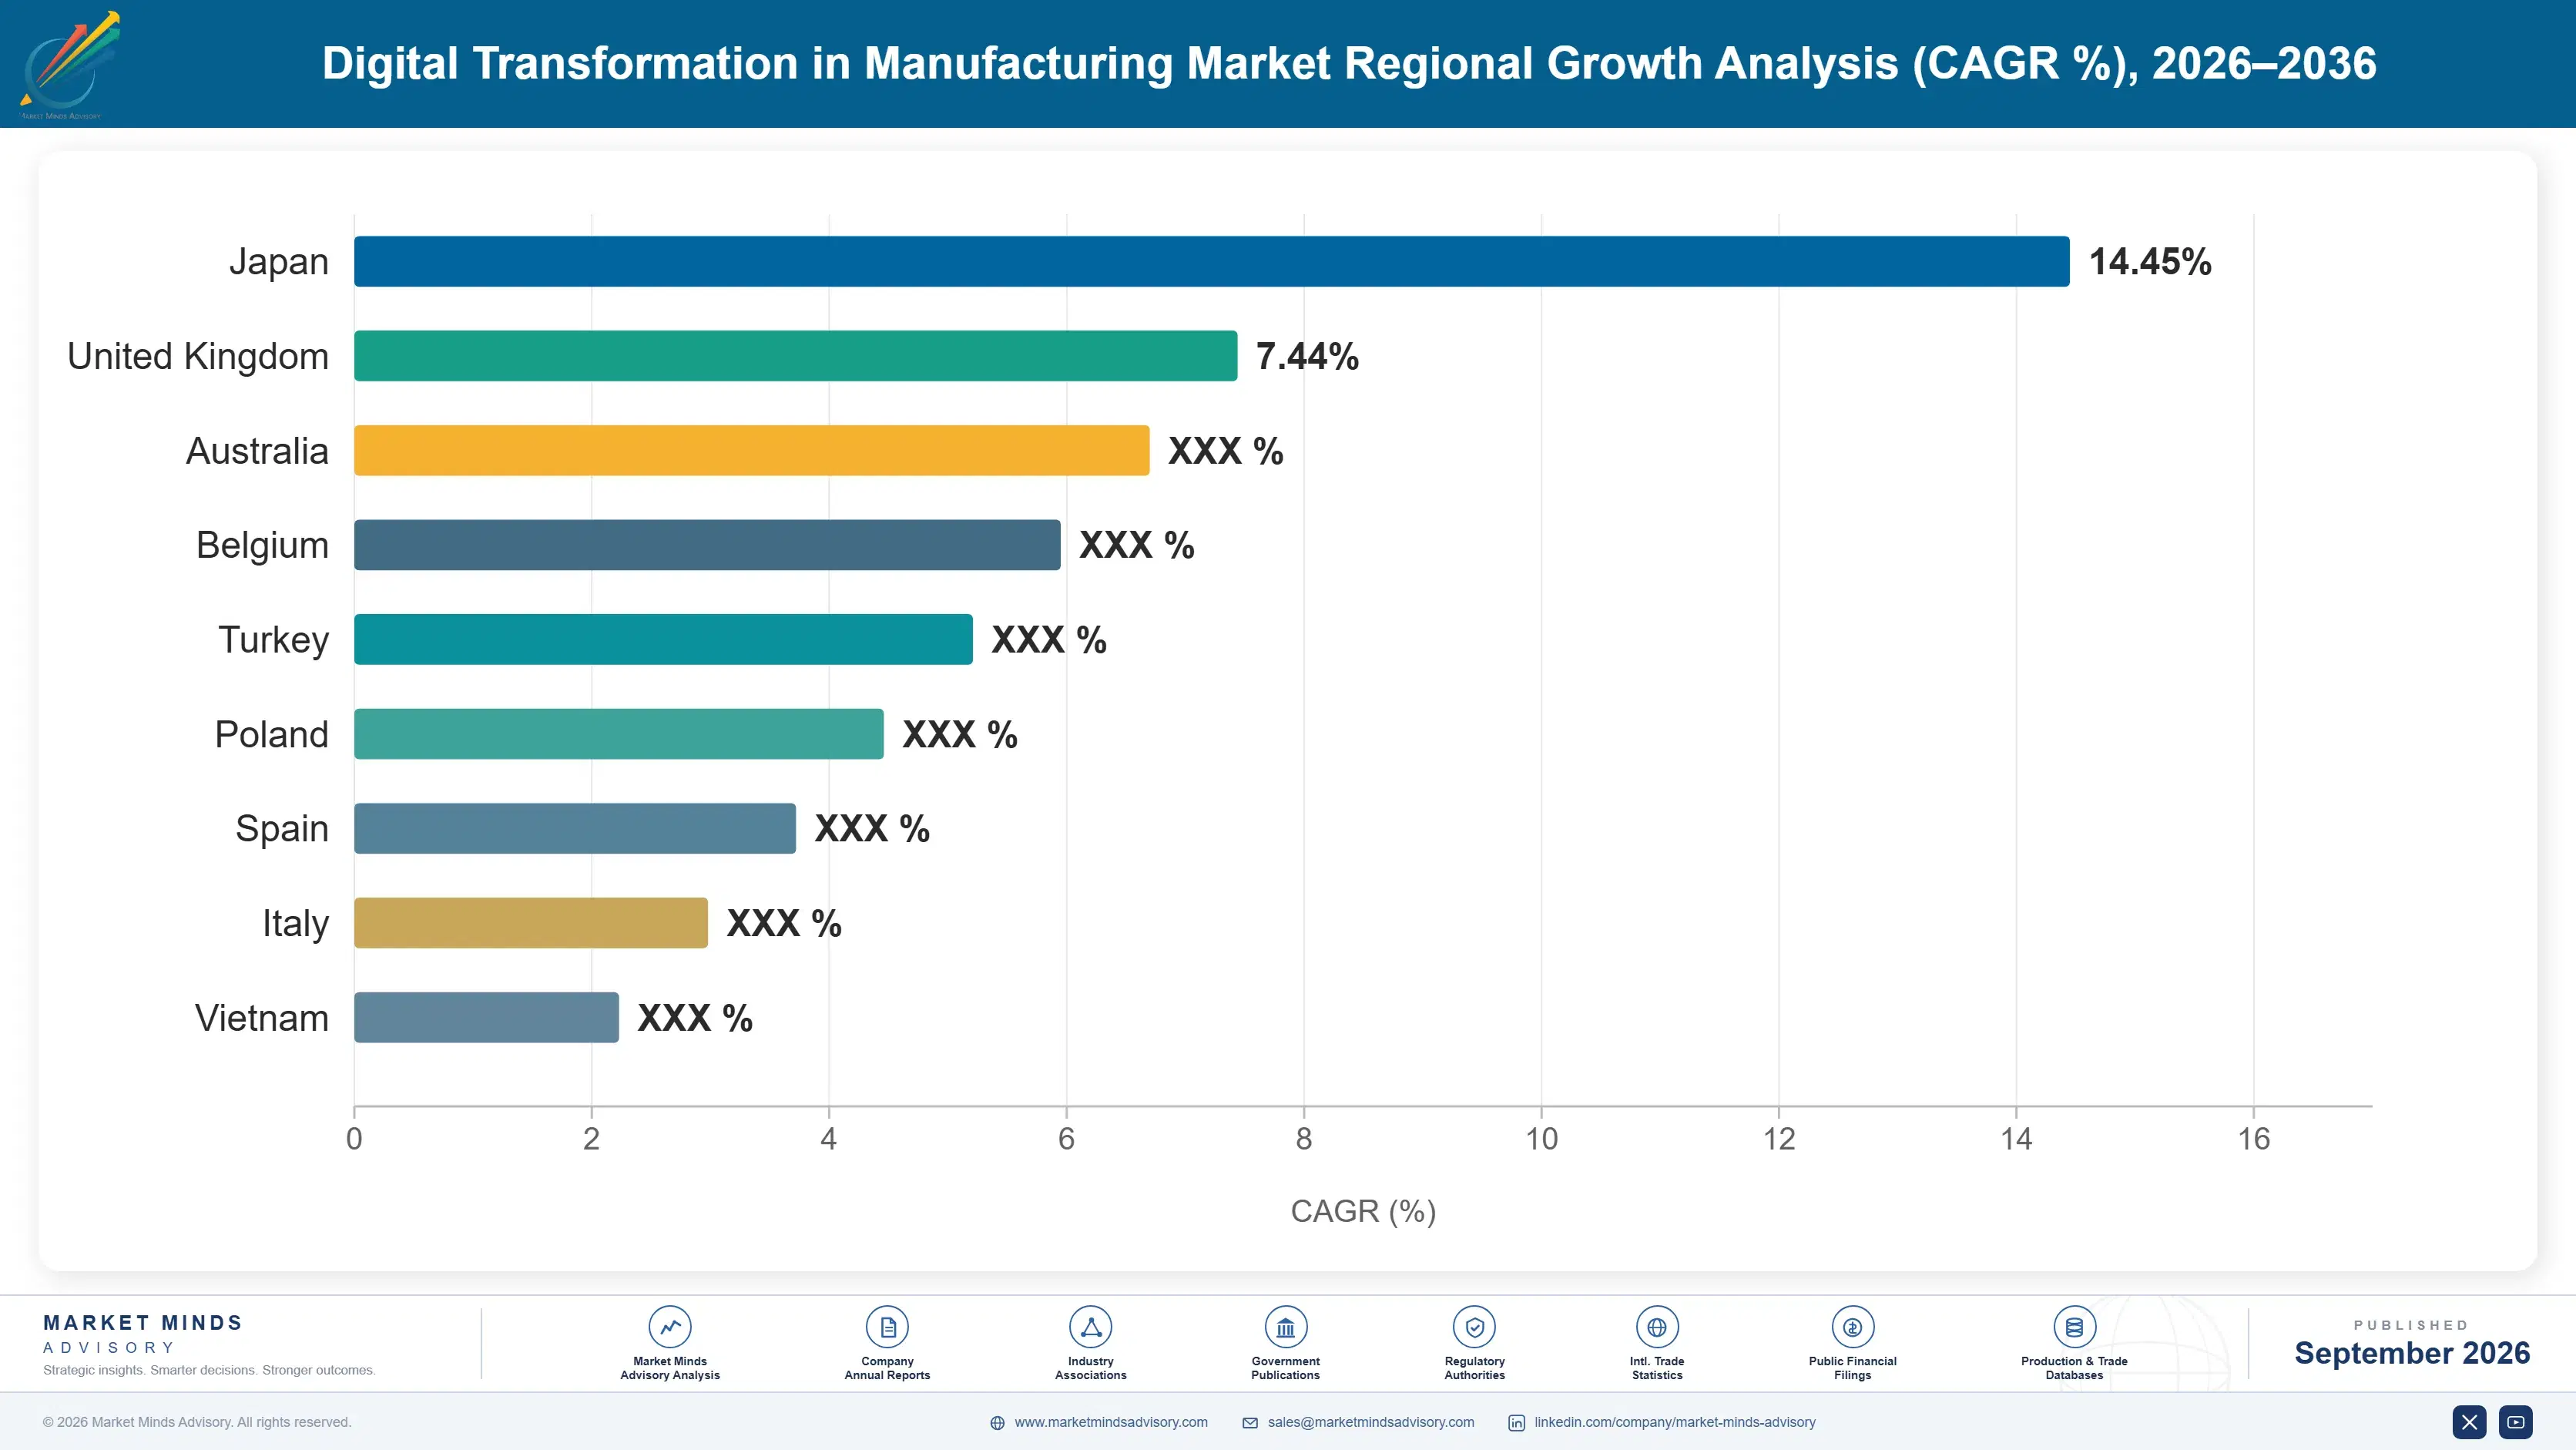
East Asia leads at 34% of platform revenue, above the standard band, because it holds more manufacturing capacity than any other region and adds new plants faster than anywhere else. Western Europe follows at 23% with the most machines per plant and the most expensive retrofit problem.

East Asia

East Asia holds 34% of platform revenue, above the 30% band ceiling, on manufacturing capacity that exceeds every other region combined in several sectors. Chinese industrial software adoption runs through domestic vendors as much as international ones, supported by national programmes that fund plant digitisation directly. Japanese and Korean manufacturers hold deep automation estates and adopt cautiously, preferring incremental capability over programme scale. New plant construction across the region digitises at build rather than retrofitting, which captures the 62% cost advantage. Growth at 12.8% sits above the global rate on construction and domestic vendor competition together. New construction here captures the greenfield cost advantage rather than facing the retrofit problem.
Share: 34% | CAGR: 12.8% (2026 to 2036)

Western Europe

Twenty-three percent of platform revenue reaches Western Europe, where the installed machine base is the deepest anywhere and the retrofit problem is correspondingly expensive. German, Italian and Swiss manufacturers operate equipment installed across decades with control systems from many vendors and undocumented process adjustments accumulated throughout. Siemens, Schneider Electric, ABB, AVEVA and Hexagon all develop here and sell worldwide. Works council consultation shapes connected worker deployment considerably, since monitoring frontline activity is a negotiated matter here rather than a management decision. Growth at 10.4% is the slowest of any region on that combination. The deepest machine base anywhere is also the most expensive one to digitise afterwards. Works councils negotiate frontline monitoring here.
Share: 23% | CAGR: 10.4% (2026 to 2036)
Regional intelligence for 5 additional markets available in the complete report: North America, South Asia and Pacific, Latin America, Middle East and Africa, Eastern Europe. Contact sales@marketmindsadvisory.com.
digital-transformation-in-manufacturing-market-country-cagr-analysis-1789991971463

What Makes These Programmes Work

Almost half of these programmes miss the business case they were approved against, the constraint moved from machines to people while vendors kept selling to engineers, and a plant digitised at construction costs a fraction of one retrofitted. Each of the four levers below responds to one of those rather than to any product capability argument.

Observe The Real Process Before Configuring Anything

Around 45% of these programmes fail to deliver their approved case, and the recurring cause is that the plant does not run the way its documentation claims. Decades of undocumented adjustment by people who understood the equipment sit between the two, and a system enforcing the documentation collides with that on day one. Spending weeks observing actual practice before configuration costs a fraction of the rework it prevents. Vendors compress that phase to shorten the sales cycle and then spend a year recovering from the consequences. The consequences take a year to recover from.
Market Impact: Configuration errors cause fully 45% of all failures

Sell To The Plant Manager Who Cannot Staff Shifts

Median operator tenure across developed economies has fallen to 2.4 years, which makes losing undocumented process knowledge an operational emergency rather than a productivity concern. Connected worker tooling compounds at 17.7% because it addresses that directly, and the buyer is a plant manager facing an unfilled roster rather than a continuous improvement engineer building an efficiency model. That buyer approves faster, argues less about payback and holds a budget that does not compete with capital equipment. Most vendors still call on the engineering function instead. Engineering functions control considerably less budget.
Market Impact: Tenure at 2.4 years now drives the urgency

Follow Construction Into Greenfield Plants Early

Digitising during construction costs around 62% less than the equivalent retrofit, because processes get designed around the system rather than the system fitted around undocumented practice accumulated over decades. Network infrastructure, sensor placement and data architecture all cost dramatically less when specified before anything is built. India compounds at 18.4% on exactly this, and construction pipelines appear in incentive scheme awards and environmental permits years ahead of procurement. Vendors organised around installed base coverage keep arriving after the plant is finished and the advantage is gone. The advantage is gone once building finishes.
Market Impact: Greenfield deployment costs a full 62% less overall

Deploy In Weeks Rather Than In Years

Traditional execution system implementations run for years, cost more in consulting than in licences and deliver the approved business case around 55% of the time. Deploying in weeks by fitting actual practice rather than enforcing documentation shortens payback enough to move approval from a capital committee to a plant budget, which changes the entire sales motion. A plant manager approving from operating expenditure decides in a month rather than in a year. Vendors carrying long implementation methodologies are selling into the slowest approval route available. Long methodologies target the slowest approval route.
Market Impact: Long projects succeed only 55% of the time

Who Controls the Margin Pool

Five suppliers hold 29% of manufacturing digital transformation platform revenue, which is remarkably fragmented for a category at this scale. Siemens, Rockwell Automation and Schneider Electric arrived from automation hardware and reach plants through control system relationships. SAP came from enterprise systems and PTC from engineering software. Specialist vendors deploy in weeks and win plant level budgets that never reach a capital committee at all. All participants are assessed on software and platform revenue.
Competition splits by approval route rather than by product capability. Automation vendors and enterprise software firms sell programmes to capital committees on multi-year business cases. Specialists sell tools to plant managers from operating budgets with results visible in a quarter. Those two contests barely intersect, and each group consistently underestimates how differently the other one actually wins its business.

Rankings shift as deployment timescales compress, since a category with 55% success rates rewards anybody who can show results before the approving executive changes role. The second pressure is workforce tooling, which reaches a buyer that automation vendors have never called on and that enterprise software vendors reach only through human resources rather than operations.
digital-transformation-in-manufacturing-market-company-positioning-matrix-1789991971993

Competitive Moat and Risk Dimensions

SIEMENS

Moat: Control System Installed Position

Siemens control systems run an enormous share of the world's production equipment, and software reading that equipment directly avoids the integration work every competitor must perform first. Plants extending an existing relationship face far lower project risk than those introducing a new vendor into live production. That installed position took decades to build.
SIEMENS

Risk: Long Implementation Exposure

Programme scale sales to capital committees carry multi-year implementations delivering the approved case around 55% of the time, and each visible failure makes the next approval harder. Specialists deploying in weeks reach plant budgets that never see a capital committee. Defending a multi-year methodology is hard against results shown in a quarter.
PTC

Moat: Engineering Data Continuity

PTC connects design and engineering data to production execution, so a change in the product model reaches the shop floor without manual reconciliation between systems never designed to communicate. Manufacturers with complex configurable products value that directly, since reconciliation errors are expensive and hard to trace. Building the equivalent needs design software depth operations vendors lack.
PTC

Risk: Distance From Plant Floor Reality

An engineering data position sits close to how a product should be built and further from how a plant actually builds it, which is precisely where these programmes fail. Around 45% miss their business case because documented and actual process diverge. Strength in design continuity offers no particular advantage in resolving that divergence on a live production line.

Players Tracked

Prominent Players

Siemens
Rockwell Automation
SAP
Schneider Electric
PTC

Other Key Players

ABB
Honeywell
Emerson
GE Vernova
Dassault Systemes
AVEVA
Hexagon
Yokogawa
Mitsubishi Electric
Aspen Technology
Tulip Interfaces
Augury
Samsara
Cognex
Bosch Rexroth

Recent Developments

MARCH 2025

Siemens Extends Connected Worker Tools Across Operations Portfolio

Siemens extended digital work instruction and frontline enablement capability across its manufacturing operations portfolio, an organic product development rather than an acquisition or joint venture. Median operator tenure across developed economies has fallen to 2.4 years, which makes capturing undocumented process knowledge an operational requirement rather than a productivity improvement.
Signal: Automation vendors are now reaching for a buyer their organisations were never actually built to call on.
SEPTEMBER 2024

Tulip Interfaces Expands Rapid Deployment Manufacturing Applications

Tulip Interfaces expanded its application range for plant level deployment without lengthy implementation projects, an organic expansion rather than any transaction. Traditional execution system programmes deliver the approved business case around 55% of the time, and shorter deployments move approval from a capital committee to a plant operating budget.
Signal: Changing the approval route matters considerably more in this category than changing anything about the software.
JUNE 2025

Augury Broadens Machine Health Monitoring Across Process Industries

Augury broadened predictive machine health monitoring across additional process industry equipment types, an organic expansion rather than a partnership. Unplanned stoppage costs around 7% of production hours and that number is already measured, so the business case requires no assumptions a finance function must accept on faith.
Signal: The one benefit already sitting on a finance report is the one that gets approved without argument.

What These Deployments Cost

Implementation and configuration services account for roughly 47% of total programme cost, which regularly exceeds the software licence itself and surprises buyers who budgeted from a price list. Engineering salaries carry around 24%, weighted toward people who understand both industrial control and software. Cloud and edge infrastructure absorb about 13%, and ongoing support plus training take most of the remaining balance.
Compensation for engineers combining industrial control knowledge with software capability rose sharply through 2023 and 2024, since that combination is scarce in every market and every adjacent industry competes for it. Siemens Annual Report 2024 and Rockwell Automation Annual Report 2024 both record skilled resource availability as a constraint on programme delivery. Vendors on fixed price implementation contracts absorbed those increases directly, since a programme priced in 2022 delivers across several years afterwards.

The competitive disadvantage mechanism is implementation labour intensity rather than any software cost. A vendor whose product requires months of configuration carries services cost on every deployment that scales with customer count rather than with revenue, while one deploying in weeks does not. Exposure concentrates among execution vendors with heavy methodologies, which is why quick deployers hold better margins on smaller contracts.
digital-transformation-in-manufacturing-market-cost-volatility-analysis-1789991972191

Templatise Configuration By Industry Rather Than Customer

Implementation runs about 47% of programme cost and vendors frequently configure each customer from a blank starting point, despite plants in the same sector sharing most of their process structure. Industry templates covering the common eighty percent reduce configuration to genuine exceptions only. The discipline is product management rather than consulting, and services organisations resist it.

Train Control Engineers Into Software Roles Internally

Engineering runs around 24% of cost and the scarce profile combines industrial control understanding with software capability. Recruiting experienced control engineers and training them in software is faster and considerably cheaper than competing for software engineers against every technology employer paying more. The control knowledge is the half that cannot be taught quickly to anybody.

Process Data At The Edge Before Sending Anything

Cloud and edge infrastructure run about 13% of cost and most plants transmit far more raw process data than anybody ever examines, with roughly 18% of stored data ever accessed at all. Filtering and aggregating at the edge cuts bandwidth and storage substantially with no analytical loss. Vendors collect everything because it is simpler to architect.

Portfolio Architecture for Margin Defence

Margin architecture separates on how much configuration a deployment demands. Manufacturing execution systems earn least despite the highest contract values, because implementation services consume most of the revenue and the failure rate erodes reference value. Quality systems and data platforms sit in the middle. Connected worker tooling, predictive maintenance and digital twins earn most, since each deploys quickly against a benefit the customer already measures.
The volume versus premium tension is really about which approval route a vendor is built for. Capital committee programmes carry large contract values, long sales cycles and implementation risk that a 55% success rate makes real. Plant budget tools carry small values, short cycles and results visible in a quarter. Vendors organised for the first route cannot serve the second without dismantling the services organisation that funds them.

High-value pools concentrate in connected worker tooling and in predictive maintenance, and neither is reached by extending an execution system. Connected worker requires reaching a plant manager that automation vendors have never called on. Predictive maintenance requires model tuning per equipment estate that transfers poorly between plants. Both are capabilities and relationships rather than product features, which is why the margin sits there.

Volume / Commodity-Adjacent

Manufacturing execution and operations management systems, where implementation services consume most of the contract value and delivery risk is genuinely high. The ten point spread separates vendors with industry templates from those configuring every deployment from a blank starting point.
Gross Margin: 32% to 42%

Premium / Certified

Quality and traceability systems plus industrial data platforms, sold on regulatory requirement and analytical capability rather than on process enforcement. The twelve point spread tracks how much of a vendor's revenue arrives as licence rather than as configuration services billed by the hour.
Gross Margin: 52% to 64%

Sustainability / Regulatory / Next-Generation

Connected worker enablement, predictive maintenance and production digital twins, each deploying quickly against a benefit the customer already measures independently. The twelve point spread reflects how much configuration each deployment requires, which decides whether services cost consumes the licence margin.
Gross Margin: 68% to 80%
digital-transformation-in-manufacturing-market-portfolio-architecture-1789991972696

High-value Sub-segments and Strategic Watch-out

Connected Worker And Frontline Enablement

Grows at 17.7% because median operator tenure fell to 2.4 years and undocumented process knowledge is leaving plants faster than anybody captures it. The twelve point spread reflects configuration depth. The buyer is a plant manager who cannot staff a shift rather than an engineer.
Gross Margin: 68% to 80%

Predictive Maintenance And Asset Analytics

Grows at 15.2% on unplanned downtime near 7% of production hours, which finance departments already measure and already report every month. The twelve point spread reflects model tuning effort. Models transfer poorly between plants, and vendors consistently understate that during the sale. Finance accepts it without argument.
Gross Margin: 68% to 80%

Production Digital Twins And Simulation

Grows at 13.4% as manufacturers test line changes and product introductions in simulation rather than by disrupting an operating production line. The twelve point spread reflects model fidelity. Value depends entirely on whether the twin matches actual practice rather than documented practice. Documented practice is the wrong reference.
Gross Margin: 68% to 80%

Manufacturing Execution And Operations Management

Grows at 6.8%, slowest of the six classes, on multi-year implementations delivering their approved business case around 55% of the time. The ten point spread reflects template maturity. This category defined the whole market for twenty five years, which is worth remembering. Services consume most of the contract.
Gross Margin: 32% to 42%

Why Plants Keep Or Abandon Systems

The annuity is production dependency rather than any contract term. Once a system schedules work, records quality data or releases material, removing it stops the plant, and no manufacturer schedules that voluntarily. That makes a successful implementation almost permanent regardless of satisfaction. The corollary is uncomfortable: a system operators route around depends on nothing, and gets abandoned quietly at renewal.
Depth varies by whether the system sits in the production path. An execution system releasing material to the line is load bearing and effectively permanent once it works. Quality and traceability systems are similarly embedded where regulation requires records. Predictive maintenance advises rather than controls, and a plant that stops trusting the alerts simply stops acting on them long before anybody cancels the subscription.

The buyer split in a way most vendors have not organised around. A capital committee approves multi-year programmes on business cases and reviews them annually. A plant manager approves tooling from an operating budget and judges it within a quarter. The second buyer is where the growth is, holds a smaller budget and decides considerably faster, and vendors built for the first route keep losing deals they never saw run.
digital-transformation-in-manufacturing-market-end-use-penetration-index-1789991973186

What Separates Success From Failure

These are among the four positions where our research anticipates prominent divergence between winners and laggards over the coming forecast period. Each is grounded in the demand model, the regulatory perimeter, and the announced capacity pipeline.
01 / PROCESS DISCOVERY RIGOUR

Configure The Plant You Have

Around 45% of these programmes fail to deliver the business case they were approved against, and the recurring cause is that the plant does not run the way its own documentation claims it does. Decades of undocumented adjustment made by people who understood the equipment sit between the two, and a system enforcing documentation collides with that reality on the first day. Spending weeks observing actual practice before configuration costs a small fraction of the rework it reliably prevents afterwards.
02 / OPERATIONS BUYER ACCESS

Call On The Roster, Not The Roadmap

Median operator tenure across developed economies has fallen to 2.4 years, which turns the loss of undocumented process knowledge into an operational emergency rather than a productivity concern anybody can defer. Connected worker tooling compounds at 17.7% precisely because it addresses that, and the buyer is a plant manager staring at an unfilled roster rather than an improvement engineer building an efficiency model. That buyer approves faster, argues less about payback and holds a budget that never competes against capital equipment.
03 / GREENFIELD PIPELINE COVERAGE

Arrive Before The Concrete Is Poured

Digitising a plant during construction costs around 62% less than retrofitting the same capability afterwards, because processes get designed around the system rather than the system being fitted around undocumented practice built over decades. Network infrastructure, sensor placement and data architecture all cost dramatically less when specified before anything is built at all. India compounds at 18.4% on precisely this mechanism, and those construction pipelines appear in incentive awards and environmental permits years ahead of any procurement conversation happening anywhere.
04 / APPROVAL ROUTE SELECTION

Reach The Budget That Decides Quickly

Traditional execution system implementations run for years, cost more in consulting than in licences and deliver the approved business case around 55% of the time across the industry. Deploying in weeks by fitting actual practice rather than enforcing documentation shortens payback enough to move the approval from a capital committee to a plant operating budget entirely. A plant manager approving from operating expenditure decides within a month rather than within a year, which is an entirely different sales motion with a different organisation behind it.

Engagement Snapshot From the Field

A live engagement with an industry participant carrying material or product regulatory and market exposure ahead of a defining policy shift, showing how our research translates into a defensible multi-year portfolio strategy.
MARKET MINDS ADVISORY · CLIENT ENGAGEMENT SUMMARY
Digital Transformation in Manufacturing Producer Strategic Portfolio Review and Transition Roadmap 2026·Investment Scenario on Digital Transformation in Manufacturing Exposure Evaluation 2025-26
CLIENT PROFILE
A European automotive component manufacturer operating nine plants across four countries, two years into a group manufacturing execution system programme intended to standardise operations. Two plants had gone live and both were running parallel spreadsheets to reconcile system data against actual production. The remaining seven were scheduled and the group board was reconsidering the whole investment.
STRATEGIC CHALLENGE
The programme office maintained that the two live plants had failed on change management and that the remaining rollout should continue as planned. Plant management at both sites disagreed and could not explain precisely why in terms the board would accept. Nobody had compared the configured process against what the plants actually did, and the next approval gate was six weeks away.
MMA APPROACH
MMA compared the configured system process against observed practice at both live plants, tracing every workaround to its origin. We assessed which divergences reflected genuine process improvement opportunities and which reflected undocumented practice that existed for sound engineering reasons. The work drew on 47 expert interviews conducted in Q4 2025 with manufacturers, vendors and implementation specialists across the region.
KEY FINDINGS
  1. Around 3 in 5 workarounds existed because the configured process was genuinely wrong for the equipment, not because operators resisted change at all.
  2. The two live plants differed from each other in 40 significant process steps, so a single group configuration could never have fitted both properly.
  3. Implementation services had consumed roughly 2 times the software licence cost, and the remaining rollout would have consumed considerably more (client-reported, unverified by MMA).
  4. Predictive maintenance deployed at a single plant entirely outside the main programme had already delivered a measurable downtime reduction inside one quarter.
CLIENT PROFILE
A European automotive component manufacturer operating nine plants across four countries, two years into a group manufacturing execution system programme intended to standardise operations. Two plants had gone live and both were running parallel spreadsheets to reconcile system data against actual production. The remaining seven were scheduled and the group board was reconsidering the whole investment.
STRATEGIC CHALLENGE
The programme office maintained that the two live plants had failed on change management and that the remaining rollout should continue as planned. Plant management at both sites disagreed and could not explain precisely why in terms the board would accept. Nobody had compared the configured process against what the plants actually did, and the next approval gate was six weeks away.
MMA APPROACH
MMA compared the configured system process against observed practice at both live plants, tracing every workaround to its origin. We assessed which divergences reflected genuine process improvement opportunities and which reflected undocumented practice that existed for sound engineering reasons. The work drew on 47 expert interviews conducted in Q4 2025 with manufacturers, vendors and implementation specialists across the region.
KEY FINDINGS
  1. Around 3 in 5 workarounds existed because the configured process was genuinely wrong for the equipment, not because operators resisted change at all.
  2. The two live plants differed from each other in 40 significant process steps, so a single group configuration could never have fitted both properly.
  3. Implementation services had consumed roughly 2 times the software licence cost, and the remaining rollout would have consumed considerably more (client-reported, unverified by MMA).
  4. Predictive maintenance deployed at a single plant entirely outside the main programme had already delivered a measurable downtime reduction inside one quarter.
RECOMMENDED STRATEGY
Phase 1: Phase one: pause the remaining rollout and reconfigure the two live plants against observed practice rather than against the group process model. Phase 2: Phase two: allow plant level configuration variation within a common data model, since the plants genuinely differ and pretending otherwise failed twice. Phase 3: Phase three: deploy predictive maintenance across all nine plants immediately, since it works independently and pays back within a quarter.
OUTCOME
The manufacturer paused the rollout, reconfigured both live plants against observed practice and deployed predictive maintenance group wide (client-reported, unverified by MMA). Parallel spreadsheets disappeared at both sites within two quarters. Process observation now precedes configuration on every plant, which is the change that outlasted the engagement itself.

Frequently Asked Questions

Foundational context covering the market sizes, CAGR, scope, country, region and competition that inform every finding below. This section is provided to cover basics and most often pre-purchase conversations, answered from the MMA Primary Research Dataset.

What is the current size of the Digital Transformation in Manufacturing Market?

Global value reaches USD 46.96 billion in 2026, measured as manufacturing digital transformation software and platform revenue across six capability classes. The 2025 base is USD 42.0 billion.

How large will the Digital Transformation in Manufacturing Market be by 2036?

Platform revenue reaches USD 143.27 billion by 2036, an increase of USD 96.31 billion over the forecast period. That represents 3.05 times expansion from the 2026 base.

What is the CAGR for the Digital Transformation in Manufacturing Market 2026 to 2036?

The base case runs at 11.8% annually, with a bull case at 13.1% if implementation success rates improve as deployments shorten and a bear case at 10.5% if industrial capital investment slows.

Which segment is growing fastest?

Connected worker and frontline enablement grows at 17.7%, half again the market rate of 11.8%. Median operator tenure fell to 2.4 years and undocumented process knowledge is leaving plants faster than anybody captures it.

Who are the major companies in the Digital Transformation in Manufacturing Market?

Siemens, Rockwell Automation, SAP, Schneider Electric and PTC lead on platform revenue, together holding just 29%. Tulip Interfaces, Augury and Samsara reach plant budgets directly instead.

Which country is growing fastest?

India leads at 18.4%, because incentive funded plant construction digitises during the build and captures a cost advantage near 62% over retrofitting. Vietnam and Indonesia follow.

Report Segmentation Architecture

The full report scope spans multiple orthogonal segmentation dimensions, with cross-tabulated demand data provided for each dimension pair. Coverage extends further to regional breakdowns, trend trajectories, and the competitive detail needed to support segment-level decision-making.

By Capability Class

  • Connected Worker And Frontline Enablement
  • Predictive Maintenance And Asset Analytics
  • Production Digital Twins And Simulation
  • Industrial Data Platforms And Historians
  • Quality And Traceability Systems
  • Manufacturing Execution And Operations Management

By End-Use Industry

  • Automotive And Component Manufacturing
  • Electronics And Semiconductor Assembly
  • Food And Beverage Production
  • Pharmaceutical And Life Sciences
  • Chemicals And Process Industries
  • Industrial Machinery And Equipment

By Commercial Dimension

  • Capital Programme Procurement
  • Plant Level Operating Budget Purchase
  • Systems Integrator Delivery
  • Automation Vendor Bundled Supply
  • Subscription And Consumption Pricing
  • Construction Project Specification

By Region

  • North America
  • Western Europe
  • East Asia
  • South Asia and Pacific
  • Latin America
  • Middle East and Africa
  • Eastern Europe

Scope, Methodology, and Coverage

Every figure in this report is reproducible from documented input assumptions. The scope below maps the historical period, the forecast horizon, the segmentation dimensions, and the countries covered, alongside the underlying primary and qualitative methodology.
Historical Period
2020 to 2025
Forecast Period
2026 to 2036
Base Year
2025 (USD billions; MMA Primary Research Dataset, September 2026)
Market Definition
This report covers software and platforms that digitise manufacturing operations: connected worker and frontline enablement, predictive maintenance and asset analytics, production digital twins and simulation, manufacturing execution and operations management, quality and traceability systems, and industrial data platforms and historians. It excludes automation hardware and control systems, enterprise resource planning suites, product design software, supply chain planning platforms, and industrial robotics or machinery.
Quantitative Units
USD millions, software and platform revenue basis; digitised production sites; implementation success rate as a percentage; operator tenure in years; unplanned downtime as a share of production hours.
Segmentation Dimensions
Capability class; manufacturing industry; commercial procurement route; geography across seven regions.
Regions Covered
North America, Western Europe, East Asia, South Asia and Pacific, Latin America, Middle East and Africa, Eastern Europe
Countries Covered
China, Japan, South Korea, Taiwan, India, Vietnam, Indonesia, Australia, United States, Canada, Mexico, Brazil, Germany, Italy, France, Switzerland, Poland, Czechia, Saudi Arabia, Morocco.
Key Companies Profiled
Siemens, Rockwell Automation, SAP, Schneider Electric, PTC, ABB, Honeywell, Emerson, Dassault Systemes, AVEVA, Hexagon, Yokogawa, Tulip Interfaces, Augury, Samsara.
Quantitative Methodology
Primary survey, n=3,800 respondents, Q4 2025, six countries; demand-side model with trade association cross-validation
Qualitative Methodology
47 expert interviews, Q4 2025; applied to validate demand model assumptions, identify emerging dynamics, and assess competitive positioning
Report Format
PDF and XLSX data workbook (Word format preview document)
Publisher
Market Minds Advisory
Report Code
MMA-2026-TEC-571
Published
September 2026
Contact
sales@marketmindsadvisory.com | www.marketmindsadvisory.com

Purchase the full Digital Transformation in Manufacturing Market Report (2026 to 2036).

This report sizes the global manufacturing digital transformation market from 2026 to 2036 across six capability classes, six industries and seven regions. It explains why around 45% of programmes miss their approved business case, how a fall in operator tenure to 2.4 years moved the constraint from machines to people, and why greenfield digitisation costs 62% less than retrofitting the same capability. Cost composition is sourced to company annual reports, with implementation labour analysed as the margin determinant. Regional analysis explains why East Asia leads at 34% while India compounds at 18.4%. Competitive assessment covers 20 named suppliers.
Six manufacturing capability classes sized through to 2036
Implementation failure economics modelled across the whole category
Services cost composition drawn from company annual filings
Twenty named suppliers assessed on platform revenue
Four revenue levers with quantified commercial impact
Anonymised automotive manufacturer programme recovery engagement included fully

Built For The People Who Decide

From boardroom strategy to bench-side execution, this report is read cover-to-cover by leaders shaping the next decade of their industry, turning demand scenarios, market dynamics and valuation benchmarks into decisions.
CXOs/ Presidents/ VPs/ Managers
M&A and Corporate Development
Strategy Teams and R&D Heads
Procurement and Product Directors
Regulatory and Compliance Leaders
Investor Relations and Equity Analysts