Market Minds Advisory
Digital Thermo Anemometer Market

Digital Thermo Anemometer Market: Digital Thermo Anemometer Market: The Method Decides, Not The Meter

Two competent technicians with the same instrument measuring the same duct will disagree by nine percent. The instrument is not what decides the number, and yet everybody in this business sells instruments.

Lead Analyst

Published

September 2026

Make Smarter Decisions with Customized Research Insights

Request a free sample report and evaluate market opportunities, growth trends, and competitive dynamics relevant to your business needs.

2025 MARKET VALUE$0.5BMarket Size 2025
2036 FORECAST VALUE$1.1BBase Case , 2026 to 2036
CAGR 2026 TO 20367.2 %Bull 8.4% / Bear 6.0%
INCREMENTAL OPPORTUNITY$0.5BNet 10- year value creation
EXPANSION MULTIPLE2.00x2036 value over 2026 base
Strategic Levers
M&A Pipeline
Regional Outlook
Country Rankings
Competitive Intelligence
Segmental Deep-dive
Call-Us : 91 93563 13602

Executive Snapshot and Market Trajectory.

Calibration costs 1.8 times what the instrument did across its working life, because any documented measurement requires traceable recalibration every 12 months and an uncalibrated meter is useless for the work it was bought to do. Almost nobody sells that as a subscription of any kind.
Ultrasonic time-of-flight anemometers grow at 10.8%, half again the market rate of 7.2%, because they have no heated element to foul or drift and hold calibration considerably longer than thermal sensors do. East Asia holds 29% of demand on instrument manufacturing alongside enormous cleanroom, electronics fab and construction commissioning volume that no other region matches at that scale. Supply and demand both happen to sit in exactly the same place, which is unusual.
Concentration is moderate at 51% of units shipped, and the interesting position is not the instrument at all. Air velocity in a duct depends on probe placement and traverse method as much as on the sensor, which is why two technicians with identical meters differ by 9% on the same measurement. The standard decides the number and the instrument merely records it. Nobody in this sector sells the method.
Market Definition
The digital thermo anemometer market covers portable and fixed instruments that measure air velocity together with temperature for ventilation, process and environmental applications, spanning hot-wire thermal anemometers, rotating vane anemometers, ultrasonic time-of-flight anemometers, fixed duct-mounted transmitters, multi-function indoor air quality meters, and pitot and differential pressure instruments. Scope covers units shipped into professional use together with associated calibration services. Excluded are laboratory reference standards and wind tunnels, meteorological weather stations, particle counters and gas analysers sold separately, building management control systems, and process flow meters for liquids.
Base Year Value
$0.5B in 2025 (MMA Primary Research Dataset, September 2026)
Forecast Period
2026 to 2036, eleven discrete annual values
CAGR
7.2% base case. Bull 8.4%. Bear 6.0%.
Fastest Growth Segment
Ultrasonic Time-of-Flight Anemometers: 10.8% CAGR
Fastest Growth Country
India: 9.4% CAGR
Fastest Growth Region
South Asia and Pacific: 9.4% CAGR
Largest Region
East Asia: 29% of 2025 global value
Market Leaders
TSI Incorporated, Testo, Fluke, Kanomax and Extech. Source: MMA Analysis, July 2026.
Primary Survey
n=3,800 procurement and R&D decision-makers, Q4 2025, six countries
Methodology
Demand-side build-up, cross-validated against public data, 47 expert interviews

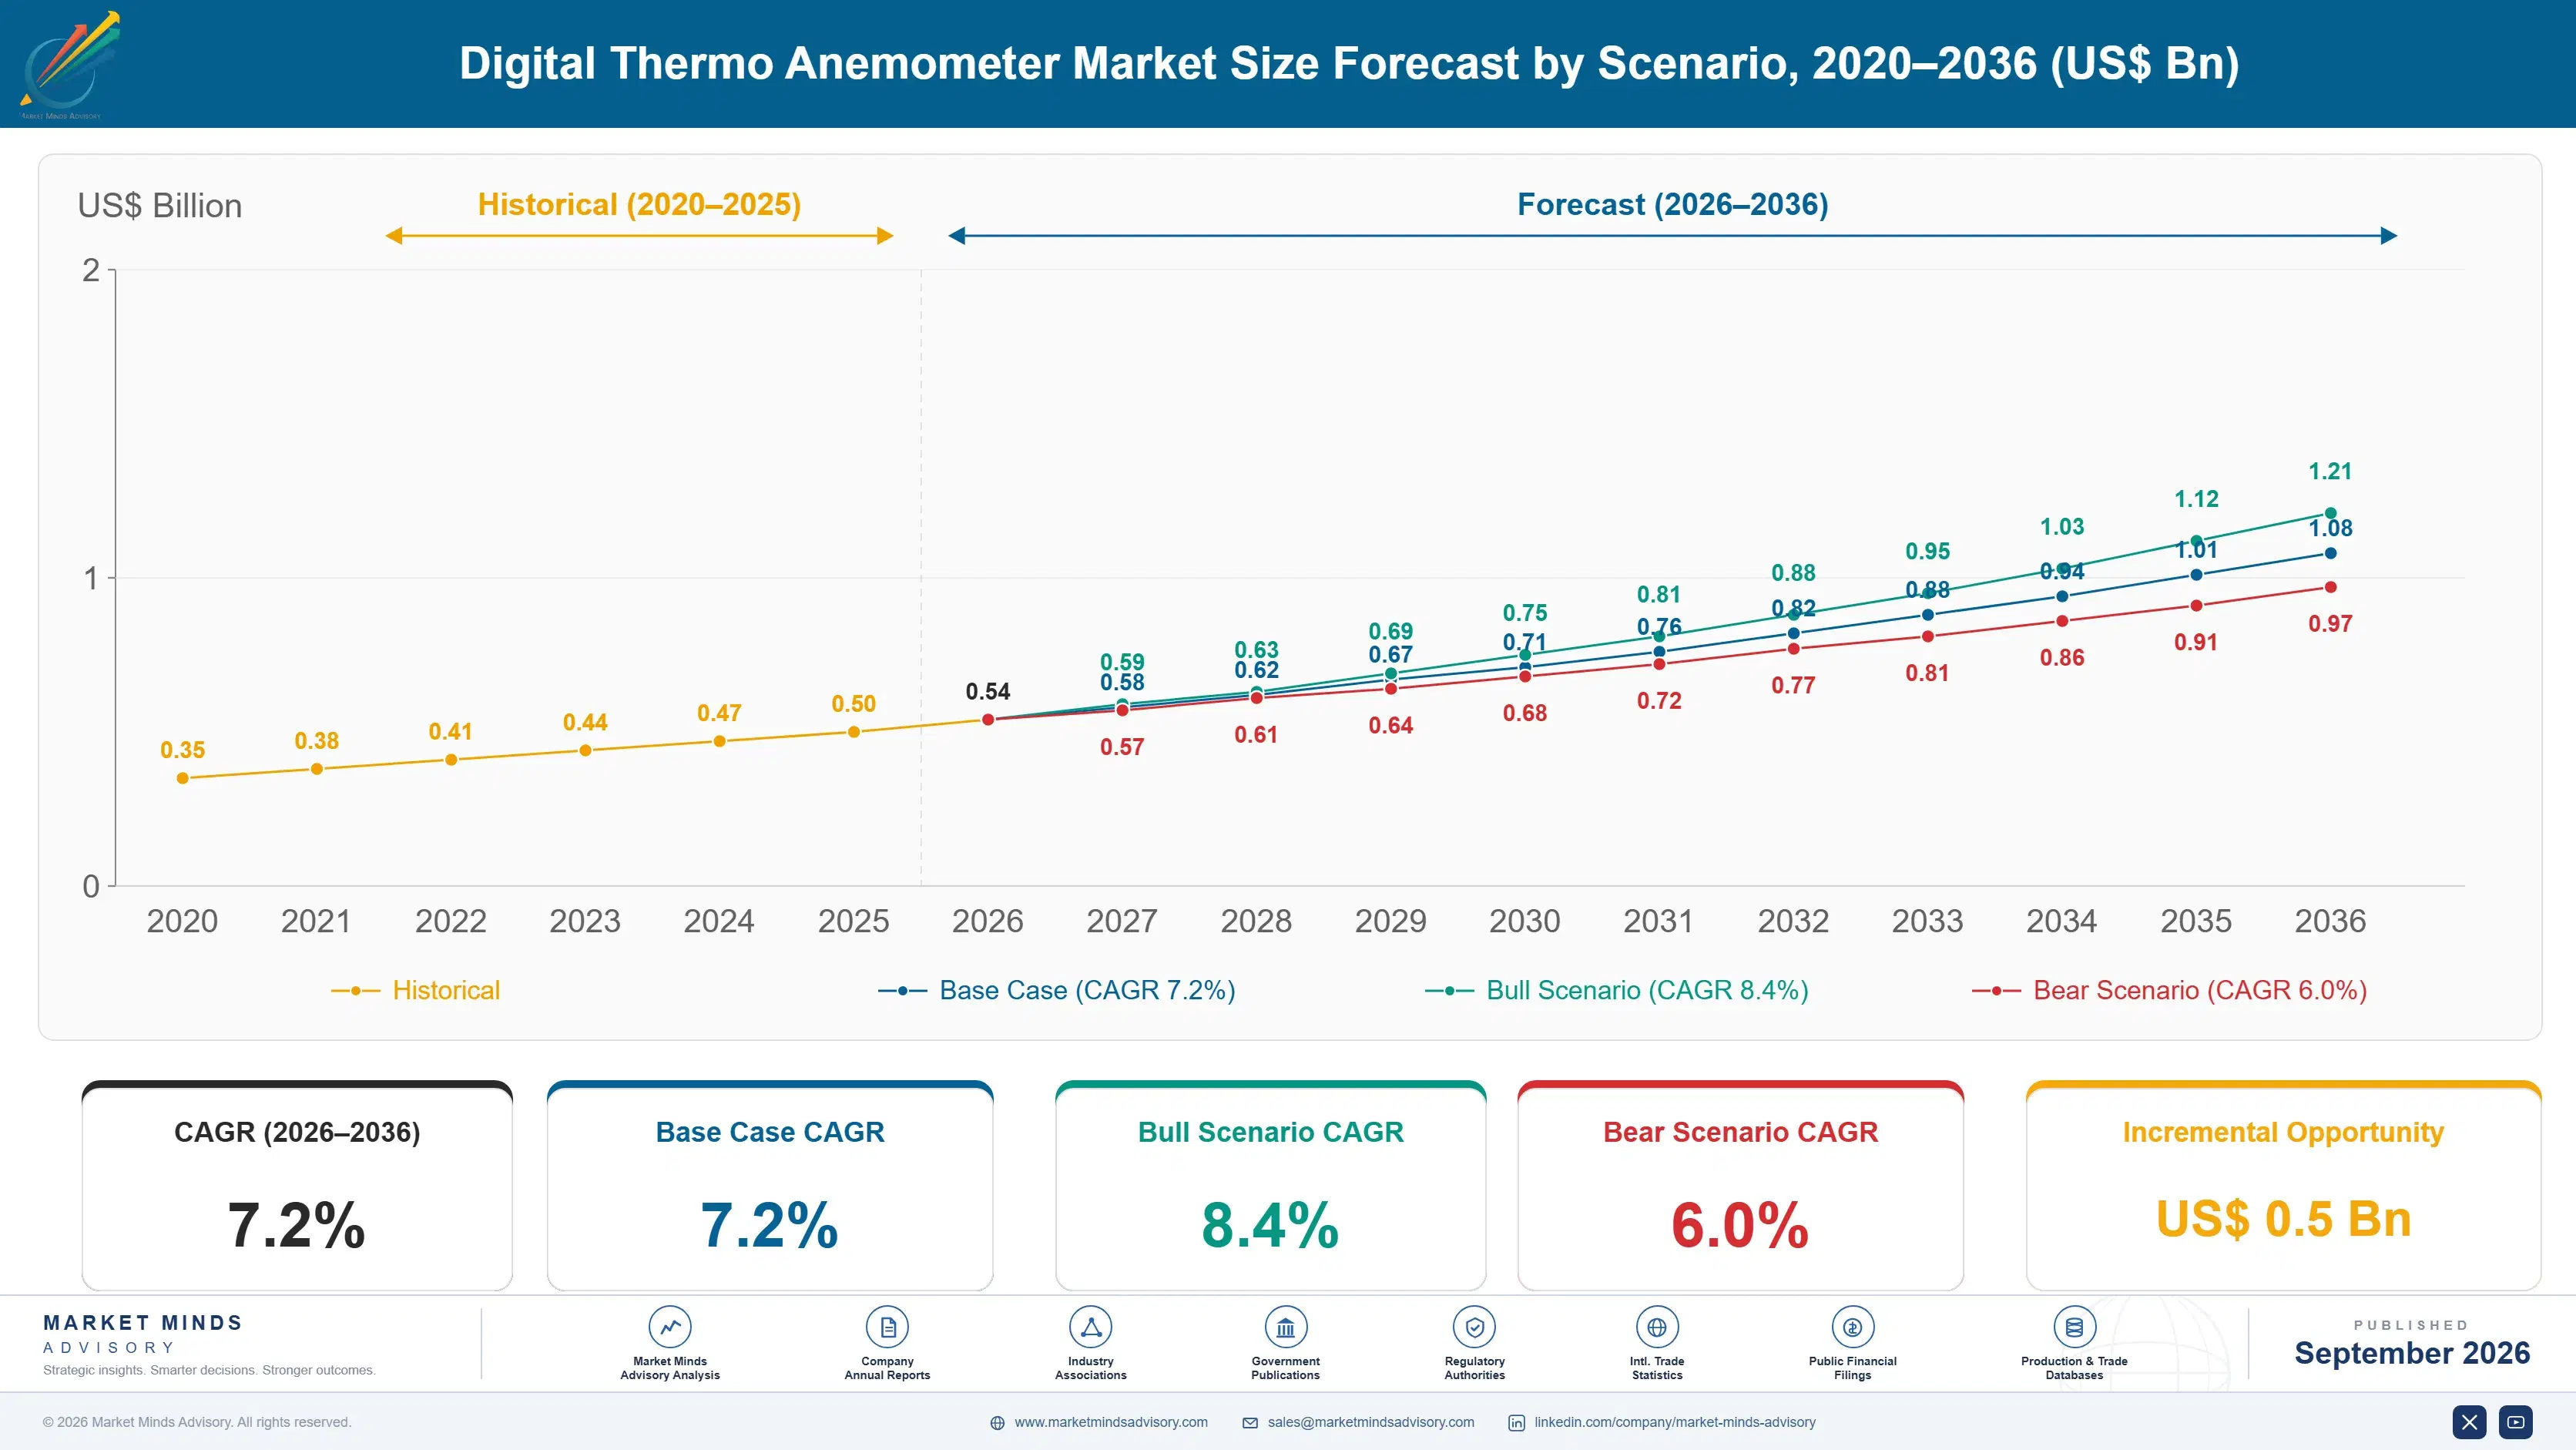
Digital Thermo Anemometer Market Forecast Scenarios

digital-thermo-anemometer-market-size-forecast-scenario-1788255426678
Between 2020 and 2025 the sector compounded at 6.0% and one event created most of it. Ventilation verification moved from an occasional commissioning task into a documented requirement across schools, healthcare buildings and workplaces after 2020, and instrument demand followed within quarters. That step has not reversed, and the buildings that were assessed then are now on periodic reassessment cycles that nobody had before.
The 7.2% base case rests on three mechanisms. Ventilation verification is now written into building standards rather than left to commissioning practice, which converts an occasional purchase into a recurring obligation. Cleanroom and laboratory certification continues expanding with semiconductor, pharmaceutical and medical device capacity. And calibration requirements attach recurring revenue to every instrument already in the field. None of the three depends on construction volume growing. Compliance cadence carries this market now.
The bull case at 8.4% turns on indoor air quality monitoring becoming a continuous fixed installation requirement rather than a periodic handheld measurement, which would multiply the installed base considerably. The bear case at 6.0% is exactly the same shift running the other way: fixed sensors integrated into building management systems displace handheld instruments and the measurement stops being a separate purchase at all.

Nine Percent Between Technicians

The instrument is the smaller half of what a customer actually spends. A meter costing USD 640 requires traceable recalibration every twelve months to remain usable for any documented measurement, and across a working life those calibrations total around 1.8 times the original purchase. Manufacturers sell the instrument competitively and let the calibration revenue arrive through service departments that were never designed to sell anything.
TOP FIVE CONCENTRATION51%Share of units shipped held by five largest manufacturers
AVERAGE SELLING PRICEUSD 640Mean price per instrument across all sensing technologies
CALIBRATION INTERVAL REQUIRED12 monthsPeriod before traceable recalibration is needed for documented work
LIFETIME CALIBRATION COST1.8 timesRecalibration spending against the original instrument purchase price
TRAVERSE POINT COUNT24 pointsMeasurements required across a duct for an acceptable average
TECHNICIAN READING VARIATION9%Spread observed when two operators measure the same duct
Measuring air velocity in a duct is considerably harder than the instrument specifications suggest. Velocity varies across the cross-section, so a valid figure needs a traverse of roughly 24 points positioned to a defined method, and the result depends on probe placement, duct condition and turbulence as much as on the sensor. Two competent technicians with identical instruments routinely differ by around 9% on the same duct.
Ventilation verification changed status after 2020 and has not changed back. What had been a commissioning task performed once became a documented requirement across schools, healthcare buildings and workplaces, with periodic reassessment attached in many jurisdictions. That converted an occasional instrument purchase into a recurring obligation for facilities teams who had never previously owned one at all.
"The whole industry competes on sensor accuracy and the field variation between two technicians dwarfs the difference between any two instruments on the market. Whoever sells the traverse method, the training and the certificate is selling the thing that actually determines the answer."
Director, Test and Measurement Instruments Practice · MMA Technology Practice · September 2026

Market Trends

Ventilation verification became a documented obligation

Indoor air quality moved from a commissioning consideration into building standards, school and healthcare programmes and workplace guidance after 2020, and the requirement was written as documented verification rather than as good practice. That put instruments into the hands of facilities teams who had never owned one, and attached periodic reassessment cycles that continue regardless of any construction activity. The demand step has persisted for several years now, which suggests it reflects a permanent change in what buildings are expected to demonstrate rather than any temporary response. Buildings must demonstrate it now.
Market Impact: Costs 1.8 times the purchase price
Ultrasonic sensing removed the drift problem

Time-of-flight ultrasonic measurement has no heated element to foul with dust, oil mist or humidity, which removes the drift mechanism that forces thermal anemometers back for recalibration and eventually retires them. Instruments hold their calibration considerably longer and survive industrial environments that shorten a hot-wire probe's life substantially. Ultrasonic units grow at 10.8% against a market rate of 7.2% on that basis, at unit prices well above thermal equivalents. The buyer is trading purchase price against calibration and replacement cost across several years. That is a lifetime cost calculation rather than a specification comparison, and it is rarely presented.
Market Impact: Certifies hoods every 12 months

Market Opportunities and Growth Drivers

Calibration is the larger half of lifetime spending

Any measurement supporting a certificate, a commissioning record or a regulatory submission requires an instrument with traceable calibration no more than twelve months old, which makes recalibration a condition of use rather than a maintenance option. Across a working life those calibrations total around 1.8 times the instrument's purchase price. That is recurring revenue attached to every unit already in the field, and most manufacturers collect it passively through service departments rather than selling it deliberately as a subscription. Nobody organised a subscription around a certificate that customers already have to buy every year.
Market Impact: Displaces 1 handheld per installation

Cleanroom and laboratory certification keeps expanding

Semiconductor fabrication, pharmaceutical manufacturing and medical device production all operate to airflow specifications requiring periodic documented verification, and capacity in all three has expanded across Asia, North America and Europe simultaneously. Fume hood face velocity certification in particular runs on a fixed annual cadence written into laboratory safety standards. That demand is compliance driven rather than discretionary, arrives on a schedule and continues regardless of whether anybody builds anything new. It is the steadiest part of this market. Certification cadence rather than construction activity drives this demand entirely, which makes it unusually predictable.
Market Impact: Produces 9% spread between operators

Market Restraints and Challenges

Fixed sensors may remove the handheld purchase

Continuous air quality and airflow sensors integrated into building management systems report the same measurements without anybody carrying an instrument to the duct, and every building that installs them reduces the case for a portable meter. The root cause is that sensor cost has fallen far enough for permanent installation to compete with periodic measurement. Commercial impact is a handheld category potentially displaced by fixed hardware. Participants are responding by building fixed transmitter ranges, integrating handhelds with building systems, and positioning portables for verification of the fixed sensors themselves. The measurement moves into the wall.
Market Impact: Requires reassessment every 12 months

Field variation undermines confidence in the reading

Two competent technicians measuring the same duct with identical instruments routinely produce results differing by around 9%, because probe placement, traverse method and duct condition all affect the answer more than sensor accuracy does. The root cause is that the measurement is genuinely difficult rather than that the instruments are poor. Commercial impact is customers disbelieving results and instrument accuracy claims losing credibility. Mitigation runs through traverse guidance built into the instrument, method training, guided measurement sequences and reporting that records how the reading was actually taken. Method is the answer here.
Market Impact: Grows at 10.8% against 7.2%
3 additional market trends, 4 additional growth drivers, and 2 additional restraints and challenges are covered in the full report. Contact sales@marketmindsadvisory.com to access the complete intelligence.

Segment CAGR and Growth Architecture

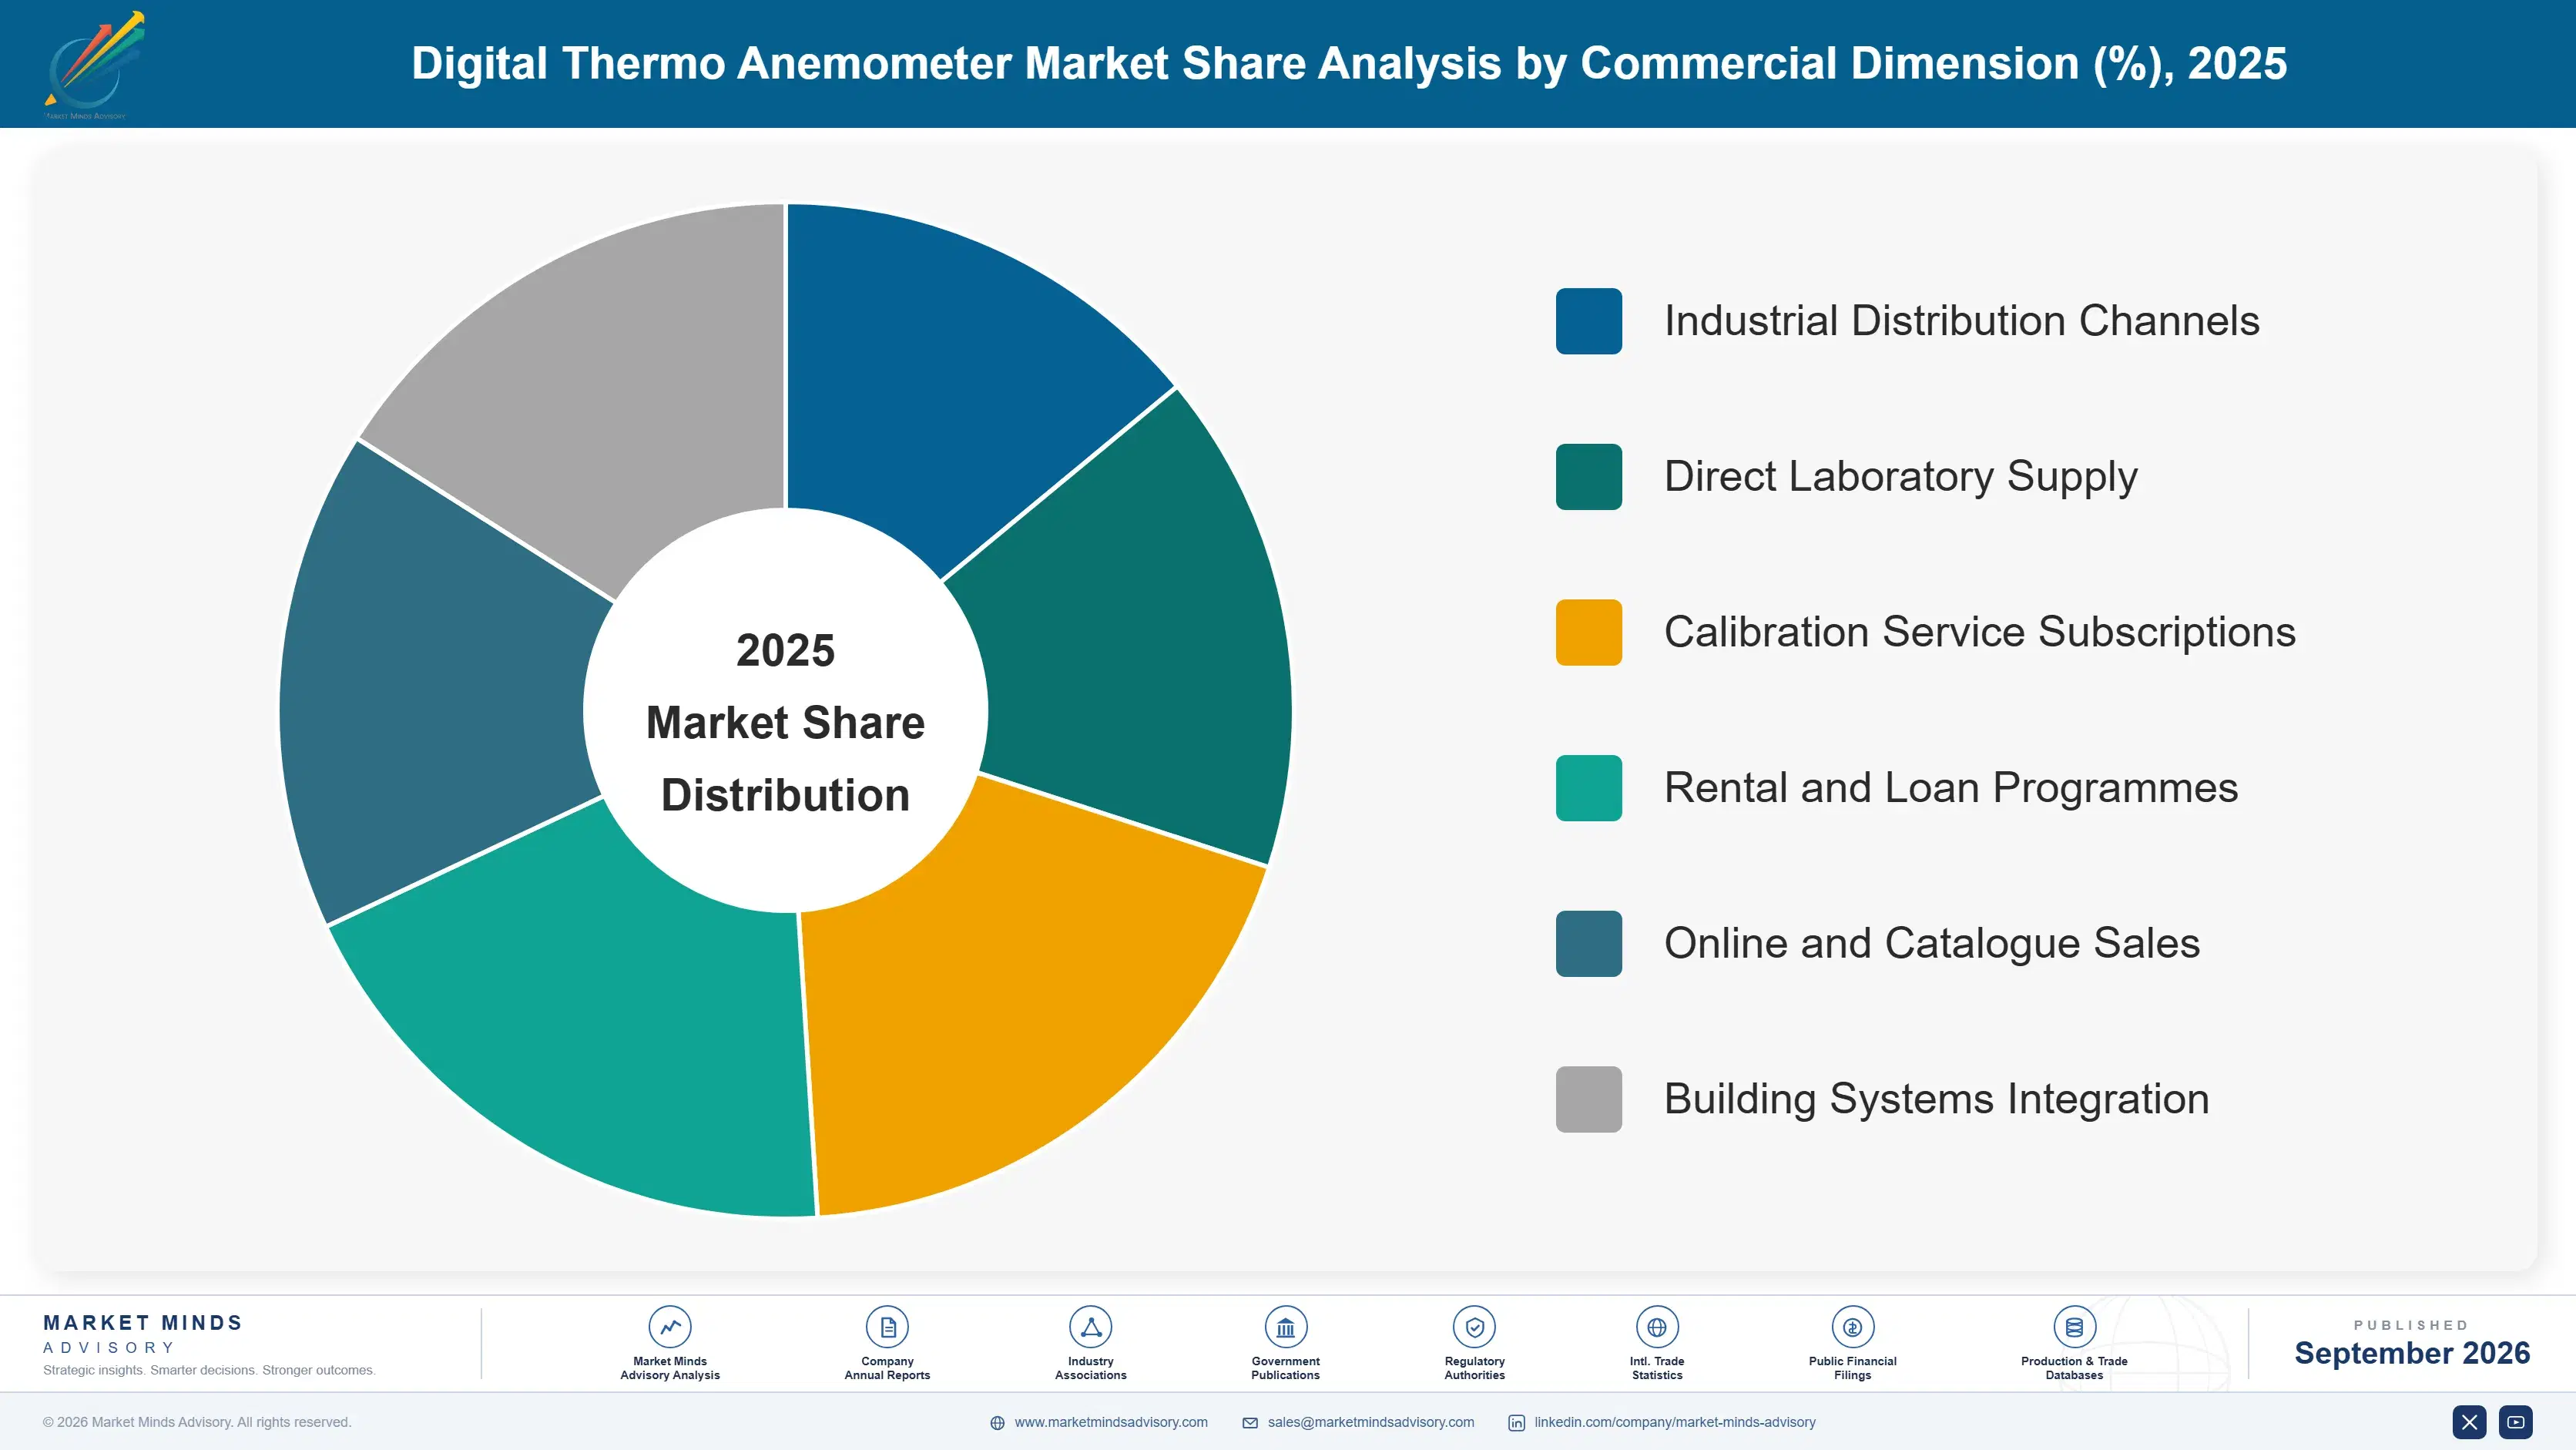
Segmentation follows sensing technology, the dimension on which drift behaviour, environment tolerance and calibration burden all move together. Vane and pitot instruments carry the installed base at modest prices and short service lives. Ultrasonic sensing and fixed transmitters carry the growth, because one removes drift entirely and the other removes the technician from the measurement.
digital-thermo-anemometer-market-market-share-analysis-1788255427227

Ultrasonic Time-of-Flight Anemometers

Ultrasonic time-of-flight anemometers grow at 10.8%, half again the market rate of 7.2%, and calibration economics rather than measurement accuracy drive the adoption. Measuring the transit time of sound between transducers requires no heated element, which removes the fouling and drift mechanism that sends thermal probes back for recalibration and eventually retires them entirely. Instruments survive dusty, oily and humid industrial environments that shorten a hot-wire probe's life dramatically, and they hold calibration considerably longer between certificates. Purchase prices run well above thermal equivalents and the buyer trading that against 1.8 times lifetime calibration cost reaches the answer quickly once somebody presents the arithmetic properly. Very few sales conversations get that far.
CAGR 10.8%

Multi-Function Indoor Air Quality Meters

Multi-function indoor air quality meters at 9.0% combine air velocity with carbon dioxide, humidity, temperature and sometimes particulate measurement in a single instrument, which suits the facilities and building services buyer who arrived in this market after 2020 without any measurement background. That buyer wants one device answering the ventilation question rather than four instruments and a method, and will accept lower performance on each parameter to get it. Specialist users regard these instruments as compromised on every measurement and buy dedicated devices instead. The two customer groups barely overlap, and manufacturers serving one frequently misjudge what the other actually wants. Building deliberately for one of them is a decision most technical organisations resist making.
CAGR 9.0%
Full segment breakdown across 6 segments available in the complete report.

Regional Architecture and Country Demand Map

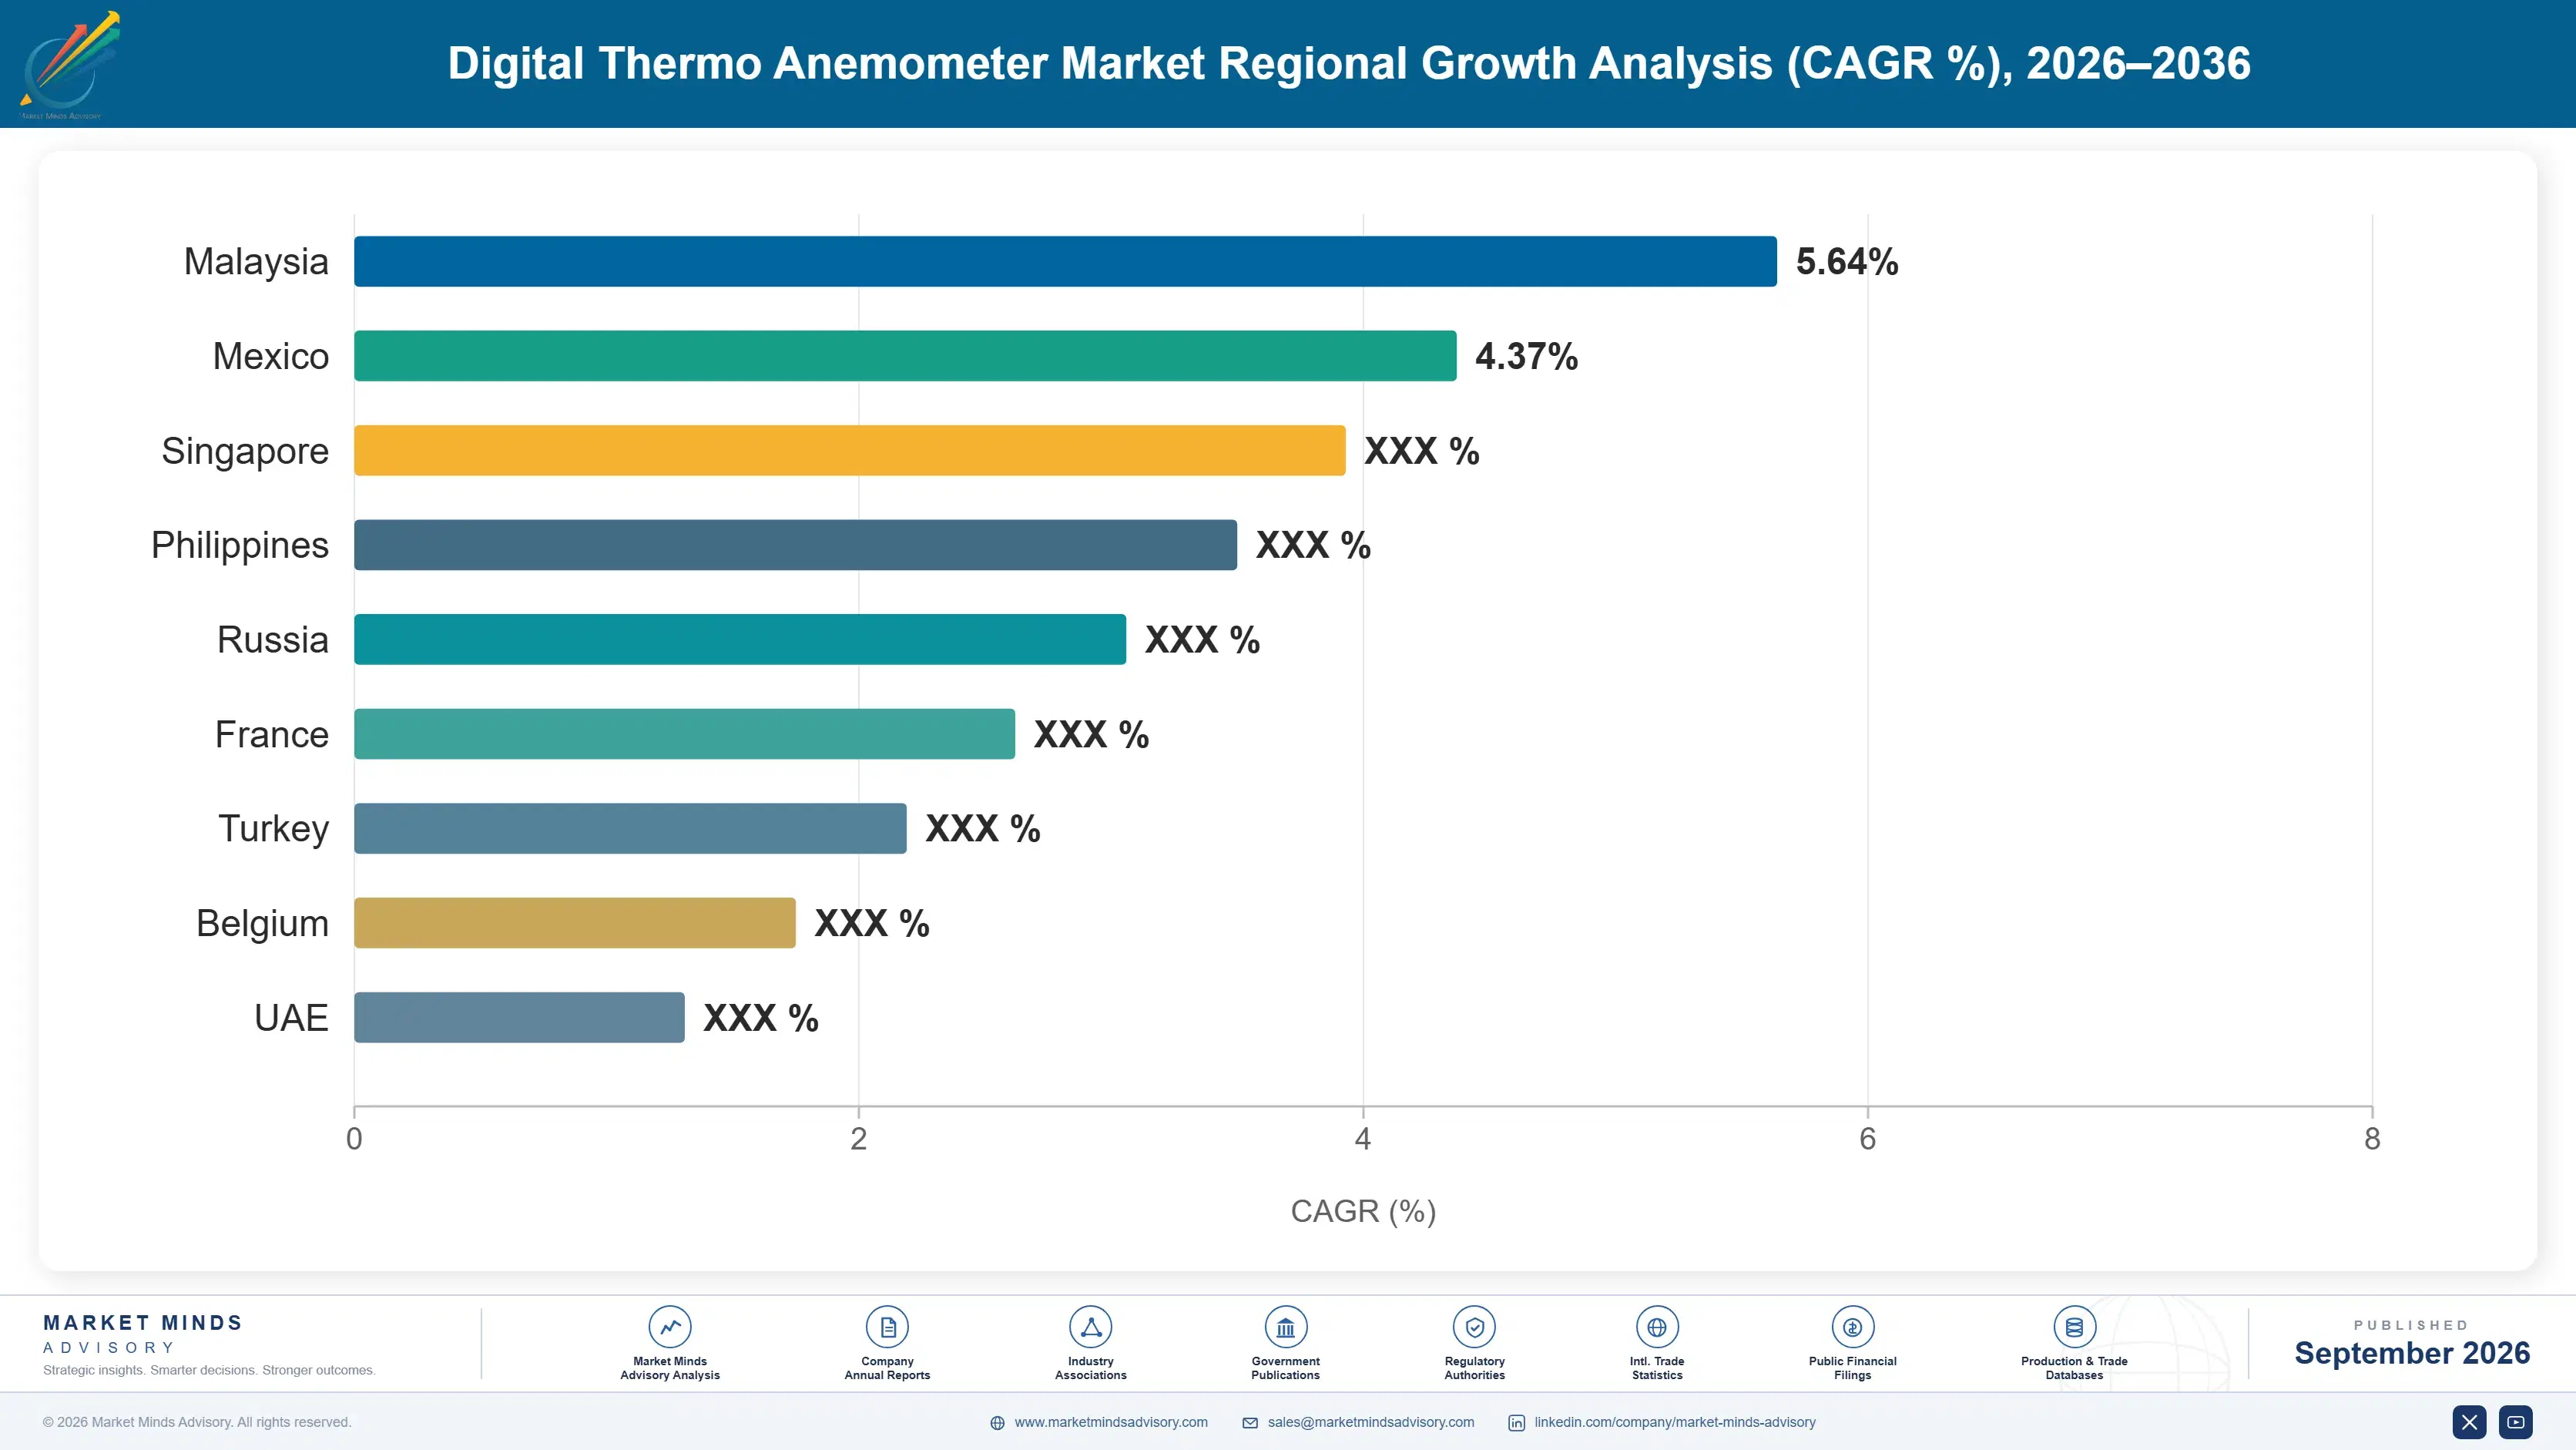
East Asia takes 29% on instrument manufacturing sitting alongside enormous cleanroom, semiconductor and construction commissioning demand. India grows fastest of any country covered anywhere. Compliance cadence and cleanroom density rather than construction volume decide most of these positions, which is not how the category is usually sized at all.

East Asia

Manufacture and consumption sit together here, which is unusual for an instrument category. Japanese, Chinese and Korean manufacturers produce a substantial share of the world's anemometers, and the same region operates the largest population of semiconductor fabrication plants, pharmaceutical facilities and cleanrooms requiring periodic airflow certification. Chinese construction commissioning volume adds enormous handheld demand at accessible price points served by domestic manufacturers. Japanese instruments hold a reputation for measurement quality that supports premium pricing across Asia and beyond. Growth at 8.0% reflects both capacity expansion and a construction sector that continues to commission buildings at scale. Manufacture and consumption sitting together is unusual and it shapes pricing across the whole category worldwide.
Share: 29% | CAGR: 8.0% (2026 to 2036)

North America

Regulation and laboratory density define this region more than construction does. Fume hood face velocity certification runs on an annual cadence written into laboratory safety practice, and the concentration of pharmaceutical, biotechnology and university laboratories makes that a substantial recurring market on its own. Ventilation verification in schools and healthcare buildings expanded considerably after 2020 and has settled into periodic reassessment rather than reverting. Calibration laboratory infrastructure is dense and traceability requirements are taken seriously. Growth at 6.8% reflects a mature market where compliance cadence rather than new construction generates most of the demand. Laboratory density is the anchor here and it does not move with construction cycles at all.
Share: 24% | CAGR: 6.8% (2026 to 2036)
Regional intelligence for 5 additional markets available in the complete report: Western Europe, South Asia and Pacific, Latin America, Middle East and Africa, Eastern Europe. Contact sales@marketmindsadvisory.com.
digital-thermo-anemometer-market-country-cagr-analysis-1788255427749

Four Moves Beyond The Instrument

None of these four is about sensor accuracy, because field variation between technicians dwarfs the difference between any two instruments anybody sells. Each works on what the customer actually spends money on across a decade, and on the measurement method that determines the answer. Two of the four are service decisions rather than product ones, which technical organisations find uncomfortable.

Sell calibration as a subscription, not a service

Traceable recalibration every 12 months is a condition of using the instrument for documented work, and across a working life those certificates total around 1.8 times the purchase price. Most manufacturers collect that passively through a service department while customers forget, use instruments out of calibration and eventually buy elsewhere. A subscription with scheduled collection, a loan instrument and automatic certification captures revenue that already exists and locks the customer in. Very few manufacturers have organised around it at all. The money already exists in this market. Nobody is organised around it.
Market Impact: Captures 1.8 times the original instrument purchase price

Build the traverse method into the instrument

A valid duct measurement requires a traverse of roughly 24 points positioned to a defined method, and two technicians disagreeing by 9% is a method problem rather than a sensor problem. An instrument guiding the operator through the correct traverse, recording where each point was taken and producing a report that documents the method removes the largest source of error in the whole measurement. It is firmware and interface work rather than sensor development. Nobody in this category is competing on it. It is firmware rather than sensor work. Nobody competes on it.
Market Impact: Guides all 24 of the required traverse points

Price ultrasonic against lifetime calibration cost

Ultrasonic instruments cost considerably more to buy and have no heated element to foul or drift, which extends calibration intervals and survives industrial environments that retire thermal probes early. Presented as a purchase price comparison they lose every time, and presented against 1.8 times lifetime calibration cost they win comfortably in dusty or humid applications. That is a spreadsheet rather than a product development programme. The segment grows at 10.8% against a market rate of 7.2% and it would grow faster if anybody framed it properly. Nobody presents the comparison properly.
Market Impact: Offsets 1.8 times the lifetime calibration spending cost

Serve the facilities buyer who arrived after 2020

Ventilation verification requirements put instruments into the hands of school, healthcare and workplace facilities teams with no measurement background and no interest in acquiring one, and that buyer wants a single device answering the ventilation question rather than four instruments and a method. Multi-function meters grow at 9.0% serving exactly that person. Specialist manufacturers regard those instruments as compromised and the customer does not care at all. Building deliberately for that buyer is a product decision most technical organisations resist making. Technical organisations resist it. The customer does not care about compromise.
Market Impact: Serves a segment now growing at 9.0% annually

Who Controls the Margin Pool

CR5 stands at 51% of units shipped into professional use, which is the only comparable basis since these instruments sit inside far broader test and measurement reporting for most manufacturers. Concentration is moderate because two very different customers buy here, and the manufacturers serving laboratory and cleanroom certification are rarely the same firms supplying building services contractors through distribution. Two customer groups, two entirely separate commercial models.
Competition runs on calibration infrastructure, documentation quality and channel reach. Calibration network density decides whether a customer can actually keep an instrument usable, which matters enormously in regions with thin laboratory infrastructure. Documentation decides acceptance where a certificate must satisfy an auditor. Channel reach decides the building services volume. Sensor accuracy differentiates far less than every specification sheet implies it does.

Rankings will move on whether fixed sensing displaces handheld measurement, which is a genuine possibility rather than a distant one. Continuous monitoring integrated into building systems reports the same numbers without anybody carrying a meter anywhere. The pressure comes from a different product architecture rather than from competitors, and the manufacturers building fixed transmitter ranges are hedging a bet the handheld specialists are not.
digital-thermo-anemometer-market-company-positioning-matrix-1788255428272

Competitive Moat and Risk Dimensions

TSI INCORPORATED

Moat: Laboratory and cleanroom credibility

Long-standing acceptance in cleanroom certification, fume hood testing and laboratory ventilation work gives the company a position in exactly the applications where documented measurement is a regulatory requirement rather than good practice. That credibility is referenced in procedures and specifications customers have already written. Displacing an instrument named in somebody's standard operating procedure is considerably harder than winning a comparison.
TSI INCORPORATED

Risk: Building services channel thinner

The facilities and building services buyer who arrived after 2020 purchases through distribution on price and convenience rather than through technical specification, and that channel favours manufacturers organised around volume rather than around laboratory credibility. Multi-function instruments serving that buyer grow faster than the specialist categories. Reaching them requires a commercial model the company was not built to run.
TESTO

Moat: Building services distribution reach

Deep distribution into heating, ventilation and building services trades reaches the technicians and contractors who buy the largest number of instruments, with a product range built for that user rather than a laboratory. Recognition among installers beats specification advantage at a trade counter. Competitors reaching those trades now pay considerably more for far less attention.
TESTO

Risk: Fixed sensing threatens handheld volume

Continuous sensors integrated into building management systems report the same measurements without a technician carrying anything, and the strongest position sits in exactly the handheld products that displacement would remove. Building a fixed transmitter business means competing against control system manufacturers with established building relationships. Distribution strength in portables offers no defence against the measurement moving into the wall.

Players Tracked

Prominent Players

TSI Incorporated
Testo
Fluke
Kanomax
Extech

Other Key Players

Omega Engineering
Dwyer Instruments
E+E Elektronik
Schiltknecht Messtechnik
Delta OHM
Sensirion
Ahlborn Mess
PCE Instruments
Lutron Electronic
Amprobe
REED Instruments
Sper Scientific
Hioki
Yokogawa Electric
Vaisala

Recent Developments

JANUARY 2025

Ventilation verification requirements settled into periodic reassessment

Building standards and workplace guidance across several jurisdictions moved ventilation verification from a one-off assessment into a periodic reassessment obligation with defined intervals. Facilities teams that had purchased instruments during the initial assessment wave found themselves committed to recurring measurement and to keeping those instruments calibrated.
Signal: A one-off requirement has quietly become a recurring one, which changes the entire demand profile here.
MAY 2025

Fixed airflow sensors integrated into building management platforms

Building management system vendors integrated continuous airflow and air quality sensing into standard platform offerings, reporting the measurements that facilities teams had previously obtained by walking a duct with a handheld instrument. Portable instrument demand across those buildings fell noticeably within the following year or so.
Signal: The measurement is moving into the wall, and handheld manufacturers have very little answer to it.
SEPTEMBER 2025

Traverse method guidance published for ventilation verification

Updated guidance on duct traverse methodology was published for ventilation verification work, addressing the point placement and averaging that produce most of the variation between technicians measuring the same duct. Instruments providing guided traverse sequences gained clear preference among contractors now required to document their method.
Signal: Method guidance created demand for a feature this industry had never treated as competitive at all.

Sensors, Electronics And Calibration

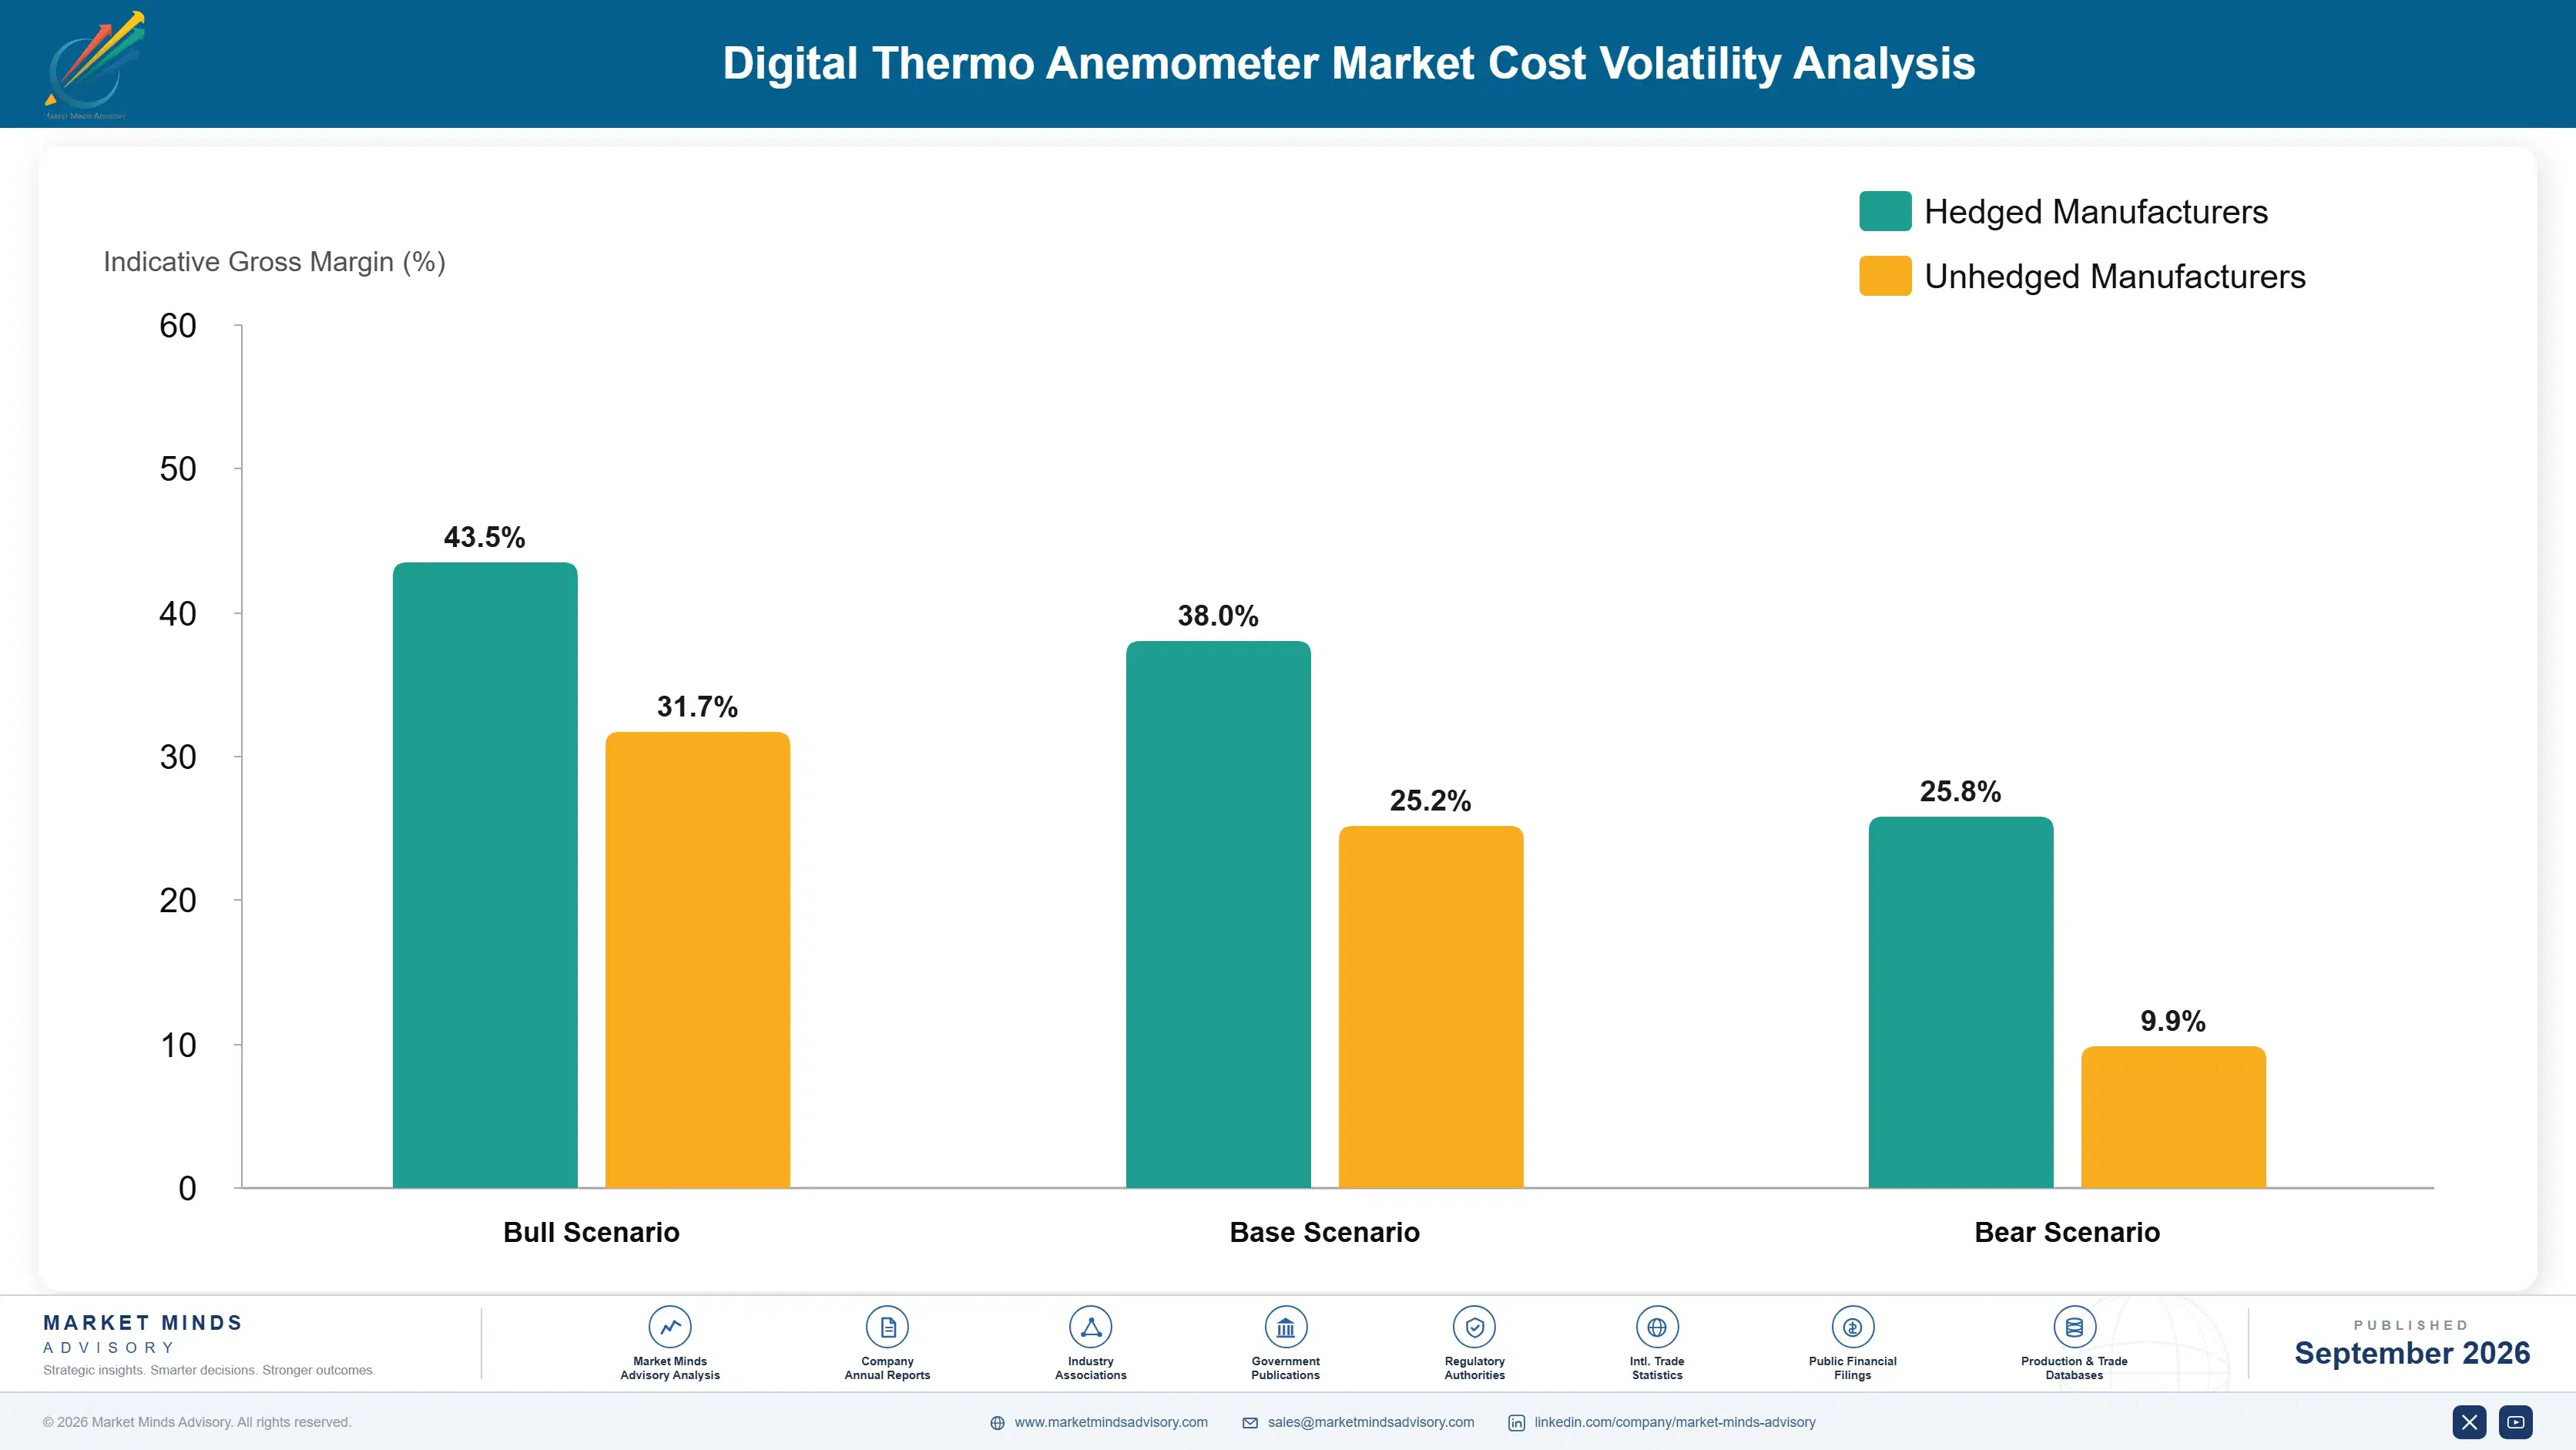
Sensing elements account for roughly 24% of instrument cost, electronics and display around 27%, and enclosure with assembly a further 18%. Calibration at manufacture against traceable standards makes up much of the remainder, and it is a cost most manufacturers understate because the same laboratory capacity also generates recurring service revenue afterwards. The cost base is electronics rather than anything exotic.
Semiconductor component availability through 2021 and 2022 hit this category hard, because instrument volumes are small and suppliers had no reason to prioritise them. Lead times extended well beyond a year on some parts, and US Census Bureau trade data recorded the resulting import patterns. Manufacturers holding component buffer stock continued shipping. Those ordering against demand lost distributor shelf position they did not fully recover.

The disadvantage falls on calibration laboratory capacity rather than on component purchasing. A manufacturer with accredited laboratories close to its customers can offer fast turnaround recalibration that keeps instruments in service and revenue recurring, while one relying on third parties or on shipping instruments across continents cannot. That infrastructure costs capital and accreditation time rather than anything technical, and it decides who captures the larger half of lifetime spending.
digital-thermo-anemometer-market-cost-volatility-analysis-1788255428467

Hold component buffer stock against allocation cycles

Electronics are 27% of instrument cost and their availability follows semiconductor allocation that has nothing to do with instrument demand, while distributor shelf position is lost quickly and recovered slowly. Buffer inventory on critical components costs modest financing against the listings it protects. Manufacturers holding stock through the last shortage kept their channel positions.

Build accredited calibration capacity near customers

Recalibration every 12 months totals around 1.8 times the purchase price across an instrument's life, and capturing it requires accredited laboratory capacity close enough for fast turnaround. Building that costs capital and accreditation time rather than technical development. Manufacturers shipping instruments across continents for calibration lose the revenue to local laboratories and the customer relationship along with it.

Standardise sensor modules across the product range

Sensing elements are 24% of cost and most manufacturers carry more variants across a range than the applications genuinely require, which forfeits purchasing scale and complicates calibration. Consolidating onto fewer modules with firmware differentiation raises volumes on each and simplifies the calibration procedure considerably. It costs some optimisation per model and returns on every unit built.

Portfolio Architecture for Margin Defence

Margin here follows calibration rather than instruments, which is the reverse of how the business is organised. An instrument sold through distribution competes on specification and price and earns modestly. The recalibration certificates it requires every twelve months across a decade earn considerably more in total, with no acquisition cost and no competition once the customer is in a scheduled programme. Very few manufacturers manage against that number.
Volume and premium pull against each other through the calibration base rather than the factory. Instruments sold at accessible prices into building services build the installed population that a calibration network serves profitably, and that population is what makes accredited laboratory capacity economic in the first place. Selling only premium laboratory instruments produces too few units to support the infrastructure that captures the recurring revenue.

High-value pools sit in ultrasonic instruments, in calibration subscriptions and in method guidance nobody has productised. The third is genuinely unclaimed: the traverse method determines the answer more than the sensor does, and an instrument that guides the operator, records the method and produces a defensible report solves the customer's actual problem rather than the one the specification sheet addresses.

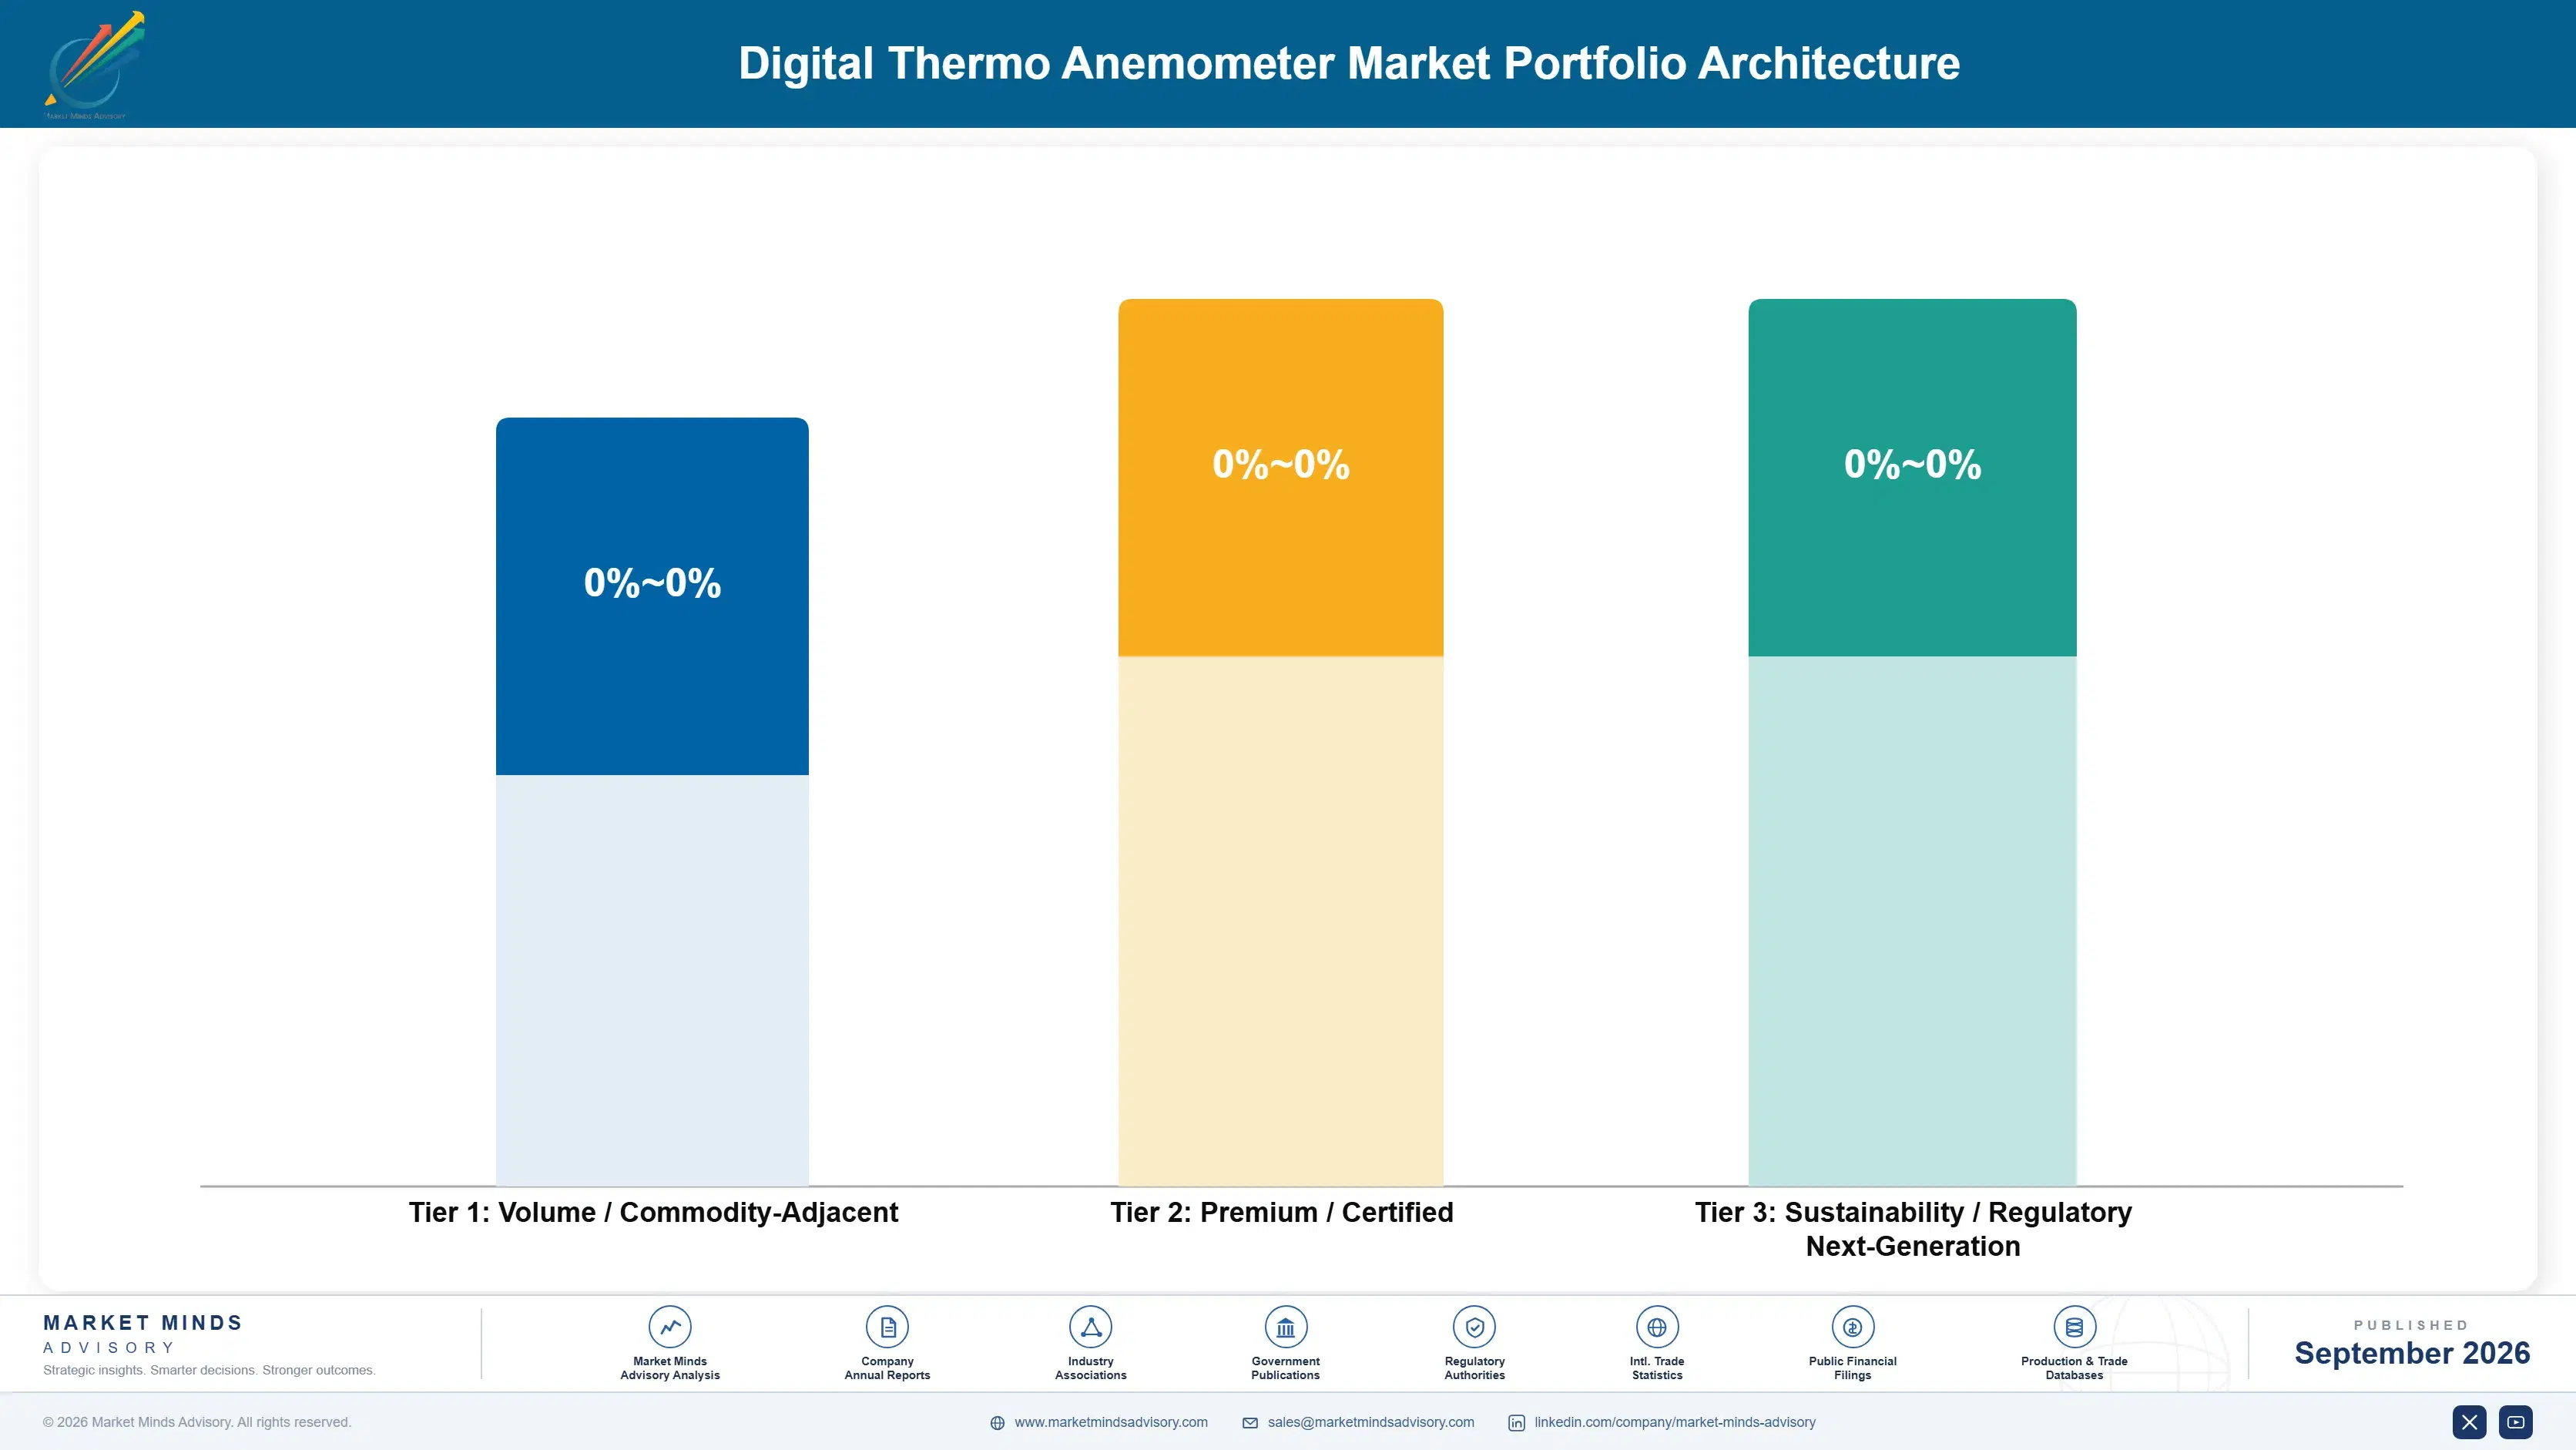
Volume / Commodity-Adjacent

Vane anemometers and basic handheld instruments sold through distribution to building services trades on price and availability. Products are broadly interchangeable at this end of the range. The 8 point spread reflects production volume and whether calibration is performed internally.
Gross Margin: 26 to 34%

Premium / Certified

Hot-wire and ultrasonic instruments supplied with traceable calibration into laboratory, cleanroom and industrial certification work. Documentation and acceptance rather than accuracy support the price. The 8 point spread reflects whether the instrument is named in customer procedures already.
Gross Margin: 40 to 48%

Sustainability / Regulatory / Next-Generation

Calibration subscriptions, guided traverse and reporting software, and fixed transmitter installations sold on recurring terms. Margins are high because the revenue recurs without acquisition cost. The 22 point spread separates service subscriptions from fixed hardware installation work entirely.
Gross Margin: 48 to 70%
digital-thermo-anemometer-market-portfolio-architecture-1788255428971

High-value Sub-segments and Strategic Watch-out

Ultrasonic Time-of-Flight Anemometers

High value and high growth at 10.8%. No heated element means no fouling, no drift and considerably longer calibration intervals in exactly the environments that retire thermal probes early. The 8 point spread reflects whether the manufacturer produces its transducers internally or simply buys them in.
Gross Margin: 44 to 52%

Multi-Function Indoor Air Quality Meters

High value with strong growth at 9.0%. It serves the facilities buyer who arrived after 2020 wanting one device rather than four instruments and a measurement method. The 8 point spread reflects how many parameters are included and whether any reporting software accompanies the instrument.
Gross Margin: 38 to 46%

Hot-Wire Thermal Anemometers

The volume core. It earns solidly and it carries the installed population that makes accredited calibration laboratory capacity economic to operate at all. The 8 point spread reflects whether the manufacturer performs calibration itself or sends instruments to third parties. Laboratory capacity decides this. Volume matters.
Gross Margin: 30 to 38%

Rotating Vane Anemometers

The strategic watch-out. Mechanical bearings wear, the instruments are commoditised across many manufacturers, and the facilities buyer increasingly wants multi-parameter measurement instead. The 22 point spread separates specialist large diameter applications from general handheld units competing purely on price. Multi-parameter meters are displacing them. Bearings wear out.
Gross Margin: 18 to 40%

Every Twelve Months, Forever

The annuity here is a calibration certificate and it is the larger half of what a customer spends. Every instrument used for documented work requires traceable recalibration annually, across a working life of perhaps a decade, which totals around 1.8 times the original purchase price with no selling required between certificates. The instrument is the entry point and the calibration schedule is the actual business.
Stickiness varies enormously by whether the instrument is named in a procedure. A meter written into a customer's standard operating procedure for fume hood certification stays there for years, because changing it means revalidating a documented method nobody wants to touch. A handheld bought through distribution for general building work is replaced by whatever is convenient next time. That difference is created at first purchase and is rarely deliberate.

Buyer profiles have shifted from commissioning engineers toward facilities managers with no measurement background, and product ranges have moved faster than sales approaches have. A commissioning engineer discussed sensor type and traverse method. A facilities manager asks whether the device says the ventilation is adequate and produces something fileable. That question is now most of the market.
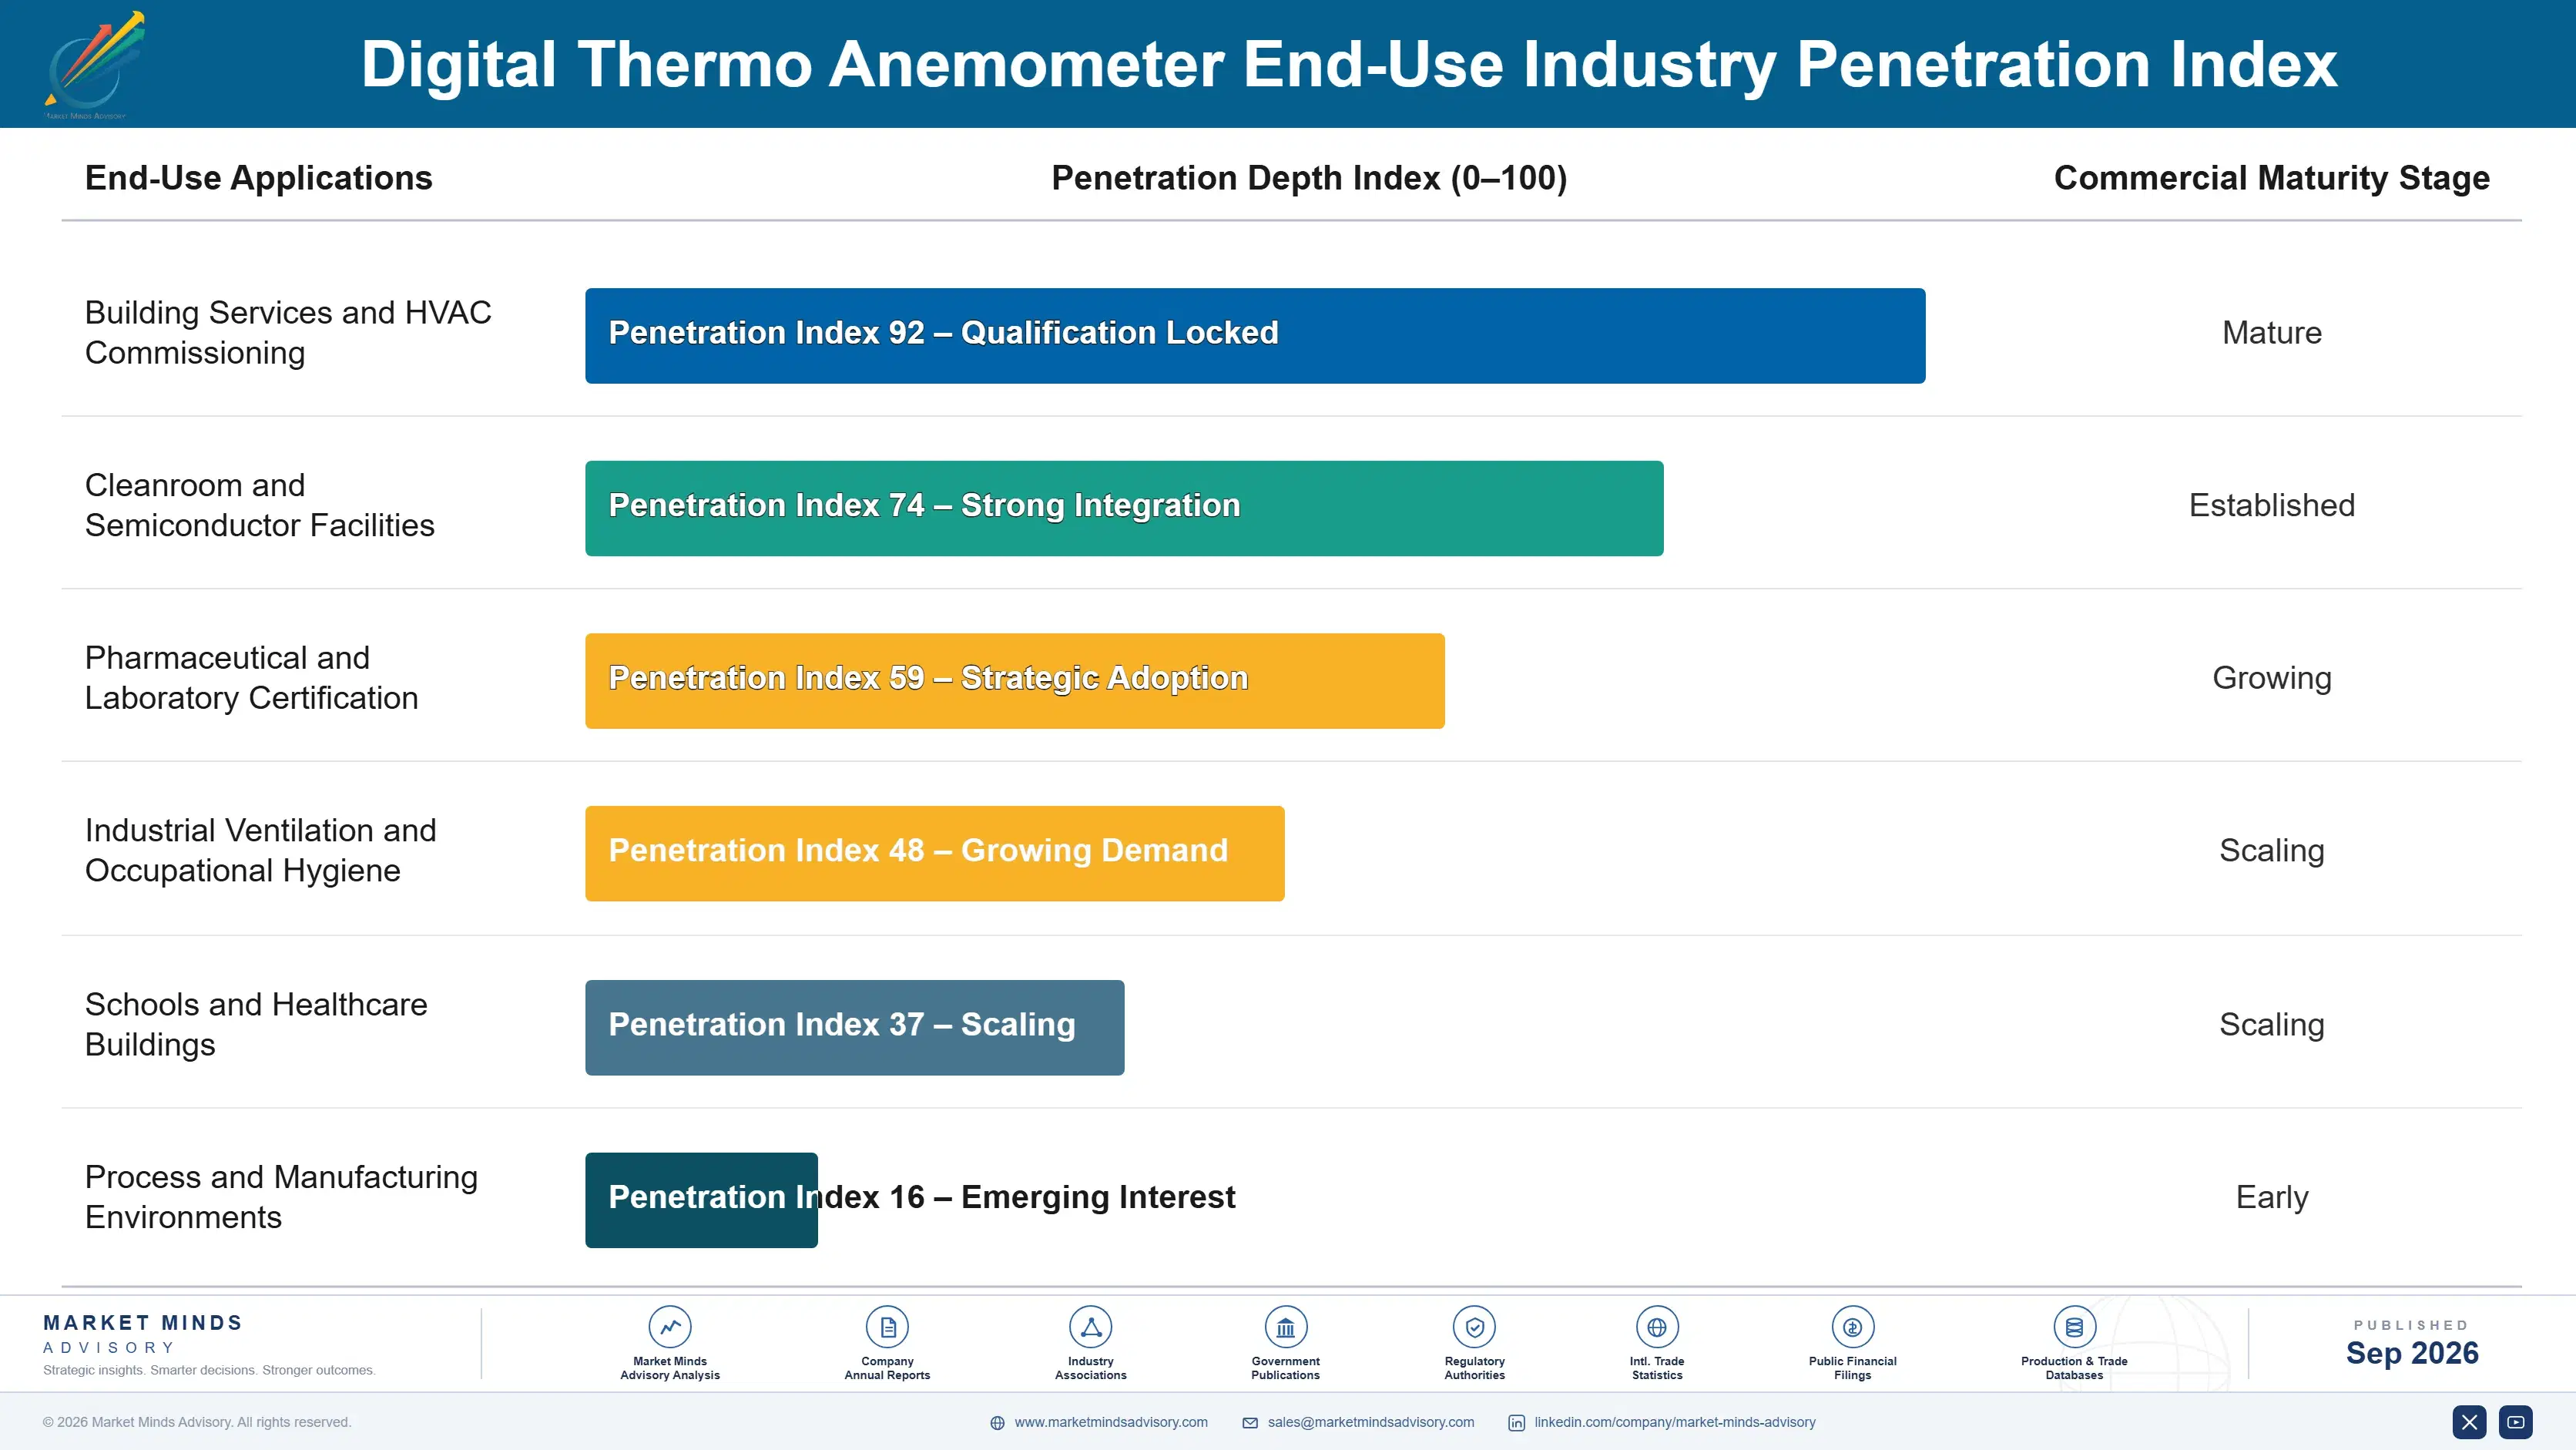
digital-thermo-anemometer-market-end-use-penetration-index-1788255429460

Where The Money Actually Recurs

These are among the four positions where our research anticipates prominent divergence between winners and laggards over the coming forecast period. Each is grounded in the demand model, the regulatory perimeter, and the announced capacity pipeline.
01 / CALIBRATION SUBSCRIPTION SELLING

Sell the certificate schedule, not the meter

Traceable recalibration every 12 months is a condition of using an instrument for any documented work at all, and across a working life those certificates total around 1.8 times the original purchase price of the device itself. Most manufacturers collect that revenue passively through service departments while customers forget, work with instruments out of calibration and eventually buy from somebody else entirely. A subscription with scheduled collection, a loan instrument and automatic certification captures money that already exists in the market.
02 / TRAVERSE METHOD GUIDANCE

Build the method into the instrument itself

A valid duct measurement needs a traverse of roughly 24 points positioned to a defined method, and the 9% spread between two competent technicians measuring the same duct is a method problem rather than any failure of sensor accuracy. An instrument that guides the operator through the correct traverse, records where each point was taken and produces a report documenting the method removes the single largest source of error present. It is firmware and interface work rather than sensor development, and nobody is competing on it.
03 / LIFETIME COST FRAMING

Compare calibration spending, not purchase prices

Ultrasonic instruments cost considerably more to purchase and carry no heated element to foul or drift, which extends calibration intervals substantially and survives dusty and humid environments that retire thermal probes early. Presented as a purchase price comparison they lose every single time, and presented against 1.8 times lifetime calibration cost they win comfortably wherever the environment is difficult. That is a spreadsheet rather than a product development programme, and the segment would grow faster than 10.8% if anybody framed it properly.
04 / FACILITIES BUYER PRODUCTS

Build for the person who arrived in 2020

Ventilation verification obligations put instruments into the hands of school, healthcare and workplace facilities teams with no measurement background whatsoever and no interest at all in acquiring one, and that buyer wants a single device answering the ventilation question rather than four instruments and a traverse method. Multi-function meters grow at 9.0% against a market rate of 7.2% serving precisely that person. Specialist manufacturers regard those instruments as compromised on every single parameter, and that customer genuinely does not care about any of it.

Engagement Snapshot From the Field

A live engagement with an industry participant carrying material or product regulatory and market exposure ahead of a defining policy shift, showing how our research translates into a defensible multi-year portfolio strategy.
MARKET MINDS ADVISORY · CLIENT ENGAGEMENT SUMMARY
Digital Thermo Anemometer Producer Strategic Portfolio Review and Transition Roadmap 2026·Investment Scenario on Digital Thermo Anemometer Exposure Evaluation 2025-26
CLIENT PROFILE
A European manufacturer of air velocity and indoor air quality instruments selling through distribution and directly to laboratory customers across eleven countries, with annual revenue in the tens of millions of euros and an installed base considerably larger than its service revenue suggested (client-reported, unverified by MMA). Instrument margins had compressed steadily against Asian competition.
STRATEGIC CHALLENGE
Distribution was pushing the client on price against cheaper imported instruments of adequate specification, and instrument margin was falling year on year with no obvious defence. Management wanted to know whether anything in the business was genuinely defensible or whether the whole category was heading toward commodity pricing. Nobody had modelled the installed base.
MMA APPROACH
MMA sized the client's installed base by instrument age and application, modelling calibration demand against what the client actually invoiced in service revenue. Forty-seven expert interviews with laboratory managers, facilities teams, building services contractors, calibration laboratories and distributors established where instruments were recalibrated and who was being paid for it.
KEY FINDINGS
  1. Modelled calibration demand across the installed base exceeded the client's service revenue by roughly 4 times, with third party laboratories capturing most of the difference.
  2. Some 34% of instruments in the field were being used past their calibration date, because nobody reminded the customer and the process was inconvenient.
  3. Instruments named in customer standard operating procedures were replaced with the same model 8 times out of 10, against far lower loyalty elsewhere.
  4. No competitor offered a calibration subscription with collection and loan instruments, despite laboratory customers repeatedly describing exactly that arrangement unprompted during the interviews.
CLIENT PROFILE
A European manufacturer of air velocity and indoor air quality instruments selling through distribution and directly to laboratory customers across eleven countries, with annual revenue in the tens of millions of euros and an installed base considerably larger than its service revenue suggested (client-reported, unverified by MMA). Instrument margins had compressed steadily against Asian competition.
STRATEGIC CHALLENGE
Distribution was pushing the client on price against cheaper imported instruments of adequate specification, and instrument margin was falling year on year with no obvious defence. Management wanted to know whether anything in the business was genuinely defensible or whether the whole category was heading toward commodity pricing. Nobody had modelled the installed base.
MMA APPROACH
MMA sized the client's installed base by instrument age and application, modelling calibration demand against what the client actually invoiced in service revenue. Forty-seven expert interviews with laboratory managers, facilities teams, building services contractors, calibration laboratories and distributors established where instruments were recalibrated and who was being paid for it.
KEY FINDINGS
  1. Modelled calibration demand across the installed base exceeded the client's service revenue by roughly 4 times, with third party laboratories capturing most of the difference.
  2. Some 34% of instruments in the field were being used past their calibration date, because nobody reminded the customer and the process was inconvenient.
  3. Instruments named in customer standard operating procedures were replaced with the same model 8 times out of 10, against far lower loyalty elsewhere.
  4. No competitor offered a calibration subscription with collection and loan instruments, despite laboratory customers repeatedly describing exactly that arrangement unprompted during the interviews.
RECOMMENDED STRATEGY
Phase 1: Phase one: launch a calibration subscription with scheduled collection, loan instruments and automatic certification, priced against the third party laboratories currently capturing it. Phase 2: Phase two: pursue inclusion in customer standard operating procedures deliberately, since that position produces a replacement loyalty that nothing else here matches. Phase 3: Phase three: stop defending instrument price against imports and accept the margin, since the recurring revenue behind each unit is worth considerably more.
OUTCOME
Within five quarters service revenue had roughly doubled and the subscription covered a meaningful share of the laboratory installed base (client-reported, unverified by MMA). Instrument margin continued to compress as expected. Total contribution rose despite that, for the first time in four years. The subscription is being extended to building services customers.

Frequently Asked Questions

Foundational context covering the market sizes, CAGR, scope, country, region and competition that inform every finding below. This section is provided to cover basics and most often pre-purchase conversations, answered from the MMA Primary Research Dataset.

What is the current size of the Digital Thermo Anemometer Market?

The global digital thermo anemometer market was valued at USD 0.5 billion in 2025, covering portable and fixed air velocity instruments with associated calibration. The 2026 figure reaches USD 0.54 billion.

How large will the Digital Thermo Anemometer Market be by 2036?

MMA forecasts USD 1.08 billion by 2036, an increase of USD 0.54 billion over the 2026 base. That represents an expansion multiple of 2.00 times across the forecast period.

What is the CAGR for the Digital Thermo Anemometer Market 2026 to 2036?

The base case compound annual growth rate is 7.2%, with a bull case at 8.4% and a bear case at 6.0%. Historical growth between 2020 and 2025 ran at 6.0%.

Which segment is growing fastest?

Ultrasonic time-of-flight anemometers grow at 10.8%, half again the market rate of 7.2%, because no heated element means no drift. Multi-function air quality meters follow at 9.0%.

Who are the major companies in the Digital Thermo Anemometer Market?

TSI Incorporated, Testo, Fluke, Kanomax and Extech lead on units shipped into professional use, with combined CR5 of 51%. Laboratory and building services buyers are served by different manufacturers.

Which country is growing fastest?

India grows fastest at 9.4%, on commercial construction commissioning alongside pharmaceutical and electronics cleanroom expansion happening together. South Asia and Pacific leads regionally at 9.4%.

Report Segmentation Architecture

The full report scope spans multiple orthogonal segmentation dimensions, with cross-tabulated demand data provided for each dimension pair. Coverage extends further to regional breakdowns, trend trajectories, and the competitive detail needed to support segment-level decision-making.

By Sensing Technology

  • Hot-Wire Thermal Anemometers
  • Rotating Vane Anemometers
  • Ultrasonic Time-of-Flight Anemometers
  • Fixed Duct-Mounted Transmitters
  • Multi-Function Indoor Air Quality Meters
  • Pitot and Differential Pressure Instruments

By End-Use Industry

  • Building Services and HVAC Commissioning
  • Cleanroom and Semiconductor Facilities
  • Pharmaceutical and Laboratory Certification
  • Industrial Ventilation and Occupational Hygiene
  • Schools and Healthcare Buildings
  • Process and Manufacturing Environments

By Commercial Dimension

  • Industrial Distribution Channels
  • Direct Laboratory Supply
  • Calibration Service Subscriptions
  • Rental and Loan Programmes
  • Online and Catalogue Sales
  • Building Systems Integration

By Region

  • North America
  • Western Europe
  • East Asia
  • South Asia and Pacific
  • Latin America
  • Middle East and Africa
  • Eastern Europe

Scope, Methodology, and Coverage

Every figure in this report is reproducible from documented input assumptions. The scope below maps the historical period, the forecast horizon, the segmentation dimensions, and the countries covered, alongside the underlying primary and qualitative methodology.
Historical Period
2020 to 2025
Forecast Period
2026 to 2036
Base Year
2025 (USD billions; MMA Primary Research Dataset, September 2026)
Market Definition
The digital thermo anemometer market covers portable and fixed instruments that measure air velocity together with temperature for ventilation, process and environmental applications, spanning hot-wire thermal anemometers, rotating vane anemometers, ultrasonic time-of-flight anemometers, fixed duct-mounted transmitters, multi-function indoor air quality meters, and pitot and differential pressure instruments. Scope covers units shipped into professional use together with associated calibration services. Excluded are laboratory reference standards and wind tunnels, meteorological weather stations, particle counters and gas analysers sold separately, building management control systems, and process flow meters for liquids.
Quantitative Units
USD billion, 2025 base year, 2026 to 2036 forecast period
Segmentation Dimensions
Sensing technology, end-use application, commercial channel, region
Regions Covered
North America, Western Europe, East Asia, South Asia and Pacific, Latin America, Middle East and Africa, Eastern Europe
Countries Covered
United States, Canada, Germany, United Kingdom, France, Switzerland, Italy, Poland, China, Japan, South Korea, India, Australia, Brazil, Mexico, Saudi Arabia, United Arab Emirates, South Africa
Key Companies Profiled
20 companies across instrument manufacturers, sensor specialists and calibration providers
Quantitative Methodology
Primary survey, n=3,800 respondents, Q4 2025, six countries; demand-side model with trade association cross-validation
Qualitative Methodology
47 expert interviews, Q4 2025; applied to validate demand model assumptions, identify emerging dynamics, and assess competitive positioning
Report Format
PDF and XLSX data workbook (Word format preview document)
Publisher
Market Minds Advisory
Report Code
MMA-2026-TEC-591
Published
September 2026
Contact
sales@marketmindsadvisory.com | www.marketmindsadvisory.com

Purchase the full Digital Thermo Anemometer Market Report (2026 to 2036).

The full MMA report on the digital thermo anemometer market runs to detailed technology and regional models across the 2026 to 2036 forecast period, with lifetime cost benchmarks combining purchase price and recurring calibration spending. It profiles 20 companies on a consistent units shipped basis, covering instrument manufacturers, sensor specialists and calibration providers. Laboratory and building services demand are modelled separately, since the two buy through entirely different channels. Regional chapters cover the seven MMA regions with country-level detail on the eighteen markets surveyed. Primary research draws on a quantitative survey of 3,800 respondents across six countries and 47 expert interviews conducted in Q4 2025.
Lifetime cost benchmarks combining purchase price and calibration spending
Laboratory and building services demand modelled through separate channels
Calibration revenue sized against installed base by instrument age
Twenty company profiles on consistent units shipped basis
Ventilation verification requirements tracked across surveyed national jurisdictions
Seven regional chapters with eighteen country detail tables

Built For The People Who Decide

From boardroom strategy to bench-side execution, this report is read cover-to-cover by leaders shaping the next decade of their industry, turning demand scenarios, market dynamics and valuation benchmarks into decisions.
CXOs/ Presidents/ VPs/ Managers
M&A and Corporate Development
Strategy Teams and R&D Heads
Procurement and Product Directors
Regulatory and Compliance Leaders
Investor Relations and Equity Analysts