Market Minds Advisory
Digital Therapeutics and Wellness Market

Digital Therapeutics and Wellness Market: Digital Therapeutics and Wellness Market: Intervention Classes, Reimbursement Routes and Payment Economics 2026 to 2036

The companies that ran clinical trials and won regulatory clearance went bankrupt. The companies that sold meditation subscriptions did not. That gap is what this market has spent five years learning about.

Lead Analyst

Published

September 2026

Make Smarter Decisions with Customized Research Insights

Request a free sample report and evaluate market opportunities, growth trends, and competitive dynamics relevant to your business needs.

2025 MARKET VALUE$6.8BMarket Size 2025
2036 FORECAST VALUE$32.9BBase Case , 2026 to 2036
CAGR 2026 TO 203615.4 %Bull 16.6% / Bear 14.0%
INCREMENTAL OPPORTUNITY$25.0BNet 10- year value creation
EXPANSION MULTIPLE4.19x2036 value over 2026 base
Strategic Levers
M&A Pipeline
Regional Outlook
Country Rankings
Competitive Intelligence
Segmental Deep-dive
Call-Us : 91 93563 13602

Executive Snapshot and Market Trajectory.

Digital therapeutics proved the clinical case and lost the commercial one. Pear and Akili both cleared regulators, published trials and ran out of money because nobody would pay for the prescription. Everything that has worked since avoided that route deliberately, and the industry knows exactly why it had to.
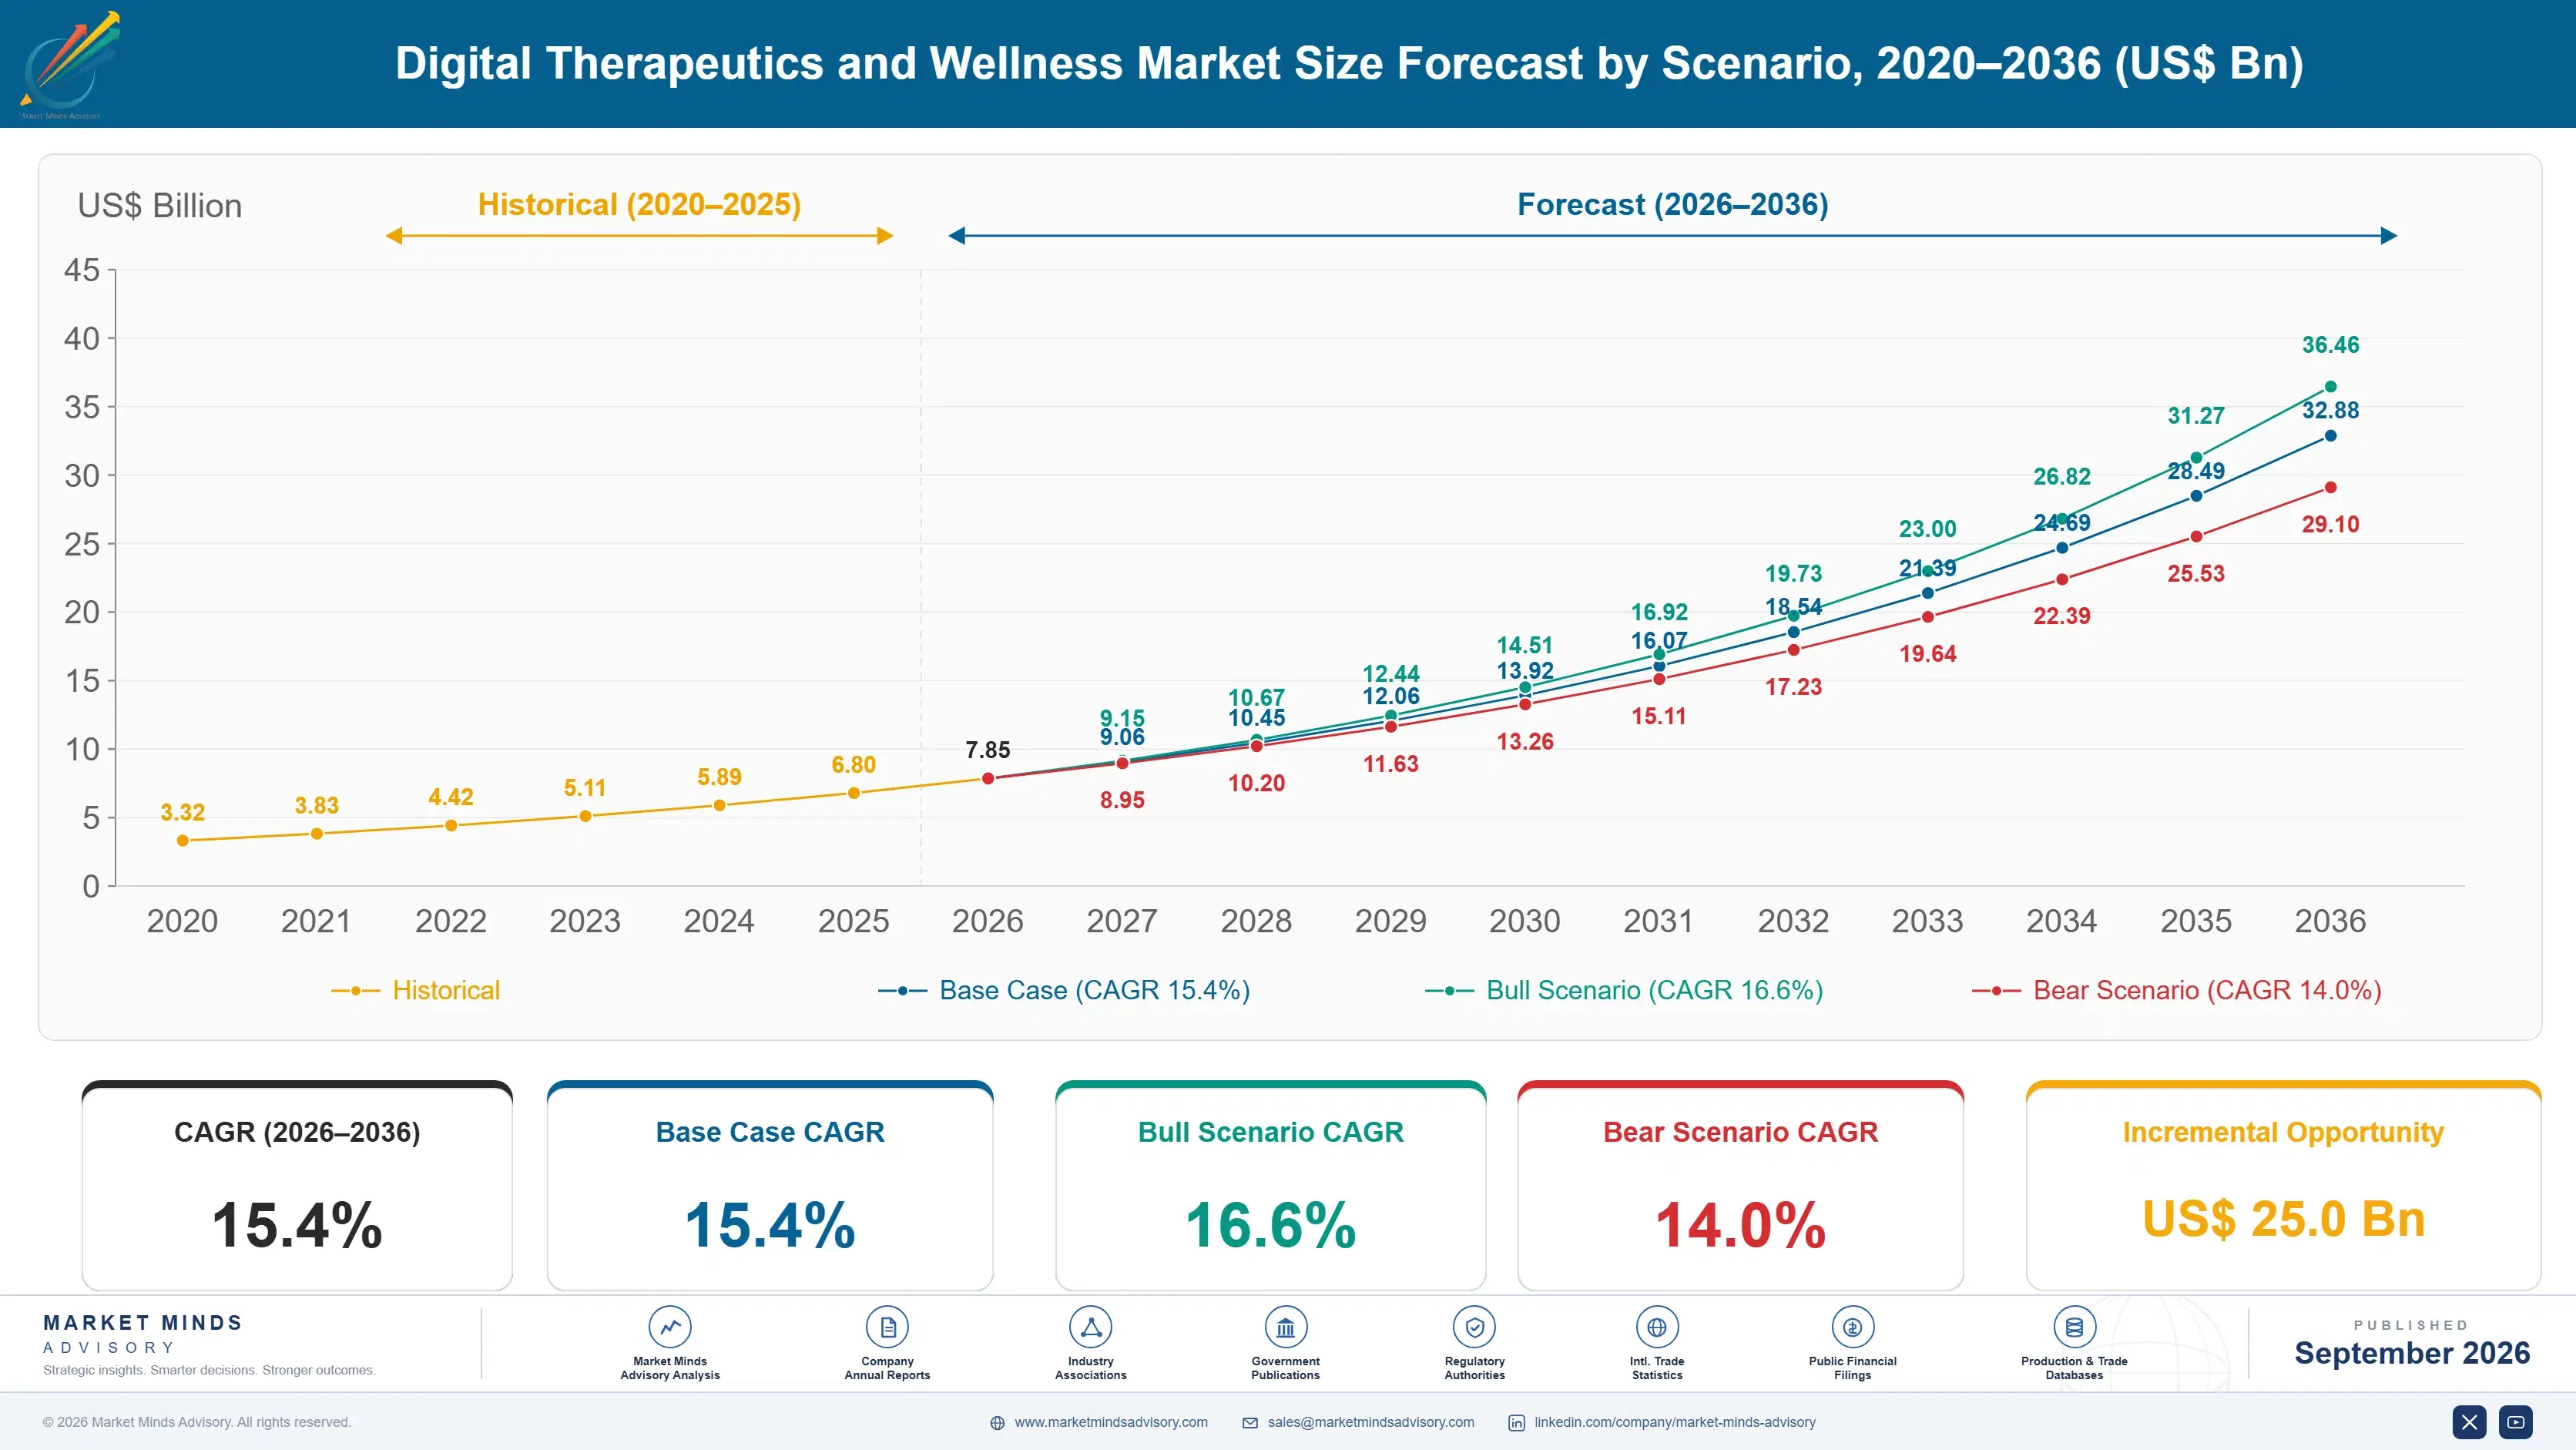
The market reaches USD 7.85 billion in 2026 and USD 32.88 billion by 2036, a 4.19 times expansion at 15.4%. Reimbursed non-prescription therapeutics grow at 23.1%, half again the market rate of 15.4%, because Germany built a statutory listing route that actually pays. Western Europe holds 30% of revenue on that mechanism alone, and Germany grows at 19.8% against a regional average well below it. No other jurisdiction has copied it properly.
Five companies hold 16% of subscription and reimbursed programme revenue, the most fragmented concentration in healthcare technology and a direct result of an app store with no barrier to entry. Teladoc leads on scale that was acquired rather than built. Hinge Health and Omada sell to employers and payers. Calm and Headspace sell to consumers who churn at 63% a year and keep buying anyway.
Market Definition
This report covers software-delivered therapeutic and wellness interventions sold on subscription or reimbursed by a payer: prescription digital therapeutics, reimbursed non-prescription therapeutics, chronic disease management programmes, behavioural health and mental wellness applications, employer and payer wellness platforms, and consumer wellness and lifestyle applications. It excludes telehealth consultation services, electronic health record and clinical workflow software, connected medical devices and diagnostics, and pharmaceutical products delivered alongside software.
Base Year Value
$6.8B in 2025 (MMA Primary Research Dataset, September 2026)
Forecast Period
2026 to 2036, eleven discrete annual values
CAGR
15.4% base case. Bull 16.6%. Bear 14.0%.
Fastest Growth Segment
Reimbursed Non-Prescription Therapeutics: 23.1% CAGR
Fastest Growth Country
Germany: 19.8% CAGR
Fastest Growth Region
South Asia and Pacific: 17.4% CAGR
Largest Region
Western Europe: 30% of 2025 global value
Market Leaders
Teladoc Health, Hinge Health, Omada Health, Calm and Headspace lead on subscription and reimbursed programme revenue. Source: MMA Analysis.
Primary Survey
n=3,800 procurement and R&D decision-makers, Q4 2025, six countries
Methodology
Demand-side build-up, cross-validated against public data, 47 expert interviews

Digital Therapeutics and Wellness Market Forecast Scenarios

digital-therapeutics-and-wellness-market-size-forecast-scenario-1789986959285
Between 2020 and 2025 the category compounded at 13.9% and the shape of it changed completely. The pandemic funded everything briefly, then the reckoning arrived: Pear Therapeutics filed for bankruptcy in 2023 having cleared three products through the regulator, and Akili followed. Both had the evidence and neither had a payer willing to reimburse at scale.
The base case holds 15.4% on three mechanisms. German statutory listing pays a defined quarterly rate for products that clear an evidence threshold, the only route anywhere converting clinical proof into predictable revenue, and it compounds the reimbursed segment at 23.1%. Employer and payer chronic disease programmes keep expanding because they are bought on measured medical cost reduction rather than on wellbeing claims. And consumer subscription volume keeps rising despite churn running 63%, because acquisition costs less than churn does.
The bull case at 16.6% assumes France, Belgium and others build reimbursement routes that work as German listing does, which would give the regulated segment a market rather than a pathway. The bear case at 14.0% is German pricing pressure: the statutory rate has already been negotiated downward once, and a route that pays less than development costs is not a route at all.

Evidence Was Never The Problem

The clinical question in this market was settled some years ago. Randomised trials showed software interventions producing measurable improvement in insomnia, substance use, anxiety and glycaemic control, published in journals nobody disputes. Pear Therapeutics cleared three products through the American regulator on that evidence. It filed for bankruptcy in 2023 anyway, because clearance and reimbursement turned out to be entirely separate problems.
TOP FIVE CONCENTRATION16%The most fragmented category in healthcare technology anywhere
PROGRAMME COMPLETION RATE31%Enrolled users finishing a full therapeutic intervention course
GERMAN REIMBURSEMENT PRICEEUR 218Average quarterly rate paid under the statutory listing route
REGULATORY CLEARANCE TIMELINE22 monthsTrial start to market authorisation for prescription grade products
PAYER CONTRACT CYCLE14 monthsEvaluation to signature at large health plan customers
CONSUMER SUBSCRIPTION CHURN63%Annual attrition across direct paid wellness application users
Germany did the one thing that fixes it. The statutory listing route places qualifying products on a national schedule at a defined quarterly rate, which any doctor can prescribe and the sickness funds must pay. That converts an evidence threshold into revenue without a negotiation, and it is the reason a German company can build a business on clinical proof while an American one could not. France and Belgium have begun copying it.
Everywhere else the money comes from avoiding the regulator entirely. Consumer wellness applications make no therapeutic claim, need no clearance and churn 63% of subscribers a year while still growing, because acquisition is cheap. Employer programmes sell on measured medical cost rather than on any clinical label. Both work commercially and neither required a trial.
"The founders who did this properly, ran the trials and got the clearances, are the ones who went out of business. Everybody left in this market either found a country that pays by statute or stopped making medical claims altogether."
Director, Digital Health and Care Delivery Practice · MMA Healthcare Practice · September 2026

Market Trends

German Statutory Listing Made Clinical Evidence Bankable

The German fast-track listing route places a qualifying product on a national schedule at a defined quarterly rate, which any physician can prescribe and the statutory sickness funds are obliged to pay. That is the only mechanism anywhere that converts a clinical evidence threshold directly into predictable revenue without negotiating with each payer separately. Around EUR 218 per quarter is a modest figure against pharmaceutical pricing and an enormous one against nothing at all, which is what the American route delivered. Reimbursed non-prescription therapeutics compound at 23.1% against 15.4% for the market on this single policy instrument.
Market Impact: Applications compound at 16.8% yearly
Employers Buy Medical Cost Reduction, Not Wellbeing

The wellness programmes that survived employer procurement are the ones that stopped talking about wellbeing and started reporting avoided claims. A musculoskeletal programme that keeps someone out of surgery, or a diabetes programme that reduces medication spend, produces a number a benefits director can defend to finance. Engagement metrics never did. Chronic disease management programmes compound at 19.2% on exactly that reframing, and the vendors who made it are the ones now large enough to reach public markets. Everybody still selling step counts to employers is competing for a budget that has moved.
Market Impact: Churn at 63% still works

Market Opportunities and Growth Drivers

Behavioural Health Waiting Lists Have No Other Answer

Waiting times for talking therapy run months across most public health systems and years in some regions, and there are not enough clinicians to fix it at any budget anybody will approve. A software intervention with published trial evidence is not as good as a therapist and is available immediately, which is the comparison actually being made. That argument works with health systems, employers and consumers simultaneously, which almost nothing else in this market does. Behavioural health applications compound at 16.8% and the constraint is clinical oversight capacity rather than demand. Nobody argues with the waiting list figures.
Market Impact: Killed 2 cleared product companies

Consumer Subscriptions Work Despite Terrible Retention

Annual churn across paid consumer wellness applications runs about 63%, which would destroy most subscription businesses and does not destroy this one. The reason is that acquisition costs less than the lifetime value even at that attrition, and the addressable population is effectively everybody rather than a diagnosed cohort. Calm and Headspace built substantial businesses on a category that makes no therapeutic claim and needs no clearance. The economics are unglamorous and they are also the only part of this market that has been consistently profitable for a decade. That fact deserves more attention than it gets.
Market Impact: Completion sits at 31%

Market Restraints and Challenges

American Reimbursement Never Arrived For Prescription Products

Regulatory clearance in the United States conferred permission to market and nothing about payment, and prescription digital therapeutics spent a decade discovering that distinction. The root cause is that no benefit category existed to bill against, so every product required individual negotiation with every plan on an evidence standard nobody had defined. Commercially this killed the two best-funded companies in the field, Pear and Akili, despite cleared products and published trials. Mitigation runs through the German statutory route and through employer channels, both of which bypass the American payer entirely rather than solving it.
Market Impact: Pays EUR 218 per quarter

Programme Completion Rates Undermine Every Outcome Claim

Roughly 31% of enrolled users complete a full therapeutic course, which is considerably better than most digital products and considerably worse than any clinical trial protocol assumed. The root cause is that a trial pays and reminds participants while real deployment does neither, so effect sizes measured under supervision do not survive contact with ordinary life. Commercially this makes outcome guarantees difficult to underwrite and gives sceptical payers a defensible reason to decline. Mitigation runs through human coaching alongside the software, which works measurably and destroys the margin that made software attractive.
Market Impact: Programmes compound at 19.2% annually
4 additional market trends, 3 additional growth drivers, and 2 additional restraints and challenges are covered in the full report. Contact sales@marketmindsadvisory.com to access the complete intelligence.

Segment CAGR and Growth Architecture

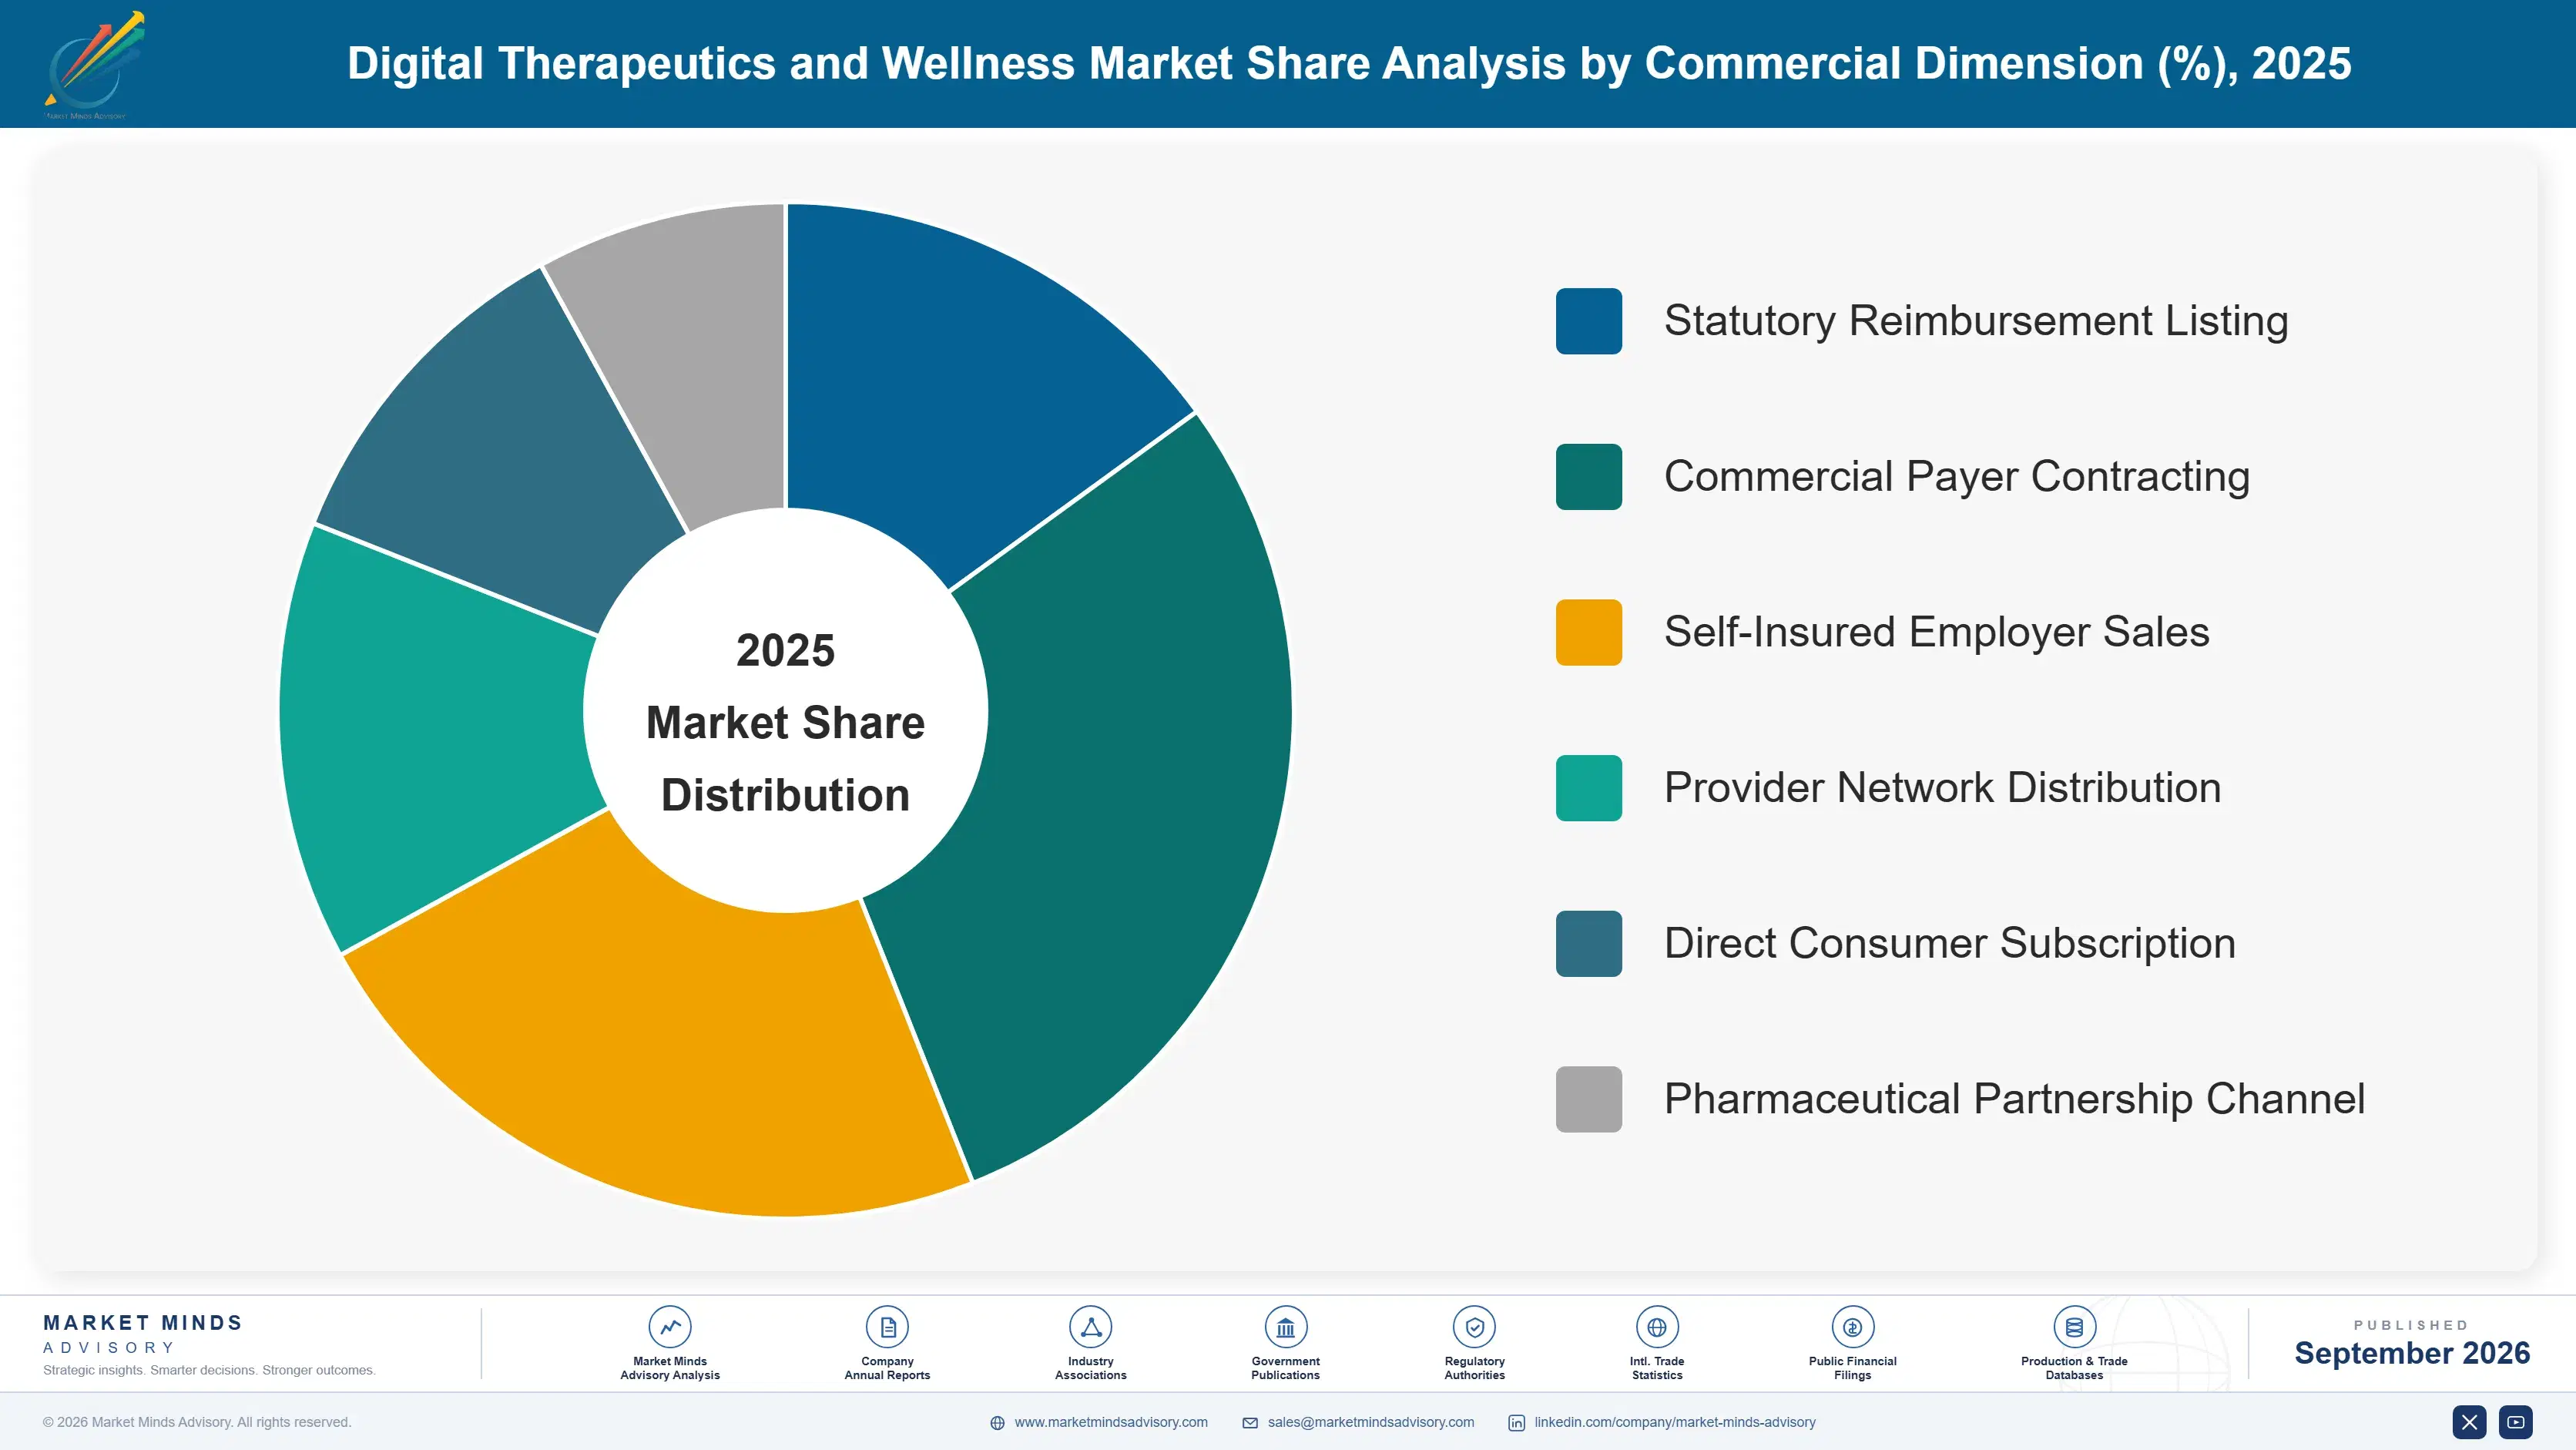
Segmentation follows regulatory and payment standing, since how a product gets paid for determines almost everything about who builds it and what it can claim. Six classes cover the market: reimbursed non-prescription therapeutics, chronic disease management programmes, behavioural health applications, employer and payer wellness platforms, consumer wellness applications, and prescription digital therapeutics. Clinical area and distribution channel are separate dimensions.
digital-therapeutics-and-wellness-market-market-share-analysis-1789986959824

Reimbursed Non-Prescription Therapeutics

Reimbursed non-prescription therapeutics grow at 23.1%, half again the market rate of 15.4%, and one country's policy created the entire segment. German statutory listing places qualifying products on a national schedule at around EUR 218 per quarter, prescribable by any physician and payable by the sickness funds without negotiation. That converts an evidence threshold directly into revenue, which is what American clearance conspicuously failed to do. France and Belgium have begun building comparable routes and the design details matter enormously, since a rate negotiated too low is indistinguishable from no route at all. German pricing has already been pushed downward once, which every company in this segment watched extremely closely.
CAGR 23.1%

Chronic Disease Management Programmes

Chronic disease management programmes grow at 19.2% and succeeded by changing what they measured. A programme selling engagement and wellbeing to a benefits director had nothing that finance would accept; a programme reporting avoided surgeries, reduced medication spend or fewer emergency presentations produces a number that survives a budget review. Musculoskeletal and metabolic programmes led that shift and are now the largest companies in this market by revenue. The cost is that outcome-based contracting exposes a vendor to completion rates running around 31%, which means human coaching sits alongside the software and consumes the margin that made software attractive in the first place. Very few vendors talk about that publicly.
CAGR 19.2%
Full segment breakdown across 6 segments available in the complete report.

Regional Architecture and Country Demand Map

Western Europe leads at 30%, above the standard band, because Germany built the only statutory reimbursement route in the world that reliably pays for digital therapeutics. North America has the largest user base and the worst payment mechanism, which is the tension running through this section.

Western Europe

Western Europe holds 30% of revenue, above the 26% band ceiling, and a single German policy instrument explains most of it. The statutory listing route places qualifying products on a national schedule at a defined quarterly rate that sickness funds must pay, which converts clinical evidence into revenue without negotiating plan by plan. Germany grows at 19.8%, far ahead of the regional average, because the rest of Western Europe has no equivalent mechanism yet. France and Belgium are building comparable routes and British adoption runs through health service procurement instead, which is slower and considerably less predictable. Nothing outside Europe works remotely like this, and the design details matter more than anybody expected.
Share: 30% | CAGR: 14.0% (2026 to 2036)

North America

Employer and consumer channels rather than any payer mechanism account for North America's 28%. The United States has the largest addressable population and the worst payment route, since regulatory clearance conferred permission to market and nothing about reimbursement, which is precisely what bankrupted Pear and Akili. Self-insured employers became the workaround: they carry medical cost directly and will buy a programme that reduces it, which turned benefits departments into the effective payer for digital health. Hinge Health, Omada and Sword all built on that channel. Growth at 14.4% sits below the global rate despite the population, which tells the whole story. Nobody has yet fixed the underlying payment problem at all.
Share: 28% | CAGR: 14.4% (2026 to 2036)
Regional intelligence for 5 additional markets available in the complete report: East Asia, South Asia and Pacific, Latin America, Middle East and Africa, Eastern Europe. Contact sales@marketmindsadvisory.com.
digital-therapeutics-and-wellness-market-country-cagr-analysis-1789986960364

How To Actually Get Paid

The clinical argument in this market was won and the payment argument was lost, repeatedly and expensively. What separates a company that survives from one that does not is whether it found a mechanism that pays without a negotiation, and whether it measures something a finance department will accept. The levers below address both.

Build For The German Listing Route First

German statutory listing is the only mechanism anywhere that converts a clinical evidence threshold directly into revenue, paying around EUR 218 per quarter for a product any physician can prescribe and the sickness funds must cover. That removes the payer-by-payer negotiation that consumed a decade and two well-funded American companies. Reimbursed non-prescription therapeutics compound at 23.1% against 15.4% for the market entirely because of it. Designing a trial and a product around German listing requirements from the outset costs less than retrofitting an American product, and France and Belgium are building comparable routes on similar principles.
Market Impact: Statutory listing pays EUR 218 without any negotiation

Report Avoided Claims, Not Engagement Metrics

A benefits director cannot defend an engagement statistic to a finance department and can defend an avoided surgery. Chronic disease management programmes compound at 19.2% precisely because the vendors reframed the sale around measured medical cost rather than around wellbeing, and the largest companies in this market are the ones who made that switch earliest. The requirement is claims data access and an analytics capability most wellness vendors never built. It also exposes the vendor to completion rates around 31%, which is why outcome-based contracts need pricing that reflects who actually finishes.
Market Impact: Chronic programmes compound at 19.2% against 15.4% overall

Sell To Self-Insured Employers Rather Than Plans

American health plans have no benefit category to bill digital therapeutics against and no incentive to create one, which is what killed the prescription route. Self-insured employers carry medical cost on their own balance sheet, so a programme that reduces it pays for itself without any coding question arising at all. Payer contract cycles run about 14 months and employer ones run considerably shorter. Hinge Health, Omada and Sword built substantial businesses on that channel while the prescription companies were still negotiating with plans, and the difference in outcome was total.
Market Impact: Avoids the 14 month payer contract cycle entirely

Price Consumer Products Against Sixty Percent Churn

Annual churn across paid consumer wellness applications runs about 63%, which is a fact rather than a failure and should be priced as one. Companies that built around it, acquiring cheaply and accepting short lifetimes, have been consistently profitable for a decade while the clinically rigorous ones went bankrupt. Retention improvement programmes in this category have generally cost more than the churn they prevented. The commercial discipline is to treat acquisition efficiency as the whole business and to stop funding engagement features that measurably do not change the number. Very few boards want to hear that.
Market Impact: Churn at 63% has to be priced in

Who Controls the Margin Pool

Five companies hold 16% of subscription and reimbursed programme revenue, the most fragmented concentration in healthcare technology and a direct consequence of distribution through app stores that impose no barrier at all. Teladoc leads on scale assembled through acquisition rather than built. Hinge Health and Omada sell chronic care to employers and payers. Calm and Headspace sell consumer subscriptions and make no clinical claim. All participants are assessed on subscription and reimbursed programme revenue.
Competition barely exists between the segments, which is unusual and reflects how differently each one gets paid. Reimbursed products compete on evidence thresholds set by a regulator. Employer programmes compete on measured medical cost and claims analytics. Consumer applications compete on acquisition efficiency and brand. A company that is excellent at one of these is generally hopeless at the others, and several have proved it.

Rankings shift with policy rather than with product. Whether France, Belgium and others build reimbursement routes that pay properly decides which companies exist in five years, and nothing a vendor does affects it. The other pressure is consolidation among employer programme vendors, where scale in claims analytics and clinical staffing is now deciding contracts more than any software difference does.
digital-therapeutics-and-wellness-market-company-positioning-matrix-1789986960891

Competitive Moat and Risk Dimensions

TELADOC HEALTH

Moat: Payer Contract Incumbency

Teladoc holds contracts with a very large share of American health plans and self-insured employers, accumulated through acquisition and through the telehealth relationship that preceded the chronic care business. Payer contract cycles run about 14 months, so an incumbent selling a second programme into an existing agreement moves far faster than a competitor starting from nothing.
TELADOC HEALTH

Risk: Acquired Rather Than Built

The portfolio was assembled by acquisition and the integration has been visibly difficult, which shows in product coherence and in how customers describe the experience. Specialists focused on a single condition ship faster and report cleaner outcomes to a benefits director. Breadth wins the renewal conversation and loses the competitive evaluation where a buyer compares programmes condition by condition.
HINGE HEALTH

Moat: Measured Cost Reduction Evidence

Hinge Health built its case on avoided musculoskeletal surgery and reduced claims spend rather than on engagement, which is the only argument a finance department accepts. Musculoskeletal cost is among the largest lines a self-insured employer carries, so the saving is both large and easy to attribute. That evidence base took years of claims analysis to assemble.
HINGE HEALTH

Risk: Single Condition Concentration

The business rests almost entirely on musculoskeletal care, which is a large cost line and a single one, and an employer consolidating vendors will prefer a supplier covering several conditions. Human coaching alongside the software also consumes margin that a pure software business would keep, and completion rates around 31% mean that cost scales with enrolment rather than with results.

Players Tracked

Prominent Players

Teladoc Health
Hinge Health
Omada Health
Calm
Headspace

Other Key Players

Sword Health
Virta Health
Noom
Dario Health
Lark Health
Big Health
Kaia Health
Click Therapeutics
Pelago
Sidekick Health
CureApp
Ada Health
HelloBetter
Selfapy
WELT

Recent Developments

MAY 2025

Hinge Health Completes Initial Public Offering On Employer Growth

Hinge Health completed an initial public offering, a capital markets event rather than an acquisition. The listing followed several years of growth built on self-insured employer contracts sold against avoided musculoskeletal surgery rather than engagement, and it gave the employer channel a public valuation benchmark the prescription route never achieved.
Signal: The employer channel produced the exits that the regulated prescription route has consistently failed to produce.
OCTOBER 2024

CureApp Extends Reimbursed Digital Therapeutic Range In Japan

CureApp extended its range of digital therapeutics reimbursed under Japanese national health insurance, an organic product development rather than a transaction. Japan operates one of very few working prescription reimbursement routes anywhere, and the company built a durable business on a mechanism most markets never created.
Signal: Where a statutory route exists the clinical model works, and where it does not the model fails.
MARCH 2025

Teladoc Restructures Chronic Care Portfolio After Integration Difficulties

Teladoc Health restructured its chronic care portfolio following integration difficulties across acquired product lines, an internal reorganisation rather than a divestment or acquisition. The work addresses product coherence problems that specialist competitors have exploited in employer evaluations, where buyers compare programmes condition by condition rather than as a bundle.
Signal: Buying scale in this market is straightforward and integrating it has defeated almost everybody who tried.

What These Programmes Cost To Run

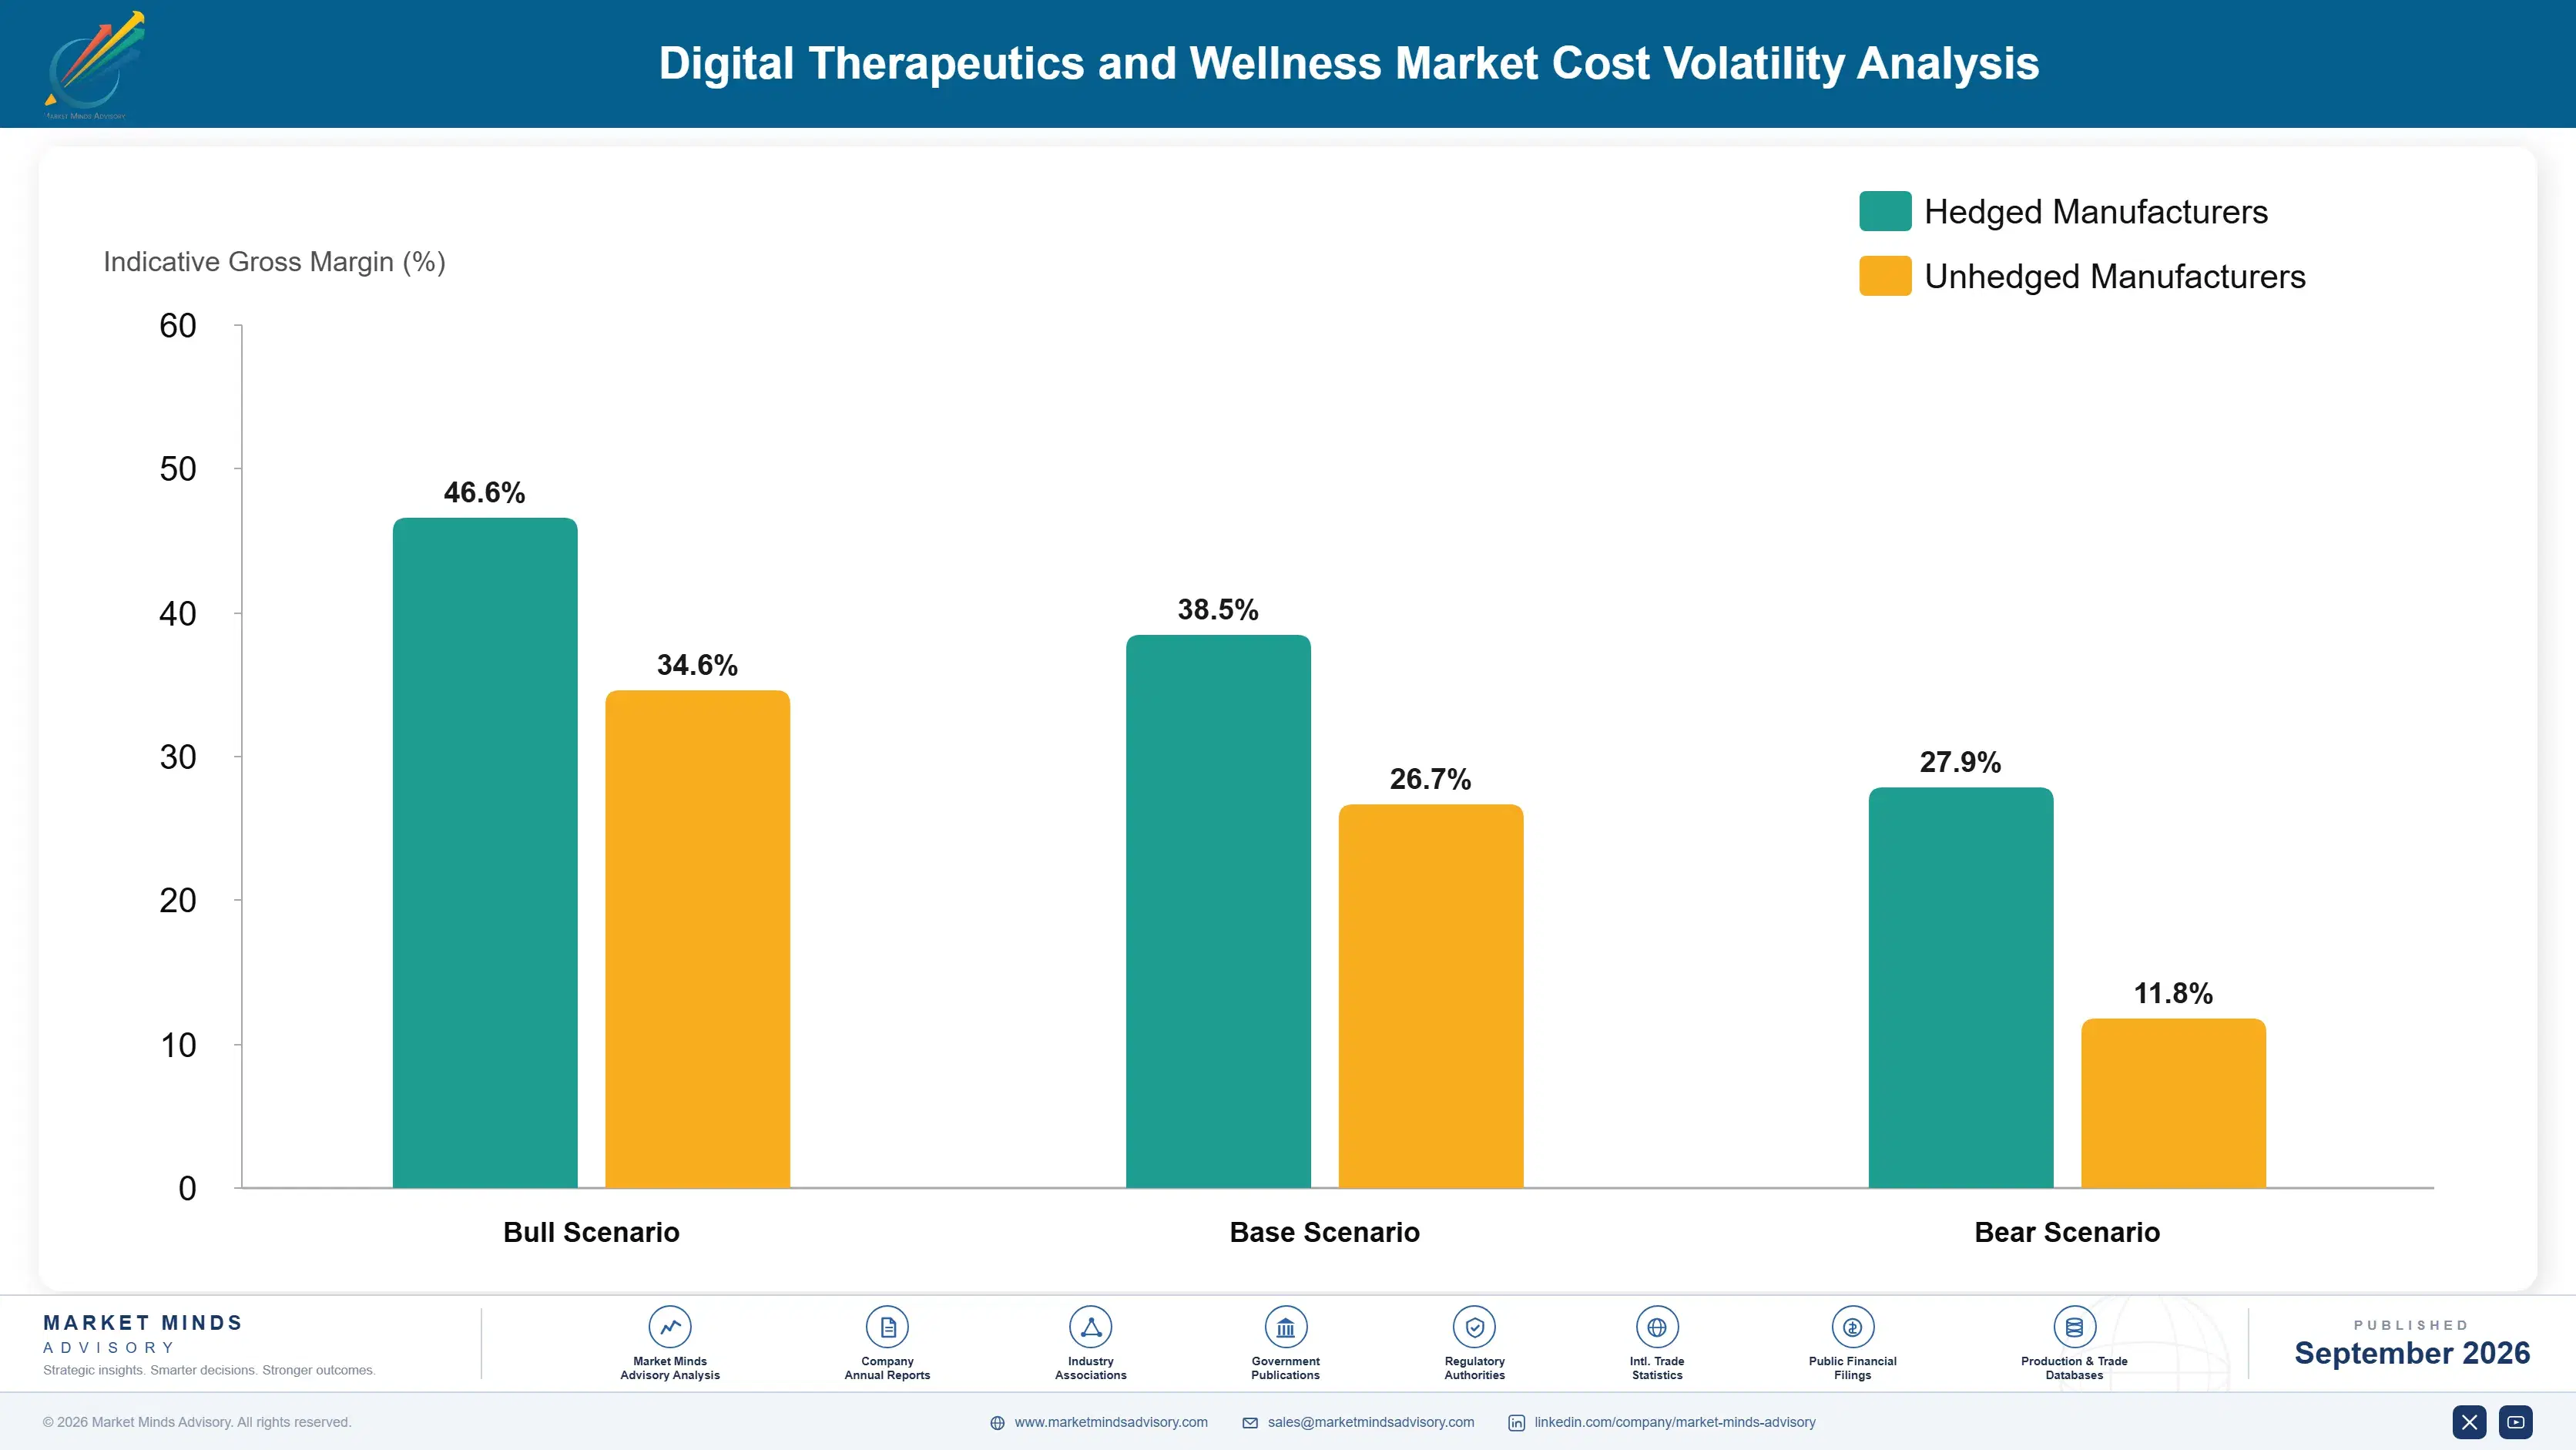
Clinical coaching and care staff account for roughly 39% of programme cost across employer and payer offerings, which is what separates a software business from a service one. Engineering and product headcount adds about 24%. Clinical evidence generation, meaning trials, publication and regulatory work, carries around 17% for products pursuing a reimbursed route, and acquisition spending takes the balance.
Teladoc Health Annual Report 2024 records clinical staffing and technology development as the dominant cost variables across its chronic care operations. Omada Health disclosures describe a comparable structure with a heavier coaching weighting. Clinical coaching capacity became genuinely scarce through 2023 and 2024 as multiple vendors scaled employer programmes simultaneously and competed for the same registered dietitians, physiotherapists and behavioural coaches, raising delivery cost precisely as outcome-based contracts tightened.

The competitive disadvantage mechanism is coaching intensity rather than any input price. A programme requiring substantial human contact scales its cost with enrolment, while completion rates around 31% mean a large part of that cost produces no outcome to bill against. Vendors who reduced coaching to improve margin measured worse results and lost outcome-based contracts. Nobody has resolved it, and the ones claiming to have generally changed what they measure.
digital-therapeutics-and-wellness-market-cost-volatility-analysis-1789986961089

Match Coaching Intensity To Measured Completion Likelihood

Clinical coaching runs about 39% of programme cost and scales with enrolment rather than with results, while only around 31% of enrolled users complete a course. Concentrating human contact on the users most likely to finish, identified from early engagement patterns, cuts delivery cost without touching measured outcomes. The analytics work is modest and most vendors have not attempted it.

Train Coaching Staff Rather Than Competing For Them

Registered dietitians, physiotherapists and behavioural coaches became genuinely scarce through 2023 as multiple vendors scaled employer programmes at once, and bidding for the same people raised everybody's cost without adding anyone to the workforce. Training from adjacent allied health backgrounds takes months and produces staff who stay considerably longer. The constraint is supervision capacity during that period.

Design Trials Once For Multiple Reimbursement Routes

Clinical evidence generation carries around 17% of cost for products pursuing a reimbursed route, and most companies design a trial for one jurisdiction and then repeat it for the next. Building the protocol to satisfy German listing requirements and the emerging French and Belgian ones simultaneously costs marginally more and avoids repeating the largest single expense in the category.

Portfolio Architecture for Margin Defence

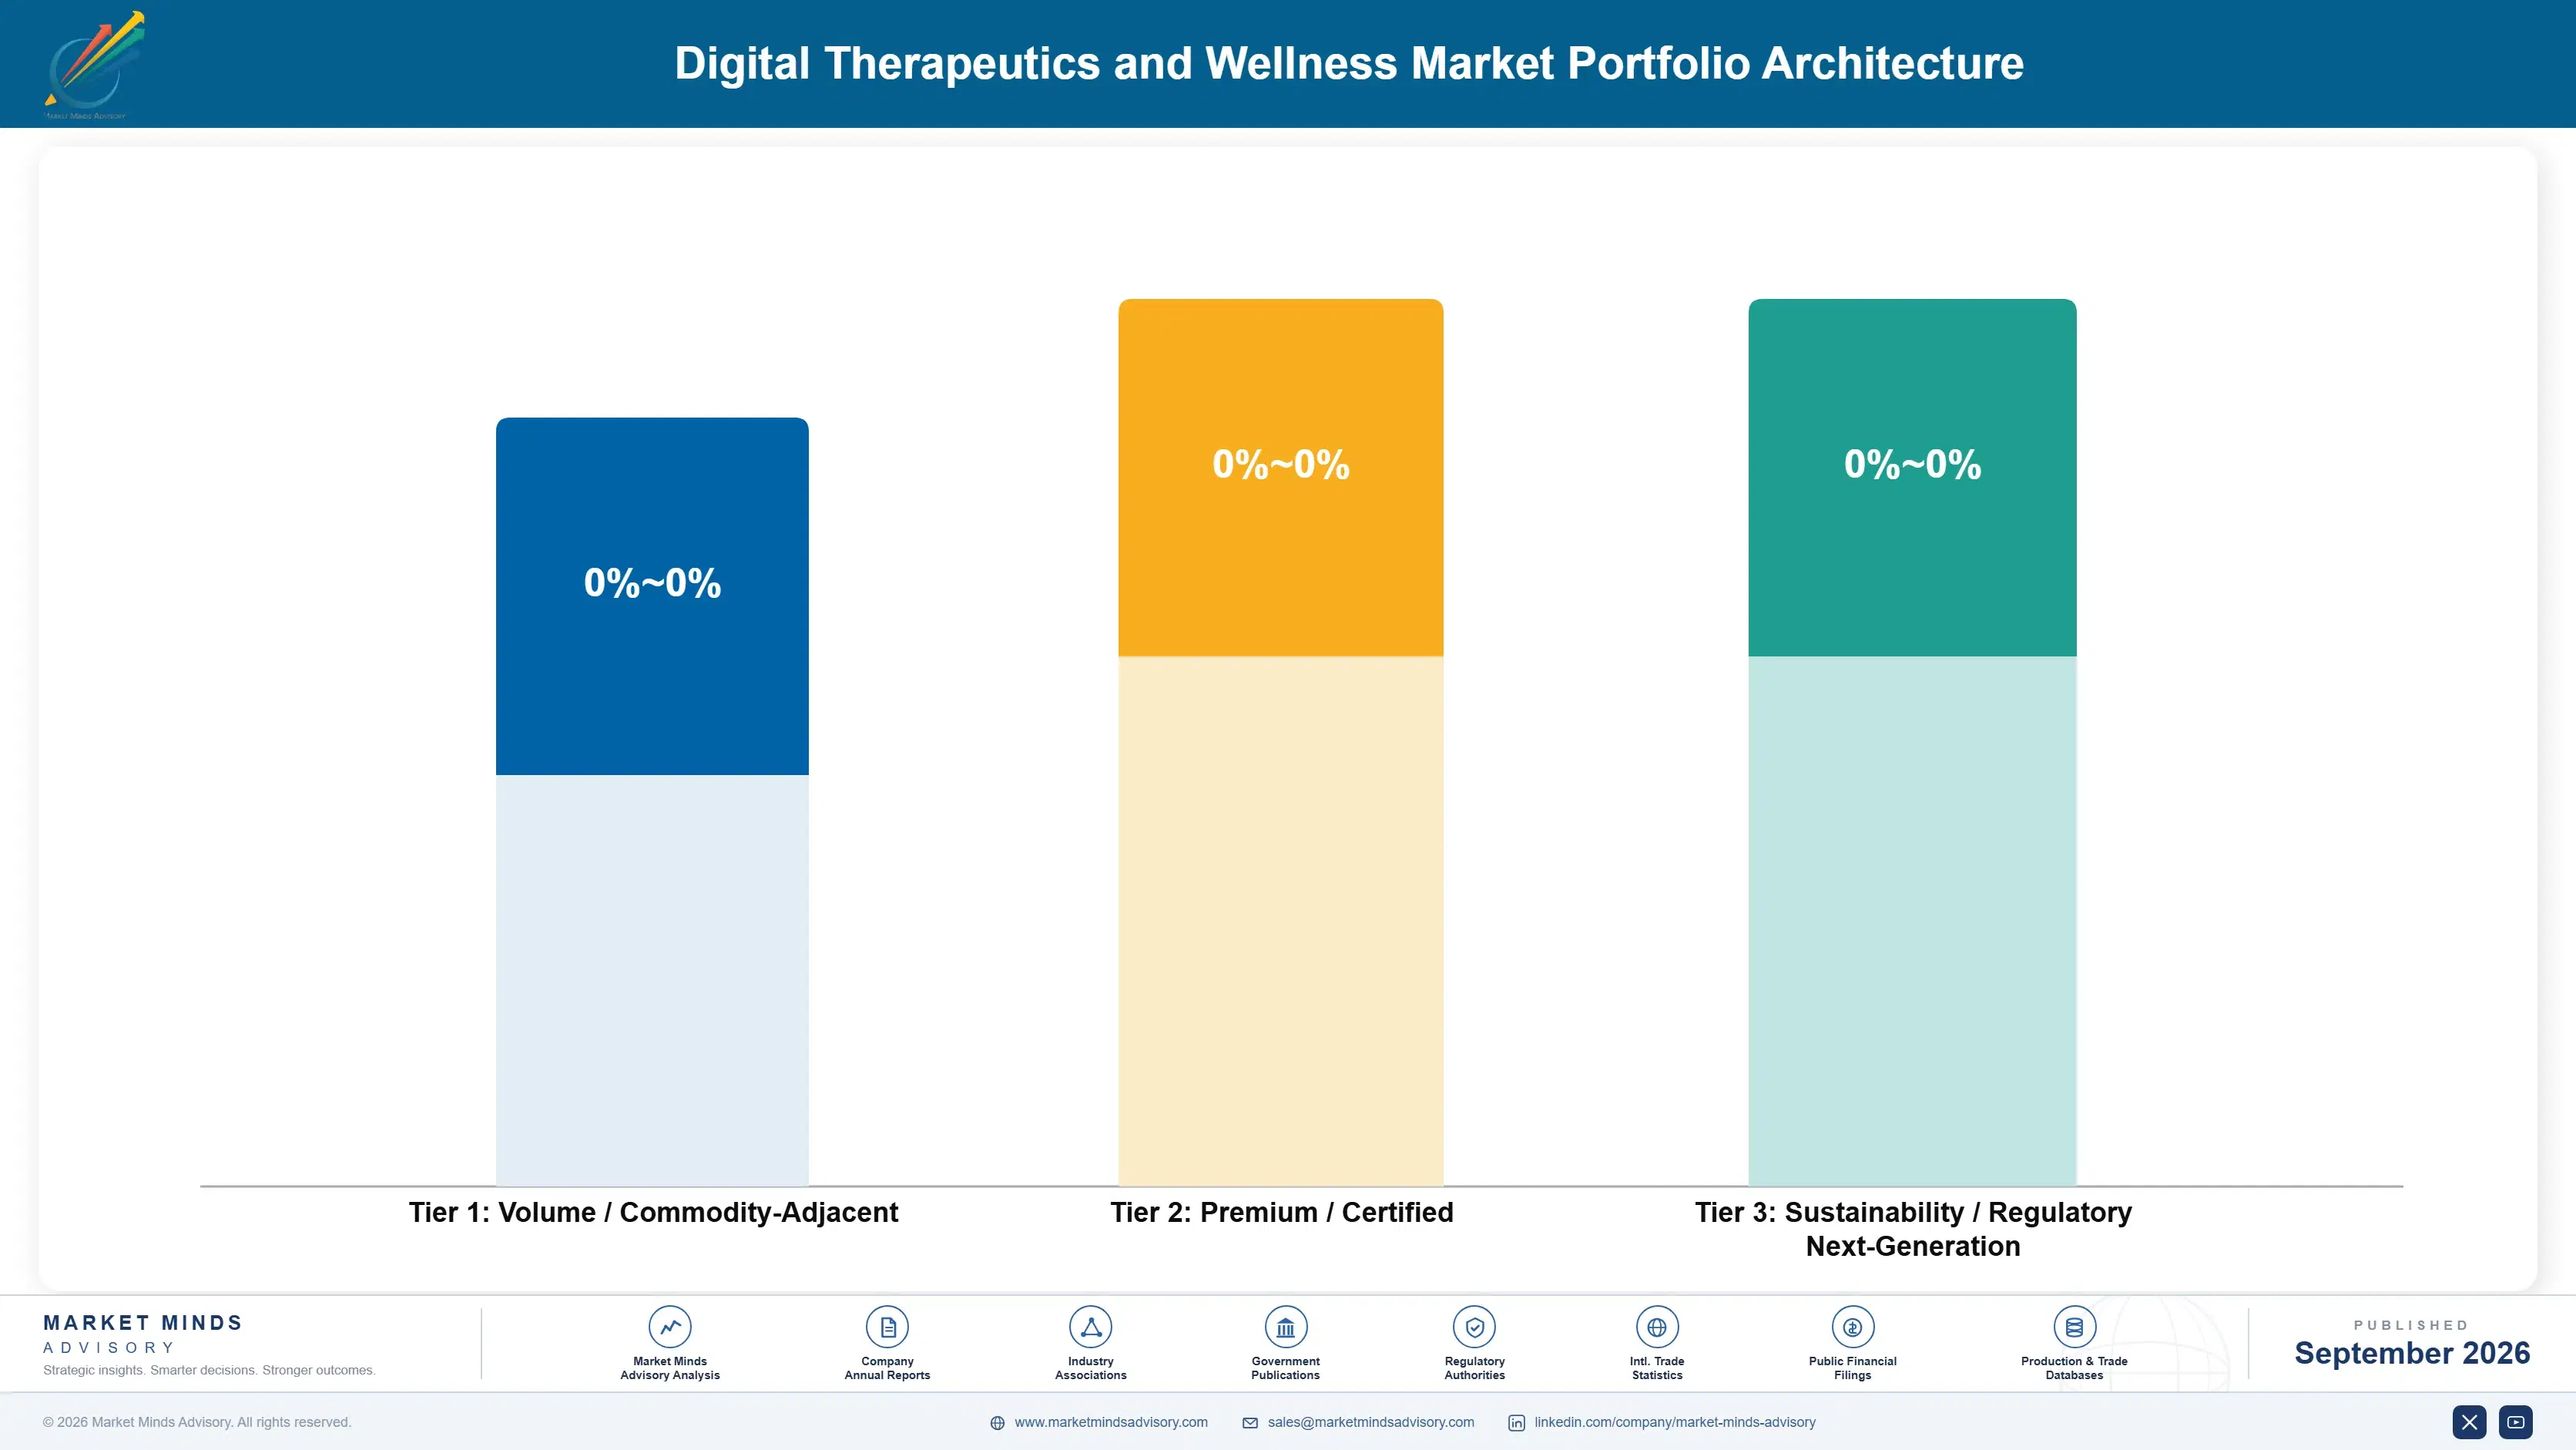
Margin architecture separates on how much human contact a product requires. Chronic disease and behavioural programmes with substantial coaching earn least in gross terms, because clinical staff scale with enrolment and appear directly in cost of delivery. Employer platforms sit in the middle. Consumer applications and reimbursed products earn most, the first because nobody delivers anything after download and the second because a statutory rate arrives without a sales cost attached.
The volume versus premium tension here is unusually direct, because reducing coaching improves margin and measurably worsens results. Vendors who cut human contact to fix gross margin lost outcome-based contracts within a renewal cycle. Vendors who added it won contracts and lost margin. Nobody has found a position that satisfies both, and the ones claiming to have generally changed the outcome measure rather than the outcome.

High-value pools sit in reimbursed products under statutory routes and in consumer subscriptions, which are opposite ends of the same market. Reimbursement rewards clinical evidence and regulatory patience. Consumer rewards acquisition efficiency and brand. Almost nobody holds both, and the companies that tried to move from one to the other mostly no longer exist.

Volume / Commodity-Adjacent

Chronic disease and behavioural programmes with substantial clinical coaching, where staff cost scales directly with enrolment rather than with results. The eight point spread separates vendors targeting coaching at likely completers from those coaching everybody equally.
Gross Margin: 38% to 46%

Premium / Certified

Employer and payer wellness platforms sold on claims analytics and measured medical cost with lighter delivery obligations attached. The ten point spread tracks how much clinical staffing each vendor carries against a purely software offering.
Gross Margin: 56% to 66%

Sustainability / Regulatory / Next-Generation

Reimbursed non-prescription therapeutics and consumer wellness applications, where delivery cost after the first user approaches nothing at all. The twelve point spread reflects whether revenue arrives by statutory rate or has to be bought through paid acquisition.
Gross Margin: 72% to 84%
digital-therapeutics-and-wellness-market-portfolio-architecture-1789986961591

High-value Sub-segments and Strategic Watch-out

Reimbursed Non-Prescription Therapeutics

Grows at 23.1% entirely because German statutory listing converts a clinical evidence threshold into revenue at around EUR 218 per quarter. The twelve point spread reflects evidence generation cost amortisation. France and Belgium are building comparable routes and the rate design decides everything about them.
Gross Margin: 72% to 84%

Chronic Disease Management Programmes

Grows at 19.2% because vendors reframed the sale around avoided claims rather than engagement, which is what a finance department accepts. The eight point spread reflects coaching targeting efficiency. Completion rates near 31% mean delivery cost scales with enrolment rather than results in every case.
Gross Margin: 38% to 46%

Consumer Wellness And Lifestyle Applications

Grows at 11.4% and carries a large share of revenue on annual churn running about 63%, which the successful operators price in rather than fight. The twelve point spread reflects acquisition efficiency alone. This has been the only consistently profitable part of the market for a decade.
Gross Margin: 72% to 84%

Prescription Digital Therapeutics

Grows at 8.2%, by far the slowest here, because American clearance conferred permission to market and nothing about payment, which bankrupted the 2 best-funded companies in the field. The twelve point spread is largely theoretical at this volume. Japan and Germany are the only real exceptions to that.
Gross Margin: 72% to 84%

Who Actually Signs The Cheque

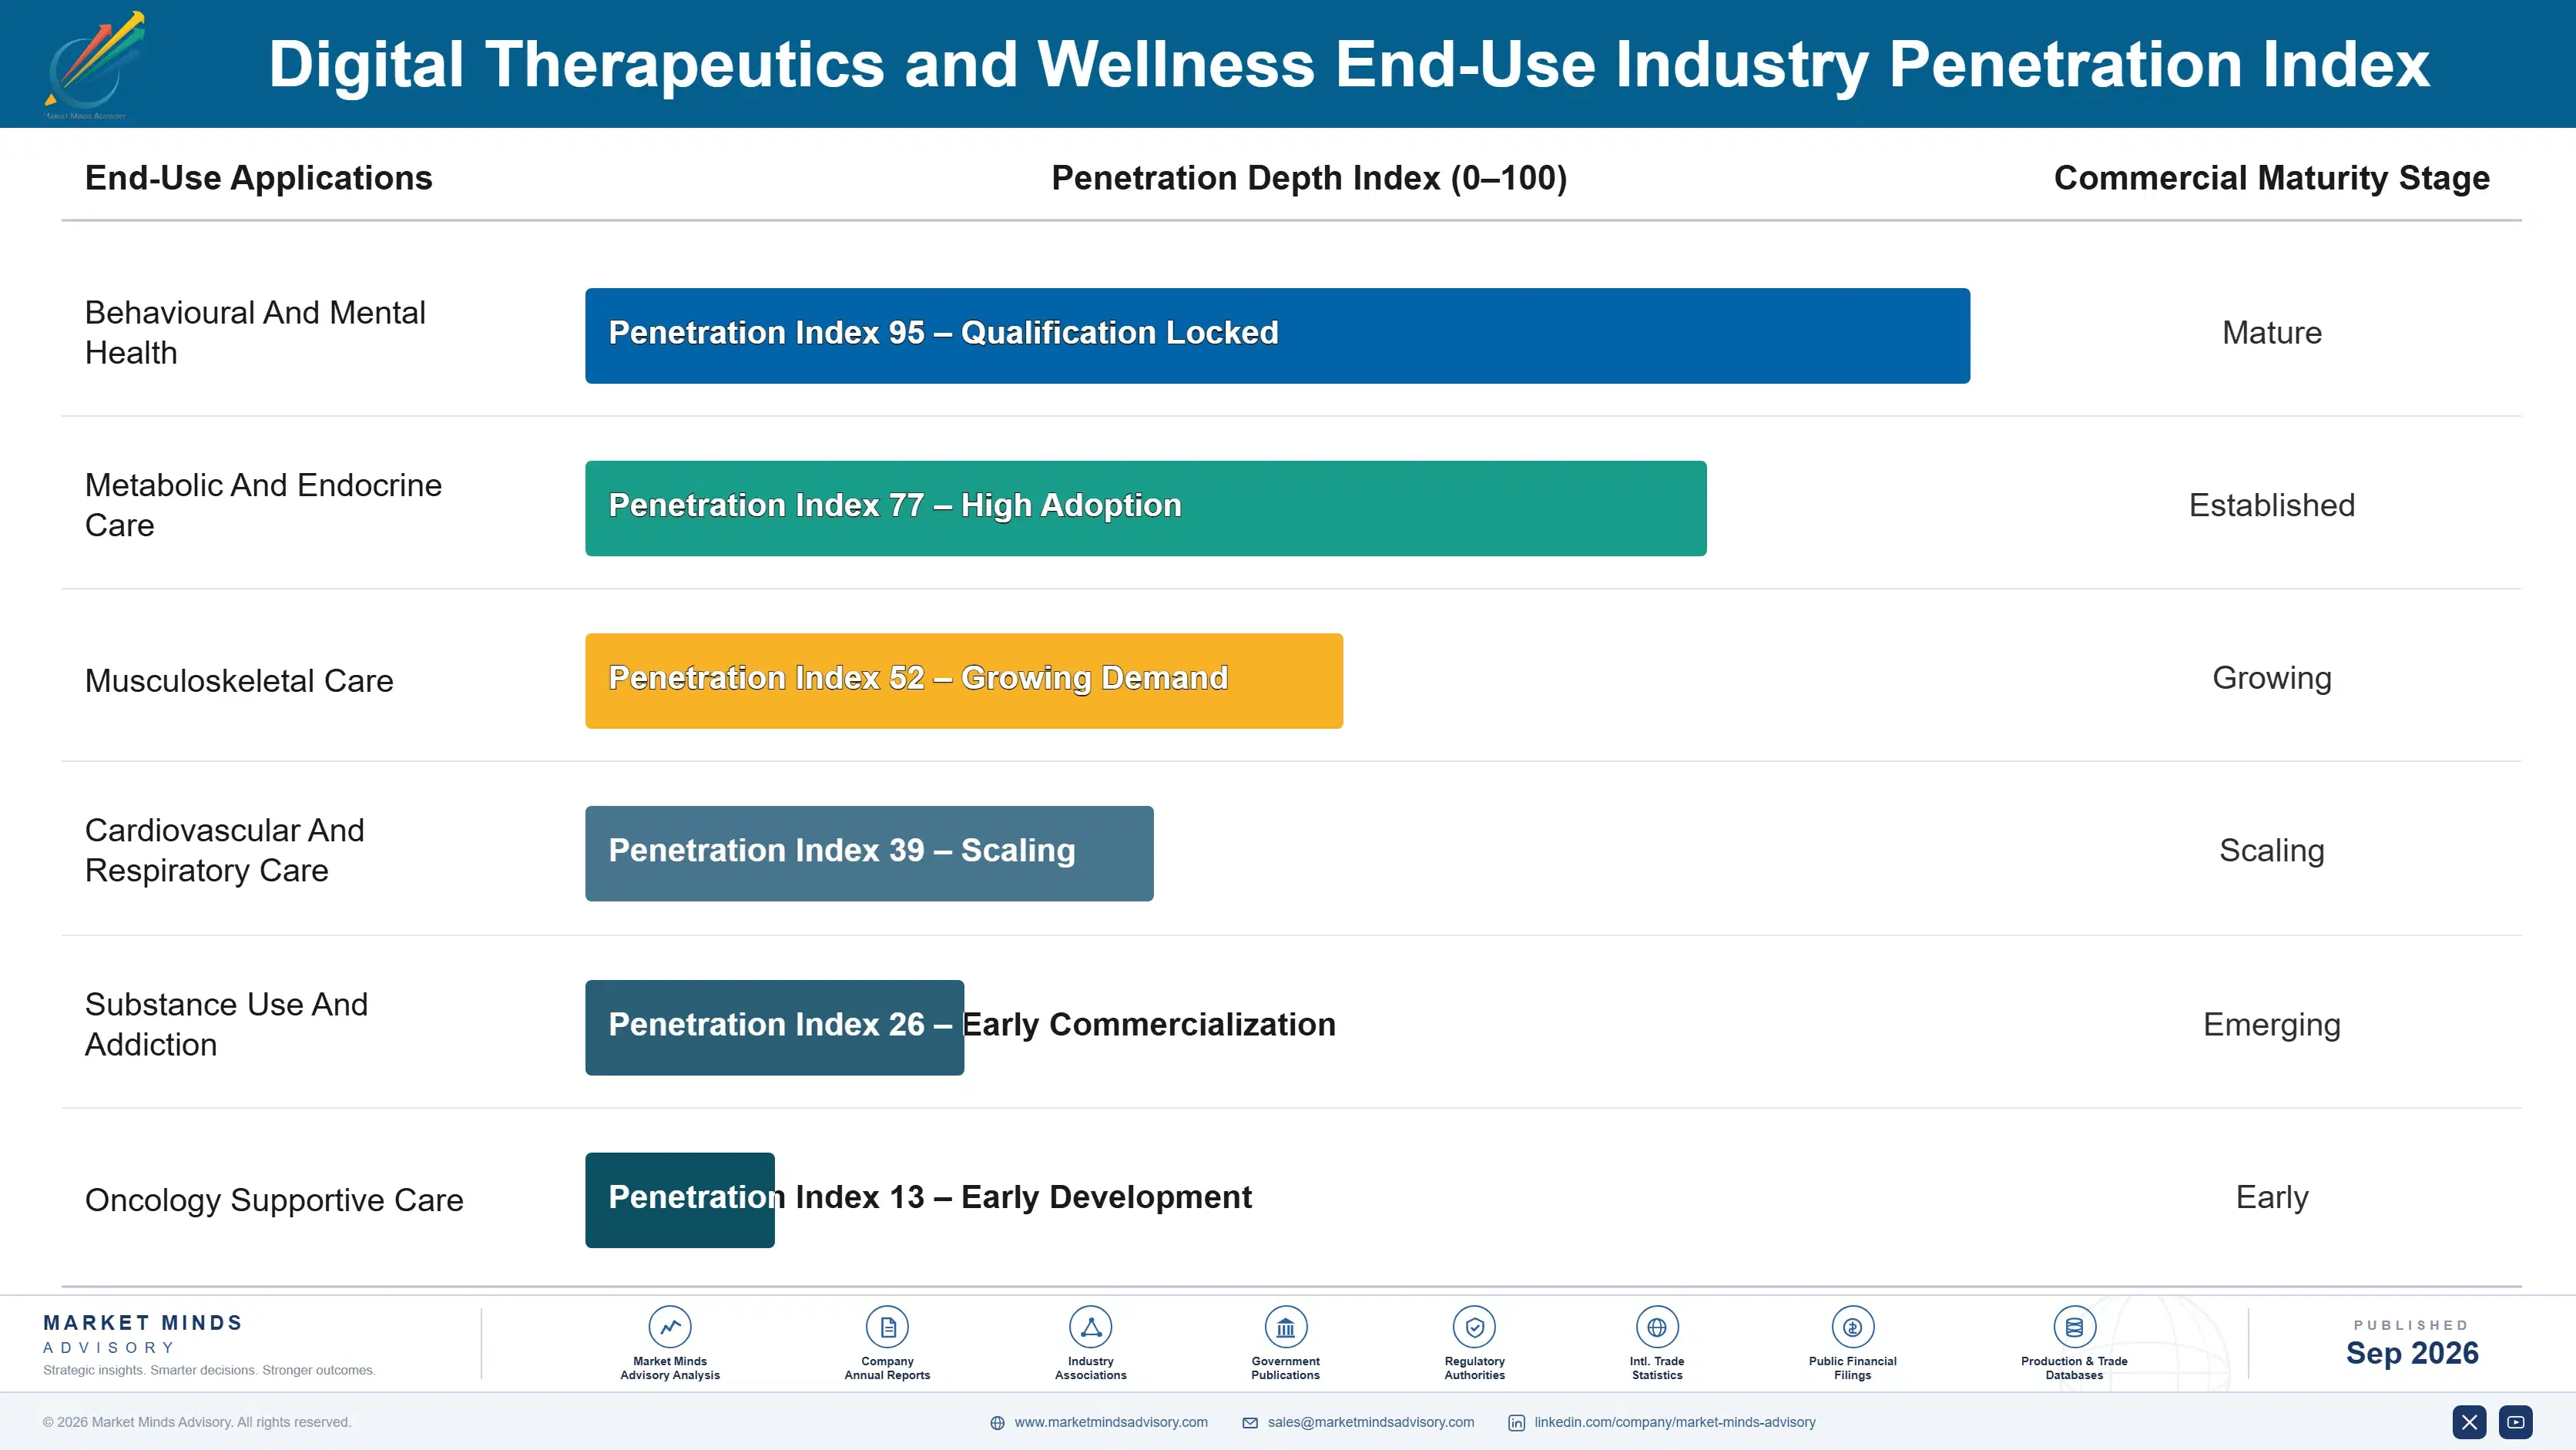
The annuity depends entirely on who pays. A German statutory listing generates revenue for as long as physicians prescribe and the product stays on the schedule, with no renewal negotiation at all. An employer contract renews annually against measured results and can disappear in one budget cycle. A consumer subscription lasts a few months on average, given churn around 63%. Three completely different businesses sit inside one market description.
Adoption depth varies by condition more than by geography, and tracks how measurable the cost is. Musculoskeletal and metabolic conditions adopt deeply because the avoided spend is large and attributable. Behavioural health adopts broadly because waiting lists leave no alternative. Respiratory and cardiac programmes adopt selectively. General wellness adopts everywhere and produces nothing a payer will fund, which is why it stayed consumer.

The deciding buyer moved from a clinician to a finance function, which nobody in this industry expected. A clinician asked whether the evidence was sound and was frequently persuaded. A benefits director or a plan actuary asks what it saves and whether the number survives audit. That shift explains which companies grew and which cleared regulators and then folded.
digital-therapeutics-and-wellness-market-end-use-penetration-index-1789986962087

Where The Money Actually Is

These are among the four positions where our research anticipates prominent divergence between winners and laggards over the coming forecast period. Each is grounded in the demand model, the regulatory perimeter, and the announced capacity pipeline.
01 / REIMBURSEMENT ROUTE SELECTION

Design For German Listing, Not American Clearance

German statutory listing is the only mechanism anywhere that converts a clinical evidence threshold directly into revenue, paying around EUR 218 per quarter for a product any physician can prescribe and the sickness funds must cover. American clearance conferred permission to market and nothing whatever about payment, which is precisely what bankrupted Pear and Akili despite cleared products and published trials behind both of them. Reimbursed non-prescription therapeutics compound at 23.1% against 15.4% for the market entirely because of that difference, and designing the trial around listing requirements costs less.
02 / OUTCOME MEASURE DISCIPLINE

Report Avoided Claims, Never Engagement Statistics

A benefits director cannot defend an engagement statistic to a finance department and can defend an avoided surgery or a reduced medication line without any difficulty at all. Chronic disease management programmes compound at 19.2% precisely because the vendors reframed the sale around measured medical cost, and the largest companies in this market are the ones who made that switch earliest. The requirement is claims data access and analytics capability most wellness vendors never built, and it exposes the vendor to completion rates near 31%, which pricing must reflect honestly.
03 / PAYER CHANNEL CHOICE

Sell To Self-Insured Employers, Not Plans

American health plans have no benefit category to bill digital therapeutics against and no incentive whatever to create one, which is what killed the prescription route. Self-insured employers carry medical cost on their own balance sheet, so a programme that reduces it pays for itself without any coding question ever arising, and their contract cycles run considerably shorter than the 14 months a payer takes. Hinge Health, Omada and Sword built substantial businesses on that channel while the prescription companies were still negotiating with plans, and the difference was total.
04 / CONSUMER CHURN REALISM

Price Around Churn Instead Of Fighting It

Annual churn across paid consumer wellness applications runs about 63%, which is a fact about the category rather than any product failure. Companies that built around it, acquiring cheaply and accepting short customer lifetimes, have been consistently profitable for a decade while the clinically rigorous companies in this market went bankrupt one by one. Retention improvement programmes here have generally cost more than the churn they prevented, so the commercial discipline is to treat acquisition efficiency as the whole business and stop funding engagement features that change nothing.

Engagement Snapshot From the Field

A live engagement with an industry participant carrying material or product regulatory and market exposure ahead of a defining policy shift, showing how our research translates into a defensible multi-year portfolio strategy.
MARKET MINDS ADVISORY · CLIENT ENGAGEMENT SUMMARY
Digital Therapeutics and Wellness Producer Strategic Portfolio Review and Transition Roadmap 2026·Investment Scenario on Digital Therapeutics and Wellness Exposure Evaluation 2025-26
CLIENT PROFILE
A European digital therapeutics developer holding a completed randomised trial for an anxiety intervention, with regulatory work under way in two jurisdictions and eighteen months of funding remaining. The board had assumed American clearance was the commercially valuable milestone and had budgeted accordingly. Two competitors with cleared American products had entered administration during the previous year. Nobody had drawn the obvious conclusion.
STRATEGIC CHALLENGE
Management wanted to complete both regulatory submissions and could afford only one, and the clinical team preferred the American route on prestige grounds. Nobody had modelled expected revenue by jurisdiction against the remaining funding, so the choice was being made on reputation rather than on arithmetic. A decision was required within one quarter to preserve the trial timeline.
MMA APPROACH
MMA modelled expected revenue under each pathway against the client's actual runway, using observed German listing rates and prescribing volumes alongside documented American reimbursement outcomes for cleared products. We tested whether the existing trial protocol satisfied German listing requirements without additional work, and drew on 47 expert interviews conducted in Q4 2025 with sickness fund representatives, listed vendors and regulatory consultants.
KEY FINDINGS
  1. Modelled revenue under German listing exceeded the American pathway by roughly 6 times over the funding horizon, before any probability weighting (client-reported, unverified by MMA).
  2. The existing trial protocol satisfied German listing requirements with 2 minor amendments, while the American submission needed a further study the client could not fund.
  3. Neither administered competitor had failed on clinical evidence, and both had cleared products at the point they ran out of money, which the board had not examined.
  4. French and Belgian routes under development would accept substantially the same evidence package, which made the German submission a route into three markets rather than one.
CLIENT PROFILE
A European digital therapeutics developer holding a completed randomised trial for an anxiety intervention, with regulatory work under way in two jurisdictions and eighteen months of funding remaining. The board had assumed American clearance was the commercially valuable milestone and had budgeted accordingly. Two competitors with cleared American products had entered administration during the previous year. Nobody had drawn the obvious conclusion.
STRATEGIC CHALLENGE
Management wanted to complete both regulatory submissions and could afford only one, and the clinical team preferred the American route on prestige grounds. Nobody had modelled expected revenue by jurisdiction against the remaining funding, so the choice was being made on reputation rather than on arithmetic. A decision was required within one quarter to preserve the trial timeline.
MMA APPROACH
MMA modelled expected revenue under each pathway against the client's actual runway, using observed German listing rates and prescribing volumes alongside documented American reimbursement outcomes for cleared products. We tested whether the existing trial protocol satisfied German listing requirements without additional work, and drew on 47 expert interviews conducted in Q4 2025 with sickness fund representatives, listed vendors and regulatory consultants.
KEY FINDINGS
  1. Modelled revenue under German listing exceeded the American pathway by roughly 6 times over the funding horizon, before any probability weighting (client-reported, unverified by MMA).
  2. The existing trial protocol satisfied German listing requirements with 2 minor amendments, while the American submission needed a further study the client could not fund.
  3. Neither administered competitor had failed on clinical evidence, and both had cleared products at the point they ran out of money, which the board had not examined.
  4. French and Belgian routes under development would accept substantially the same evidence package, which made the German submission a route into three markets rather than one.
RECOMMENDED STRATEGY
Phase 1: Phase one: abandon the American submission entirely and redirect the whole regulatory budget toward German listing, since the runway supports only one route. Phase 2: Phase two: amend the trial protocol to satisfy French and Belgian requirements at the same time, since the marginal cost is small. Phase 3: Phase three: report modelled revenue by pathway in every board pack, so regulatory choices stop being made on prestige rather than arithmetic.
OUTCOME
The company abandoned the American submission and completed German listing within three quarters (client-reported, unverified by MMA). Revenue began arriving without any payer negotiation, which the board had not believed possible. The amended protocol is now being used for the French submission, and modelled revenue by pathway appears in every board pack.

Frequently Asked Questions

Foundational context covering the market sizes, CAGR, scope, country, region and competition that inform every finding below. This section is provided to cover basics and most often pre-purchase conversations, answered from the MMA Primary Research Dataset.

What is the current size of the Digital Therapeutics and Wellness Market?

Global value reaches USD 7.85 billion in 2026, measured as subscription and reimbursed programme revenue across all intervention classes. The 2025 base is USD 6.8 billion.

How large will the Digital Therapeutics and Wellness Market be by 2036?

Subscription and reimbursed programme revenue reaches USD 32.88 billion by 2036, an increase of USD 25.03 billion over the forecast period. That represents 4.19 times expansion from 2026.

What is the CAGR for the Digital Therapeutics and Wellness Market 2026 to 2036?

The base case runs at 15.4% annually, with a bull case at 16.6% if France and Belgium build working reimbursement routes and a bear case at 14.0% if German pricing falls further.

Which segment is growing fastest?

Reimbursed non-prescription therapeutics grow at 23.1%, half again the market rate of 15.4%. German statutory listing converts a clinical evidence threshold directly into revenue without any payer negotiation.

Who are the major companies in the Digital Therapeutics and Wellness Market?

Teladoc Health, Hinge Health, Omada Health, Calm and Headspace lead on subscription and reimbursed programme revenue, together holding 16%. Sword Health, Virta Health and Noom hold meaningful positions.

Which country is growing fastest?

Germany leads at 19.8%, on a statutory listing route that pays for qualifying products without any payer negotiation. No other country has an equivalent mechanism in place at all.

Report Segmentation Architecture

The full report scope spans multiple orthogonal segmentation dimensions, with cross-tabulated demand data provided for each dimension pair. Coverage extends further to regional breakdowns, trend trajectories, and the competitive detail needed to support segment-level decision-making.

By Intervention Class

  • Reimbursed Non-Prescription Therapeutics
  • Chronic Disease Management Programmes
  • Behavioural Health And Mental Wellness Applications
  • Employer And Payer Wellness Platforms
  • Consumer Wellness And Lifestyle Applications
  • Prescription Digital Therapeutics

By End-Use Industry

  • Behavioural And Mental Health
  • Metabolic And Endocrine Care
  • Musculoskeletal Care
  • Cardiovascular And Respiratory Care
  • Substance Use And Addiction
  • Oncology Supportive Care

By Commercial Dimension

  • Statutory Reimbursement Listing
  • Commercial Payer Contracting
  • Self-Insured Employer Sales
  • Provider Network Distribution
  • Direct Consumer Subscription
  • Pharmaceutical Partnership Channel

By Region

  • North America
  • Western Europe
  • East Asia
  • South Asia and Pacific
  • Latin America
  • Middle East and Africa
  • Eastern Europe

Scope, Methodology, and Coverage

Every figure in this report is reproducible from documented input assumptions. The scope below maps the historical period, the forecast horizon, the segmentation dimensions, and the countries covered, alongside the underlying primary and qualitative methodology.
Historical Period
2020 to 2025
Forecast Period
2026 to 2036
Base Year
2025 (USD billions; MMA Primary Research Dataset, September 2026)
Market Definition
This report covers software-delivered therapeutic and wellness interventions sold on subscription or reimbursed by a payer: prescription digital therapeutics, reimbursed non-prescription therapeutics, chronic disease management programmes, behavioural health and mental wellness applications, employer and payer wellness platforms, and consumer wellness and lifestyle applications. It excludes telehealth consultation services, electronic health record and clinical workflow software, connected medical devices and diagnostics, and pharmaceutical products delivered alongside software.
Quantitative Units
USD millions, subscription and reimbursed programme revenue basis; enrolled users; programme completion rate as a percentage; statutory quarterly reimbursement rate in EUR; annual subscriber churn as a percentage.
Segmentation Dimensions
Intervention class; clinical area; commercial payment channel; geography across seven regions.
Regions Covered
North America, Western Europe, East Asia, South Asia and Pacific, Latin America, Middle East and Africa, Eastern Europe
Countries Covered
Germany, France, Belgium, United Kingdom, Netherlands, Poland, Czechia, United States, Canada, Mexico, Brazil, Chile, Japan, China, South Korea, India, Australia, Singapore, Saudi Arabia, Israel.
Key Companies Profiled
Teladoc Health, Hinge Health, Omada Health, Calm, Headspace, Sword Health, Virta Health, Noom, Dario Health, Big Health, Kaia Health, Click Therapeutics, CureApp, HelloBetter, Sidekick Health.
Quantitative Methodology
Primary survey, n=3,800 respondents, Q4 2025, six countries; demand-side model with trade association cross-validation
Qualitative Methodology
47 expert interviews, Q4 2025; applied to validate demand model assumptions, identify emerging dynamics, and assess competitive positioning
Report Format
PDF and XLSX data workbook (Word format preview document)
Publisher
Market Minds Advisory
Report Code
MMA-2026-HLT-141
Published
September 2026
Contact
sales@marketmindsadvisory.com | www.marketmindsadvisory.com

Purchase the full Digital Therapeutics and Wellness Market Report (2026 to 2036).

This report sizes the global digital therapeutics and wellness market from 2026 to 2036 across six intervention classes, six clinical areas and seven regions. It sets out why clinical evidence and commercial viability turned out to be separate problems, and what the German statutory listing route did about it. Cost composition is sourced to company annual reports, with clinical coaching at 39% of programme cost. Regional analysis explains why Western Europe leads at 30% on a single policy instrument. Competitive assessment covers 20 named companies with four revenue lever analyses and an anonymised reimbursement pathway engagement.
Reimbursement pathways compared by jurisdiction and revenue
Six intervention classes sized through to 2036
Coaching and evidence cost composition from filings
Twenty named companies assessed on programme revenue
Four revenue levers with quantified commercial impact
Anonymised reimbursement pathway selection engagement included in full

Built For The People Who Decide

From boardroom strategy to bench-side execution, this report is read cover-to-cover by leaders shaping the next decade of their industry, turning demand scenarios, market dynamics and valuation benchmarks into decisions.
CXOs/ Presidents/ VPs/ Managers
M&A and Corporate Development
Strategy Teams and R&D Heads
Procurement and Product Directors
Regulatory and Compliance Leaders
Investor Relations and Equity Analysts