Market Minds Advisory
Digital Radiography Sensor Market

Digital Radiography Sensor Market: Display Fab Dependence, CMOS Economics, and Retrofit Demand

Most flat panel detectors are still built on ageing liquid crystal display production lines, and that supply base is disappearing faster than the medical industry that depends on it has noticed.

Lead Analyst

Alice Ballenger

Published

September 2026

Make Smarter Decisions with Customized Research Insights

Request a free sample report and evaluate market opportunities, growth trends, and competitive dynamics relevant to your business needs.

2025 MARKET VALUE$2.7BMarket Size 2025
2036 FORECAST VALUE$5.3BBase Case , 2026 to 2036
CAGR 2026 TO 20366.4 %Bull 7.6% / Bear 5.2%
INCREMENTAL OPPORTUNITY$2.5BNet 10- year value creation
EXPANSION MULTIPLE1.86x2036 value over 2026 base
Strategic Levers
M&A Pipeline
Regional Outlook
Country Rankings
Competitive Intelligence
Segmental Deep-dive
Call-Us : 91 93563 13602

Executive Snapshot and Market Trajectory

The detector is roughly 38% of a radiography system's component cost and very nearly all of its image quality, which is why equipment manufacturers either own a detector supplier or depend on one they cannot readily replace. That dependency shapes the whole category. Nothing else carries comparable weight.
CMOS indirect conversion panels compound at 9.6%, a full 1.50x the market rate, and they are winning on semiconductor economics rather than on any medical innovation, riding a cost and noise curve driven by consumer and industrial demand. East Asia holds the largest share at 30%, since detector manufacture concentrates across China, South Korea and Japan while Chinese hospital equipping continues absorbing domestic output at considerable volume.
Concentration is moderate at 52%, and Varex and Trixell lead through opposite models, one selling to every manufacturer and one supplying its own owners. Amorphous silicon panels are still made on legacy display production lines that are steadily being converted or closed. Retrofit rather than new installation now drives 29% of placements. A portable panel converts an ageing installation without construction, and a radiology manager can usually authorise that purchase alone.
Market Definition
This market covers image sensors and detectors used in medical and dental digital radiography, spanning amorphous silicon indirect conversion panels, CMOS indirect conversion panels, amorphous selenium direct conversion panels, photon-counting detectors, computed radiography photostimulable phosphor plates and charge-coupled device sensors, measured at detector manufacturer revenue. Complete radiography systems, generators, tubes and positioning equipment, computed tomography and fluoroscopy detectors, image processing software sold separately, and industrial or security radiography detectors are excluded.
Base Year Value
$2.7B in 2025 (MMA Primary Research Dataset, August 2026)
Forecast Period
2026 to 2036, eleven discrete annual values
CAGR
6.4% base case. Bull 7.6%. Bear 5.2%.
Fastest Growth Segment
CMOS Indirect Conversion Panels: 9.6% CAGR
Fastest Growth Country
India: 10.8% CAGR
Fastest Growth Region
South Asia and Pacific: 8.6% CAGR
Largest Region
East Asia: 30% of 2025 global value
Market Leaders
Varex Imaging, Trixell, Canon Electron Tubes and Devices, Vieworks, and iRay Technology. Source: MMA Primary Research Dataset, July 2026.
Primary Survey
n=3,800 procurement and R&D decision-makers, Q4 2025, six countries
Methodology
Demand-side build-up, cross-validated against public data, 47 expert interviews

Digital Radiography Sensor Market Forecast Scenarios

digital-radiography-sensor-market-size-forecast-scenario-1787304916525
Growth ran near 5.4% from 2020 to 2025 as two different transitions ran alongside each other. Computed radiography plate systems kept disappearing from developed markets, replaced by flat panels once prohibitively expensive and no longer. Meanwhile Chinese and South Korean manufacturers took share from Japanese and European suppliers on price, with quality converging enough that several Western equipment makers quietly changed source.
Base case growth of 6.4% rests on three mechanisms. Retrofit demand keeps expanding as portable detectors replace plate readers and ageing systems without requiring a new imaging room. Tuberculosis screening programmes deploy battery-powered mobile radiography with automated reading into settings that never had imaging at all. And CMOS panel costs continue falling on semiconductor economics that the medical industry influences not at all but benefits from directly. None of the three requires the others to arrive.
The bull case at 7.6% assumes photon-counting detectors reach general radiography at commercially viable cost, opening a replacement cycle across an installed base that currently has no reason to upgrade. The bear case at 5.2% is a supply problem rather than a demand one: display capacity for amorphous silicon contracts faster than CMOS scales, and availability rather than budgets constrains shipments.

Radiography Detectors: Fab Dependence and Retrofit Economics

A digital radiography system is a generator, a tube, positioning hardware and a detector, and the detector is roughly 38% of component cost while determining almost everything a radiologist cares about. That concentration of value in one part explains the industry's structure precisely. Trixell exists because three equipment manufacturers preferred a jointly owned detector supplier to depending on somebody else's, and Varex exists because everyone else needed an alternative.
TOP FIVE CONCENTRATION52%Split between merchant suppliers and captive manufacturer joint ventures
DETECTOR SHARE OF SYSTEM38%Detector cost as proportion of complete radiography system component cost
AVERAGE PANEL PRICEUSD 24,000Typical wireless portable flat panel detector at manufacturer level
DETECTOR REPLACEMENT CYCLE7 yearsAverage service life before replacement across hospital radiography installations
RETROFIT INSTALLATION SHARE29%Placements replacing existing equipment rather than furnishing new imaging rooms
ANNUAL PANEL FAILURE RATE4.2%Detectors requiring repair or replacement each year, mostly from dropping
The supply base beneath all this deserves more attention than it gets. Amorphous silicon panels, still the volume technology, are made on liquid crystal display lines built for a television industry that moved on generations ago. Those lines are being converted or closed on a timetable set by display economics. CMOS detectors avoid the problem entirely by riding semiconductor capacity that is expanding rather than shrinking.
Demand meanwhile has shifted from equipping new rooms to replacing what already exists. Retrofit accounts for 29% of placements, since a portable detector converts an ageing film or plate system into a digital one for a fraction of a new installation. That is also how digital imaging reaches settings with no imaging history, particularly tuberculosis screening programmes running battery-powered equipment in the field.
"Everyone in medical imaging talks about artificial intelligence and nobody talks about where the panels come from. A meaningful share of the world's detectors are made on display fabs that were obsolete for televisions a decade ago, and that arrangement has a finite life."
Principal Analyst, Medical Imaging Components and Detectors Practice · MMA Medic

Market Trends

CMOS detectors advance on semiconductor economics rather than medical innovation

CMOS image sensors improve in noise, readout speed and cost because consumer and industrial demand funds continuous fabrication investment, and medical detectors simply ride that curve without contributing to it. Panels compound at 9.6% on that basis. The technical advantages over amorphous silicon are genuine, particularly in dental, extremity and mobile applications where panel size suits available wafer economics. The strategic point is that this supply base is expanding while the alternative one contracts, which matters more than the specifications. Qualification takes years, so the work must begin well before any line closure is announced.
Market Impact: Endorsement granted back in 2021

Retrofit conversion replaces new room installation as the growth route

A wireless portable detector converts an existing film or computed radiography installation into a digital system without construction, recommissioning or a new generator, at a fraction of what a replacement room costs. Retrofit now accounts for 29% of detector placements. That route dominates emerging market adoption and much of developed market replacement, and it changes the buying decision from a capital project requiring committee approval into a departmental purchase that a radiology manager can authorise directly. Suppliers selling only through equipment manufacturers never encounter that buyer and cannot see the volume in any forecast.
Market Impact: Panel prices near USD 24,000

Market Opportunities and Growth Drivers

Tuberculosis screening deploys mobile radiography into unserved settings

Automated reading of chest radiographs for tuberculosis received formal World Health Organization endorsement in 2021, and screening programmes now deploy battery-powered portable radiography with computer-aided detection into communities that have never had imaging. India compounds at 10.8% partly on that programme demand. The equipment specification is unusual: ruggedness, battery life and weight matter more than resolution, and the software reads the image rather than a radiologist, which removes the workforce constraint entirely. Funding comes through international health programmes rather than hospital equipment budgets, which is a route most detector suppliers have never approached at all.
Market Impact: Volumes below 1% of fab output

Detector prices fall enough to make replacement genuinely routine

Wireless portable panels that cost several times current levels a decade ago now sit near USD 24,000 at manufacturer level, and continued CMOS cost reduction keeps pushing that down. Falling prices convert detectors from a capital item requiring justification into something closer to a consumable with a seven-year life. Combined with an annual failure rate near 4.2%, mostly from panels being dropped, that produces steady replacement volume independent of any new equipment purchasing cycle. Retrofit conversion depends directly on that decline, since the arithmetic works only when a panel costs far less than a room.
Market Impact: Failure affecting 4.2% annually

Market Restraints and Challenges

Amorphous silicon depends on contracting display fabrication capacity

Most flat panel detectors are still built on liquid crystal display production lines designed for television generations the display industry has long moved past. The root cause is that medical detector volumes are far too small to justify dedicated fabrication capacity, so the industry has always borrowed somebody else's. Commercial impact arrives when those lines close or convert on display economics that medical demand cannot influence. Participants are qualifying CMOS alternatives, securing long-term capacity agreements and, in a few cases, buying lines outright. None of those responses is quick, and qualification timelines routinely exceed announced conversion schedules.
Market Impact: Compounding at 9.6% each year

Panel breakage drives service economics more than specifications do

Portable detectors are dropped, sat on and driven over, and roughly 4.2% require repair or replacement each year in ordinary hospital use. The root cause is that a wireless panel is carried between rooms by staff under time pressure, which no amount of housing design fully solves. Commercial impact falls on service contracts and on customer perception, since a hospital remembers breakage far longer than it remembers image quality. Ruggedised housings, drop insurance and rapid exchange programmes are the responses. Service revenue on a base priced near USD 24,000 per panel makes this commercially significant rather than merely irritating.
Market Impact: Retrofit driving 29% of placements
4 additional market trends, 3 additional growth drivers, and 2 additional restraints and challenges are covered in the full report. Contact sales@marketmindsadvisory.com to access the complete intelligence.

Segment CAGR and Growth Architecture

Segmentation follows detector technology, because technology determines the fabrication base a supplier depends on, the achievable cost curve, the image characteristics and the applications a panel can serve. Six detector technologies cover radiography sensor supply without overlap. Clinical application and portability cut across several technologies at once and are treated here as use attributes rather than as segments.
digital-radiography-sensor-market-market-share-analysis-1787304917055

CMOS Indirect Conversion Panels

Growing at 9.6%, a full 1.50x the market rate, CMOS panels benefit from fabrication investment funded entirely by consumer and industrial semiconductor demand, which medical volumes could never justify on their own. Lower electronic noise and faster readout are genuine advantages, and they matter most in dental, extremity, mammography and mobile applications where panel dimensions suit wafer economics. Larger formats remain more costly to produce than amorphous silicon equivalents through tiling requirements. The decisive argument is supply security rather than performance: this fabrication base is expanding while the alternative contracts steadily. Qualification into an equipment platform takes years, so the transition cannot be made quickly once it becomes urgent. Few suppliers have started early enough.
CAGR 9.6%

Photon-Counting Detectors

Photon-counting detectors grow at 8.2% from a very small base in general radiography, having established themselves first in computed tomography where the economics support a higher detector cost. Counting individual photons rather than integrating charge permits dose reduction and material discrimination that conventional detectors cannot achieve at all. The obstacle in radiography is straightforward cost: a panel priced well above conventional alternatives must justify itself against an installed base with no clinical reason to replace working equipment. Cadmium telluride and cadmium zinc telluride supply constraints compound that difficulty considerably. Dose reduction arguments carry real weight in paediatric and repeat imaging, which is where the first commercially viable radiography applications are most likely to appear.
CAGR 8.2%
Full segment breakdown across 6 segments available in the complete report.

Regional Architecture and Country Demand Map

Regional value here reflects two separate things: where detectors are manufactured, and where radiography equipment is installed. Those overlap more in this category than in most, because detector manufacture concentrates unusually tightly. Reading installation demand alone misses where most of the supply risk sits. Both matter here.

East Asia

East Asia holds the largest share at 30% because detector manufacture and detector demand both concentrate here. Chinese suppliers including iRay and Careray have taken substantial share on price with image quality converging on established alternatives, and several Western equipment manufacturers now source from them without advertising the fact. South Korean makers hold strong positions in dental and portable panels. Japanese suppliers retain the premium positions their materials science underpins. Chinese hospital equipping programmes absorb considerable domestic output, and display fabrication capacity that detector manufacture depends upon also sits largely within the region. That combination of demand and fabrication proximity is not replicated anywhere else. Price competition originates here and is exported everywhere else.
Share: 30% | CAGR: 7.4% (2026 to 2036)

North America

Twenty-seven per cent of value, growing at 5.6%. Replacement rather than new installation drives almost all demand, with computed radiography effectively eliminated and an installed flat panel base now reaching the end of a seven-year service life in volume. Retrofit conversion of ageing systems is commercially significant, and panel breakage running near 4.2% annually sustains steady service and replacement revenue. Varex operates from here as the principal merchant supplier serving equipment manufacturers who prefer not to depend on a competitor's captive detector operation. Retrofit purchasing authorised at departmental level bypasses capital approval more often than suppliers assume, which distorts how demand appears in equipment manufacturer forecasts and understates the channel considerably.
Share: 27% | CAGR: 5.6% (2026 to 2036)
Regional intelligence for 5 additional markets available in the complete report: Western Europe, South Asia and Pacific, Latin America, Middle East and Africa, Eastern Europe. Contact sales@marketmindsadvisory.com.
digital-radiography-sensor-market-country-cagr-analysis-1787304917573

Where Detector Suppliers Defend Position

The detector carries most of a radiography system's value and most of its supply risk, and equipment manufacturers know it. Position therefore rests on securing fabrication capacity, on designing for the way panels actually get broken, and on reaching retrofit buyers who never appear in capital equipment forecasts at all. Specification competition addresses questions buyers rarely raise.

Secure fabrication capacity before display economics remove it

Amorphous silicon panels depend on liquid crystal display lines built for television generations long superseded, and medical detector demand represents under 1% of that fabrication output, so it influences closure decisions not at all. Long-term capacity agreements, qualified CMOS alternatives and in a few cases outright line acquisition each address the exposure differently. Suppliers treating panel substrate supply as ordinary procurement are carrying a risk that will arrive suddenly rather than gradually, and qualification takes years. Equity participation in a fabrication line is unusual and, for some suppliers, entirely warranted.
Market Impact: Medical demand is under 1% of fab o

Design and price for breakage rather than for specifications

Roughly 4.2% of portable detectors require repair or replacement annually, almost entirely because staff carrying them between rooms under time pressure drop them. Hospitals remember a broken panel far longer than they remember image quality. Ruggedised housings, drop coverage bundled into purchase price and rapid exchange programmes each convert an irritation into a commercial advantage, and they generate service revenue on a base priced near USD 24,000 per panel. Specification competition addresses a question customers rarely raise. Biomedical engineering staff describe supplier performance in terms of breakage far more often than resolution.
Market Impact: Breakage affecting 4.2% of all pane

Reach retrofit buyers outside the capital equipment channel

Retrofit conversion accounts for 29% of detector placements, and those purchases are frequently authorised by a radiology manager rather than approved by a capital committee, which makes them faster and considerably less price-anchored to whole-system comparisons. Suppliers selling only through equipment manufacturers never see that channel at all. Direct and distributor routes into retrofit require a different commercial organisation, and building one is the single clearest growth opportunity available to a merchant detector supplier today. Retrofit also carries less price anchoring to whole-system comparisons, which protects achievable margin. A separate commercial organisation is required to reach it.
Market Impact: Retrofit now covering 29% of all de

Design specifically for field screening rather than adapting hospital panels

Tuberculosis screening programmes deploy battery-powered radiography into communities without imaging, and their specification priorities are ruggedness, battery life and transport weight rather than resolution, since automated software reads the image instead of a radiologist. India compounds at 10.8% partly on this demand. Suppliers offering hospital panels with a carrying handle are answering the wrong requirement. Purpose-designed field detectors reach a buyer funded through international health programmes rather than through any hospital equipment budget. Programme standardisation then creates its own inertia once equipment is deployed and staff trained. Displacing an incumbent afterwards is considerably harder.
Market Impact: Indian demand expanding at 10.8% ev

Who Controls the Margin Pool

Concentration is moderate at 52% across the top five, measured on annual revenue from radiography detector and sensor supply, the single basis applied throughout this analysis. Varex Imaging and Trixell lead through opposite models, one selling as a merchant supplier to equipment manufacturers generally and one owned by three of them and supplying its owners. Canon Electron Tubes, Vieworks and iRay hold the remaining leading positions.
Competition runs on dimensions that differ sharply by customer type. Supplying equipment manufacturers turns on qualification depth, supply security and multi-year cost commitments, since changing a detector source means requalifying a whole product line. Supplying retrofit and distributor channels is a faster, price-led contest against considerably more competitors. Dental detectors form a third contest again, closer to consumer electronics in cost structure and replacement behaviour.

Pressure builds from two directions at once. Chinese and South Korean suppliers have narrowed the image quality gap enough that several Western equipment manufacturers changed source without announcing it, and price competition has intensified across mid-range panels accordingly. Separately, fabrication capacity for amorphous silicon is contracting on a timetable nobody in medical imaging controls. Rankings shift most where a supplier secures long-term substrate capacity that competitors cannot match.
digital-radiography-sensor-market-company-positioning-matrix-1787304918089

Competitive Moat and Risk Dimensions

VAREX IMAGING

Moat: Independent merchant supplier position

Selling detectors to equipment manufacturers who would rather not depend on a competitor's captive operation gives Varex a position that vertically integrated rivals simply cannot occupy. Qualification depth matters enormously here, since changing detector source requires requalifying an entire product line, and customers therefore stay considerably longer than price comparison alone would predict.
VAREX IMAGING

Risk: Substrate supply base contraction

Amorphous silicon panel production depends on liquid crystal display fabrication lines being converted or closed on display industry economics that medical demand cannot influence. Chinese and Korean competitors have narrowed the quality gap while pricing well below established levels. Equipment manufacturers pursuing vertical integration would remove customer volume outright.
TRIXELL

Moat: Captive joint venture supply

Joint ownership by major equipment manufacturers guarantees demand from parents who established the venture precisely to avoid depending on external detector supply, which insulates the business from the customer loss that merchant suppliers face continuously. European manufacturing supports regulatory compliance and supply assurance that customers increasingly price into sourcing decisions.
TRIXELL

Risk: Limited external market access

Serving owners who are also competitors of every other equipment manufacturer restricts external sales severely, capping growth to whatever the parents themselves achieve in their own markets. Cost structure faces the same substrate contraction as merchant suppliers without comparable scale to negotiate. Parent sourcing decisions can change with corporate strategy.

Players Tracked

Prominent Players

Varex Imaging
Trixell
Canon Electron Tubes and Devices
Vieworks
iRay Technology

Other Key Players

Fujifilm
Konica Minolta
Rayence
DRTECH
Careray Digital Medical
Analogic
Teledyne DALSA
Hamamatsu Photonics
Detection Technology
KA Imaging
JPI Healthcare Solutions
Carestream Health
Agfa-Gevaert
Dexis
Samsung Electronics

Recent Developments

APRIL 2025

Display fabrication closures tighten amorphous silicon panel substrate supply

Further liquid crystal display line conversions and closures reduced the fabrication capacity that amorphous silicon detector production depends upon, an organic industrial change driven entirely by display economics rather than by anything happening in medical imaging demand. Detector suppliers dependent on those lines began qualification work on alternatives.
Signal: Medical detector supply rests on a fabrica
SEPTEMBER 2025

Chinese detector suppliers extend share among Western equipment manufacturers

Chinese flat panel detector suppliers won further design positions with European and North American equipment manufacturers through organic commercial competition, offering converged image quality at prices established Japanese and European suppliers could not profitably match. Qualification depth rather than headline price decided several of the accounts that did not switch.
Signal: Several equipment manufacturers quietly ch
FEBRUARY 2026

Field screening programmes expand portable radiography deployment across Asia

Tuberculosis screening programmes across India and Southeast Asia expanded deployment of battery-powered portable radiography with automated image reading, an organic public health expansion funded largely through international programmes rather than hospital equipment budgets. Specifications prioritised ruggedness, battery life and transport weight far above image resolution throughout.
Signal: A detector specification prioritising rugg

Substrate, Scintillator and Semiconductor Exposure

Detector cost structures divide by conversion technology. Amorphous silicon panels carry thin film transistor array substrates at roughly 41% of cost of goods, fabricated on liquid crystal display lines concentrated across China, South Korea and Taiwan. Caesium iodide and gadolinium oxysulphide scintillator materials add a further 17%, with caesium iodide requiring specialist deposition capability held by relatively few suppliers. Readout electronics, housing and wireless components carry most o
Semiconductor and specialist component allocation through 2021 and 2022 disrupted detector production more severely than the modest volumes involved would suggest, because medical readout components command no foundry priority whatsoever against automotive and consumer allocations. Manufacturer annual reports documented extended lead times and board redesign work. Rare earth pricing for scintillator materials also moved sharply, and gadolinium supply remains concentrated. Several suppliers built inventory buffers afterwards at a working capital cost that persisted.

Exposure varies most by fabrication dependency rather than by scale. Suppliers relying on amorphous silicon substrates face a capacity base contracting on display industry timelines they cannot influence, while CMOS-based suppliers ride expanding semiconductor capacity instead. Geography compounds it: Chinese suppliers with domestic substrate, scintillator and electronics supply operate at cost structures Western competitors cannot match.
digital-radiography-sensor-market-cost-volatility-analysis-1787304918285

Contract display fabrication capacity on multi-year committed terms

Medical detector demand represents under 1% of the display fabrication output it depends upon, so line closure decisions ignore it entirely and arrive with little warning. Multi-year committed capacity agreements, and in some cases equity participation in a line, convert an uncontrollable exposure into a managed one. The cost is working capital rather than technology investment.

Qualify CMOS alternatives across the product range in advance

CMOS fabrication capacity is expanding on consumer and industrial demand while amorphous silicon capacity contracts, which makes qualification a supply security measure rather than a performance upgrade. Qualification takes years and cannot be compressed once a substrate source disappears. Suppliers beginning that work only when a line closure is announced will face a genuine gap in availability.

Diversify scintillator deposition and rare earth material sourcing

Caesium iodide deposition capability sits with relatively few suppliers and gadolinium supply is concentrated enough to have moved sharply on modest disruption in recent years. Scintillator materials account for roughly 17% of panel cost of goods and cannot be substituted quickly without image performance consequences. Qualifying second sources costs engineering time rather than capital investment.

Portfolio Architecture for Margin Defence

Margin architecture separates on qualification depth rather than on technology. Detectors designed into an equipment manufacturer's product line earn well because requalifying a platform costs the customer far more than any price difference saves. Retrofit and distributor sales earn less but move faster and price more freely. Dental sensors operate on different economics entirely, closer to consumer electronics in both cost structure and replacement behaviour.
The volume against premium tension runs along the supply base rather than the customer. Amorphous silicon panels carry the volume today at competitive prices, and their fabrication base is contracting on somebody else's timetable. CMOS panels cost more in large formats and sit on capacity that is expanding. Choosing volume today against supply security tomorrow is the central portfolio decision in this category, and few suppliers have resolved it convincingly.

High-value pools concentrate around designed-in positions, service and purpose-built field equipment. Detectors qualified into equipment platforms, drop coverage and rapid exchange programmes against a 4.2% annual failure rate, and ruggedised field panels for screening programmes all command pricing that specification competition does not. Mid-range portable panels sold on comparison against Chinese alternatives with converged image quality do not, and that pressure keeps intensifying.

Volume / Commodity-Adjacent Tier

Mid-range portable and fixed amorphous silicon panels sold through distribution and retrofit channels, competing directly against Chinese and Korean suppliers whose image quality has converged at materially lower prices. Cost structure decides who competes.
Gross Margin: 22-34%

Premium / Certified Tier

Detectors designed into equipment manufacturer platforms with deep qualification, protected by requalification costs that far exceed any achievable price saving and by supply agreements running several years. Those relationships rarely reopen without a supply failure.
Gross Margin: 38-50%

Sustainability / Regulatory / Next-Generation Tier

Photon-counting detectors, purpose-built ruggedised field screening panels and CMOS formats on expanding fabrication capacity, commanding premium on capability and supply security that alternatives cannot currently offer. Supply security is increasingly priced into sourcing decisions.
Gross Margin: 48-64%
digital-radiography-sensor-market-portfolio-architecture-1787304918776

Platform Qualification and Replacement Cycles

Detector demand behaves like a component annuity once qualification is complete. A panel designed into an equipment manufacturer's platform ships with every system that manufacturer sells, for as long as the platform remains in production, without any repeat selling effort at all. Replacement demand from the installed base adds a second continuing stream on a roughly seven-year service life, supplemented by breakage running near 4.2% annually.
Stickiness depends almost entirely on how much qualification the customer invested. Equipment manufacturer platform positions hold for years because requalification costs engineering time and regulatory filing work that nobody undertakes to save a modest amount per unit. Retrofit and distributor sales requalify with each purchase and are retendered accordingly. Field screening programmes fall somewhere between, since programme standardisation creates its own inertia once equipment is deployed and staff trained.

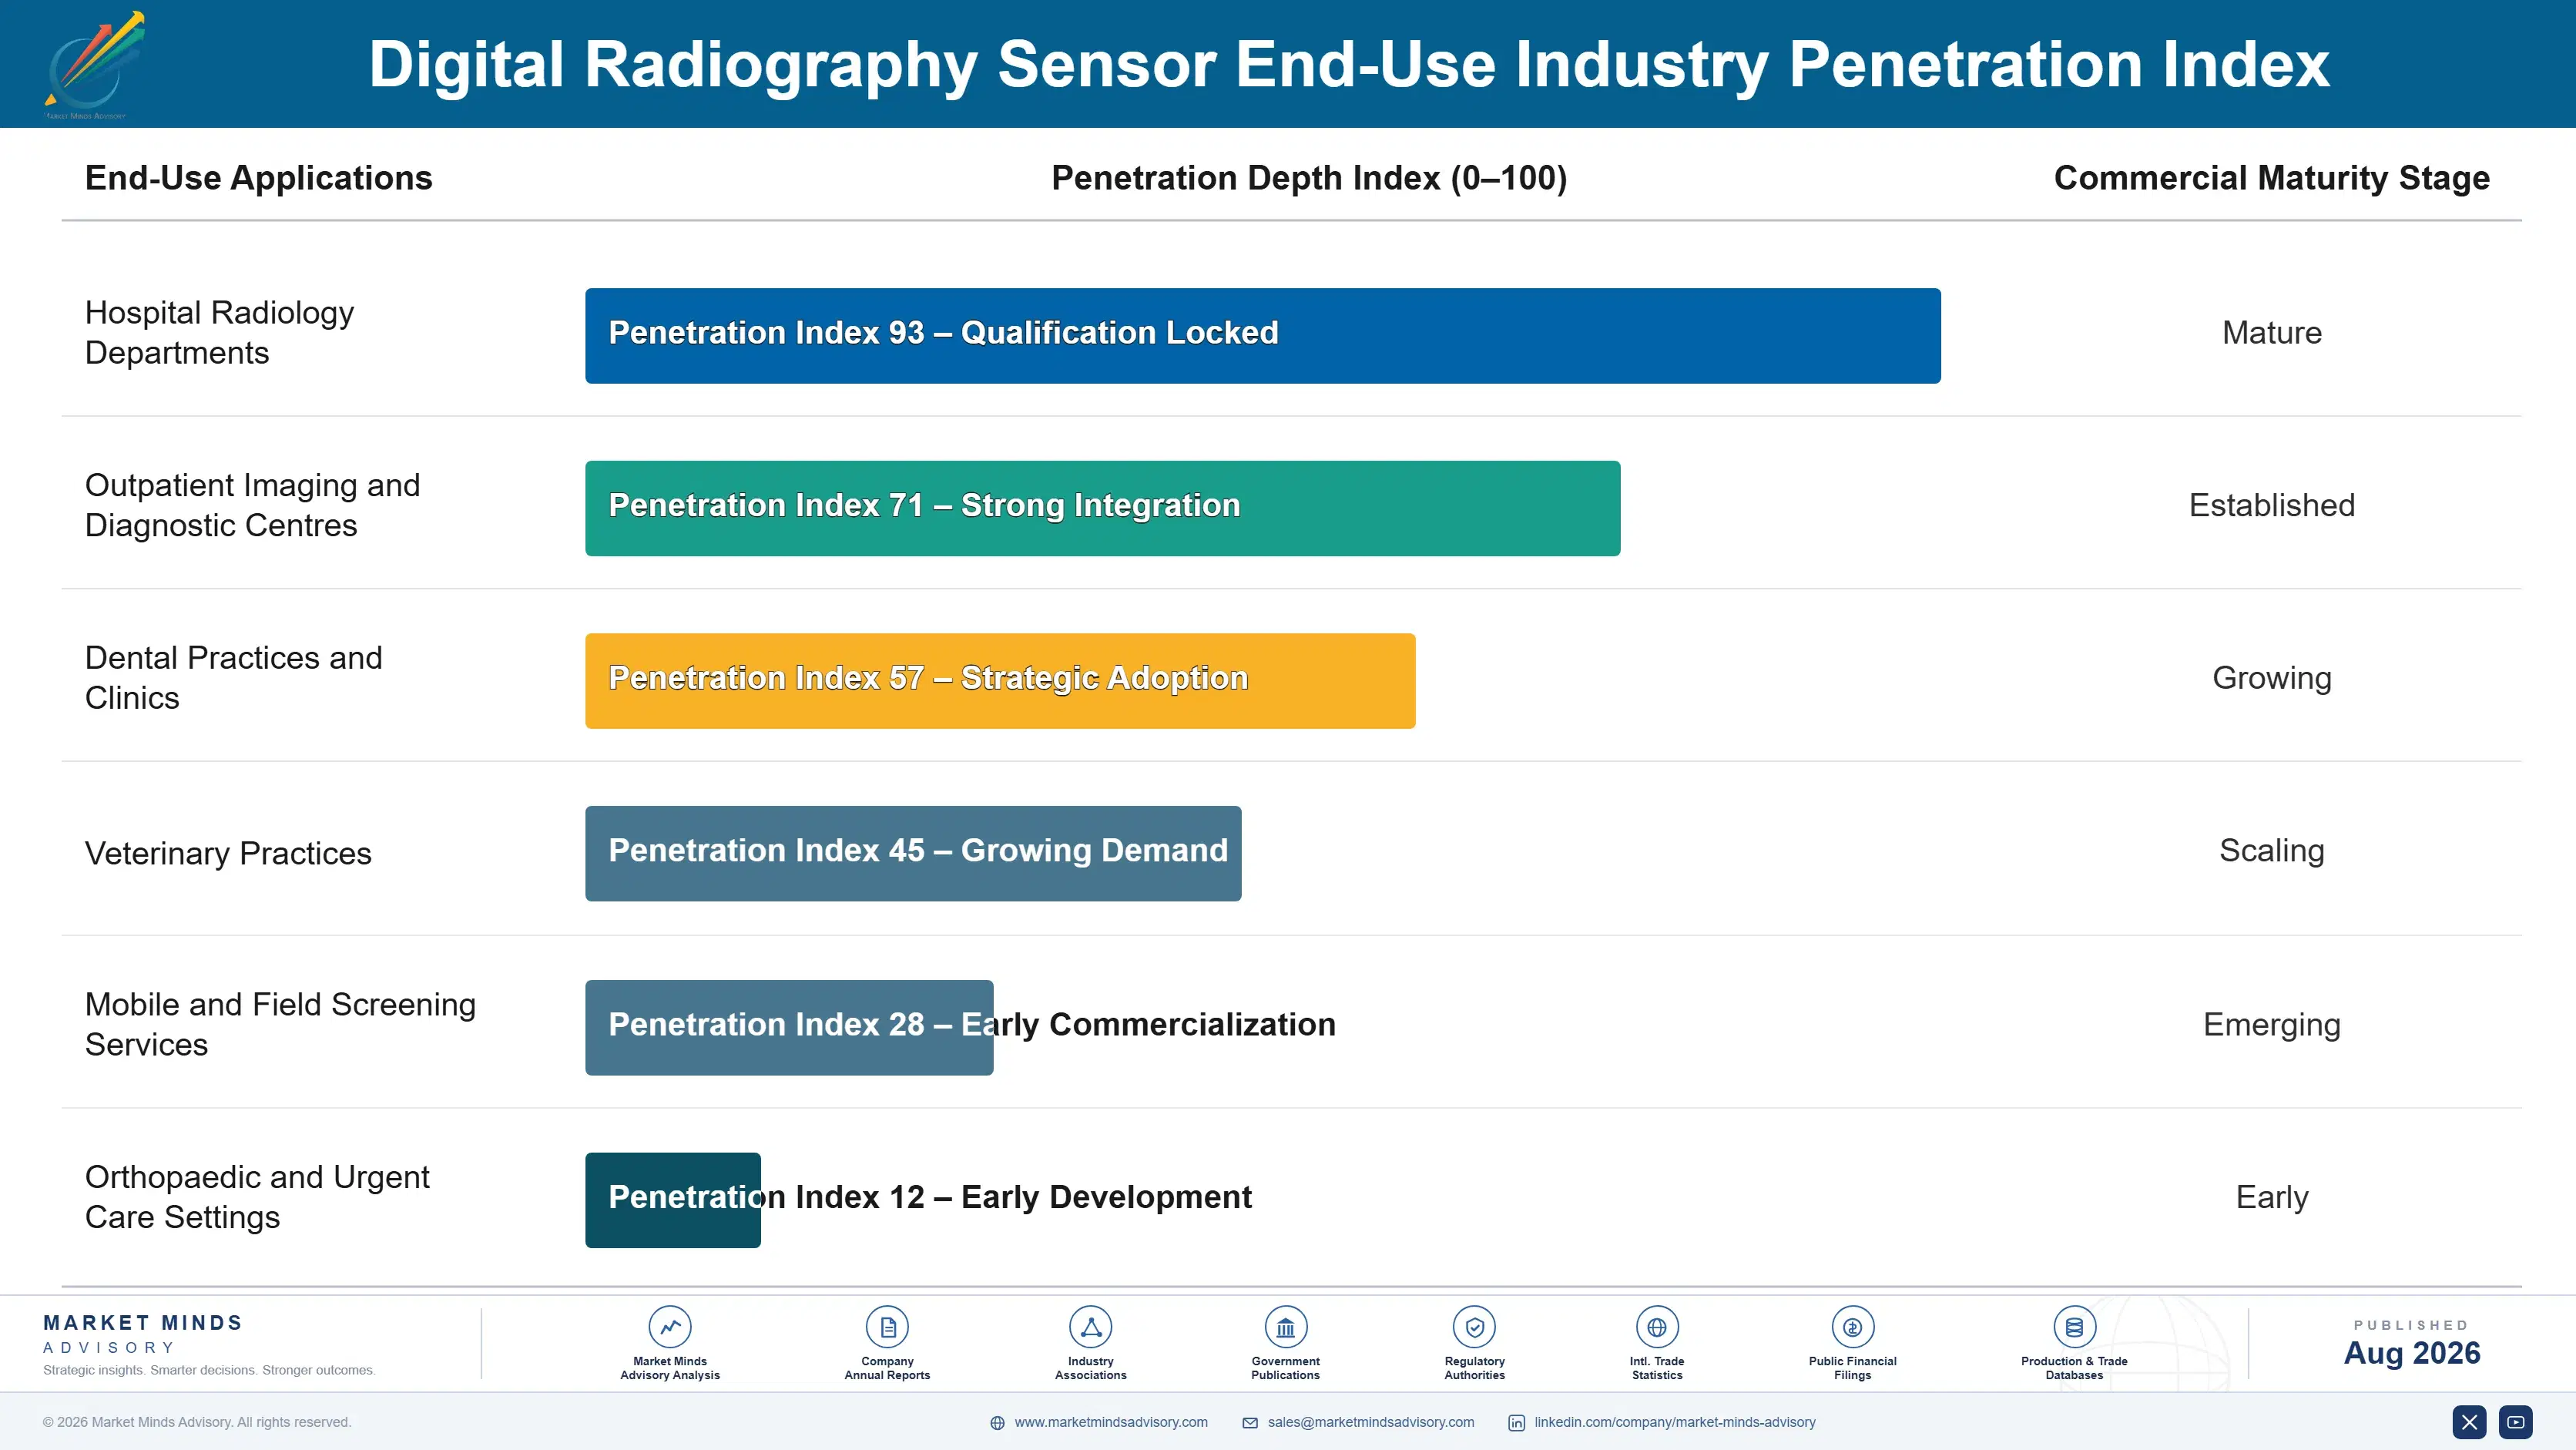
Buyer profiles have broadened considerably. Equipment manufacturer engineering teams once represented essentially the whole customer base for merchant detector suppliers. Radiology managers now buy retrofit panels directly on departmental authority, distributors serve a large fragmented installed base, and international health programme procurement teams buy field equipment against specifications that no hospital would ever write. Serving all four requires commercial organisations with very little in common.
digital-radiography-sensor-market-end-use-penetration-index-1787304919265

Where Detector Strategy Must Land

These are among the four positions where our research anticipates prominent divergence between winners and laggards over the coming forecast period. Each is grounded in the demand model, the regulatory perimeter, and the announced capacity pipeline.
01 / SUBSTRATE SUPPLY SECURITY

Display fabs will close on somebody else's schedule

Amorphous silicon panels depend on liquid crystal display production lines built for television generations the display industry abandoned years ago, and medical detector demand represents under 1% of that fabrication output. Closure and conversion decisions are therefore made on display economics that no medical supplier can influence, and they arrive suddenly rather than gradually. Qualification of alternative substrates takes several years of engineering work, which means that work must begin well before any public announcement makes the exposure visible to anyone.
02 / BREAKAGE COMMERCIAL DESIGN

Hospitals remember dropped panels, not image quality

Roughly 4.2% of all portable detectors require repair or replacement every single year, almost entirely because staff carrying them between rooms under time pressure drop them onto hard floors. That single experience shapes customer perception far more durably than any specification comparison a supplier might present during a purchasing evaluation ever does. Ruggedised housings, bundled drop coverage and rapid exchange programmes together convert what is a recurring irritation into both a real commercial advantage and a genuine ongoing service revenue stream.
03 / RETROFIT CHANNEL ACCESS

Twenty-nine per cent of placements bypass capital committees

Retrofit conversion accounts for 29% of all detector placements, and a radiology manager authorising a portable panel to digitise an ageing installation is a fundamentally different kind of buyer from a capital committee approving a whole imaging room. Those purchases move considerably faster and anchor far less to the whole-system price comparisons that suppliers usually have to defend. Detector suppliers selling only through equipment manufacturers never encounter that channel at all and cannot see its volume in any forecast they receive.
04 / FIELD SPECIFICATION DIFFERENCE

Screening programmes want ruggedness, not resolution

Tuberculosis screening deploys battery-powered radiography into communities with no imaging history whatsoever, and automated software rather than any radiologist reads the resulting chest image across most of those programmes. Specification priorities are consequently ruggedness, battery life and transport weight rather than the resolution figures that tend to dominate every hospital purchasing conversation. Suppliers offering an existing hospital panel with nothing more than a carrying handle attached to it are answering a requirement that these particular buyers simply did not write.

Engagement Snapshot From the Field

A live engagement with an industry participant carrying material or product regulatory and market exposure ahead of a defining policy shift, showing how our research translates into a defensible multi-year portfolio strategy.
MARKET MINDS ADVISORY · CLIENT ENGAGEMENT SUMMARY
Digital Radiography Sensor Producer Strategic Portfolio Review and Transition Roadmap 2026·Investment Scenario on Digital Radiography Sensor Exposure Evaluation 2025-26
CLIENT PROFILE
A merchant flat panel detector manufacturer supplying equipment makers across three continents, with production built substantially on amorphous silicon substrates sourced from two external display fabrication partners. Annual detector revenue was approximately USD 290 million (client-reported, unverified by MMA), weighted heavily toward designed-in platform positions with a limited retrofit and distributor presence. Breakage claims had risen steadily across the installed base.
STRATEGIC CHALLENGE
One substrate fabrication partner had signalled a line conversion timetable that would remove a substantial share of supply within three years, while Chinese competitors were winning design positions on price with converged image quality. The board needed to decide how much capital to commit to CMOS qualification against securing amorphous silicon capacity, and whether to build a direct retrofit channel.
MMA APPROACH
MMA conducted 47 expert interviews spanning equipment manufacturer engineering leads, procurement directors, radiology department managers, biomedical engineering staff, distributors and international health programme procurement officers across six countries. A quantitative survey of 3,800 respondents established replacement behaviour, breakage experience, retrofit purchasing authority and supplier switching intent. We then modelled supply and revenue outcomes under each allocation against stated fabrication timetables.
KEY FINDINGS
  1. Equipment manufacturer engineering leads in five of six accounts rated supply assurance above unit price when selecting detectors, yet none had assessed their supplier's substrate fabrication exposure.
  2. Radiology managers authorised retrofit panel purchases directly within departmental budgets in most surveyed institutions, entirely outside the capital approval process suppliers had assumed governed them.
  3. Breakage rather than image quality dominated how biomedical engineering staff described supplier performance, and drop coverage terms influenced repurchase more than any specification.
  4. International health programme buyers specified ruggedness, battery life and weight above resolution, and reported that no supplier had presented equipment designed against those priorities.
CLIENT PROFILE
A merchant flat panel detector manufacturer supplying equipment makers across three continents, with production built substantially on amorphous silicon substrates sourced from two external display fabrication partners. Annual detector revenue was approximately USD 290 million (client-reported, unverified by MMA), weighted heavily toward designed-in platform positions with a limited retrofit and distributor presence. Breakage claims had risen steadily across the installed base.
STRATEGIC CHALLENGE
One substrate fabrication partner had signalled a line conversion timetable that would remove a substantial share of supply within three years, while Chinese competitors were winning design positions on price with converged image quality. The board needed to decide how much capital to commit to CMOS qualification against securing amorphous silicon capacity, and whether to build a direct retrofit channel.
MMA APPROACH
MMA conducted 47 expert interviews spanning equipment manufacturer engineering leads, procurement directors, radiology department managers, biomedical engineering staff, distributors and international health programme procurement officers across six countries. A quantitative survey of 3,800 respondents established replacement behaviour, breakage experience, retrofit purchasing authority and supplier switching intent. We then modelled supply and revenue outcomes under each allocation against stated fabrication timetables.
KEY FINDINGS
  1. Equipment manufacturer engineering leads in five of six accounts rated supply assurance above unit price when selecting detectors, yet none had assessed their supplier's substrate fabrication exposure.
  2. Radiology managers authorised retrofit panel purchases directly within departmental budgets in most surveyed institutions, entirely outside the capital approval process suppliers had assumed governed them.
  3. Breakage rather than image quality dominated how biomedical engineering staff described supplier performance, and drop coverage terms influenced repurchase more than any specification.
  4. International health programme buyers specified ruggedness, battery life and weight above resolution, and reported that no supplier had presented equipment designed against those priorities.
RECOMMENDED STRATEGY
Phase 1: Phase one: commit CMOS qualification capital immediately across the mid-range portfolio, since qualification timelines exceed the announced substrate conversion schedule considerably. Phase 2: Phase two: build a direct and distributor retrofit channel, reaching radiology managers who authorise purchases outside the capital equipment process entirely. Phase 3: Phase three: develop a purpose-built field screening panel against ruggedness and battery specifications rather than adapting an existing hospital product.
OUTCOME
The client committed roughly USD 60 million to CMOS qualification, established a retrofit distribution channel across four markets, and launched a field screening panel (client-reported, unverified by MMA). Retrofit revenue reached a meaningful share within eighteen months, two equipment accounts extended supply agreements citing substrate security, and the field product won its first international programme tender.

Frequently Asked Questions

Foundational context covering the market sizes, CAGR, scope, country, region and competition that inform every finding below. This section is provided to cover basics and most often pre-purchase conversations, answered from the MMA Primary Research Dataset.

What is the current size of the Digital Radiography Sensor Market?

The global digital radiography sensor market was valued at USD 2.7 billion in 2025, spanning amorphous silicon, CMOS, amorphous selenium, photon-counting, phosphor plate and charge-coupled detector technologies. Detectors represent roughly 38% of complete system component cost.

How large will the Digital Radiography Sensor Market be by 2036?

MMA forecasts the market at USD 5.34 billion by 2036, expanding 1.86 times from the 2026 base of USD 2.87 billion. That represents roughly USD 2.47 billion of incremental value across the forecast decade.

What is the CAGR for the Digital Radiography Sensor Market 2026 to 2036?

The base case compound annual growth rate is 6.4%, with a bull case of 7.6% and a bear case of 5.2%. The bull case assumes photon-counting detectors reach general radiography at commercially viable cost.

Which segment is growing fastest?

CMOS indirect conversion panels grow at 9.6%, a full 1.50x the overall market rate. They ride semiconductor fabrication investment funded by consumer and industrial demand rather than by medical imaging volumes.

Who are the major companies in the Digital Radiography Sensor Market?

Varex Imaging, Trixell, Canon Electron Tubes and Devices, Vieworks and iRay Technology together hold 52% of revenue. Varex and Trixell lead through opposite models, one merchant supplier and one captive joint venture.

Which country is growing fastest?

India grows fastest at 10.8%, driven by hospital construction and by tuberculosis screening programmes deploying portable radiography with automated reading. East Asia is the largest region at 30% of value.

Report Segmentation Architecture

The full report scope spans multiple orthogonal segmentation dimensions, with cross-tabulated demand data provided for each dimension pair. Coverage extends further to regional breakdowns, trend trajectories, and the competitive detail needed to support segment-level decision-making.

By Detector Technology

  • Amorphous Silicon Indirect Conversion Panels
  • CMOS Indirect Conversion Panels
  • Amorphous Selenium Direct Conversion Panels
  • Photon-Counting Detectors
  • Computed Radiography Phosphor Plates
  • Charge-Coupled Device Sensors

By End-Use Industry

  • Hospital Radiology Departments
  • Outpatient Imaging and Diagnostic Centres
  • Dental Practices and Clinics
  • Veterinary Practices
  • Mobile and Field Screening Services
  • Orthopaedic and Urgent Care Settings

By Commercial Dimension

  • Equipment Manufacturer Designed-In Supply
  • Retrofit and Upgrade Channel Sales
  • Distributor and Dealer Supply
  • Service, Repair and Exchange Programmes
  • Public Health Programme Procurement
  • Refurbished and Secondary Market Supply

By Region

  • East Asia
  • North America
  • Western Europe
  • South Asia and Pacific
  • Latin America
  • Middle East and Africa
  • Eastern Europe

Scope, Methodology, and Coverage

Every figure in this report is reproducible from documented input assumptions. The scope below maps the historical period, the forecast horizon, the segmentation dimensions, and the countries covered, alongside the underlying primary and qualitative methodology.
Historical Period
2020 to 2025
Forecast Period
2026 to 2036
Base Year
2025 (USD billions; MMA Primary Research Dataset, August 2026)
Market Definition
This market comprises image sensors and detectors used in medical and dental digital radiography, measured at detector manufacturer revenue across equipment manufacturer designed-in supply, retrofit and upgrade channels, distributor supply, service and exchange programmes, public health programme procurement and refurbished secondary supply. Coverage spans amorphous silicon indirect conversion flat panels, CMOS indirect conversion panels, amorphous selenium direct conversion panels, photon-counting detectors entering general radiography, computed radiography photostimulable phosphor plates and their readers, and charge-coupled device sensors including intraoral dental formats. Complete radiography systems, X-ray generators, tubes and collimators, patient positioning and table equipment, computed tomography, fluoroscopy and angiography detectors, mammography systems sold complete, image processing and reporting software sold independently of a detector, and industrial, security or scientific radiography detectors fall outside scope.
Quantitative Units
USD millions (current prices); detector units shipped by technology; installed base; average selling price by format; replacement cycle length; annual failure rate; retrofit share of placements
Segmentation Dimensions
By Detector Technology; By End-Use Industry; By Commercial Dimension; By Region
Regions Covered
East Asia, North America, Western Europe, South Asia and Pacific, Latin America, Middle East and Africa, Eastern Europe
Countries Covered
China, Japan, South Korea, Taiwan, United States, Canada, Mexico, Germany, France, United Kingdom, Italy, Spain, Netherlands, Sweden, India, Australia, Indonesia, Thailand, Vietnam, Philippines, Brazil, Argentina, Colombia, Chile, Saudi Arabia, United Arab Emirates, South Africa, Nigeria, Poland, Romania, Czechia, Turkey, and additional markets relevant to radiography detector analysis
Key Companies Profiled
Varex Imaging, Trixell, Canon Electron Tubes and Devices, Vieworks, iRay Technology, Fujifilm, Konica Minolta, Rayence, DRTECH, Careray Digital Medical, Analogic, Teledyne DALSA, Hamamatsu Photonics, Detection Technology, KA Imaging, JPI Healthcare Solutions, Carestream Health, Agfa-Gevaert, Dexis, Samsung Electronics
Quantitative Methodology
Primary survey, n=3,800 respondents, Q4 2025, six countries; demand-side model with trade association cross-validation
Qualitative Methodology
47 expert interviews, Q4 2025; applied to validate demand model assumptions, identify emerging dynamics, and assess competitive positioning
Report Format
PDF and XLSX data workbook (Word format preview document)
Publisher
Market Minds Advisory
Report Code
MMA-2026-MED-283
Published
August 2026
Contact
sales@marketmindsadvisory.com | www.marketmindsadvisory.com

Purchase the full Digital Radiography Sensor Market Report (2026 to 2036).

The full MMA report examines the supply base beneath digital radiography, quantifying how contracting display fabrication capacity and expanding semiconductor capacity together determine which detector technologies can actually be supplied. It sizes six detector technologies and seven regions to 2036, modelling unit shipments, installed base, pricing, replacement cycles, breakage and retrofit share separately. Competitive assessment covers twenty suppliers on one consistent revenue basis, including captive joint ventures. Cost exposure is traced through substrate, scintillator and semiconductor inputs. Four commercial levers and a strategic verdict close the report, grounded in 47 expert interviews and a 3,800-respondent survey.
Six detector technologies sized separately through 2036
Substrate fabrication exposure mapped against announced capacity changes
Retrofit placements separated from equipment manufacturer designed-in supply
Twenty suppliers assessed on one consistent revenue basis
Breakage and replacement economics quantified across installed base
Anonymised client engagement with tested strategic recommendations

Built For The People Who Decide

From boardroom strategy to bench-side execution, this report is read cover-to-cover by leaders shaping the next decade of their industry, turning demand scenarios, market dynamics and valuation benchmarks into decisions.
CXOs/ Presidents/ VPs/ Managers
M&A and Corporate Development
Strategy Teams and R&D Heads
Procurement and Product Directors
Regulatory and Compliance Leaders
Investor Relations and Equity Analysts