Market Minds Advisory
Digital Education Market

Digital Education Market: Digital Education Market: Institutional Platforms, Household Tutoring and Workforce Credentialing, 2026 to 2036

Households and employers pay for most of this and institutions buy most of the software. The two behave nothing alike, and product investment has been aimed at the wrong one for years.

Lead Analyst

Published

September 2026

Make Smarter Decisions with Customized Research Insights

Request a free sample report and evaluate market opportunities, growth trends, and competitive dynamics relevant to your business needs.

2025 MARKET VALUE$78.4BMarket Size 2025
2036 FORECAST VALUE$242.3BBase Case , 2026 to 2036
CAGR 2026 TO 203610.8 %Bull 12.0% / Bear 9.6%
INCREMENTAL OPPORTUNITY$155.4BNet 10- year value creation
EXPANSION MULTIPLE2.79x2036 value over 2026 base
Strategic Levers
M&A Pipeline
Regional Outlook
Country Rankings
Competitive Intelligence
Segmental Deep-dive
Call-Us : 91 93563 13602

Executive Snapshot and Market Trajectory.

Households and employers fund 64% of what this market earns, while institutions buy most of the software and take 14 months to do it. Those are two different businesses with different buyers, different speeds, and different definitions of success, and very few providers serve both well.
Supplemental tutoring and practice grows at 16.2%, half again the market rate of 10.8%, because a parent paying for an examination result buys quickly and renews on evidence. Workforce upskilling follows behind it. East Asia holds 27% of revenue, on household supplementary education spending that is the highest anywhere and paid almost entirely from private budgets. Examination consequence rather than product quality decides where that spending goes.
Concentration is remarkably low, with the top five holding 19% between them across a category spanning school curriculum, university platforms, tutoring, and professional certification. Usage is the uncomfortable part: courses complete at 12%, and employers use 31% of purchased seats. Nobody purchasing either is measured on those numbers. Providers who can evidence competence rather than enrolment reach an entirely different budget. Neither figure appears in a renewal conversation, which is the whole problem.
Market Definition
This market covers digital learning products and services across school, higher education, and workforce contexts, including learning platforms and management systems, digital curriculum and courseware, assessment and credentialing, supplemental tutoring and practice, workforce upskilling and professional certification, and language learning applications. It excludes printed textbooks and physical materials, classroom hardware and devices, campus administrative and student information systems, and recruitment or staffing services.
Base Year Value
$78.4B in 2025 (MMA Primary Research Dataset, September 2026)
Forecast Period
2026 to 2036, eleven discrete annual values
CAGR
10.8% base case. Bull 12.0%. Bear 9.6%.
Fastest Growth Segment
Supplemental Tutoring And Practice: 16.2% CAGR
Fastest Growth Country
Saudi Arabia: 19.4% CAGR
Fastest Growth Region
South Asia and Pacific: 12.9% CAGR
Largest Region
East Asia: 27% of 2025 global value
Market Leaders
Pearson, New Oriental Education, Coursera, Instructure, and McGraw Hill lead the field. Source: MMA Primary Research Dataset, July 2026.
Primary Survey
n=3,800 procurement and R&D decision-makers, Q4 2025, six countries
Methodology
Demand-side build-up, cross-validated against public data, 47 expert interviews

Digital Education Market Forecast Scenarios

digital-education-market-size-forecast-scenario-1790008866352
Growth between 2020 and 2025 was disrupted rather than steady. School closures produced an enormous and temporary surge in institutional platform purchasing, most of which normalised afterwards, while Chinese regulation removed the largest private tutoring market in the world almost overnight. Historical growth of 9.7% blends that surge, that removal, and a workforce learning segment that grew throughout without either interruption.
The base case at 10.8% rests on three mechanisms. Household spending on supplemental tutoring keeps rising wherever examination outcomes determine university access, which is most of Asia and increasingly elsewhere. Employers continue funding certification where skill shortages are genuine rather than asserted, particularly in technical and healthcare roles. And national education programmes in the Gulf and parts of Africa fund digital curriculum at a scale institutional budgets in mature markets no longer support.
The bull case at 12.0% depends on employers paying for demonstrated competence rather than for licence seats, which would attach real money to completion and change what providers build. The bear case at 9.6% is institutional budget contraction: school and university technology spending is discretionary in a way household tuition is not, and several mature markets are already cutting it.

Two Markets Under One Name

The single most useful thing to do with this category is split it. Institutions buy on committee timelines averaging 14 months, against procurement rules, for products students then use because they are told to. Households and employers fund 64% of revenue, buy in days, and stop paying the moment the thing stops working for them. Nothing about those two businesses is alike. Providers rarely serve both of them well.
TOP FIVE CONCENTRATION19%Share of category revenue held by the leading providers
HOUSEHOLD AND EMPLOYER FUNDING64%Revenue paid by families and employers rather than institutions
SELF-DIRECTED COURSE COMPLETION12%Enrolled learners finishing an unsupervised online course alone
INSTITUTIONAL PROCUREMENT DURATION14 monthsMedian period from evaluation to contract at an institution
LICENCE UTILISATION RATE31%Purchased employer seats used at least once monthly
ANNUAL HOUSEHOLD SPENDINGUSD 340Typical family outlay on supplemental digital learning annually
Household purchasing is the more honest of the two. A parent buying tutoring is paying for a specific examination outcome and can tell within a term whether it is happening, which produces roughly USD 340 of annual spending that renews on evidence rather than on relationship. Providers serving this buyer improve quickly because the feedback is immediate and financial. Institutional software never experiences that kind of feedback.
Employer purchasing sits awkwardly between the two. Licence utilisation runs at 31%, meaning two thirds of purchased seats go unused each month, and nobody in the buying organisation is measured on that. Self-directed completion at 12% tells the same story from the learner side. The money is real and the outcome is largely unexamined. Nobody in the buying organisation is accountable for either figure.
"We keep meeting providers who built for schools and wonder why revenue is hard, while the money sits with parents who will pay USD 340 a year without a procurement process. Institutions are a prestigious customer and a difficult business. Households are the opposite of both, and most product roadmaps still ignore them."
Practice Director, Education Technology and Learning Services · MMA Technology Practice · September 2026

Market Trends

Household Tutoring Spending Follows Examination Consequence

Wherever a single examination determines university access, families treat supplemental tutoring as necessary rather than optional, and spending rises regardless of economic conditions. Supplemental tutoring grows at 16.2% on that logic. The buyer is decisive, pays around USD 340 annually, and renews on evidence of results within a term rather than on any relationship with the provider. Feedback is immediate and financial, which makes this segment improve faster than institutional products do, because failure is visible almost at once. Failure is visible within weeks, which is unfamiliar discipline for institutionally focused organisations.
Market Impact: Drives 19.4% Saudi growth
Employers Fund Certification Where Shortages Are Genuine

Workforce upskilling grows at 14.1%, concentrated where employers cannot hire the skills they need at any price, which in practice means technical, clinical, and regulated roles rather than general professional development. Those programmes attach to a hiring problem and get funded properly. General catalogue licences behave very differently, with utilisation at 31% and nobody accountable for it. Providers that can evidence competence rather than completion reach the first budget; those selling catalogue access compete for the second, which is far more price sensitive. Catalogue access competes on price per seat, and it is reviewed annually.
Market Impact: Segment grows at 12.6%

Market Opportunities and Growth Drivers

National Programmes Fund Curriculum At Population Scale

Gulf and several African governments are funding digital curriculum, teacher development, and assessment as national programmes rather than leaving procurement to individual institutions, which produces contracts far larger than any school budget could support. Saudi growth of 19.4% leads every country covered on that basis. These awards are won through government procurement with local partnership and content localisation requirements attached, which favours providers willing to build for one curriculum rather than sell an existing catalogue. Contracts run for years with renewal competitors cannot realistically contest. Catalogue products cannot satisfy the conditions attached.
Market Impact: Completes at 12% only

Credentialing Separates From The Institutions Awarding Degrees

Employers increasingly accept certifications issued by technology vendors, professional bodies, and specialist providers alongside or instead of academic qualifications, particularly for technical roles where the degree content dates faster than the job does. Assessment and credentialing grows at 12.6%. The commercial consequence is that the assessment itself becomes the product rather than the teaching, and providers holding a credential employers recognise can charge for verification long after the learning was delivered. Verification revenue continues long after the teaching itself was delivered, which is an unusually durable position. Degree content dates faster than the roles do.
Market Impact: Delays contracts by 14 months

Market Restraints and Challenges

Self-Directed Learning Completes At Twelve Percent

Only about 12% of learners finish an unsupervised online course, and the root cause is motivational rather than instructional: nobody is expecting the work, and nothing happens if it stops. Commercially this undermines outcome claims, caps what providers can charge, and makes renewal a matter of habit rather than result. Participants respond with cohort scheduling that creates social obligation, live instruction at intervals, employer reporting that makes non-completion visible, and assessment gates that give finishing a consequence somebody notices. Habit rather than result drives most renewal. Nothing follows from stopping.
Market Impact: Averages USD 340 household spending

Institutional Procurement Runs Fourteen Months To Contract

Median time from evaluation to signed contract at a school district or university is 14 months, and the cause is committee governance and procurement rules rather than any doubt about the product. Commercially this produces long unfunded sales effort, revenue arriving in unpredictable clusters, and products shaped by whoever sits on a committee rather than by whoever uses them. Participants respond through cooperative purchasing vehicles, departmental entry below procurement thresholds, and by pursuing household and employer buyers who decide in days. Household and employer buyers decide in days instead. Committees shape the product.
Market Impact: Segment grows at 14.1%
4 additional market trends, 3 additional growth drivers, and 2 additional restraints and challenges are covered in the full report. Contact sales@marketmindsadvisory.com to access the complete intelligence.

Segment CAGR and Growth Architecture

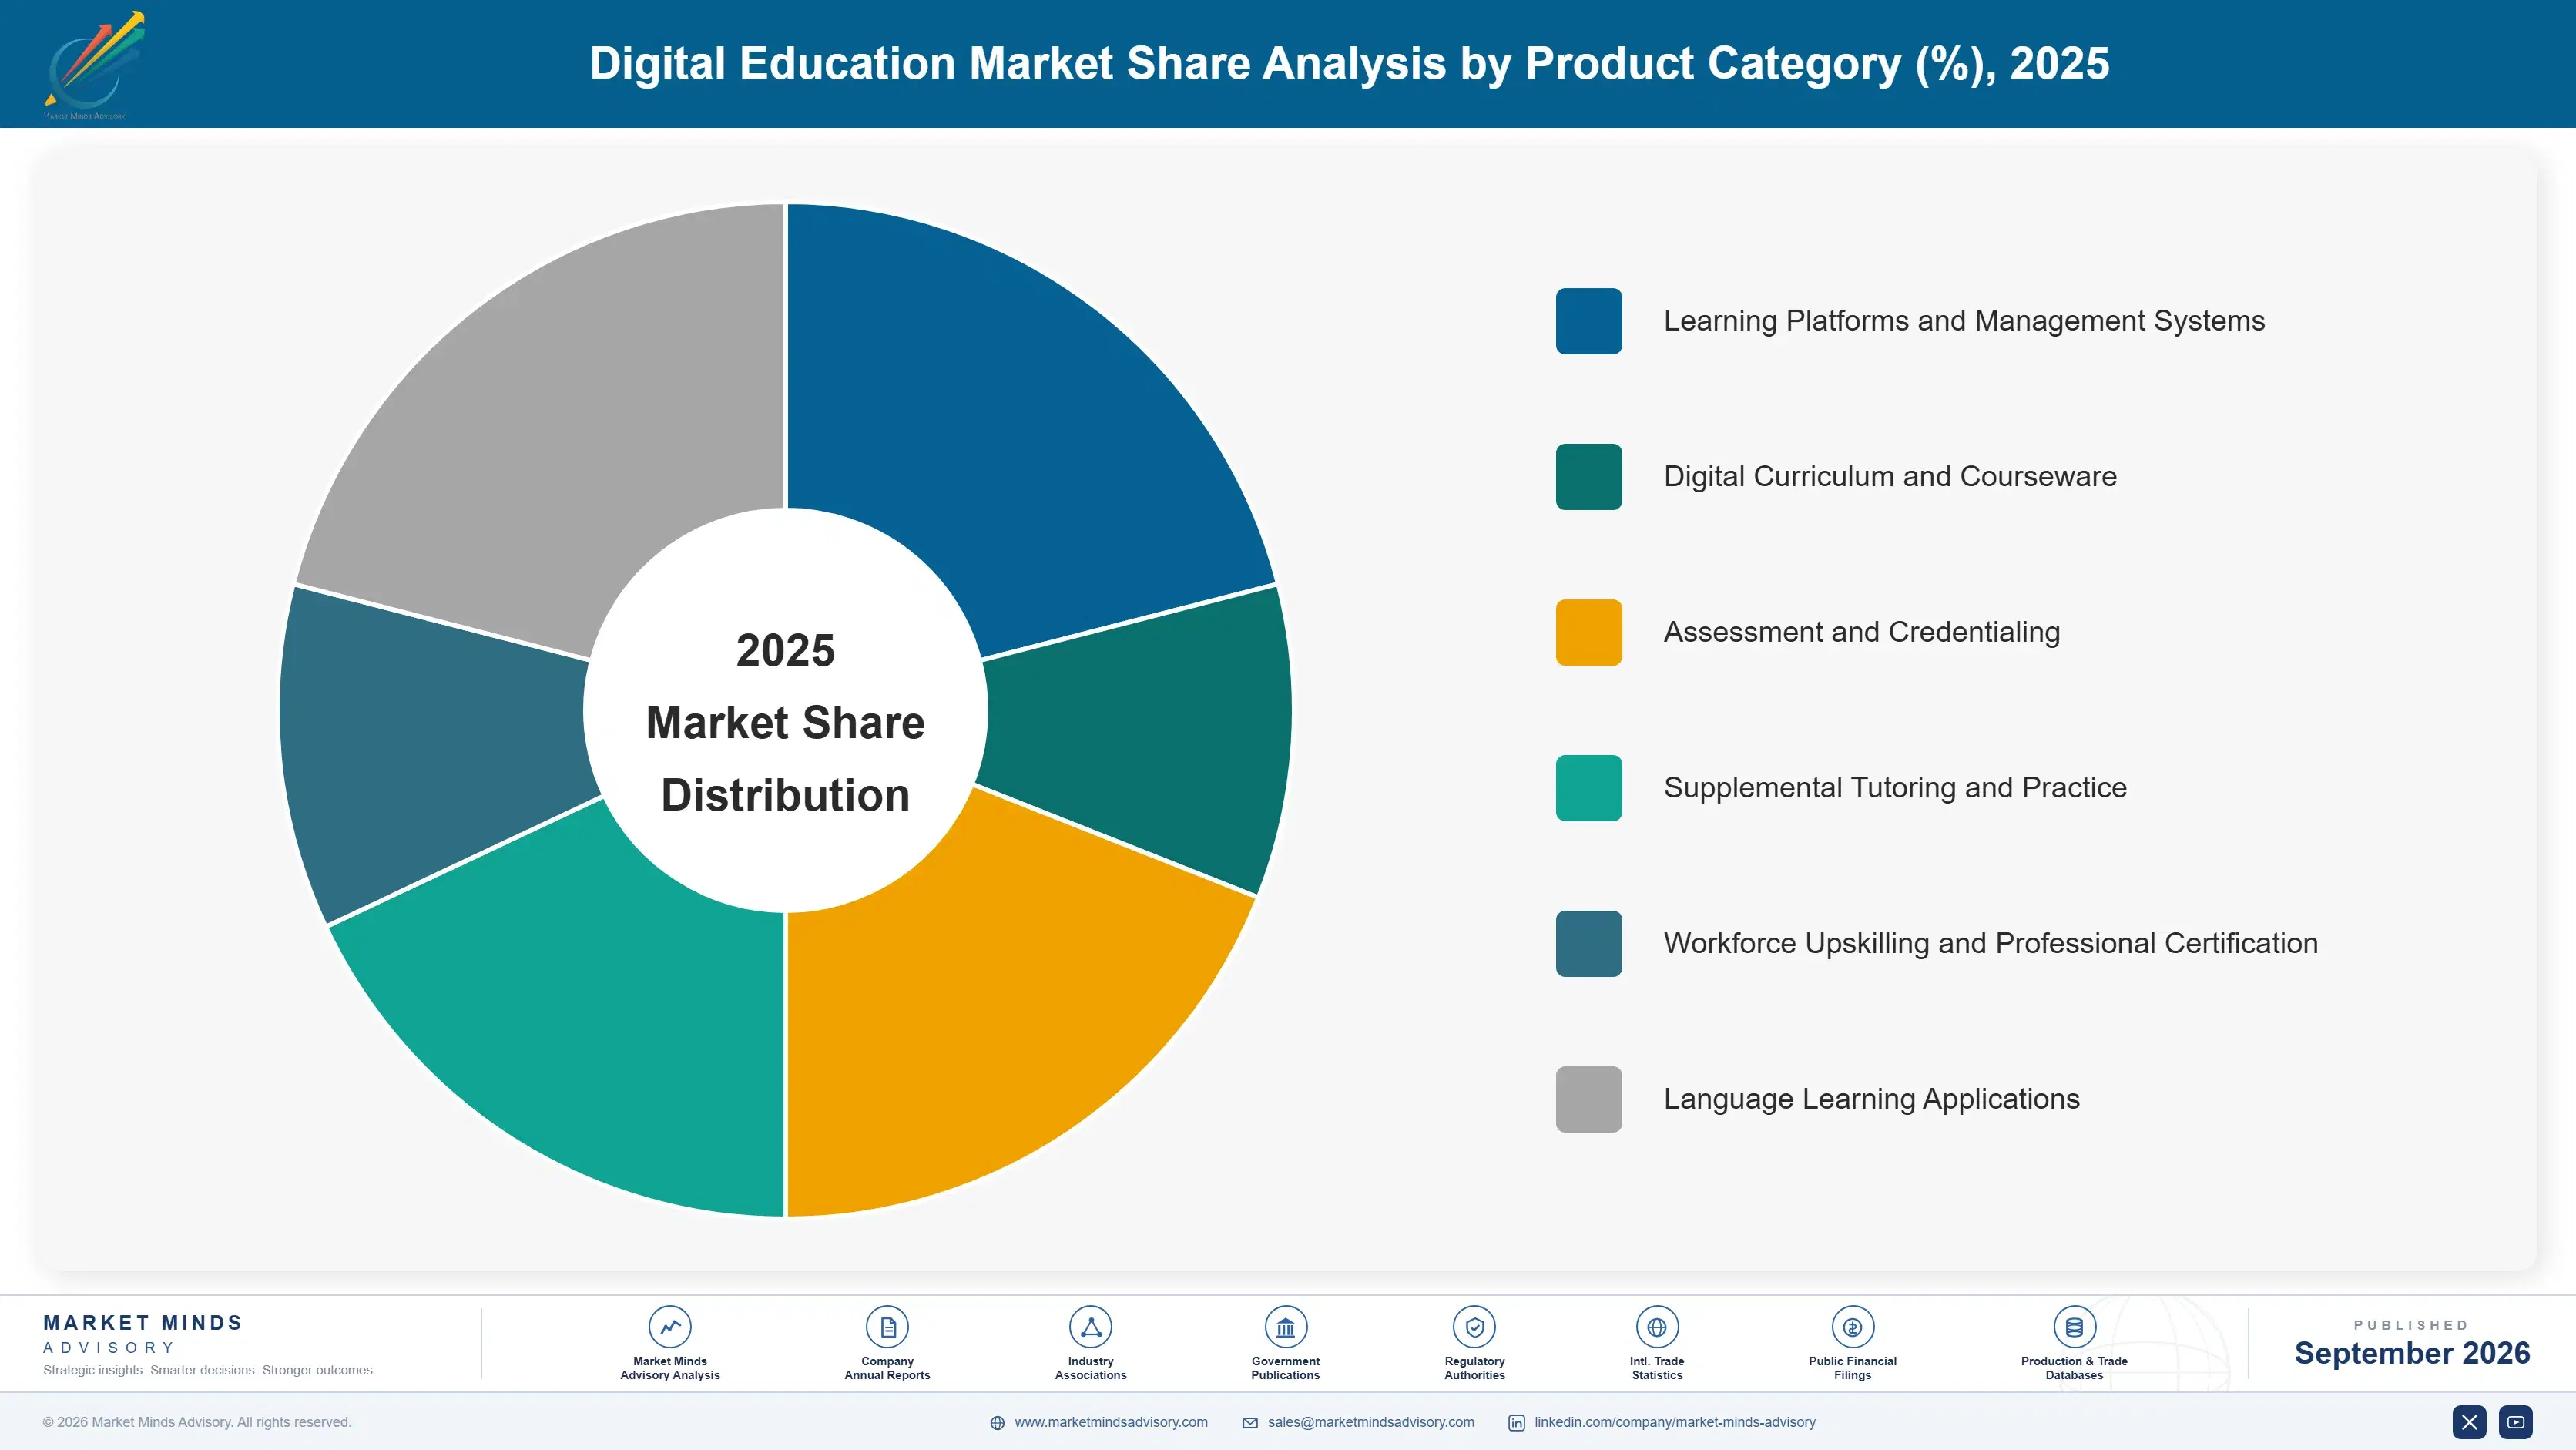
Segmentation follows product category across school, university, and workforce contexts. Six segments cover the market: learning platforms and management systems, digital curriculum and courseware, assessment and credentialing, supplemental tutoring and practice, workforce upskilling and professional certification, and language learning applications. Institutional software grows slowest of the six. Tutoring and certification carry almost all the growth.
digital-education-market-market-share-analysis-1790008866894

Supplemental Tutoring And Practice

Supplemental tutoring grows at 16.2%, half again the market rate of 10.8%, and the buyer is the reason. A parent paying roughly USD 340 a year for examination preparation decides in days, needs no procurement approval, and can tell within a term whether it is working. That feedback loop is immediate and financial, which forces product improvement at a pace institutional software never experiences. It also concentrates the segment wherever a single examination determines university access, which is most of Asia, increasingly the Gulf, and steadily more of Latin America as competition for university places intensifies. University competition intensifies the effect everywhere. Procurement approval never enters the decision at all.
CAGR 16.2%

Workforce Upskilling And Professional Certification

Workforce learning grows at 14.1% and divides sharply into two businesses that look identical on a purchase order. Certification tied to roles an employer cannot fill at any price gets funded properly, evaluated on whether people can do the job afterwards, and renewed on that basis. General catalogue licences run at 31% utilisation with nobody accountable, and they compete almost entirely on price per seat. Providers who can evidence demonstrated competence reach the first budget, which is larger, more defensible, and considerably less exposed to the annual procurement review that catalogue access always faces. Two businesses look identical on a purchase order. Only one of them is defensible over time.
CAGR 14.1%
Full segment breakdown across 6 segments available in the complete report.

Regional Architecture and Country Demand Map

Regional shares follow who pays rather than how many people learn, and household funding dominates in exactly the regions where examinations carry the greatest consequence for a young person. One region falls outside the standard bands, where population and household spending combine. Read it as a map of who pays.

East Asia

Household supplementary education spending here is the highest anywhere and is paid almost entirely from private budgets, which is why the region leads on revenue without leading on institutional software purchasing. Korean and Japanese families fund tutoring at levels no other market approaches, driven by examinations that determine university access decisively. Chinese regulation removed most academic tutoring for school age children, redirecting activity toward vocational, adult, and non-academic learning instead. Growth of 11.8% runs above the world rate, and the private funding base makes it considerably less exposed to public budget decisions than other regions are. Private funding makes the region far less exposed to public budget decisions than any other covered here.
Share: 27% | CAGR: 11.8% (2026 to 2036)

North America

Institutional purchasing is larger here than anywhere else, covering university learning platforms, school district curriculum, and assessment systems, and it moves on committee timelines that providers elsewhere would find intolerable. Employer funded workforce learning is also concentrated here, and it is where the utilisation problem is most visible and least discussed. Growth of 9.8% is moderate, held back by school district budgets under pressure following the end of pandemic funding and by university enrolment declines that reduce platform seat counts directly. University enrolment declines reduce platform seat counts directly, and district budgets have tightened since pandemic funding ended. Workforce utilisation is least discussed here. Institutional purchasing leads globally. Committee timelines remain long.
Share: 26% | CAGR: 9.8% (2026 to 2036)
Regional intelligence for 5 additional markets available in the complete report: Western Europe, South Asia and Pacific, Latin America, Middle East and Africa, Eastern Europe. Contact sales@marketmindsadvisory.com.
digital-education-market-country-cagr-analysis-1790008867411

Where Providers Actually Earn Money

Four commercial moves separate providers with durable revenue from those waiting on institutional procurement. Each recognises that households and employers fund 64% of this market, decide far faster than committees do, and stop paying immediately when the product stops working for them. Institutional committees fund the smaller and slower half of this category. Speed matters here.

Sell To Households Where Examinations Carry Consequence

A parent buying examination preparation decides in days, pays around USD 340 annually without any procurement process, and renews on evidence within a term. Providers serving this buyer report revenue per learner 4.1 times higher than institutional licensing across comparable subject areas, with far shorter sales cycles. The product must actually work, since failure is visible within weeks and the parent simply stops paying, which is an unfamiliar discipline for organisations built around institutional relationships. Institutional organisations find that discipline genuinely unfamiliar. Sales cycles run in days rather than months.
Market Impact: Earns 4.1 times more revenue per learner overall

Attach Certification To Roles Employers Cannot Fill

Workforce budgets divide between certification tied to genuine hiring shortages and general catalogue access running at 31% utilisation with nobody accountable. The first is funded properly and evaluated on whether people can do the job afterwards. Providers evidencing demonstrated competence rather than course completion win those programmes at roughly 3.2 times the rate of catalogue competitors, at contract values several times higher and with far less exposure to annual procurement review. Catalogue competitors never reach that budget. Contract values run several times higher. Procurement review threatens them far less. Shortages fund properly.
Market Impact: Wins 3.2 times more properly funded workforce programmes

Give Completion A Consequence Somebody Notices

Self-directed courses complete at 12% because nobody expects the work and nothing follows from stopping. Cohort scheduling, live sessions at intervals, employer visibility of progress, and assessment gates all create obligation that unsupervised content cannot. Providers introducing these report completion rising to between 34% and 48%, which changes what can be claimed, charged, and renewed against. The delivery cost is real and it converts an unexamined product into one with evidence behind it. Evidence then supports both pricing and renewal. Delivery cost rises genuinely alongside. Obligation is what unsupervised content lacks entirely.
Market Impact: Raises course completion from 12% to roughly 48%

Build For One Curriculum In National Programmes

Government funded programmes in the Gulf and parts of Africa award contracts at population scale, with content localisation, language, and local partnership requirements attached that a catalogue product cannot satisfy. Providers building specifically for one national curriculum win these awards at roughly 2.8 times the rate of those adapting existing material. The investment is substantial and specific, and the resulting contracts run for years with renewal that competitors cannot realistically contest. The investment is substantial and entirely specific. Adapted catalogues lose these consistently. Contracts run for years afterwards. Renewal is uncontested.
Market Impact: Wins 2.8 times more national programme awards overall

Who Controls the Margin Pool

This is the most fragmented category in this study. Five providers hold 19% of revenue, measured consistently on that basis across all participants, and beneath them sit thousands of providers serving single subjects, single examinations, single languages, or single national curricula. The gap between the leader and the fifth is narrow, and no participant holds a defensible position across more than a few of the segments involved.
Competition currently turns on three things: evidence that learners improve rather than enrol, credentials that employers recognise, and localisation depth for national curriculum programmes. Platform functionality differentiates very little now, since learning management systems converged years ago and institutions increasingly treat them as infrastructure rather than as a differentiated purchase. Institutions treat platforms as infrastructure rather than as differentiated purchases now.

Pressure comes from two directions. Free and low cost content, much of it now generated automatically, undermines pricing for anything that is only explanation. Meanwhile technology vendors issuing their own certifications compete directly with education providers for workforce budgets. Rankings will shift toward providers holding assessment and credentials, which is the part that cannot be copied cheaply. Assessment is the part that cannot be copied cheaply.
digital-education-market-company-positioning-matrix-1790008867937

Competitive Moat and Risk Dimensions

PEARSON

Moat: Assessment And Credential Ownership

Owning examinations and qualifications that institutions and employers recognise creates a position that content quality alone never produces, since the credential retains value long after the teaching was delivered. That recognition takes decades to establish and is why assessment revenue holds up while courseware pricing has been under sustained pressure for years.
PEARSON

Risk: Courseware Pricing Under Pressure

Explanation and practice material faces free alternatives, much of it now generated automatically at negligible cost, which erodes pricing for anything that is not attached to an assessment. Defending the wider portfolio means concentrating on credentials and letting content pricing fall, which is uncomfortable for a business built substantially on publishing.
NEW ORIENTAL EDUCATION

Moat: Household Relationship And Reach

Direct relationships with millions of families paying privately for examination preparation produce revenue that no institutional budget decision can remove, and a feedback loop tight enough that products improve at a pace institutionally focused competitors cannot match. Household trust of this kind takes many years to build in any market.
NEW ORIENTAL EDUCATION

Risk: Regulatory Exposure In Core Market

Academic tutoring for school age children was restricted sharply by regulation, which removed a substantial part of the business almost overnight and demonstrated how quickly policy can reshape this category. Rebuilding around vocational, adult, and non-academic learning is progressing and it addresses smaller and less certain demand.

Players Tracked

Prominent Players

Pearson
New Oriental Education
Coursera
Instructure
McGraw Hill

Other Key Players

TAL Education
Duolingo
Udemy
Skillsoft
PowerSchool
Anthology
Docebo
Kahoot
Renaissance Learning
Curriculum Associates
Cengage
Wiley
Age of Learning
D2L
Benesse Holdings

Recent Developments

FEBRUARY 2026

Saudi Education Ministry Awards National Digital Curriculum Contract

A Saudi education authority awarded a multi-year national digital curriculum and assessment contract, with content localisation to the national syllabus, Arabic language delivery, and local partnership requirements written into the award conditions themselves. Teacher development and outcome reporting form part of the same scope. Delivery spans several years.
Signal: National programmes award at population scale and exclude any provider unwilling to build for one curriculum.
SEPTEMBER 2025

Coursera Signs Employer Agreement Priced On Demonstrated Competence

Coursera entered an enterprise agreement with pricing tied to assessed competence rather than to licence seats issued, addressing the utilisation problem that leaves most purchased workforce learning access unused each month across employer estates. Assessment is delivered independently of the learning content itself. Pricing follows assessed outcomes.
Signal: Employers are beginning to pay for demonstrated capability rather than for licence seats that nobody uses.
MAY 2025

Instructure Acquires Assessment And Credentialing Specialist

Instructure completed an acquisition of an assessment and credentialing provider, adding capability in the part of the category that free content cannot undermine and that retains value long after any teaching has been delivered. Item banking and validation capability transferred with the business. Recognition among employers transferred too.
Signal: Platform providers are buying assessment because content alone no longer supports defensible pricing anywhere at all.

What Delivering Learning Costs

Three inputs dominate provider cost. Content development, licensing, and curriculum localisation run 30% to 38% of cost of goods sold. Platform engineering and hosting take 22% to 29%. Learner or institution acquisition adds a further 18% to 26%, and it varies enormously between household buyers reached through advertising and institutions reached through long unfunded sales effort lasting over a year.
Content development costs shifted materially through 2024 and 2025 as automated generation reduced the expense of producing explanation and practice material, while human instruction, assessment validation, and curriculum localisation became relatively more expensive. Several providers described that mix shift in their annual reports for those years, and the cheapening half is precisely the half that faces free alternatives. The cheapening half faces free alternatives directly.

The competitive disadvantage mechanism runs through acquisition rather than through content. A provider selling to institutions carries fourteen months of unfunded effort per contract, while a household focused competitor converts in days at advertising cost. Exposure varies by buyer type. Household and employer providers recover acquisition within a subscription year. Institutional providers carry it across a sales cycle longer than most product roadmaps.
digital-education-market-cost-volatility-analysis-1790008868134

Concentrate Content Investment On Assessment Not Explanation

Explanation and practice material now faces free alternatives produced at negligible cost, while validated assessment retains value and cannot be replicated cheaply. Shifting content investment toward assessment design, item banking, and validation protects pricing in the one part of the offering that automated generation does not undermine. Automated generation does not touch validated assessment.

Enter Institutions Below Procurement Thresholds

Fourteen month procurement applies to contracts above institutional approval limits, and departmental purchases frequently sit beneath them. Entering through a single faculty or subject department converts a year long committee process into a weeks long decision, and the resulting usage evidence makes the eventual institution wide contract considerably easier to win. Usage evidence follows quickly.

Use Cohort Delivery To Improve Completion Economics

Scheduled cohorts with live sessions cost more to deliver than self-directed content and complete at several times the rate, which changes what can be charged and renewed. The additional delivery expense is recovered through pricing that outcome evidence supports, and through renewal rates that unsupervised content has never achieved. Unsupervised content has never achieved comparable renewal.

Portfolio Architecture for Margin Defence

Margin follows whether the offering can be copied for nothing. Self-directed explanation and practice content is close to worthless commercially, since automated generation produces adequate substitutes at negligible cost. Platform licensing earns moderately on switching cost rather than capability. Assessment, recognised credentials, and cohort delivery with human instruction earn most, because none can be replicated cheaply and each carries evidence somebody will pay for. Replicability sets the entire margin ladder here.
The tension between volume and premium runs through completion. Self-directed learning scales to any number of learners at almost no marginal cost and completes at 12%, which produces revenue without outcomes and eventually without renewals. Cohort and instructed delivery scales with instructor capacity and produces the evidence that supports pricing, which is a far better business on much smaller numbers. Evidence supports pricing that scale alone never will.

High-value pools concentrate where somebody is measured on the result: household tutoring against an examination, certification for roles an employer cannot fill, and national curriculum programmes with published outcome targets. These share a buyer facing a consequence. Where nobody is measured, which describes most catalogue licensing, procurement compares price per seat and the product is effectively a commodity.

Volume / Commodity-Adjacent

Self-directed explanation and practice content and general catalogue licensing, facing free alternatives produced automatically at negligible cost. Completion at 12% and utilisation at 31% undermine any outcome claim. The twelve-point range reflects wide variation in acquisition cost between household and institutional channels.
Gross Margin: 42% to 54%

Premium / Certified

Learning platforms, institutional courseware, and language learning where switching cost and curriculum alignment sustain pricing. Institutions treat platforms as infrastructure rather than as differentiated purchases. The ten-point range separates providers entering below procurement thresholds from those carrying full committee sales cycles.
Gross Margin: 58% to 68%

Sustainability / Regulatory / Next-Generation

Assessment, recognised credentials, cohort delivery with instruction, and national curriculum programmes. None can be replicated cheaply and each carries outcome evidence. The twelve-point range reflects how differently credential recognition and national programme localisation are priced across markets.
Gross Margin: 66% to 78%
digital-education-market-portfolio-architecture-1790008868636

High-value Sub-segments and Strategic Watch-out

Assessment And Recognised Credentials

Highest value in the category and the part free content cannot undermine, since a credential retains value long after teaching was delivered. Recognition takes decades to build. The twelve-point range reflects how differently established and newer credentials are priced by employers and institutions. Recognition is the moat.
Gross Margin: 68% to 80%

Household Examination Preparation

Fastest growth at 16.2%, funded privately at around USD 340 annually with no procurement process and renewal on evidence within a term. Feedback is immediate and financial. The eleven-point range reflects acquisition cost differences between organic reputation and paid advertising channels. Results decide renewal. Feedback is immediate.
Gross Margin: 60% to 71%

Shortage Driven Workforce Certification

Growing at 14.1% where employers cannot hire the skills at any price, evaluated on whether people can do the job afterwards. Funded properly and reviewed rarely. Providers evidencing competence rather than completion reach this budget instead of the catalogue one. Shortages fund it properly. Review is infrequent.
Gross Margin: 62% to 73%

General Catalogue Licence Access

The strategic watch-out. Utilisation runs at 31%, nobody in the buying organisation is accountable for it, and competition is entirely on price per seat. The fourteen-point range reflects the gap between providers with proprietary content and those reselling largely commoditised material. Price per seat decides everything.
Gross Margin: 38% to 52%

How This Revenue Repeats

Renewal behaviour splits along the same line as everything else here. Institutions renew almost automatically once a platform is embedded in timetabling, assessment, and staff habit, because replacing it disrupts teaching for a year. Households renew term by term on visible results and leave without ceremony when they stop appearing. Employers renew on budget cycles largely without examining whether anybody used what they bought.
Engagement depth varies by consequence rather than by product quality. A learner preparing for an examination that determines university access engages intensively without any prompting. A professional issued a catalogue licence by human resources engages at 31% utilisation. The difference is not instructional design, and providers who treat it as an engagement problem to be solved with features are misreading it entirely.

The buyer has been changing steadily and providers have been slow to follow. Institutional technology committees drove purchasing for two decades and still control a substantial minority of spending. Parents, individual professionals, and employers with named hiring shortages now fund 64% of revenue and decide in days rather than months. Product organisations built around institutional requirements are serving the smaller and slower half.
digital-education-market-end-use-penetration-index-1790008869128

Where This Market Rewards

These are among the four positions where our research anticipates prominent divergence between winners and laggards over the coming forecast period. Each is grounded in the demand model, the regulatory perimeter, and the announced capacity pipeline.
01 / BUYER SEPARATION DISCIPLINE

Households pay most and decide in days

Households and employers fund 64% of this market while institutions absorb most product investment and take 14 months from evaluation to contract, which are two businesses with nothing meaningful in common beyond the word education. Providers serving household buyers report revenue per learner 4.1 times higher across comparable subjects, on sales cycles measured in days. The product has to genuinely work, because failure is visible within weeks and the parent simply stops paying, which concentrates the mind considerably for everybody involved.
02 / COMPLETION CONSEQUENCE DESIGN

Nothing happens when a learner stops, so they stop

Self-directed courses complete at 12% because nobody expects the work and no consequence follows abandoning it, which undermines every outcome claim a provider might want to make about them. Cohort scheduling, live sessions, employer progress visibility, and assessment gates lift completion to between 34% and 48%. Delivery cost rises genuinely, and it converts an unexamined product into one carrying evidence that supports both pricing and renewal, which unsupervised content has never been able to offer to any buyer at any price.
03 / CREDENTIAL VALUE OWNERSHIP

Explanation is free now; assessment is not

Automated generation produces adequate explanation and practice material at negligible cost, which has removed pricing power from anything that is only teaching, while validated assessment and recognised credentials retain value long after delivery. Recognition takes decades to establish and cannot be replicated cheaply by anybody. Providers concentrating content investment on assessment design, item banking, and validation protect the one part of the offering free alternatives do not touch, and it is where the durable pricing now sits across this category.
04 / NATIONAL PROGRAMME POSITIONING

Localisation wins what catalogues never will

Gulf and African governments fund digital curriculum, teacher development, and assessment as national programmes at a scale institutional budgets elsewhere cannot approach, with Saudi growth of 19.4% leading every country covered. Awards carry content localisation, language, and local partnership requirements that catalogue products cannot satisfy. Providers building for one national curriculum win these at roughly 2.8 times the rate of those adapting existing material, on contracts running years with renewal nobody contests, running for years at a time without serious contest.

Engagement Snapshot From the Field

A live engagement with an industry participant carrying material or product regulatory and market exposure ahead of a defining policy shift, showing how our research translates into a defensible multi-year portfolio strategy.
MARKET MINDS ADVISORY · CLIENT ENGAGEMENT SUMMARY
Digital Education Producer Strategic Portfolio Review and Transition Roadmap 2026·Investment Scenario on Digital Education Exposure Evaluation 2025-26
CLIENT PROFILE
A workforce learning provider with approximately 2,100 enterprise customers and annual revenue near USD 310 million (client-reported, unverified by MMA), selling catalogue licence access priced per seat. Renewal rates had declined for six consecutive quarters, and procurement conversations had become entirely about price per seat rather than about anything the product delivered. Catalogue breadth was the entire sales argument.
STRATEGIC CHALLENGE
Customers were reducing seat counts at renewal while insisting the content was good, which management found contradictory. Nobody had examined utilisation across the customer base, and the sales organisation was structured entirely around catalogue breadth as the competitive argument in a market where competitors offered comparable breadth. Competitors offered comparable breadth at similar prices.
MMA APPROACH
MMA measured licence utilisation and completion across the customer base, separated customers by whether the programme addressed a named hiring shortage, and compared renewal behaviour and pricing between the two groups. Competitor positioning was assessed on whether providers sold access or evidenced competence. Renewal behaviour was compared between the two groups.
KEY FINDINGS
  1. Licence utilisation averaged 29% across the base, and customers renewing at reduced seat counts were the ones who had measured it themselves for the first time.
  2. Customers whose programmes addressed a named hiring shortage renewed at full value and had never questioned price, though they represented under a fifth of the customer base.
  3. Completion on self-directed content stood at 11%, while the small number of cohort delivered programmes completed at 44% and carried materially higher renewal.
  4. Competitors positioning on assessed competence rather than catalogue access were winning the shortage driven programmes that the provider had never specifically pursued.
CLIENT PROFILE
A workforce learning provider with approximately 2,100 enterprise customers and annual revenue near USD 310 million (client-reported, unverified by MMA), selling catalogue licence access priced per seat. Renewal rates had declined for six consecutive quarters, and procurement conversations had become entirely about price per seat rather than about anything the product delivered. Catalogue breadth was the entire sales argument.
STRATEGIC CHALLENGE
Customers were reducing seat counts at renewal while insisting the content was good, which management found contradictory. Nobody had examined utilisation across the customer base, and the sales organisation was structured entirely around catalogue breadth as the competitive argument in a market where competitors offered comparable breadth. Competitors offered comparable breadth at similar prices.
MMA APPROACH
MMA measured licence utilisation and completion across the customer base, separated customers by whether the programme addressed a named hiring shortage, and compared renewal behaviour and pricing between the two groups. Competitor positioning was assessed on whether providers sold access or evidenced competence. Renewal behaviour was compared between the two groups.
KEY FINDINGS
  1. Licence utilisation averaged 29% across the base, and customers renewing at reduced seat counts were the ones who had measured it themselves for the first time.
  2. Customers whose programmes addressed a named hiring shortage renewed at full value and had never questioned price, though they represented under a fifth of the customer base.
  3. Completion on self-directed content stood at 11%, while the small number of cohort delivered programmes completed at 44% and carried materially higher renewal.
  4. Competitors positioning on assessed competence rather than catalogue access were winning the shortage driven programmes that the provider had never specifically pursued.
RECOMMENDED STRATEGY
Phase 1: Phase one: identify customers with named hiring shortages and rebuild those relationships around assessed competence, pricing on capability rather than on seats issued. Phase 2: Phase two: move the highest value programmes to cohort delivery with scheduled sessions, accepting higher delivery cost in exchange for completion and renewal evidence. Phase 3: Phase three: reprice general catalogue access explicitly as a low cost tier rather than defending it, and stop building the sales argument around breadth.
OUTCOME
Revenue fell 4% in the first year as catalogue pricing was reset, then grew 17% in the second as competence priced programmes expanded (client-reported, unverified by MMA). Renewal value stabilised for the first time in two years. Cohort programmes reached a third of revenue within eighteen months.

Frequently Asked Questions

Foundational context covering the market sizes, CAGR, scope, country, region and competition that inform every finding below. This section is provided to cover basics and most often pre-purchase conversations, answered from the MMA Primary Research Dataset.

What is the current size of the Digital Education Market?

The market was worth USD 78.4 billion in 2025 and reaches USD 86.9 billion in 2026. Value covers digital learning products and services across school, university, and workforce contexts.

How large will the Digital Education Market be by 2036?

MMA forecasts USD 242.3 billion by 2036, an increase of USD 155.4 billion across the forecast period. That represents 2.79 times the 2026 base of USD 86.9 billion.

What is the CAGR for the Digital Education Market 2026 to 2036?

The base case compound annual growth rate is 10.8%, with a bull case at 12.0% and a bear case at 9.6%. Historical growth from 2020 to 2025 ran at 9.7%.

Which segment is growing fastest?

Supplemental tutoring and practice grows at 16.2%, half again the market rate of 10.8%. Households buy it directly and renew on visible examination results within a term.

Who are the major companies in the Digital Education Market?

Pearson, New Oriental Education, Coursera, Instructure, and McGraw Hill lead, holding only 19% of revenue between them. This is the most fragmented category we cover.

Which country is growing fastest?

Saudi Arabia grows at 19.4%, on national programmes funding digital curriculum, teacher development, and assessment at a scale institutional budgets elsewhere cannot approach at all.

Report Segmentation Architecture

The full report scope spans multiple orthogonal segmentation dimensions, with cross-tabulated demand data provided for each dimension pair. Coverage extends further to regional breakdowns, trend trajectories, and the competitive detail needed to support segment-level decision-making.

By Product Category

  • Learning Platforms and Management Systems
  • Digital Curriculum and Courseware
  • Assessment and Credentialing
  • Supplemental Tutoring and Practice
  • Workforce Upskilling and Professional Certification
  • Language Learning Applications

By End-Use Industry

  • Primary and Secondary Schools
  • Higher Education Institutions
  • Corporate and Enterprise Employers
  • Government and National Education Programmes
  • Healthcare and Regulated Professions
  • Individual Learners and Households

By Commercial Dimension

  • Institutional Procurement Contract
  • Household Direct Subscription
  • Employer Enterprise Licence
  • Government National Programme Award
  • Cooperative Purchasing Vehicle
  • Assessment and Credential Fee

By Region

  • East Asia
  • North America
  • Western Europe
  • South Asia and Pacific
  • Latin America
  • Middle East and Africa
  • Eastern Europe

Scope, Methodology, and Coverage

Every figure in this report is reproducible from documented input assumptions. The scope below maps the historical period, the forecast horizon, the segmentation dimensions, and the countries covered, alongside the underlying primary and qualitative methodology.
Historical Period
2020 to 2025
Forecast Period
2026 to 2036
Base Year
2025 (USD billions; MMA Primary Research Dataset, September 2026)
Market Definition
This market covers digital learning products and services across school, higher education, and workforce contexts, including learning platforms and management systems, digital curriculum and courseware, assessment and credentialing, supplemental tutoring and practice, workforce upskilling and professional certification, and language learning applications. It excludes printed textbooks and physical materials, classroom hardware and devices, campus administrative and student information systems, and recruitment or staffing services.
Quantitative Units
USD billions, digital learning product and service revenue
Segmentation Dimensions
Product category, end-use industry, commercial dimension, region
Regions Covered
East Asia, North America, Western Europe, South Asia and Pacific, Latin America, Middle East and Africa, Eastern Europe
Countries Covered
China, Japan, South Korea, Taiwan, United States, Canada, Mexico, United Kingdom, Germany, France, Spain, Italy, Netherlands, Sweden, India, Indonesia, Vietnam, Philippines, Australia, Brazil, Colombia, Chile, Saudi Arabia, United Arab Emirates, Egypt, Nigeria, Kenya, South Africa, Poland, Romania
Key Companies Profiled
Pearson, New Oriental Education, Coursera, Instructure, McGraw Hill, TAL Education, Duolingo, Udemy, Skillsoft, PowerSchool, Anthology, Docebo, Kahoot, Renaissance Learning, Curriculum Associates, Cengage, Wiley, Age of Learning, D2L, Benesse Holdings
Quantitative Methodology
Primary survey, n=3,800 respondents, Q4 2025, six countries; demand-side model with trade association cross-validation
Qualitative Methodology
47 expert interviews, Q4 2025; applied to validate demand model assumptions, identify emerging dynamics, and assess competitive positioning
Report Format
PDF and XLSX data workbook (Word format preview document)
Publisher
Market Minds Advisory
Report Code
MMA-2026-TEC-611
Published
September 2026
Contact
sales@marketmindsadvisory.com | www.marketmindsadvisory.com

Purchase the full Digital Education Market Report (2026 to 2036).

The full report sizes the digital education market across six product categories, seven regions, and thirty countries, with forecasts to 2036 under base, bull, and bear cases. It separates household and employer funding from institutional purchasing, which behave nothing alike, and examines what completion at twelve percent and licence utilisation at thirty one percent mean for outcome claims and pricing. Competitive analysis covers twenty participants evaluated consistently on category revenue, with detailed treatment of assessment ownership and national curriculum programmes. Cost structure, margin architecture by category, and regional funding drivers are analysed in full. Primary research includes 3,800 survey responses and 47 expert interviews.
Six product categories sized and forecast separately
Twenty participants evaluated on category revenue consistently
Regional funding source drivers across seven geographies assessed
Margin architecture by category and buyer type
Completion and licence utilisation analysis with cohort comparison
Institutional procurement duration benchmarks by institution type

Built For The People Who Decide

From boardroom strategy to bench-side execution, this report is read cover-to-cover by leaders shaping the next decade of their industry, turning demand scenarios, market dynamics and valuation benchmarks into decisions.
CXOs/ Presidents/ VPs/ Managers
M&A and Corporate Development
Strategy Teams and R&D Heads
Procurement and Product Directors
Regulatory and Compliance Leaders
Investor Relations and Equity Analysts