Market Minds Advisory
Diamond Wire Market

Diamond Wire Market: Wafering and Sawing Consumables Across Solar, Semiconductor and Stone Cutting, 2026 to 2036

Every micron shaved off wire diameter turns directly into silicon that is no longer wasted as sawdust, which is why an abrasive consumable now sits on the critical path of solar cost reduction.

Lead Analyst

Bilal Shaikh

Published

September 2026

Make Smarter Decisions with Customized Research Insights

Request a free sample report and evaluate market opportunities, growth trends, and competitive dynamics relevant to your business needs.

2025 MARKET VALUE$2.8BMarket Size 2025
2036 FORECAST VALUE$6.5BBase Case , 2026 to 2036
CAGR 2026 TO 20368.0 %Bull 9.2% / Bear 6.9%
INCREMENTAL OPPORTUNITY$3.5BNet 10- year value creation
EXPANSION MULTIPLE2.16x2036 value over 2026 base
Strategic Levers
M&A Pipeline
Regional Outlook
Country Rankings
Competitive Intelligence
Segmental Deep-dive
Call-Us : 91 93563 13602

Executive Snapshot and Market Trajectory

Diamond wire is an abrasive consumable that ended up on the critical path of solar cost reduction. Wire diameter now sits near 36 microns and kerf loss near 48 microns, so every micron removed from the wire converts directly into silicon that is no longer turned into sawdust.
Growth concentrates in tungsten core diamond wire, expanding at 12.0%, because tungsten holds tensile strength at diameters where high carbon steel simply breaks, and thinner wire remains the only route left to lower kerf. East Asia holds 58% of value, far outside the band this report applies elsewhere, because photovoltaic wafer manufacture and diamond wire production are both concentrated in China to a degree that no other industrial consumable comes close to matching.
The supplier base is concentrated at 57% for the top five, and it splits between Chinese wafering wire producers operating at enormous scale and the Japanese and European makers serving semiconductor, sapphire and stone cutting instead. Competition runs on breakage rate and consumption per wafer rather than on any price per kilometre. Tungsten availability, following the export controls introduced during 2025, is now the constraint everybody is watching closely.
Market Definition
The market comprises diamond abrasive wire manufactured for precision and industrial cutting, spanning tungsten core diamond wire, ultrafine steel core wire, resin bonded diamond wire, standard electroplated steel core wire, and beaded diamond wire for stone and construction. Sizing captures wire revenue at realised delivered price across photovoltaic silicon wafering, semiconductor and sapphire slicing, magnetic and specialty material cutting, stone quarrying and processing, and concrete and demolition cutting. Wire saw machines and slicing equipment, diamond micropowder and abrasive grit sold as raw material, slurry-based wafering consumables, and blade and core drilling tools fall outside scope.
Base Year Value
$2.8B in 2025 (MMA Primary Research Dataset, August 2026)
Forecast Period
2026 to 2036, eleven discrete annual values
CAGR
8.0% base case. Bull 9.2%. Bear 6.9%.
Fastest Growth Segment
Tungsten Core Diamond Wire: 12.0% CAGR
Fastest Growth Country
India: 10.7% CAGR
Fastest Growth Region
South Asia and Pacific: 10.1% CAGR
Largest Region
East Asia: 58% of 2025 global value
Market Leaders
Yicheng New Energy, Qingdao Gaoce Technology, Meike New Materials, Asahi Diamond Industrial, Nakamura Choukou. Source: MMA Analysis based on company annual reports.
Primary Survey
n=3,800 procurement and R&D decision-makers, Q4 2025, six countries
Methodology
Demand-side build-up, cross-validated against public data, 47 expert interviews

Diamond Wire Market Forecast Scenarios

diamond-wire-market-trends-size-forecast-scenario-1787310645323
Growth of 6.7% across 2020 to 2025 combined enormous volume expansion with severe price deflation, which is the pattern anybody supplying solar recognises. Photovoltaic wafer output rose several times over, wire consumption rose with it, and Chinese producers competed prices down so aggressively that revenue grew far more slowly than the kilometres shipped. Several smaller wire makers did not survive it.
The base case at 8.0% rests on three mechanisms. Photovoltaic wafer output keeps growing with installed solar capacity, and each wafer consumes roughly 2.1 metres of wire regardless of price. Wire diameter keeps falling toward and below 36 microns, which requires tungsten cores that cost several times more than steel and lift value per kilometre sharply. And semiconductor and sapphire slicing grows steadily on separate demand at higher prices per kilometre.
The bull case at 9.2% turns on tungsten core conversion running faster than currently modelled, since the value uplift per kilometre is substantial and the silicon saving justifies it at almost any tungsten price at all. The bear case at 6.9% turns on the same variable inverted. Chinese export controls on tungsten could constrain core availability enough to slow conversion and push the industry back toward steel.

What Actually Determines Diamond Wire Value

The commercial logic here runs through silicon rather than through wire. A wafer manufacturer buys wire at a few dollars per kilometre and loses polysilicon worth vastly more as kerf on every cut, so the relevant comparison is total silicon yield per ingot rather than wire price. A wire that is two microns thinner and breaks no more often pays for a substantial premium several times over, and manufacturers who model it properly buy accordingly.
TOP FIVE SHARE57%Concentration of diamond wire length supplied across the largest producers
WAFERING WIRE DIAMETER36 micronsCore diameter now standard for photovoltaic silicon wafer slicing
KERF LOSS PER CUT48 micronsSilicon lost as sawdust on each wafer slicing pass
WIRE PER WAFER2.1 metresWire length consumed producing one photovoltaic silicon wafer
CORE WIRE COST SHARE44%Core wire share of finished diamond wire production cost
ABRASIVE GRIT SIZE6 micronsMedian diamond particle size electroplated onto wafering wire
Breakage is the constraint that limits how thin anybody can go. A wire break stops the saw, wastes the partially cut ingot section and costs production time worth far more than the wire itself, which is why diameter reduction has been gradual rather than abrupt. Tungsten cores changed that calculation, holding tensile strength at diameters where high carbon steel fails, and conversion has moved quickly as a result.
Two quite different businesses share this market definition and behave nothing alike. Wafering wire is a high-volume, deflationary consumable sold to a handful of enormous Chinese customers. Stone and construction wire is a fragmented, regionally distributed business with stable pricing, where a beaded wire cutting granite shares almost nothing with a 36 micron wire slicing silicon.
"Wafer manufacturers spent years negotiating wire down to the last cent per kilometre while throwing away silicon worth many times that as sawdust on every single cut. The producers who worked out how to sell kerf reduction rather than wire are the ones who survived the price war, and there were not many of them."
Director, Precision Consumables and Photovoltaic Manufacturing Practice · MMA Co

Market Trends

Tungsten Cores Replace Steel Below Forty Microns

High carbon steel core wire reaches a practical limit around 40 microns, below which tensile strength falls away and breakage rates rise beyond what a wafer line tolerates. Tungsten holds strength considerably further down, which has made it the enabling material for the diameter reduction the industry needs. Roughly 34% of photovoltaic wafering wire now uses tungsten cores against almost none three years ago. Tungsten costs several times more than steel, and the silicon saved justifies it comfortably, which is why conversion has moved faster than most forecasts allowed for.
Market Impact: Exceeds 750 gigawatts wafer output
Chinese Export Controls Reach Tungsten Core Supply

Tungsten was brought within Chinese export control measures during 2025, and since Chinese production dominates global tungsten supply, that has introduced genuine uncertainty into exactly the material the wafering industry has just committed to. Roughly 82% of world tungsten output originates inside China itself. Wire producers outside China face core availability questions they had not previously modelled, and Western wafer manufacturers building capacity under subsidy have discovered a dependency in a consumable that nobody had listed as strategic until very recently indeed. Recycled tungsten is the only quick alternative available.
Market Impact: Kerf loss reaches 48 microns

Market Opportunities and Growth Drivers

Photovoltaic Wafer Output Drives Volume Growth Directly

Each photovoltaic silicon wafer consumes roughly 2.1 metres of diamond wire, and wafer output tracks global solar installation with a modest lead ahead of it. Annual wafer production now exceeds 750 gigawatts of equivalent capacity and continues rising steadily. That relationship makes wire volume demand unusually forecastable, since installation forecasts are published and wafer capacity is announced years ahead. What it does not make predictable is price, which Chinese competition has driven down continuously and which shows no sign of stabilising anywhere. Volume and value have diverged sharply as a result.
Market Impact: Wire consumption is 2.1 metres

Kerf Reduction Delivers Silicon Savings Worth Paying For

Kerf loss near 48 microns means a meaningful share of every ingot ends up destroyed as sawdust rather than converted into saleable wafers, and polysilicon remains comfortably the single largest input cost in wafer manufacture. Reducing kerf by even a few microns recovers silicon worth several times the wire premium involved. Around 61% of wafer manufacturers now evaluate wire on cost per wafer produced rather than on price per kilometre supplied, which has rewarded producers who can demonstrate that calculation credibly using real production line data rather than laboratory claims.
Market Impact: China holds 82% of supply

Market Restraints and Challenges

Wafering Price Deflation Outpaces Volume Growth Persistently

Chinese wire producers competed prices down through the solar expansion so aggressively that revenue has grown far more slowly than kilometres shipped, and the root cause is straightforward overcapacity in a market where a handful of enormous customers buy from many suppliers. Commercially this has removed several smaller producers from the market entirely and compressed margins even at considerable scale. Participants are responding with tungsten core products carrying genuine value uplift, with diversification into semiconductor and sapphire slicing, and with long-term agreements that trade some price for genuine volume certainty.
Market Impact: Reaches 34% of wafering wire

Tungsten Supply Concentration Threatens Conversion Momentum

Roughly 82% of world tungsten originates in China, and the material was brought within export control measures during 2025, which creates a supply question for the core material that thinner wire depends on entirely. The root cause is geological and industrial concentration built up over several decades. Commercially it exposes wire producers and wafer manufacturers outside China to availability risk in a consumable nobody previously treated as strategic. Mitigation runs through non-Chinese tungsten sourcing, recycling of tungsten from spent wire, and continued development of ultrafine steel core alternatives as a hedge.
Market Impact: China holds 82% of tungsten
4 additional market trends, 3 additional growth drivers, and 2 additional restraints and challenges are covered in the full report. Contact sales@marketmindsadvisory.com to access the complete intelligence.

Segment CAGR and Growth Architecture

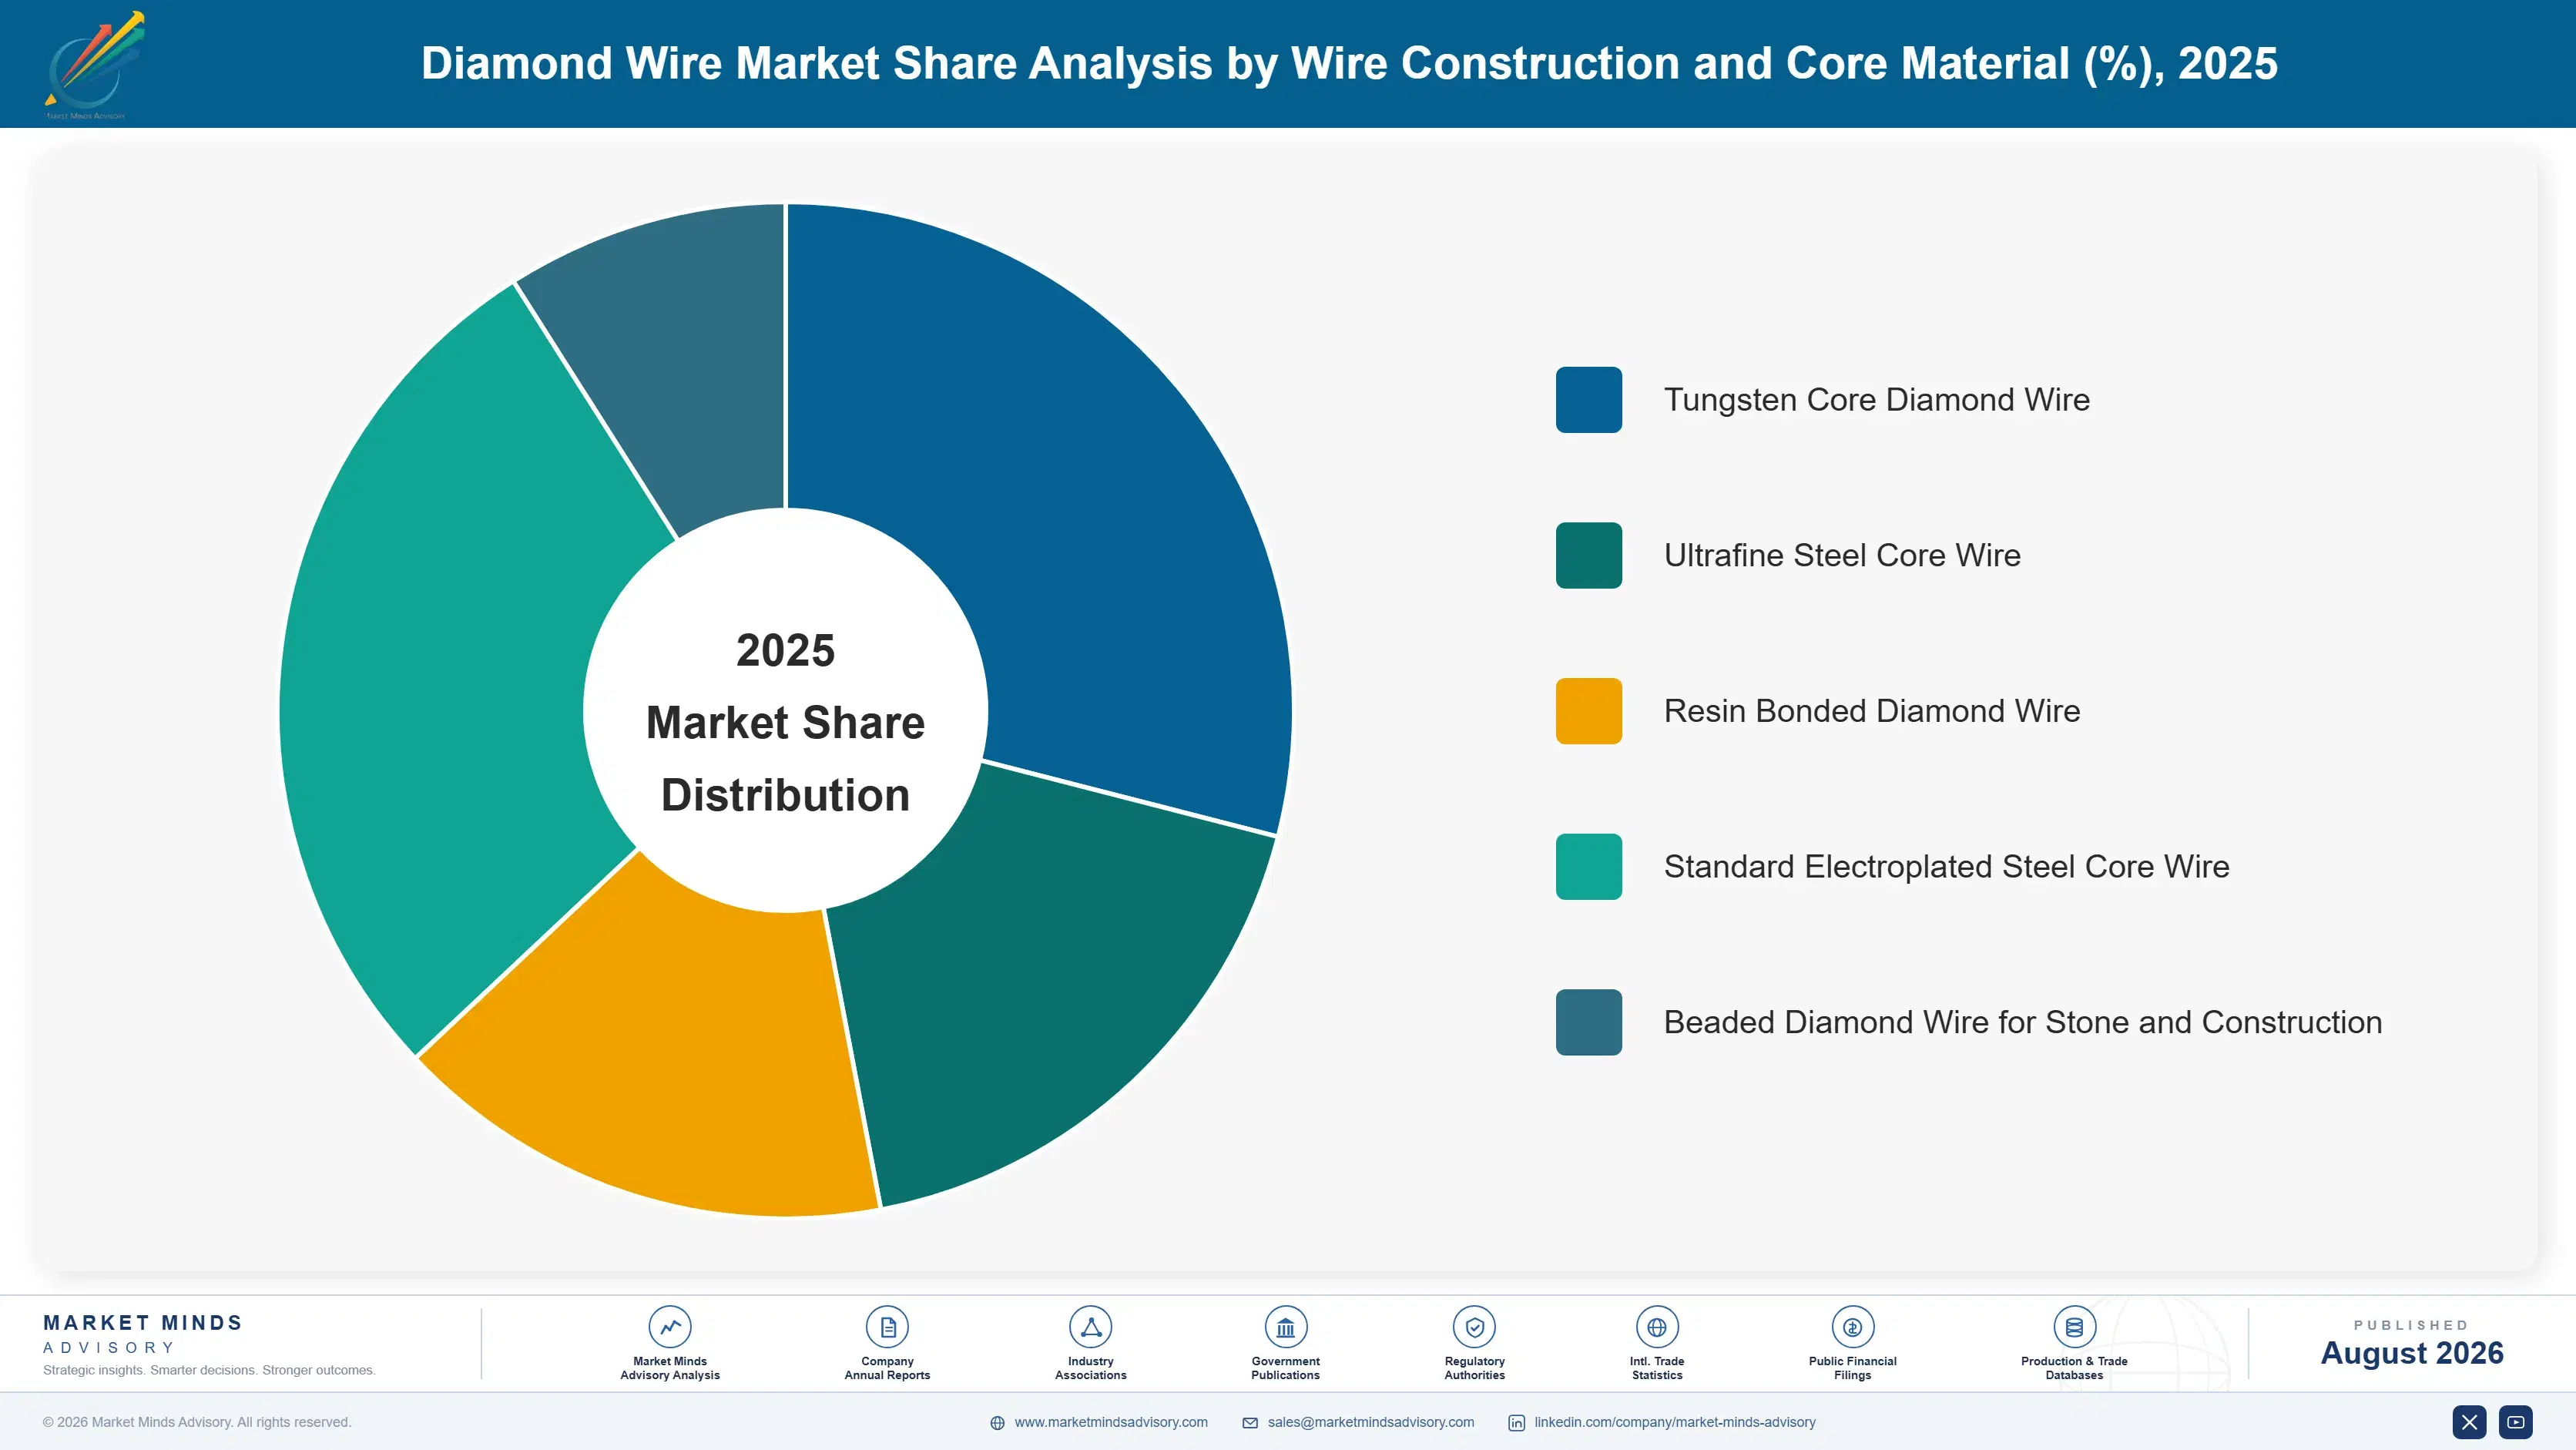
Segmentation follows wire construction and core material, which is the dimension determining achievable diameter, breakage behaviour, cutting application and realised price per kilometre together. End-use industry maps closely onto construction type rather than cutting across it, since a beaded stone wire and a 36 micron wafering wire share nothing beyond the abrasive, so application sits in demand analysis instead.
diamond-wire-market-trends-market-share-analysis-1787310645864

Tungsten Core Diamond Wire

Growing at 12.0%, exactly 1.50 times the market rate, and the enabling material for every further reduction in wafering kerf. Tungsten retains tensile strength at diameters where high carbon steel breaks unacceptably often, which lets wafer manufacturers go below 36 microns without the line stoppages that destroy the economics of thinner wire. Core material costs several times more than steel, and the silicon recovered justifies it comfortably at almost any realistic tungsten price. The commercial complication is supply: Chinese export controls introduced during 2025 reach exactly this material, and no comparable alternative core material exists in commercial production anywhere today. Conversion has nonetheless moved faster than most forecasts allowed for.
CAGR 12.0%

Ultrafine Steel Core Wire

Expanding at 9.6% as producers push high carbon steel toward its practical metallurgical limit near 40 microns through improved wire drawing, heat treatment and surface preparation, keeping a considerably lower cost core viable for as long as the metallurgy allows it. Breakage rate is the whole question here, since a wire failure stops the saw and destroys the ingot section under cut, costing far more than any core material saving could ever recover. This segment matters commercially as a hedge against tungsten availability rather than as a competing technology, and several wafer manufacturers now deliberately run both constructions in order to avoid depending on a single core supply chain entirely.
CAGR 9.6%
Full segment breakdown across 5 segments available in the complete report.

Regional Architecture and Country Demand Map

Regional value follows photovoltaic wafer manufacture almost entirely, and wafer manufacture is concentrated more tightly than almost any comparable industry. Stone and construction wire follows a completely separate geography tied to quarrying and building activity rather than to anything at all happening in solar manufacturing.

East Asia

Fifty-eight percent of value sits here, far outside the band this report applies to global markets. Note: the deviation is genuine rather than analytical, since photovoltaic wafer manufacture and diamond wire production are both concentrated in China to a degree that no other industrial consumable approaches. Chinese wire producers operate at a scale that set global pricing and drove several international competitors out of wafering entirely. Japanese producers hold quite different positions in semiconductor, sapphire and precision slicing where specification rather than price decides supply. Korean and Taiwanese demand serves semiconductor and display manufacture. Growth of 8.8% runs above the global rate on wafer output rather than on any pricing recovery.
Share: 58% | CAGR: 8.8% (2026 to 2036)

South Asia and Pacific

Twelve percent of value and the fastest regional growth at 10.1%, driven by Indian photovoltaic manufacturing capacity being built under production-linked incentive schemes and by domestic content requirements pulling wafer and ingot production into the country rather than importing finished cells from elsewhere. Indian wire consumption is growing quickly from a small base as that capacity commissions. Australian demand is concentrated in mining and quarrying wire rather than in any wafering application. Southeast Asian cell and module manufacture consumes a modest amount of wafering wire, though most wafers arriving there are imported already sliced from Chinese producers rather than cut locally. Regional diamond wire production capacity remains very limited indeed.
Share: 12% | CAGR: 10.1% (2026 to 2036)
Regional intelligence for 5 additional markets available in the complete report: North America, Western Europe, Latin America, Middle East and Africa, Eastern Europe. Contact sales@marketmindsadvisory.com.
diamond-wire-market-trends-country-cagr-analysis-1787310646388

Where Diamond Wire Producers Earn More

Competing on price per kilometre against Chinese producers with more capacity than the market needs is a losing position that several international suppliers have already exited. The value genuinely available sits in kerf reduction quantified in recovered silicon, in breakage performance, in tungsten supply security, and in the applications sitting outside photovoltaic wafering entirely.

Sell Silicon Recovered Rather Than Wire Supplied

Kerf loss near 48 microns destroys polysilicon worth many times what the wire costs, and a wire two microns thinner at equal breakage rate recovers material worth far more than any realistic price premium. Producers who quantify cost per wafer with real line data, rather than quoting price per kilometre, realise roughly 45% above competitors selling on wire price alone. Around 61% of wafer manufacturers already evaluate purchases on exactly this basis. The evidence needed is a production line trial and a yield calculation rather than any new technology at all.
Market Impact: Realises roughly 45% above wire-pri

Secure Tungsten Supply Outside Chinese Export Controls

Roughly 82% of the world's tungsten originates in China, and the material entered export control measures during 2025, exactly as the wafering industry was committing itself to tungsten cores. Producers securing non-Chinese tungsten, whether from Vietnamese, Austrian or recycled sources, hold roughly 3 times the supply certainty of any competitor buying into the controlled channel instead. The premium paid for that certainty is modest against the risk of being unable to supply at all. Most producers have still not mapped their own core wire supply chain even two tiers back.
Market Impact: Holds roughly 3 times the supply ce

Attack Breakage Rate As The Diameter Constraint

Wire diameter reduction is limited by breakage rate rather than by anything else at all, since a break stops the saw and destroys the ingot section currently being cut. Producers who reduce breakage through core metallurgy, coating uniformity and careful spooling control can supply a diameter step thinner than competitors at equal line performance, which commands roughly a 25% price premium and wins the qualification outright against everybody else. The engineering involved is incremental and genuinely cumulative over time. It is also the only genuinely defensible technical position available anywhere in wafering wire.
Market Impact: Commands roughly 25% price premium

Build Positions Outside Photovoltaic Wafering Entirely

Semiconductor slicing, sapphire cutting and stone quarrying all consume diamond wire at prices per kilometre that wafering deflation has simply never touched, because those customers are fragmented, the volumes modest and the specifications genuinely demanding. Producers who hold those positions earn roughly 4 times wafering margins on a small fraction of the volume, and that revenue proves considerably less volatile through a full solar cycle than wafering ever manages. Wafering scale does not transfer across, since these applications require different wire construction and quite different commercial coverage from photovoltaic supply entirely.
Market Impact: Earns roughly 4 times the wafering

Who Controls the Margin Pool

Concentration is high and almost entirely Chinese in origin. The top five participants hold 57% of diamond wire length supplied, the basis used throughout this section, and the gap between Yicheng and the rest reflects capacity built during the solar expansion at a scale international competitors chose not to match. Below them sit Japanese and European producers who withdrew from wafering price competition and hold semiconductor, sapphire and stone positions instead.
Competition currently runs on three dimensions. Breakage rate at a given diameter decides which producer a wafer manufacturer qualifies, since line stoppages cost more than any wire premium. Tungsten core supply security decides who can deliver the thinner products the industry now wants. Application coverage outside wafering decides who has revenue that a solar price war does not reach.

Pressure is building from two directions. Tungsten export controls threaten the core material that the fastest growing segment depends on entirely. Wafering overcapacity keeps prices falling faster than costs. Rankings shift first in tungsten core supply, where availability rather than manufacturing capability will decide who can serve the diameter reduction the industry has already committed to.
diamond-wire-market-trends-company-positioning-matrix-1787310646916

Competitive Moat and Risk Dimensions

YICHENG NEW ENERGY

Moat: Scale and wafer customer integration

Capacity built at a scale that set global wafering wire pricing, combined with close working relationships with the handful of enormous Chinese wafer manufacturers that consume most of the world's output, creates a position that is difficult to attack on either cost or qualification. Early tungsten core commitment placed the company ahead on the diameter reduction the industry needs.
YICHENG NEW ENERGY

Risk: Wafering price deflation exposure

Revenue depends overwhelmingly on a customer base that has driven wire prices down relentlessly and shows no sign of stopping, in an industry with more capacity than demand. Diversification into applications outside photovoltaic wafering requires different wire construction and commercial coverage that scale in wafering does not provide at all.
QINGDAO GAOCE TECHNOLOGY

Moat: Equipment and consumable integration

Supplying wire saw equipment alongside the wire that runs in it creates a position no consumable-only producer can match, because the machine and the wire are engineered together and the company sees line performance data across a large installed base. That visibility informs product development in ways competitors selling wire alone cannot replicate.
QINGDAO GAOCE TECHNOLOGY

Risk: Tungsten core supply dependence

Conversion toward tungsten cores has moved quickly and the material entered Chinese export control measures during 2025, which creates availability uncertainty for a product line growing at 12.0%. Domestic position helps within China and complicates export supply, and no comparable alternative core material exists in commercial production anywhere today.

Players Tracked

Prominent Players

Yicheng New Energy
Qingdao Gaoce Technology
Meike New Materials
Asahi Diamond Industrial
Nakamura Choukou

Other Key Players

Bosun Tools
Diamond Pauber
Tyrolit
Husqvarna
Saint-Gobain
Hilti
Ehwa Diamond Industrial
ILJIN Diamond
Element Six
Sumitomo Electric Industries
Noritake
Disco Corporation
Henan Huanghe Whirlwind
Zhengzhou Sino-Crystal Diamond
Sinoma

Recent Developments

FEBRUARY 2025

Tungsten brought within Chinese export control measures

Chinese authorities added tungsten and a range of related products to export control lists, introducing export licensing requirements for a material that dominates global supply and that photovoltaic wire producers had themselves only recently committed to as the enabling core material for thinner wafering wire.
Signal: A consumable nobody listed as strategic be
JULY 2025

Wafer manufacturer qualifies wire below thirty-six microns

A photovoltaic wafer manufacturer completed full qualification of tungsten core diamond wire that sits below the prevailing 36 micron standard, documenting both the kerf reduction and the breakage performance achieved across extended production runs before finally committing production volume across multiple slicing lines at the site.
Signal: Diameter steps are qualified on breakage d
NOVEMBER 2025

Tungsten recovery from spent wafering wire commissioned

Dedicated recovery capacity for tungsten from spent diamond wire entered commercial operation, targeting a material stream that had until then been discarded entirely as mixed scrap and addressing directly the supply security concerns raised by export controls affecting the primary tungsten market during the year.
Signal: Recycling spent wire is the only tungsten

What Sits Inside Diamond Wire Cost

Core wire accounts for roughly 44% of finished diamond wire production cost, whether high carbon steel drawn to ultrafine diameter or tungsten costing several times more per kilogram. Diamond micropowder at around 6 micron median size adds about 21%. Electroplating chemistry including nickel contributes roughly 14%, process energy 9%, spooling and packaging 6%, and quality control and overhead the remaining 6% of delivered cost.
Tungsten pricing and availability changed materially during 2025. Chinese authorities brought tungsten within export control measures in February, and with roughly 82% of world output originating there, ammonium paratungstate pricing rose and availability outside China tightened noticeably. China MIIT documentation set out the licensing framework, and Sumitomo Electric Industries Annual Report 2024 had already recorded tungsten input cost pressure across its wire and tooling operations before the controls took effect.

The competitive disadvantage mechanism runs through core material access rather than through plating or diamond supply. Producers inside China buy tungsten domestically without licensing friction, while those outside face export licensing on the material their fastest growing product depends on entirely. Diamond micropowder is comparatively available from several sources. A wire producer outside China without alternative tungsten sourcing carries an exposure that no operational improvement addresses.
diamond-wire-market-trends-cost-volatility-analysis-1787310647116

Qualify non-Chinese tungsten sources ahead of constraint

Vietnamese, Austrian and recycled tungsten exist in commercial quantities and they require qualification work that takes months rather than years to complete. Producers who begin that process before licensing friction becomes acute pay a modest premium and retain the ability to supply, which is worth considerably more than the price difference during any genuine supply constraint.

Recover tungsten from spent wire and process scrap

Spent wafering wire contains tungsten that has historically been discarded as mixed scrap, and recovery capacity is genuinely straightforward to build against current material values. It creates a supply source independent of primary mining and export licensing, and it converts what is currently a disposal cost into a feedstock stream that improves with volume.

Maintain ultrafine steel capability as a supply hedge

High carbon steel reaches roughly 40 microns with careful metallurgy, which is a diameter step behind tungsten and entirely serviceable if tungsten becomes unavailable. Retaining that capability costs relatively little and protects against a supply interruption in a core material whose availability is now decided by export licensing rather than by any market mechanism.

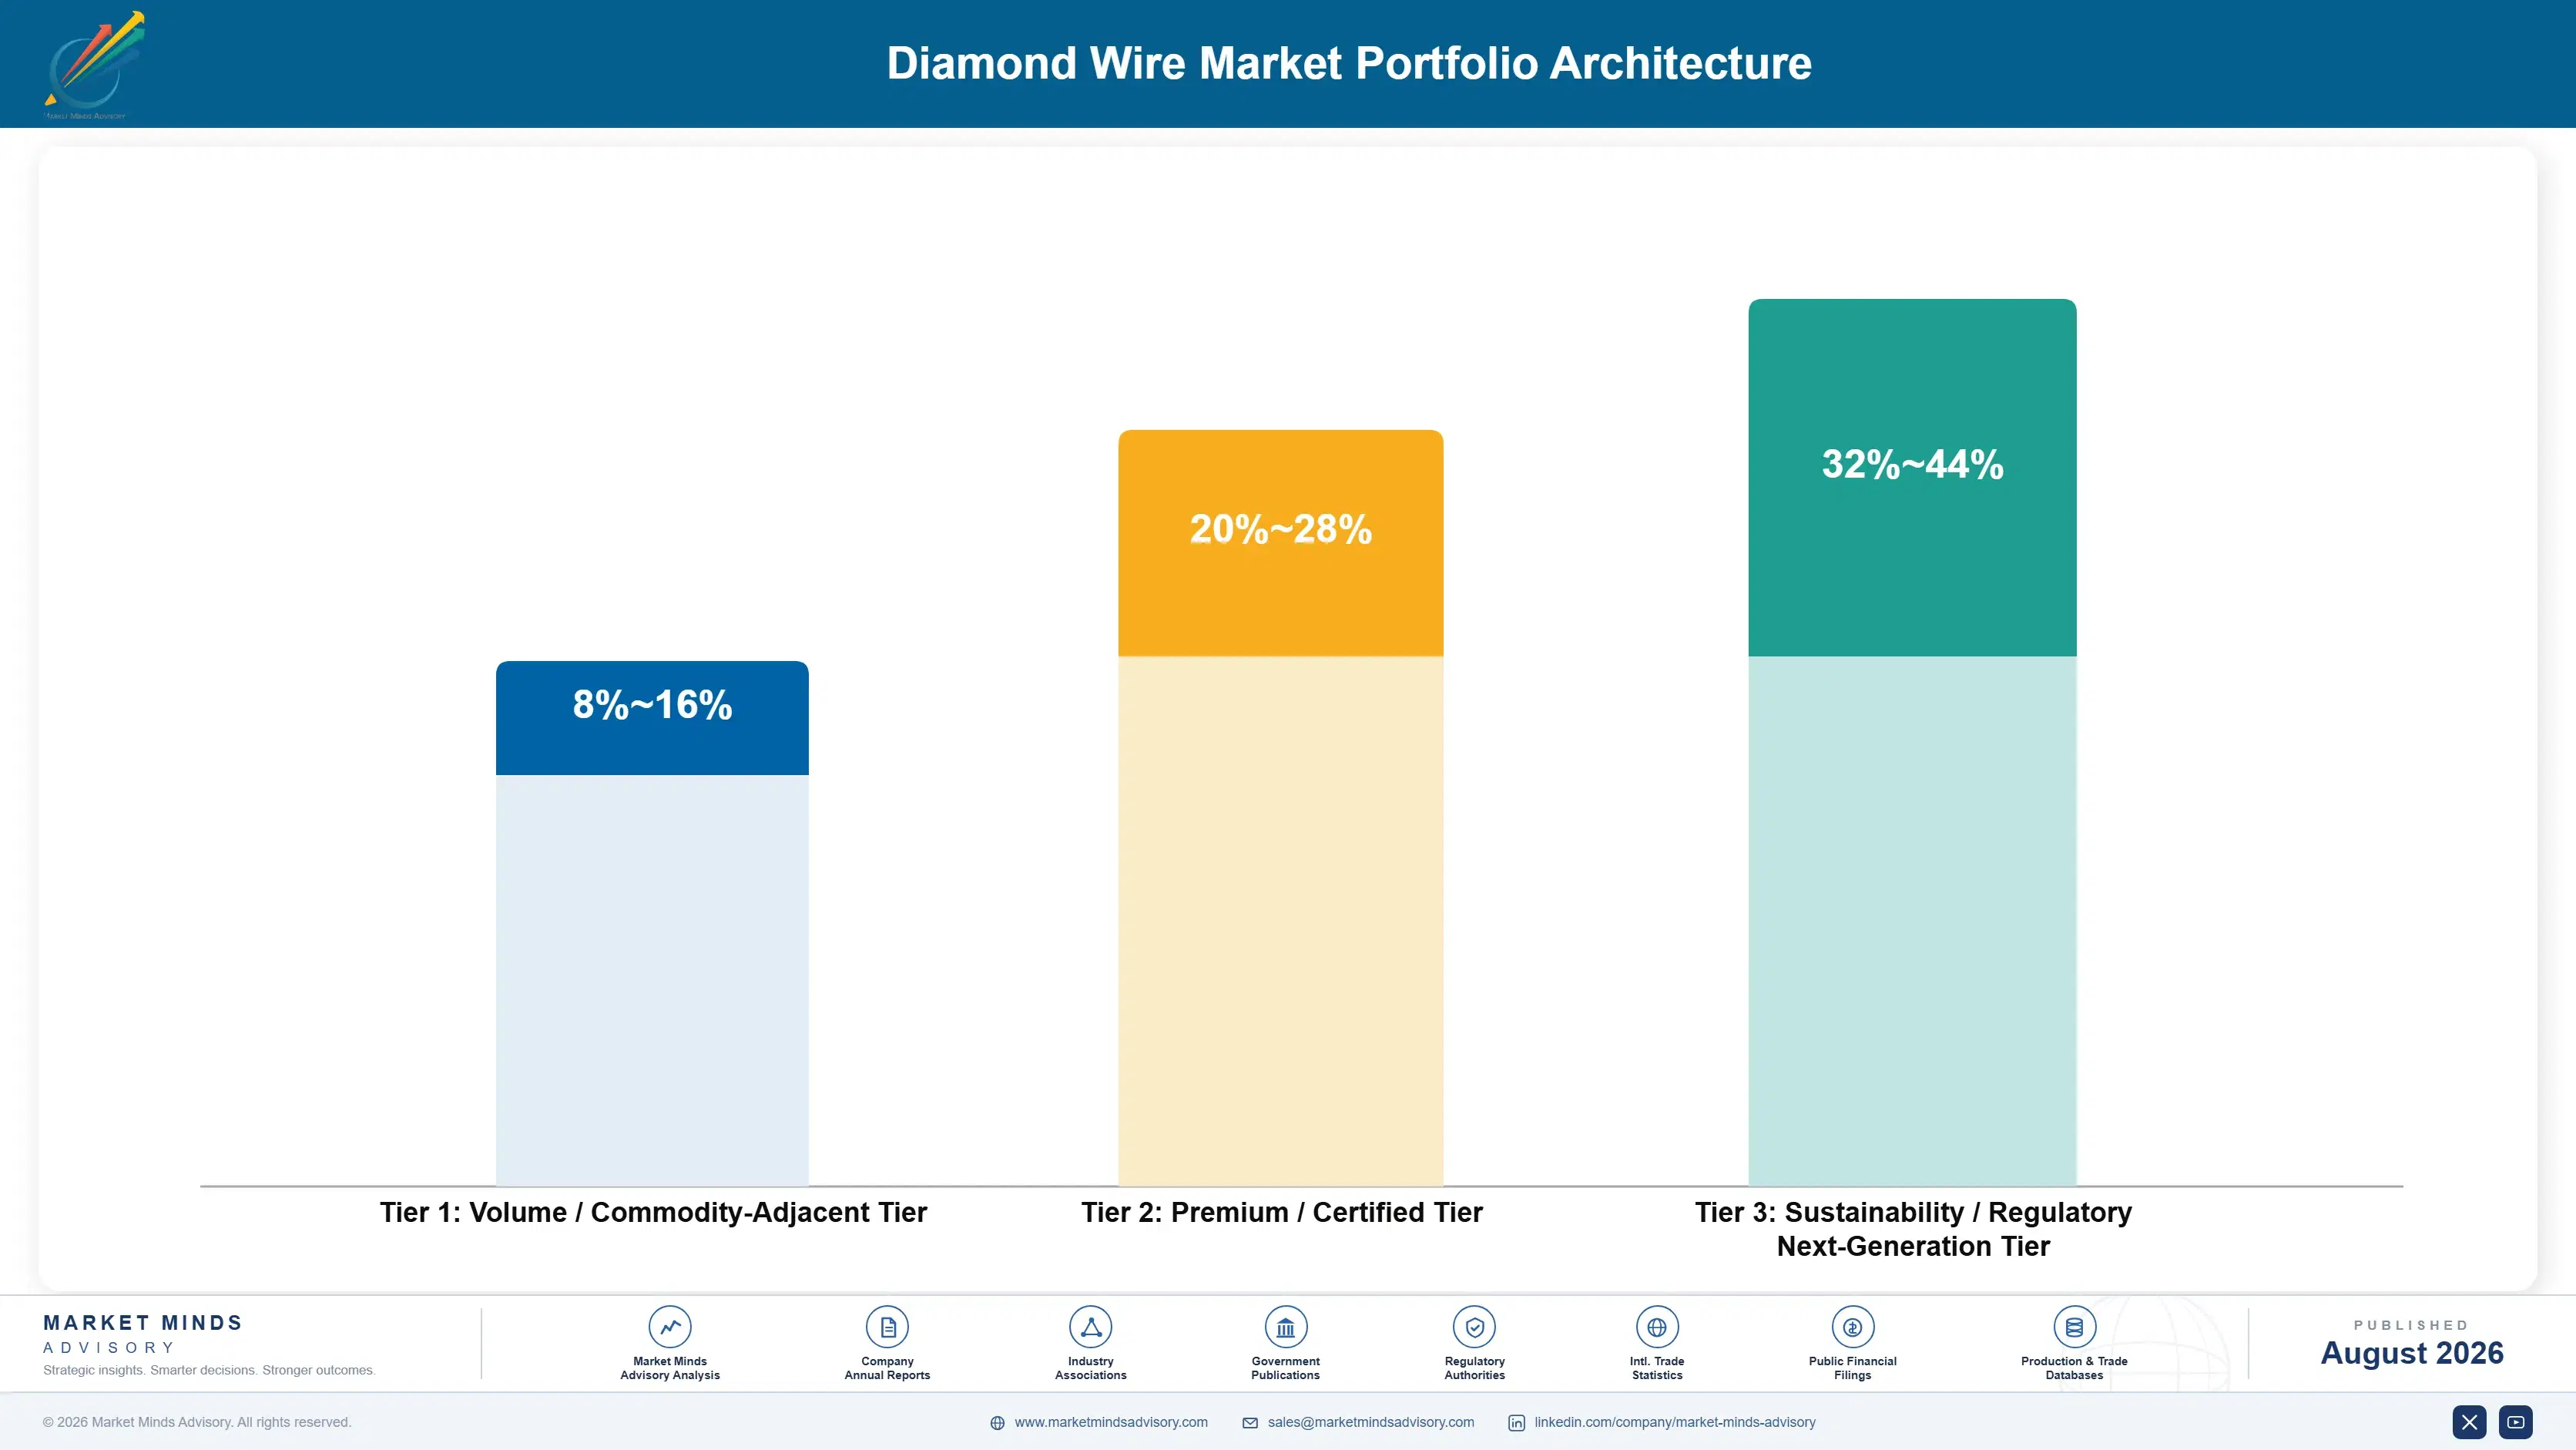
Portfolio Architecture for Margin Defence

Margin architecture separates by whether the customer is buying wire or buying silicon yield. Standard steel core wafering wire earns whatever Chinese overcapacity permits, which after several years of price competition is very little, and no amount of manufacturing efficiency changes that. Value rises with demonstrable kerf and breakage performance, and with the applications where a handful of enormous customers do not set the price.
The volume versus premium tension is unusually severe. Wafering carries virtually all the volume in this market and almost none of the margin, at prices set by producers with more capacity than the industry needs. Semiconductor, sapphire and stone applications earn several times better on a fraction of the kilometres. A producer built entirely around wafering scale has a business exposed to a price war it cannot win and a solar cycle it cannot influence.

High-value pools concentrate in three places. Tungsten core wire commands price because it enables diameters steel cannot reach, at least while the material remains available. Semiconductor and sapphire slicing earns on specification rather than on price per kilometre. And stone and construction wire earns steadily in a fragmented regional market that solar deflation has never touched at all.

Volume / Commodity-Adjacent Tier

Standard electroplated steel core wafering wire supplied into photovoltaic slicing at prices set entirely by Chinese overcapacity, where several qualified producers compete continuously for a handful of very large customers.
Gross Margin: 8-16%

Premium / Certified Tier

Ultrafine steel and resin bonded wire qualified for demanding slicing where breakage performance and consistency determine line productivity. Demonstrated performance defends pricing. The eight-point range reflects standard against qualified ultrafine economics.
Gross Margin: 20-28%

Sustainability / Regulatory / Next-Generation Tier

Tungsten core wafering wire below prevailing diameter, alongside semiconductor, sapphire and precision slicing products. Material scarcity and specification defend pricing strongly. The twelve-point range reflects tungsten wafering against precision slicing economics.
Gross Margin: 32-44%
diamond-wire-market-trends-portfolio-architecture-1787310647619

High-value Sub-segments and Strategic Watch-out

Tungsten core wire below prevailing diameter

High value and high growth together, because tungsten enables wire diameters that high carbon steel cannot reach and because every micron recovered converts directly into saleable silicon wafer. Chinese export controls on the core material remain the single risk capable of reversing this position entirely.
Gross Margin: 32-44%

Semiconductor and sapphire precision slicing

Strong realised value on steady growth, because these customers buy on specification and consistency rather than on price per kilometre, and because photovoltaic price deflation has never reached them at all. Volumes are modest and the qualification requirements are genuinely demanding to satisfy in practice.
Gross Margin: 30-42%

Standard steel core wafering wire volume

The volume core in every possible sense, carrying most of the kilometres shipped anywhere while earning whatever Chinese overcapacity leaves behind after a prolonged price war that nobody has won. Necessary for basic manufacturing scale, but this tier funds no development work at all anywhere.
Gross Margin: 8-16%

Beaded wire for stone and construction

The strategic watch-out here, because this fragmented regional business has always enjoyed stable pricing that solar deflation never once managed to reach, and because it keeps growing steadily with quarrying and building activity rather than with anything at all happening in photovoltaic manufacturing capacity anywhere.
Gross Margin: 22-34%

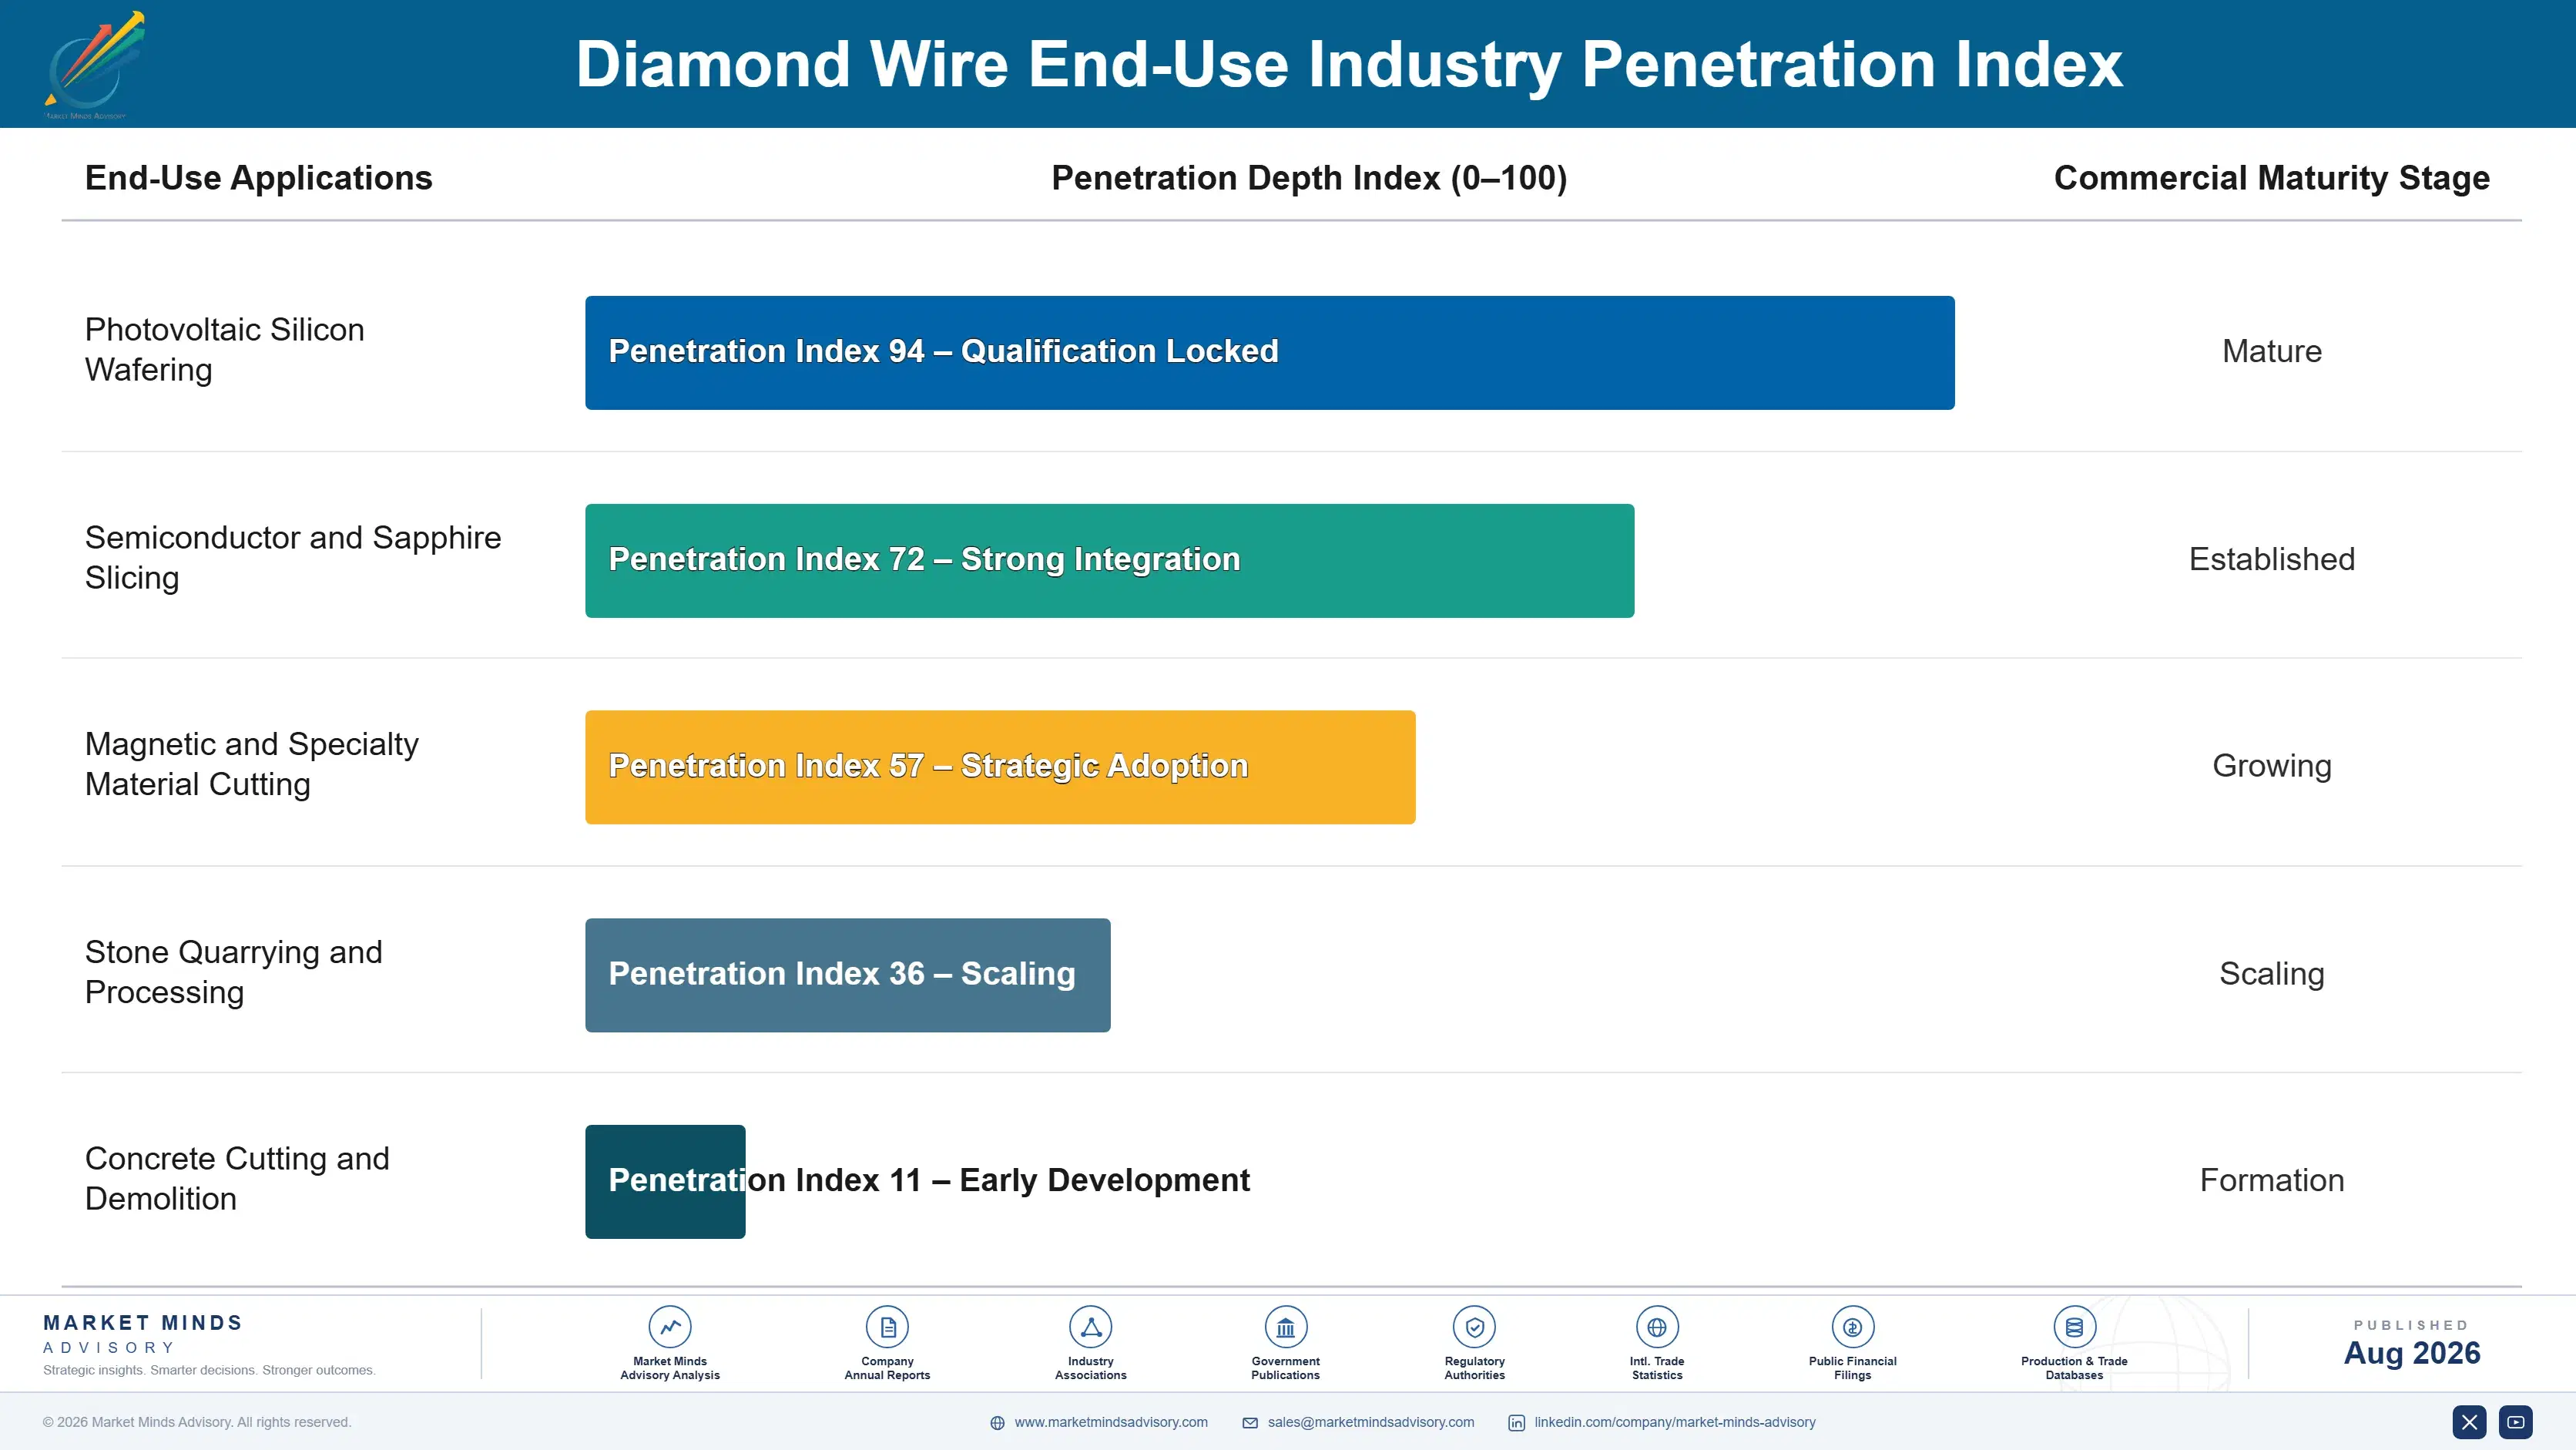
How Diamond Wire Demand Behaves

Demand is line-locked consumable revenue with an unusually direct relationship to output. A wafer line qualified on a particular wire consumes roughly 2.1 metres per wafer continuously, reorders against production schedules rather than any tendering cycle, and changes supplier only when a diameter step, a breakage problem or a price negotiation forces it. Revenue tracks wafer output precisely, which makes volume forecasting straightforward and price forecasting nearly impossible.
Stickiness varies enormously between the two businesses sitting inside this market. Standard wafering wire is loosest, with large customers running several qualified suppliers at once and shifting allocation on price each quarter. Tungsten core and ultrafine wire sits tighter, because a diameter step requires line requalification nobody undertakes casually. Semiconductor and sapphire slicing is stickiest of all, where qualification against a specific crystal and machine takes months and the volumes are too small to attract price competition.

The buyer profile has shifted toward manufacturing engineering in the wafering business specifically. A decade ago wire was bought by procurement against a diameter specification and a price. Today production engineers evaluate cost per wafer including recovered silicon and avoided stoppages, which favours suppliers able to produce credible trial data rather than the lowest quotation.
diamond-wire-market-trends-end-use-penetration-index-1787310648113

Where We Land On This

These are among the four positions where our research anticipates prominent divergence between winners and laggards over the coming forecast period. Each is grounded in the demand model, the regulatory perimeter, and the announced capacity pipeline.
01 / SILICON YIELD SELLING

Quantify silicon recovered, not price per kilometre

Kerf loss near 48 microns destroys polysilicon worth many times the wire itself on every single cut a wafer line makes. A wire two microns thinner at equal breakage recovers material worth far more than any realistic price premium, and producers who quantify cost per wafer with real line data realise roughly 45% above competitors quoting price per kilometre. Around 61% of wafer manufacturers already evaluate on that basis, so the argument lands with an audience that is ready for it.
02 / TUNGSTEN SUPPLY SECURITY

Map and secure core supply two tiers back now

Roughly 82% of world tungsten originates in China and the material entered export control measures during 2025, precisely as the wafering industry committed to tungsten cores as the route to thinner wire. Producers securing Vietnamese, Austrian or recycled tungsten hold roughly 3 times the supply certainty of those buying into the controlled channel, at a modest premium against the risk of being unable to supply at all. Most producers have still not mapped their own core wire supply chain properly at all.
03 / BREAKAGE ENGINEERING FOCUS

Compete on breakage rate, not on diameter claims

Wire diameter reduction is constrained by breakage and by nothing else, since a break halts the saw and destroys the ingot section under cut at a cost far exceeding any wire saving. Producers reducing breakage through core metallurgy, coating uniformity and spooling control supply a diameter step thinner than competitors at equal line performance, which commands roughly 25% premium and wins qualification outright. It is the only genuinely defensible technical position available anywhere in wafering wire, and it compounds over time.
04 / NON-WAFERING REVENUE BUILDING

Build revenue that a solar price war cannot reach

Semiconductor slicing, sapphire cutting and stone quarrying all consume diamond wire at prices that photovoltaic deflation has never touched, because customers are fragmented, volumes modest and specifications genuinely demanding. Producers holding those positions earn roughly 4 times wafering margins on a fraction of the kilometres, and with revenue that proves far less volatile through a solar cycle. Wafering scale transfers poorly here, since these applications need different wire construction and entirely different commercial coverage to reach the customers at all.

Engagement Snapshot From the Field

A live engagement with an industry participant carrying material or product regulatory and market exposure ahead of a defining policy shift, showing how our research translates into a defensible multi-year portfolio strategy.
MARKET MINDS ADVISORY · CLIENT ENGAGEMENT SUMMARY
Diamond Wire Producer Strategic Portfolio Review and Transition Roadmap 2026·Investment Scenario on Diamond Wire Exposure Evaluation 2025-26
CLIENT PROFILE
A diamond wire producer operating electroplating and spooling capacity across East Asia and Europe, supplying photovoltaic wafering wire alongside smaller semiconductor and stone cutting product lines. Wire revenue approached USD 190 million annually (client-reported, unverified by MMA), roughly four fifths of it in standard steel core wafering wire sold to Chinese wafer manufacturers on quarterly negotiated pricing.
STRATEGIC CHALLENGE
Margins had fallen for four consecutive years and management attributed the decline to Chinese overcapacity, responding with cost reduction and a proposed capacity expansion intended to defend share. Tungsten core conversion had been treated as a product development question rather than a supply chain one. Nobody had assessed what the export controls announced during the year meant for the client's ability to supply.
MMA APPROACH
MMA interviewed forty-seven wafer manufacturers, production engineers, tungsten traders and competing wire producers across five markets, establishing how wire qualification and allocation decisions are actually made. We modelled cost per wafer including silicon recovered across three diameter scenarios, traced the client's tungsten supply chain two tiers upstream, and benchmarked breakage performance against competitors on customer lines.
KEY FINDINGS
  1. The client's entire tungsten core supply originated inside China through intermediaries, and nobody in the organisation had established whether export licensing would apply to it.
  2. Breakage rate on customer lines ran materially above the leading competitor at equivalent diameter, which explained allocation losses that management had attributed to pricing alone.
  3. Cost per wafer modelling showed the client's own wire recovering silicon worth several times the price premium it was failing to charge (client-reported, unverified by MMA), and no customer had ever been shown that calculation.
  4. Stone and semiconductor product lines earned several times wafering margins on under a fifth of the volume, and both had received almost no commercial investment for years.
CLIENT PROFILE
A diamond wire producer operating electroplating and spooling capacity across East Asia and Europe, supplying photovoltaic wafering wire alongside smaller semiconductor and stone cutting product lines. Wire revenue approached USD 190 million annually (client-reported, unverified by MMA), roughly four fifths of it in standard steel core wafering wire sold to Chinese wafer manufacturers on quarterly negotiated pricing.
STRATEGIC CHALLENGE
Margins had fallen for four consecutive years and management attributed the decline to Chinese overcapacity, responding with cost reduction and a proposed capacity expansion intended to defend share. Tungsten core conversion had been treated as a product development question rather than a supply chain one. Nobody had assessed what the export controls announced during the year meant for the client's ability to supply.
MMA APPROACH
MMA interviewed forty-seven wafer manufacturers, production engineers, tungsten traders and competing wire producers across five markets, establishing how wire qualification and allocation decisions are actually made. We modelled cost per wafer including silicon recovered across three diameter scenarios, traced the client's tungsten supply chain two tiers upstream, and benchmarked breakage performance against competitors on customer lines.
KEY FINDINGS
  1. The client's entire tungsten core supply originated inside China through intermediaries, and nobody in the organisation had established whether export licensing would apply to it.
  2. Breakage rate on customer lines ran materially above the leading competitor at equivalent diameter, which explained allocation losses that management had attributed to pricing alone.
  3. Cost per wafer modelling showed the client's own wire recovering silicon worth several times the price premium it was failing to charge (client-reported, unverified by MMA), and no customer had ever been shown that calculation.
  4. Stone and semiconductor product lines earned several times wafering margins on under a fifth of the volume, and both had received almost no commercial investment for years.
RECOMMENDED STRATEGY
Phase 1: Phase 1 (0 to 6 months): Halt the capacity expansion, map tungsten supply two tiers back and begin qualifying non-Chinese and recycled sources. Phase 2: Phase 2 (6 to 18 months): Fund breakage reduction engineering and rebuild wafering selling around cost per wafer rather than price per kilometre. Phase 3: Phase 3 (18 to 36 months): Invest deliberately in semiconductor, sapphire and stone product lines to build revenue outside photovoltaic price competition.
OUTCOME
The client cancelled roughly USD 40 million of planned capacity (client-reported, unverified by MMA) and qualified two non-Chinese tungsten sources within a year. Breakage performance reached competitor benchmark on two customer lines, the first cost per wafer proposal was accepted at a premium, and semiconductor product line revenue grew for the first time in five years.

Frequently Asked Questions

Foundational context covering the market sizes, CAGR, scope, country, region and competition that inform every finding below. This section is provided to cover basics and most often pre-purchase conversations, answered from the MMA Primary Research Dataset.

What is the current size of the Diamond Wire Market?

The market reached USD 2.8 billion in 2025, measured as wire revenue at realised delivered price across all applications. Photovoltaic wafering accounts for the overwhelming majority of length supplied.

How large will the Diamond Wire Market be by 2036?

MMA forecasts USD 6.52 billion by 2036, an expansion of 2.16 times the 2026 level. Incremental value across the forecast period reaches USD 3.5 billion.

What is the CAGR for the Diamond Wire Market 2026 to 2036?

The base case compound annual growth rate is 8.0%, with a bull case of 9.2% and a bear case of 6.9%. Tungsten core conversion pace and export control severity separate those scenarios.

Which segment is growing fastest?

Tungsten core diamond wire grows fastest at 12.0%, exactly 1.50 times the overall market rate. Tungsten holds tensile strength at diameters where high carbon steel breaks unacceptably often.

Who are the major companies in the Diamond Wire Market?

Yicheng New Energy, Qingdao Gaoce Technology, Meike New Materials, Asahi Diamond Industrial and Nakamura Choukou lead, holding 57% of wire length between them. Chinese scale and Japanese precision positions explain that split.

Which country is growing fastest?

India grows fastest at 10.7%, as photovoltaic manufacturing capacity built under production-linked incentives pulls wafer and ingot production into the country. Wire consumption grows from a genuinely small base.

Report Segmentation Architecture

The full report scope spans multiple orthogonal segmentation dimensions, with cross-tabulated demand data provided for each dimension pair. Coverage extends further to regional breakdowns, trend trajectories, and the competitive detail needed to support segment-level decision-making.

By Wire Construction and Core Material

  • Tungsten Core Diamond Wire
  • Ultrafine Steel Core Wire
  • Resin Bonded Diamond Wire
  • Standard Electroplated Steel Core Wire
  • Beaded Diamond Wire for Stone and Construction

By End-Use Industry

  • Photovoltaic Silicon Wafering
  • Semiconductor and Sapphire Slicing
  • Magnetic and Specialty Material Cutting
  • Stone Quarrying and Processing
  • Concrete Cutting and Demolition

By Customer Type and Channel

  • Photovoltaic Wafer Manufacturers
  • Semiconductor and Crystal Processors
  • Stone Quarry Operators
  • Construction and Demolition Contractors
  • Industrial Tooling Distributors

By Region

  • North America
  • Western Europe
  • East Asia
  • South Asia and Pacific
  • Latin America
  • Middle East and Africa
  • Eastern Europe

Scope, Methodology, and Coverage

Every figure in this report is reproducible from documented input assumptions. The scope below maps the historical period, the forecast horizon, the segmentation dimensions, and the countries covered, alongside the underlying primary and qualitative methodology.
Historical Period
2020 to 2025
Forecast Period
2026 to 2036
Base Year
2025 (USD billions; MMA Primary Research Dataset, August 2026)
Market Definition
The market comprises diamond abrasive wire manufactured for precision and industrial cutting, spanning tungsten core diamond wire, ultrafine steel core wire, resin bonded diamond wire, standard electroplated steel core wire, and beaded diamond wire for stone and construction applications. Sizing captures wire revenue at realised delivered price across photovoltaic silicon wafering, semiconductor and sapphire slicing, magnetic and specialty material cutting, stone quarrying and processing, and concrete cutting and demolition. Wire saw machines and slicing equipment, diamond micropowder and abrasive grit sold as raw material, slurry-based wafering consumables, and blade, segment and core drilling tools fall outside scope.
Quantitative Units
USD billions (current prices); wire length supplied in million kilometres annually; USD per kilometre at realised delivered price
Segmentation Dimensions
By Wire Construction and Core Material; By End-Use Industry; By Customer Type and Channel; By Region
Regions Covered
North America, Western Europe, East Asia, South Asia and Pacific, Latin America, Middle East and Africa, Eastern Europe
Countries Covered
China, Japan, South Korea, Taiwan, India, Vietnam, Malaysia, Thailand, Singapore, Australia, USA, Canada, Mexico, Germany, Italy, Spain, France, Portugal, Switzerland, Poland, Turkey, Greece, Brazil, Chile, Argentina, Egypt, Saudi Arabia, UAE, South Africa, and additional markets relevant to this sector
Key Companies Profiled
Yicheng New Energy, Qingdao Gaoce Technology, Meike New Materials, Asahi Diamond Industrial, Nakamura Choukou, Bosun Tools, Diamond Pauber, Tyrolit, Husqvarna, Saint-Gobain, Hilti, Ehwa Diamond Industrial, ILJIN Diamond, Element Six, Sumitomo Electric Industries, Noritake, Disco Corporation, Henan Huanghe Whirlwind, Zhengzhou Sino-Crystal Diamond, Sinoma.
Quantitative Methodology
Primary survey, n=3,800 respondents, Q4 2025, six countries; demand-side model with trade association cross-validation
Qualitative Methodology
47 expert interviews, Q4 2025; applied to validate demand model assumptions, identify emerging dynamics, and assess competitive positioning
Report Format
PDF and XLSX data workbook (Word format preview document)
Publisher
Market Minds Advisory
Report Code
MMA-2026-CON-515
Published
August 2026
Contact
sales@marketmindsadvisory.com | www.marketmindsadvisory.com

Purchase the full Diamond Wire Market Report (2026 to 2036).

The full report sizes the diamond wire market across five wire constructions, five end-use industries, five customer channels and seven regions, with annual forecasts to 2036 in revenue and wire length supplied. It models cost per wafer including silicon recovered across diameter scenarios, which is the analysis that establishes what thinner wire is genuinely worth to a wafer manufacturer. Twenty participants are assessed on a consistent wire length supplied basis, with tungsten core supply exposure mapped separately from manufacturing capacity. Breakage performance is benchmarked at equivalent diameter across the major producers.
Five wire constructions sized and forecast annually
Cost per wafer modelled across diameter reduction scenarios
Twenty participants on consistent wire length supplied basis
Tungsten core supply exposure mapped separately from capacity
Breakage performance benchmarked at equivalent wire diameter
Stone and semiconductor applications forecast independently of solar

Built For The People Who Decide

From boardroom strategy to bench-side execution, this report is read cover-to-cover by leaders shaping the next decade of their industry, turning demand scenarios, market dynamics and valuation benchmarks into decisions.
CXOs/ Presidents/ VPs/ Managers
M&A and Corporate Development
Strategy Teams and R&D Heads
Procurement and Product Directors
Regulatory and Compliance Leaders
Investor Relations and Equity Analysts