Market Minds Advisory
Decorticator Machine Market

Decorticator Machine Market: Mechanization Economics Reshaping Smallholder Agriculture

Groundnut and fiber processors across India, West Africa, and Southeast Asia are replacing manual and semi-mechanized decorticating with continuous-throughput machines as labor costs climb and edible oil, cordage, and packaging demand pulls processing volume upward.

Lead Analyst

David Horsley

Published

September 2026

Make Smarter Decisions with Customized Research Insights

Request a free sample report and evaluate market opportunities, growth trends, and competitive dynamics relevant to your business needs.

2025 MARKET VALUE$1.1BMarket Size 2025
2036 FORECAST VALUE$2.3BBase Case , 2026 to 2036
CAGR 2026 TO 20366.9 %Bull 8.2% / Bear 5.6%
INCREMENTAL OPPORTUNITY$1.1BNet 10- year value creation
EXPANSION MULTIPLE1.92x2036 value over 2026 base
Strategic Levers
M&A Pipeline
Regional Outlook
Country Rankings
Competitive Intelligence
Segmental Deep-dive
Call-Us : 91 93563 13602

Executive Snapshot and Market Trajectory

Agricultural labor shortages are forcing a mechanization wave that decorticator manufacturers spent a decade waiting for, as groundnut, cotton, and fiber processors in India and West Africa replace manual separation with continuous machines to keep pace with harvest volumes and processor throughput contracts signed each harvest season.
Natural fiber decorticators, feeding jute and sisal into biodegradable packaging and cordage supply chains, are the fastest-growing product line as plastic-alternative packaging mandates in Europe and India pull raw fiber demand upward faster than manual extraction can supply it. Groundnut decorticators follow close behind, tracking edible oil demand growth across South Asia and West Africa. India anchors both manufacturing and demand, with government mechanization subsidies covering a meaningful share of smallholder equipment purchases.
Competitive intensity centers on throughput per hour and after-sales parts availability rather than headline price, since remote processing centers cannot tolerate week-long repair delays. Government procurement programs compound the shift: India's mechanization subsidy scheme and several West African agricultural investment funds now specify minimum decorticator capacity in tender documents, while manufacturers able to certify local service coverage are winning multi-unit government contracts ahead of import-only competitors.
Market Definition
The decorticator machine market covers mechanical and semi-automated equipment that separates fiber, husk, shell, or seed coat from raw agricultural material, spanning cotton, groundnut, jute, sisal, castor, sunflower, and coffee processing applications. It excludes downstream ginning, oil extraction, and spinning equipment that operates on already-decorticated material.
Base Year Value
$1.1B in 2025 (MMA Primary Research Dataset, August 2026)
Forecast Period
2026 to 2036, eleven discrete annual values
CAGR
6.9% base case. Bull 8.2%. Bear 5.6%.
Fastest Growth Segment
Jute and Sisal Fiber Decorticators: 9.4% CAGR
Fastest Growth Country
India: 10.8% CAGR
Fastest Growth Region
South Asia and Pacific: 9.2% CAGR
Largest Region
South Asia and Pacific: 28% of 2025 global value
Market Leaders
Lummus Corporation, Bühler Group, Bajaj Steel Industries Limited, Alvan Blanch Development Co. Ltd., Amar Agro Industries. Source: MMA Analysis based on company annual reports.
Primary Survey
n=3,800 procurement and R&D decision-makers, Q4 2025, six countries
Methodology
Demand-side build-up, cross-validated against public data, 47 expert interviews

Decorticator Machine Market Forecast Scenarios

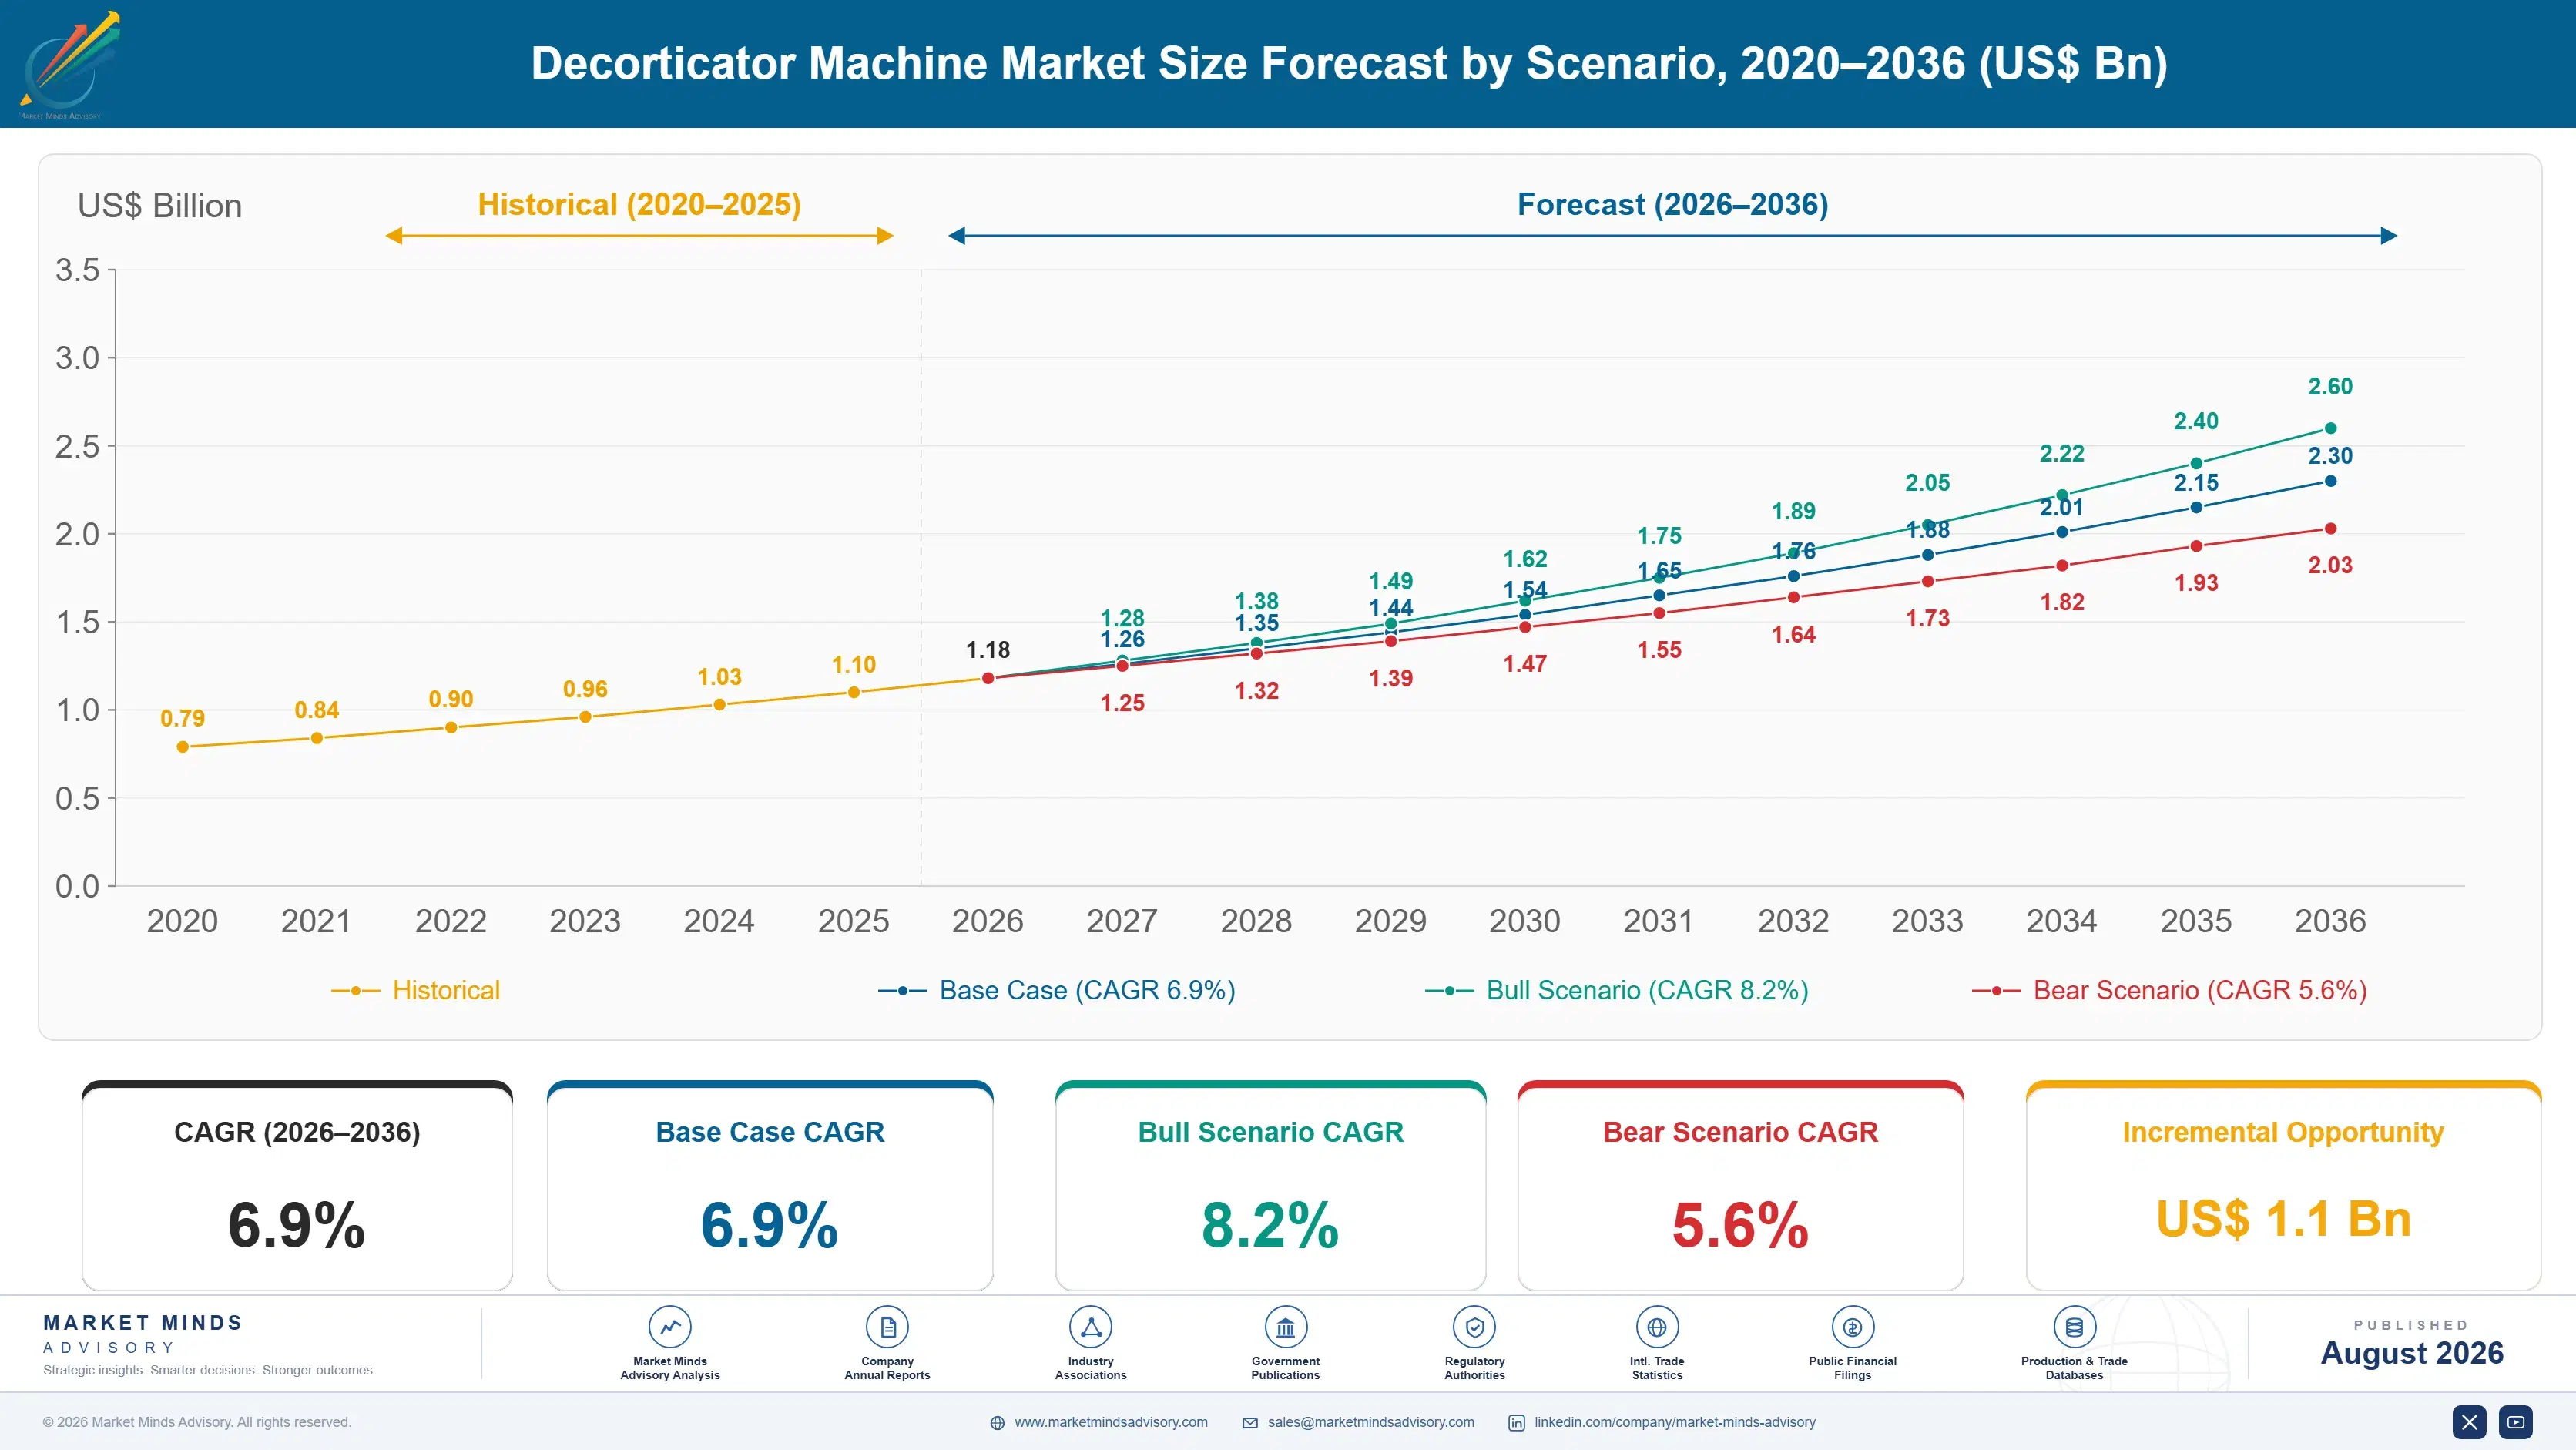
decorticator-machine-market-size-forecast-scenario-1787301608728
Decorticator demand grew steadily but unevenly between 2020 and 2025. Pandemic-era supply chain disruption delayed capital equipment orders through 2021, then a mechanization push across India and West Africa accelerated purchases from 2022 onward as labor availability tightened. Growth over the period compounded at an estimated 5.9%, trailing the forecast years because subsidy program rollout, not raw demand, paced adoption.
The base case assumes 6.9% annual growth through 2036, anchored on three mechanisms. First, India's mechanization subsidy scheme expands coverage from a handful of states to nationwide eligibility, pulling smallholder purchases forward. Second, plastic-alternative packaging regulation in the European Union and India lifts raw fiber demand, pulling sisal and jute decorticator orders with it. Third, edible oil demand growth across South Asia and West Africa sustains groundnut decorticator replacement cycles even where subsidy coverage lags.
A bull case builds if West African governments replicate India's subsidy model at scale, pushing growth toward 8.2%. The bear risk is subsidy funding: mechanization schemes depend on annual government budget allocation, and a funding pause similar to past agricultural subsidy interruptions could stall smallholder purchases and cap growth near 5.6%, a scenario several state-level programs have already experienced during tight fiscal years.

Mechanization Economics and the Subsidy-Cycle Dependency

Decorticator machinery sits at an unglamorous but essential junction of the agricultural supply chain, converting raw harvest into sellable fiber, kernel, or seed. Mechanization economics are shifting fast as manual processing, still dominant across smallholder regions, becomes uneconomic against rising rural wages and tightening harvest-season labor availability across South Asia and West Africa simultaneously.
MARKET CONCENTRATION24% CR5Fragmented industry with dozens of regional manufacturers competing
AVERAGE SELLING PRICE$18,500 per unitBlended price across cotton, groundnut, and fiber machine types
TOP PRODUCING COUNTRYIndia, 34%Single country supplies over a third of global output
CAPACITY UTILISATION68%Seasonal harvest cycles keep utilisation well below continuous-process norms
TRADE INTENSITY41% export shareNearly half of machines cross a border before installation
INPUT COST SHARE38% of COGSStructural steel and precision cutting components dominate input costs
Vendors compete less on unit price than on total cost of ownership: throughput per hour, spare-parts availability, and after-sales service response time increasingly decide tender awards and cooperative purchasing decisions. Manufacturing remains concentrated in India, with smaller but growing production bases in China and Italy, while African and Southeast Asian buyers increasingly demand local service depots before committing to multi-unit orders.
The next decade will be shaped by two forces pulling in the same direction: expanding government mechanization subsidy coverage and rising raw fiber demand tied to plastic-alternative packaging mandates. Both push adoption further into smallholder cooperatives that previously could not justify the capital cost of a continuous-throughput machine.
"Everyone assumed mechanization would spread on its own once labor got expensive enough. It didn't. It spread once governments started paying for half the machine."
Director, Agricultural Processing Equipment Practice · MMA Agricultural Processi

Market Trends

India's Sub-Mission on Agricultural Mechanization Expands Coverage

India's Sub-Mission on Agricultural Mechanization, administered through state agriculture departments, now subsidizes forty to fifty percent of decorticator purchase cost for smallholder and cooperative buyers across most major producing states, up from a dozen pilot districts in 2021. The scheme has become the single largest demand driver in the world's largest decorticator market, converting purchases that would otherwise stretch across a farmer's working lifetime into a single mechanization-season decision. Manufacturers are restructuring dealer networks around subsidy paperwork processing speed, since farmers increasingly choose vendors who can complete disbursement documentation fastest rather than vendors offering the lowest sticker price alone.
Market Impact: Raises machine payback urgency 30%
Plastic-Alternative Packaging Rules Lift Fiber Demand

European Union single-use plastics restrictions and India's extended producer responsibility rules for packaging are pushing brand owners toward jute and sisal-based packaging materials, lifting raw fiber demand faster than manual decortication capacity can supply it. Jute Corporation of India and several West African sisal cooperatives report order backlogs stretching multiple seasons as buyers lock in supply contracts ahead of expected shortages. For decorticator manufacturers, this converts a slow-growing legacy fiber-processing category into one of the fastest-growing segments in the portfolio, pulling capital investment toward natural fiber decorticator lines that were, until recently, considered a mature afterthought.
Market Impact: Cuts kernel breakage rates 8%

Market Opportunities and Growth Drivers

Rural Labor Costs Rise Across Producing Regions

Agricultural wage rates across major groundnut and cotton producing states in India have risen faster than general inflation for five consecutive years, as rural workers increasingly migrate toward construction and manufacturing jobs that pay more reliably than seasonal harvest labor. Manual decortication, historically the default for smallholder farmers, now costs more in labor than a financed machine costs in amortized monthly payments for many mid-sized cooperative operations. This inversion, labor cost exceeding machine financing cost, is the single clearest signal driving cooperative purchasing committees to approve mechanization budgets that would have been rejected outright five years earlier.
Market Impact: Excludes 40% of eligible smallholde

Edible Oil Demand Sustains Groundnut Processing Growth

Rising edible oil consumption across South Asia, West Africa, and China keeps groundnut processing volumes climbing even in years when raw acreage stays flat, since processors extract more value per harvested ton through better decortication yield rather than expanding planted area. Processors increasingly specify decorticators by kernel breakage rate rather than raw throughput, since a lower breakage rate directly raises oil extraction yield and finished kernel grade pricing. This has pushed manufacturers to redesign cutting mechanisms specifically for breakage reduction, a feature buyers now pay a measurable premium for over legacy models with higher throughput but worse kernel damage.
Market Impact: Idles 25% of capacity off-season

Market Restraints and Challenges

Smallholder Financing Access Remains Persistently Uneven

Even with subsidy coverage cutting sticker price by up to half, many smallholder farmers still cannot access the working capital or credit history required to finance the remaining cost, particularly in West Africa where formal agricultural lending remains thin. The root cause is a rural banking gap: branch penetration lags urban penetration by a wide margin across most producing regions, leaving farmers dependent on informal lenders charging rates that make financing uneconomic. This slows adoption precisely among the smallholders subsidy programs are designed to reach. Manufacturers and development finance institutions are piloting cooperative-guaranteed lending that pools credit risk.
Market Impact: Adds 45,000 subsidized units yearly

Seasonal Demand Concentrates Manufacturing and Delivery Risk

Decorticator orders concentrate heavily in the months immediately before harvest season, forcing manufacturers to either carry expensive idle capacity most of the year or risk missing delivery windows during peak demand, when buyers have little tolerance for delay. This seasonality also concentrates working capital risk, since manufacturers must build inventory months ahead of a demand spike that can shift by several weeks depending on monsoon timing in South Asia. Vendors are mitigating this by diversifying into Southern Hemisphere markets with offsetting harvest calendars, smoothing production schedules across a wider annual window rather than concentrating output around a single narrow season.
Market Impact: Lifts fiber decorticator orders 15%
3 additional market trends, 3 additional growth drivers, and 3 additional restraints and challenges are covered in the full report. Contact sales@marketmindsadvisory.com to access the complete intelligence.

Segment CAGR and Growth Architecture

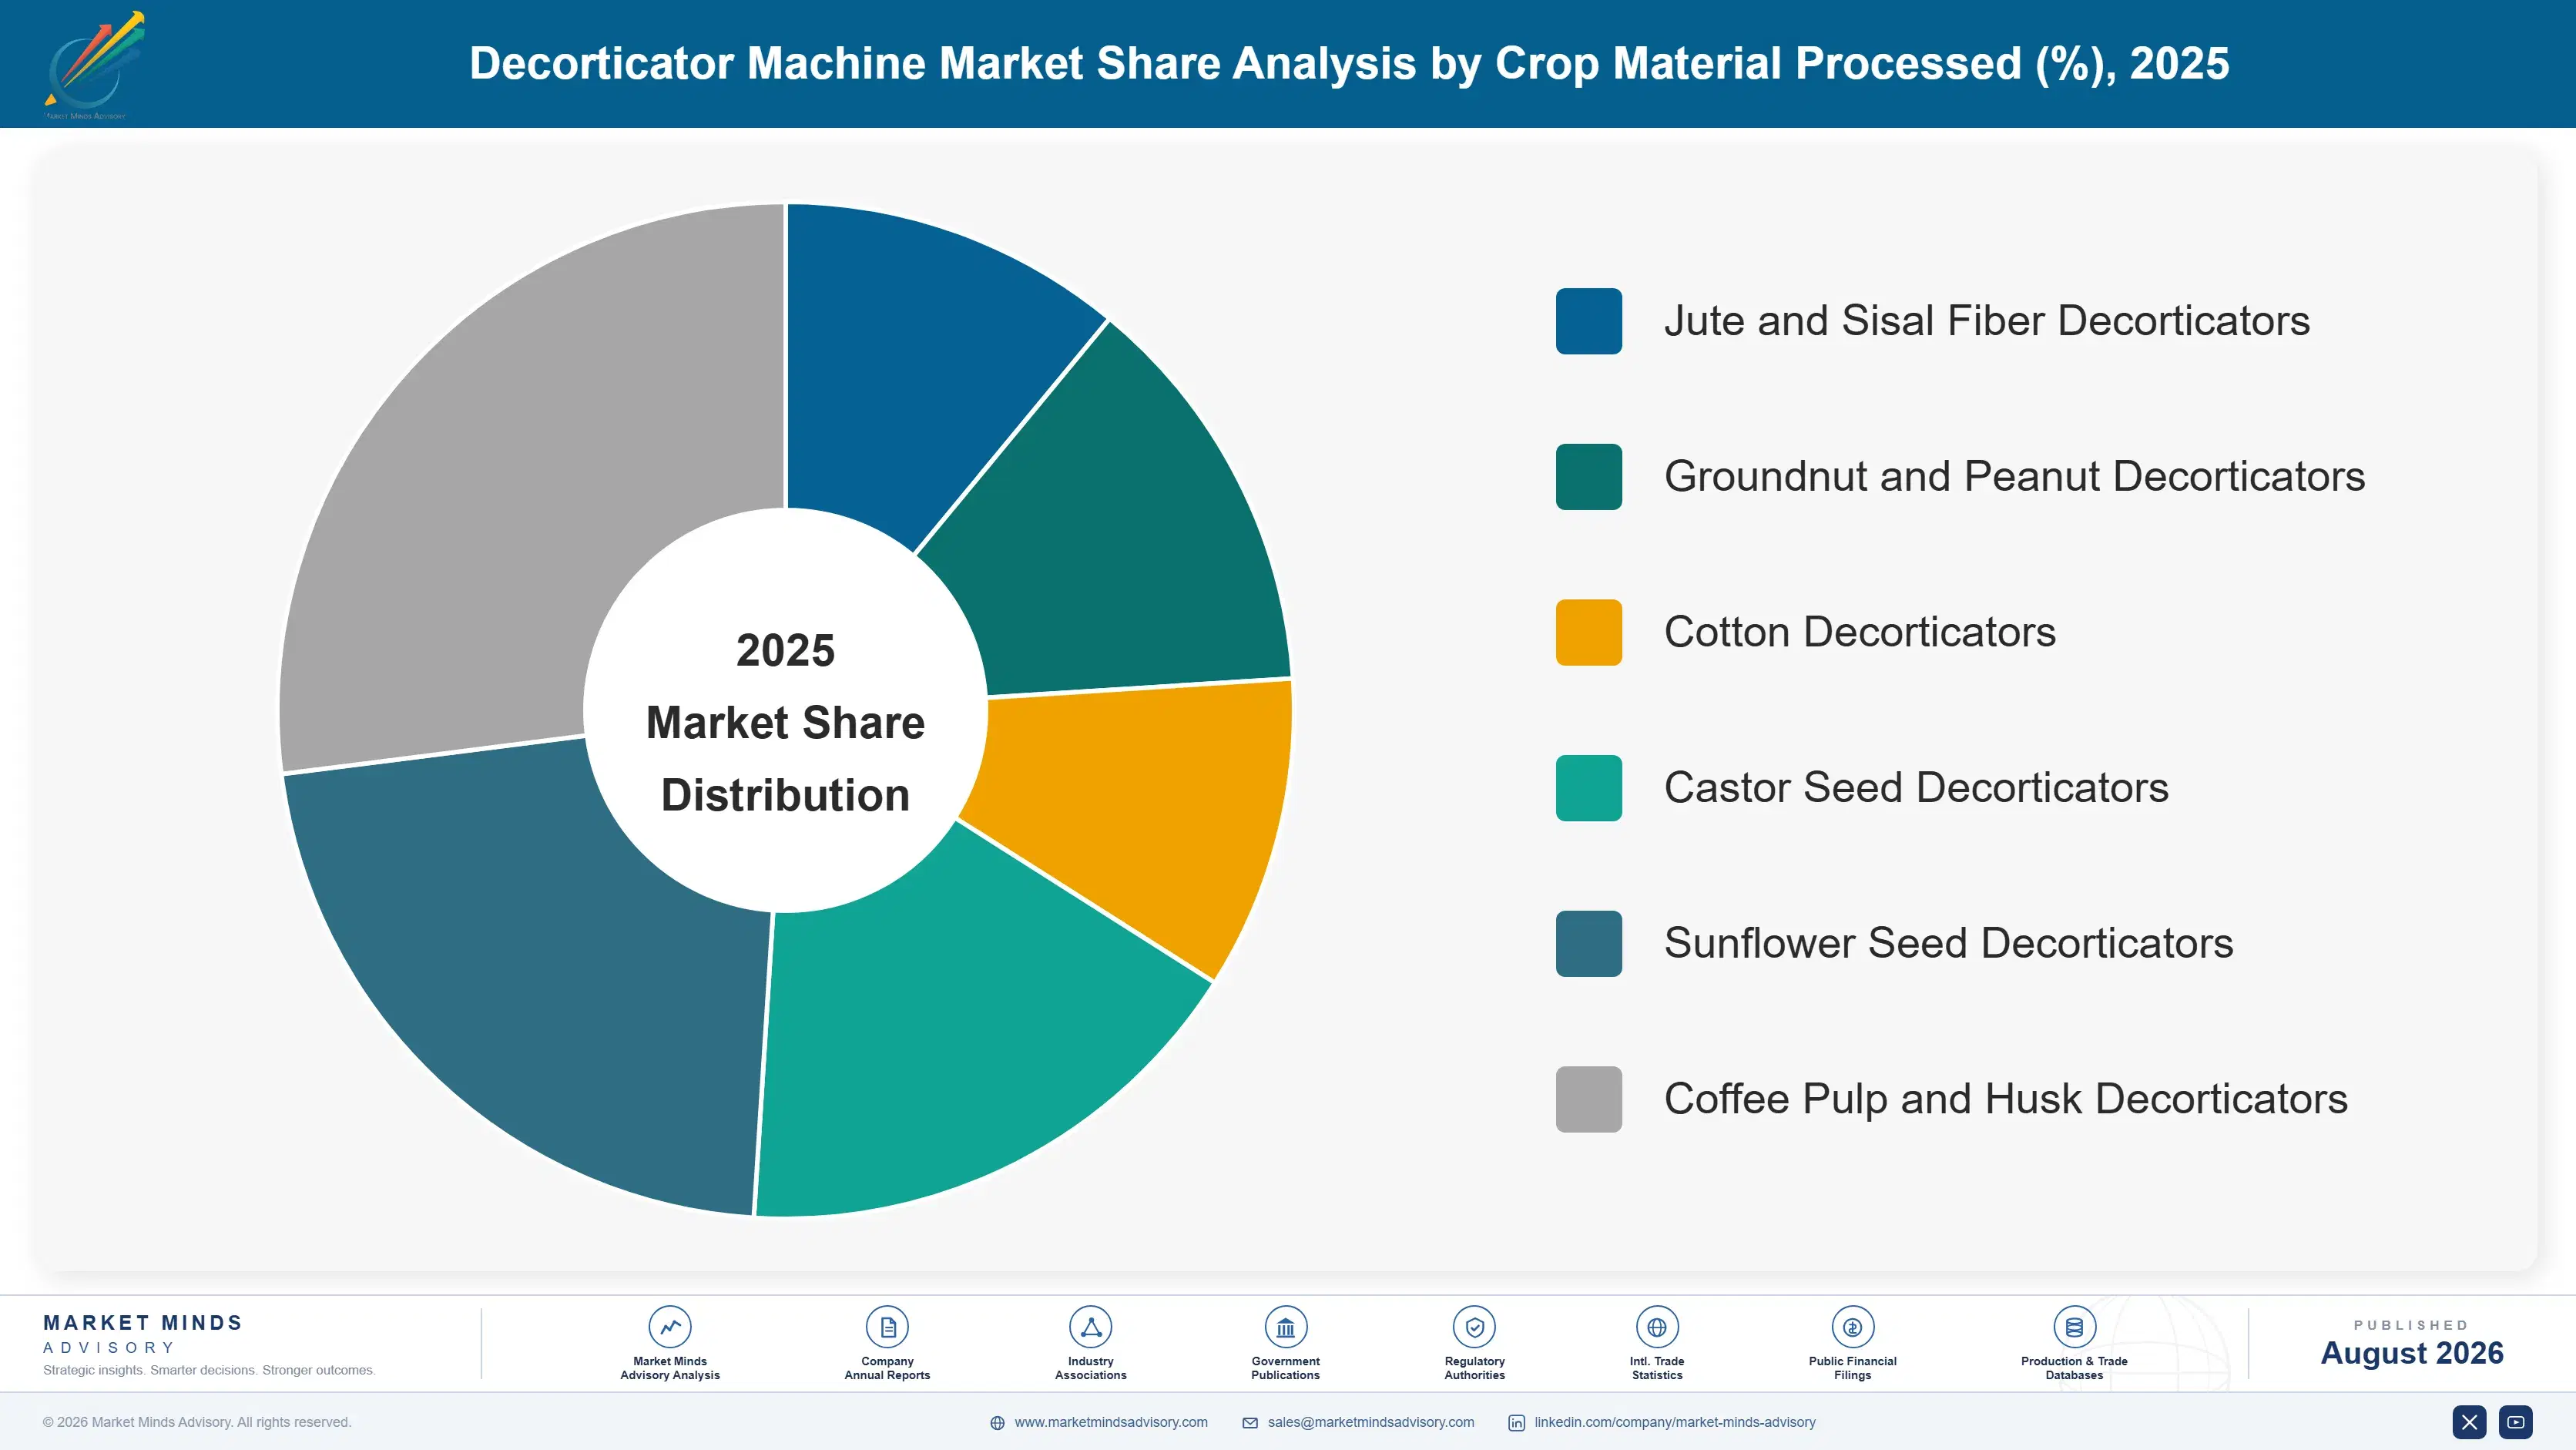
MMA segments the market by crop material processed, the classification manufacturers and buyers use when specifying machine configuration and cutting-mechanism design. This avoids blending upstream harvesting equipment, a separate machinery category entirely, with the crop-specific decorticator types that appear on a purchase order, keeping the six segments mutually exclusive and directly comparable across manufacturers and regions.
decorticator-machine-market-market-share-analysis-1787301609263

Jute and Sisal Fiber Decorticators

Natural fiber decorticators are converting from a slow, legacy category into the segment manufacturers compete hardest to win, as plastic-alternative packaging regulation in Europe and India pulls raw fiber demand upward faster than manual extraction can supply it. Growth concentrates in India's jute belt and East African sisal-growing regions, where cooperative processing centers replace hand-stripping with continuous-throughput machines to meet fixed-price supply contracts with packaging manufacturers. Bühler and several specialized Indian manufacturers have redesigned cutting drums specifically for fiber decortication rather than adapting seed-processing hardware, recognizing fiber quality depends on cut consistency as much as raw throughput. At a 9.4% forecast CAGR, roughly 1.4 times the market average, this segment pulls capital away from slower-growing seed processing categories.
CAGR 9.4%

Groundnut and Peanut Decorticators

Edible oil demand growth across South Asia, West Africa, and China is pulling groundnut decorticator orders upward even where planted acreage stays flat, since processors extract more value per harvested ton through better decortication yield and lower kernel breakage rather than expanding cultivated area. Government mechanization subsidies, especially India's Sub-Mission scheme, disproportionately favor this segment because groundnut processing touches more smallholder farmers than any other crop category covered in this report. Manufacturers increasingly differentiate on kernel breakage rate rather than raw throughput, since breakage directly determines oil extraction yield and finished kernel grade pricing that processors are paid against. Growth here tracks subsidy disbursement pace as closely as raw crop volume.
CAGR 8.6%
Full segment breakdown across 6 segments available in the complete report.

Regional Architecture and Country Demand Map

Demand concentrates where subsidy coverage, smallholder credit access, and raw crop volume overlap tightly. South Asia and Pacific leads on installed base and manufacturing scale, East Asia and Africa follow on fiber and oilseed growth, while Western markets convert more slowly off an already-mechanized base.

North America

United States cotton and specialty crop processors represent a mature, slow-growing decorticator market, since most large processing operations replaced manual and early-mechanical equipment decades ago and now buy primarily for replacement rather than first-time mechanization. Lummus Corporation's domestic manufacturing base gives US buyers shorter lead times than importing from Indian or European suppliers, reinforcing a home-market advantage that keeps a meaningful share of replacement demand with domestic vendors. Canada's smaller processing base, concentrated in prairie oilseed operations, follows a similar replacement-driven purchasing pattern. Growth trails faster-growing regions because the region's installed base is already largely mechanized, leaving limited first-time adoption upside remaining across most producing states this decade and the next.
Share: 22% | CAGR: 7.5% (2026 to 2036)

Western Europe

European demand centers less on raw crop decortication than on specialized fiber processing tied to packaging and technical textile applications, a narrower but higher-value niche than the smallholder-volume markets driving Asian and African demand. Regulatory pressure compounds this: European Union single-use plastics restrictions are pulling natural fiber demand upward, and several European converters are investing in dedicated decortication capacity rather than importing already-processed fiber. Italy and France anchor regional manufacturing capability, supplying specialized equipment to fiber processors across the continent. Growth trails Asian and African markets because Europe's raw crop processing volume is inherently smaller, limiting the addressable base for volume-driven machine sales across most member states covered here.
Share: 18% | CAGR: 5.3% (2026 to 2036)
Regional intelligence for 5 additional markets available in the complete report: East Asia, South Asia and Pacific, Latin America, Middle East and Africa, Eastern Europe. Contact sales@marketmindsadvisory.com.
decorticator-machine-market-country-cagr-analysis-1787301609801

Where Decorticator Vendors Actually Capture Margin

Hardware unit sales increasingly compete on subsidy compatibility and price alone, so the vendors protecting margin monetize the parts of the transaction adjacent to the machine itself: financing facilitation, spare parts, service contracts, and cutting mechanism upgrades. The four levers below reflect where MMA's interviews with processors and buyers show real willingness to pay.

Subsidy Paperwork and Disbursement Facilitation Services

Government mechanization subsidy schemes require extensive documentation, and farmers frequently abandon purchases when paperwork delays stretch across a planting season. Manufacturers building in-house teams to handle subsidy application, verification, and disbursement tracking on behalf of buyers are converting what used to be a farmer's administrative burden into a vendor-managed service, closing deals faster than competitors leaving buyers to navigate bureaucracy alone. This is most pronounced in India, where subsidy-linked sales now represent 60% of smallholder volume. Vendors offering this service report conversion rates from quote to purchase running meaningfully higher, since removing the paperwork barrier removes the single largest reason buyers delay.
Market Impact: Lifts quote-to-purchase conversion

Extended Spare Parts and Cutting Blade Contracts

Cutting blades and separator components wear fastest among decorticator parts, and machines idled during peak harvest season for want of a replacement blade cost buyers far more in lost processing days than the part itself. Manufacturers bundling multi-year spare parts contracts, guaranteeing blade delivery within a fixed window during harvest season, are converting an unpredictable maintenance expense into a predictable annuity revenue line worth roughly 12% of the original machine price per year. Cooperative buyers, who cannot risk missing a narrow processing window, increasingly favor vendors offering this guarantee even at a modest premium over reactive, order-as-needed parts sellers.
Market Impact: Adds recurring revenue worth roughl

Crop-Specific Cutting Mechanism Upgrade Packages for Processors

Buyers increasingly pay a premium to retrofit existing machines with crop-specific cutting mechanisms, particularly kernel-breakage-reduction upgrades for groundnut processors chasing higher oil-grade pricing, rather than replacing a machine outright. This retrofit-first approach lets manufacturers sell incremental upgrade revenue against an already-installed base without competing purely on new-unit price, and it gives cash-constrained cooperative buyers a lower-cost path to improved yield. MMA interviews suggest upgrade packages now represent an 18% share of aftermarket revenue for manufacturers with a large installed base, since the retrofit price sits well below a full replacement machine while improving processor economics within a season.
Market Impact: Grows aftermarket upgrade revenue b

Cooperative-Guaranteed Financing Partnerships for Smallholders

Partnering with development finance institutions and cooperative lenders to guarantee smallholder financing lets manufacturers close sales to buyers who could not otherwise access working capital, expanding the addressable market by roughly 15% beyond subsidy-eligible purchasers alone. Vendors structuring these partnerships directly, rather than leaving financing entirely to third parties, capture better visibility into buyer creditworthiness and can bundle financing terms into the equipment quote itself. Early data from pilot programs in West Africa suggest default rates on cooperative-guaranteed loans run below individual smallholder loans, since cooperative peer pressure and shared harvest proceeds provide informal collateral individual lending lacks.
Market Impact: Expands addressable buyer base by r

Who Controls the Margin Pool

CR5 sits at 24%, reflecting a fragmented industry dominated by dozens of regional manufacturers serving local crop mixes. Lummus Corporation and Bühler Group lead on a revenue basis, with neither commanding the outright dominance typical of more consolidated agricultural equipment categories. The gap between these two leaders and the next tier of regional Indian manufacturers is narrower than in most global equipment categories, since local service coverage often matters more than brand scale.
Current activity centers on three dimensions: subsidy compatibility and paperwork facilitation, spare parts and service network density across rural distribution territories, and application-specific cutting engineering for crop-specific yield improvement. Vendors lacking local service depots are partnering with regional distributors rather than losing tenders on service-guarantee terms alone, since cooperative buyers now shortlist based on documented local repair capability.

Emerging pressure comes from Chinese manufacturers expanding into Southeast Asian and African markets on price, competing directly against Indian regional players and global equipment makers. If subsidy-driven Indian demand growth continues outpacing other regions, expect rankings among the next five challengers to shift by 2029, as Indian manufacturers with strong subsidy relationships convert local scale into export competitiveness against Chinese and Western rivals.
decorticator-machine-market-company-positioning-matrix-1787301610332

Competitive Moat and Risk Dimensions

LUMMUS CORPORATION

Moat: Domestic Manufacturing and Service Base

Lummus Corporation's century-long presence in US cotton processing equipment gives it domestic manufacturing scale and a service network few importers can match, letting it win replacement contracts on lead time and parts availability alone. That combined footprint makes Lummus the default vendor for US processors unwilling to risk import lead-time delays during harvest season.
LUMMUS CORPORATION

Risk: Narrow Crop and Geographic Base

Lummus's revenue remains concentrated in cotton processing equipment sold predominantly into a mature, slow-growing US market, leaving it exposed to any structural decline in domestic cotton acreage. Expanding into faster-growing groundnut and fiber decorticator segments in Asia and Africa requires competing directly against better-positioned regional incumbents on their home ground.
BÜHLER GROUP

Moat: Global Seed Processing Engineering Scale

Bühler Group's diversified grain and oilseed processing engineering base gives it R&D scale and cross-application expertise few specialized decorticator manufacturers can match, letting it bundle decortication equipment into broader agricultural processing plant contracts. That reputation lets it command a pricing premium among larger commercial processors less price-sensitive than smallholder cooperative buyers.
BÜHLER GROUP

Risk: Premium Pricing Limits Smallholder Reach

Bühler's premium positioning and higher price point put it at a disadvantage competing for subsidy-linked smallholder purchases, where price sensitivity is highest and where Indian and Chinese regional manufacturers compete aggressively. Expanding down-market without eroding the premium brand positioning that supports its commercial-processor business remains an unresolved strategic tension.

Players Tracked

Prominent Players

Lummus Corporation
Bühler Group
Bajaj Steel Industries Limited
Alvan Blanch Development Co. Ltd.
Amar Agro Industries

Other Key Players

Lakshmi Machine Works Limited
Kisankraft Limited
Cimbria A/S
Petkus Technologie GmbH
Westrup A/S
Chanderpur Works Private Limited
National Engineering Industries
Continental Agri Machinery Inc.
Anand Sales Corporation
Sunstar Overseas Limited
Jyoti Industries
Malik Industries
Suvidhi Engineering Works
Rajkot Agro Industries
Dongyi Machinery Manufacturing Co., Ltd.

Recent Developments

JUNE 2025

Lummus Corporation Launches High-Throughput Cotton Decorticator Line

Lummus Corporation introduced an upgraded cotton decorticator line featuring higher throughput per hour and reduced fiber damage rates, targeting large US processing cooperatives seeking to consolidate multiple aging machines into fewer, higher-capacity units. The launch responds to processor demand for equipment requiring less seasonal maintenance downtime during peak harvest windows.
Signal: Signals Lummus defending its domestic repl
NOVEMBER 2025

Bühler Group Opens Seed Processing Application Center in India

Bühler Group opened a dedicated application testing center near Ahmedabad, allowing Indian groundnut and oilseed processors to trial decortication configurations before committing to large capital purchases. The center also supports technician training for Bühler's expanding distributor network handling installation and after-sales service across western India.
Signal: Signals Bühler prioritizing direct India p
FEBRUARY 2026

Bajaj Steel Industries Expands Groundnut Decorticator Manufacturing Capacity

Bajaj Steel Industries announced a capacity expansion at its Madhya Pradesh manufacturing facility, adding dedicated production lines for groundnut decorticators to address backlog tied to India's expanding mechanization subsidy scheme. The expansion targets reduced delivery lead times ahead of the next major national harvest cycle.
Signal: Signals Bajaj Steel positioning to capture

Steel, Motors, and Precision Component Costs

Structural steel framing, electric motors, and precision-machined cutting components together account for roughly 38% of decorticator cost of goods sold, with steel and motors contributing the larger share. Steel is sourced through regional mills close to manufacturing hubs, while precision cutting components, requiring hardened tool steel machining, come from a smaller number of specialized suppliers concentrated in India, China, and Italy.
Steel prices spiked sharply through 2024 as global infrastructure and construction demand competed directly with agricultural equipment manufacturers for the same rolled steel supply, according to India's Ministry of Commerce steel pricing data. Manufacturers without forward purchasing agreements saw input costs rise faster than they could pass through to government tender pricing, which is often fixed months in advance, compressing margins on subsidy-linked contracts signed before the spike.

Smaller regional manufacturers without hedging arrangements or long-term steel supply contracts absorb price volatility directly into thin margins, while larger players like Bühler and Lummus use group-level procurement scale to negotiate forward pricing across multiple equipment lines. Indian manufacturers selling into government tenders carry additional exposure, since tender pricing is frequently fixed before delivery, leaving limited room to pass through steel cost increases mid-contract.
decorticator-machine-market-cost-volatility-analysis-1787301610531

Forward Steel Purchasing Agreements with Regional Mills

Larger vendors are locking six to twelve months of steel supply through forward agreements with regional mills rather than buying spot, smoothing input cost volatility into predictable production budgeting. This reduces exposure to spikes like the 2024 construction-driven surge, though it requires working capital smaller regional manufacturers typically lack, reinforcing a scale advantage for larger players.

Tender Pricing Escalation Clauses for Government Contracts

Manufacturers increasingly negotiate steel-indexed escalation clauses into government tender contracts, passing a defined share of input cost swings through to procurement agencies rather than absorbing them across a fixed-price contract term. Procurement agencies have gradually accepted these terms given the alternative of vendors withdrawing from tenders altogether, a shift several state agencies adapted to.

Dual-Sourcing Precision Cutting Components

Vendors are qualifying second cutting-component suppliers across different countries rather than depending on a single specialized machining source, reducing single-point-of-failure risk after recent regional supply disruptions. This adds qualification cost and lead time up front but protects delivery schedules during localized shortages, a tradeoff most large-volume manufacturers now consider worth accepting given how costly a missed harvest-season delivery window can be.

Portfolio Architecture for Margin Defence

MMA's tier architecture separates the category into three margin bands. Volume and commodity-adjacent smallholder units compete on subsidy-linked price and carry thin margin, premium and certified cooperative and mid-scale commercial units carry higher margin on throughput and service guarantees, and sustainability-linked next-generation lines, including breakage-reduction and fiber-specific cutting systems, command the highest margin as the newest tier. Margin dispersion between tiers has widen
The tension between volume and premium plays out most visibly in cooperative purchasing committees, which want subsidy-eligible pricing but increasingly recognize that a marginally more expensive machine with better breakage or throughput performance pays for itself within a season or two. Individual smallholder farmers remain the most price-sensitive buyers and slowest to move up-tier. Larger cooperatives, by contrast, increasingly anchor purchasing decisions on lifetime operating cost rather than sticker price.

High-value margin pools concentrate in commercial and cooperative-scale orders bundled with financing facilitation, spare parts contracts, and crop-specific cutting upgrades, where service and application-engineering revenue increasingly outweighs margin earned on the base machine alone. That shift is pushing manufacturers to organize sales teams around total account value rather than unit sales.

Volume / Commodity-Adjacent Tier

Basic smallholder-scale units sold primarily on subsidy-eligible price against dozens of regional competitors, serving cost-sensitive individual farmers where gross margin stays thin and competition is driven almost entirely by landed unit cost and subsidy paperwork speed.
Gross Margin: 17%-20%

Premium / Certified Tier

Cooperative and mid-scale commercial units specified by processing cooperatives and larger farms requiring documented throughput, service coverage, and financing options, commanding meaningfully higher margin on reliability and total-operating-cost economics rather than sticker price alone.
Gross Margin: 29%-32%

Sustainability / Regulatory / Next-Generation Tier

Breakage-reduction and fiber-specific cutting systems positioned for processors chasing export-quality grading and packaging-regulation-driven fiber demand, where crop-specific engineering and yield-improvement performance support the category's highest margin across most producing regions today.
Gross Margin: 36%-39%
decorticator-machine-market-portfolio-architecture-1787301611047

Subsidy Cycles and Replacement Economics

A decorticator sale is rarely a pure one-time transaction anymore. Spare parts contracts, subsidy paperwork facilitation, and multi-year service agreements convert what used to be a single capital purchase into a recurring relationship running eight to twelve years, matching typical machine replacement cycles. Vendors that capture the service and parts attachment at time of sale retain more lifetime value per installed unit than those competing purely on machine price.
Adoption depth varies sharply by buyer type. Cooperative and commercial-scale processors convert fastest and most completely, standardizing a single machine specification across multiple processing centers once a pilot proves out, making them the highest-value account type despite thinner per-unit margin than smallholder sales. Individual smallholder farmers convert more slowly, often relying on shared cooperative machines rather than individual ownership for years before purchasing their own unit.

A generational shift in buyers is compounding the subsidy-driven shift. Younger cooperative managers, more comfortable navigating digital subsidy application portals than an older generation of farmers, are accelerating disbursement timelines and converting eligible members faster than manual paperwork processes ever allowed. That shift is compressing the sales cycle for vendors even in regions where subsidy coverage remains partial.
decorticator-machine-market-end-use-penetration-index-1787301611546

What Matters Most Through 2036

These are among the four positions where our research anticipates prominent divergence between winners and laggards over the coming forecast period. Each is grounded in the demand model, the regulatory perimeter, and the announced capacity pipeline.
01 / SUBSIDY PAPERWORK CAPABILITY

Build in-house subsidy facilitation teams before competitors do

Subsidy-linked sales now represent a majority of smallholder volume in India, the world's largest decorticator market, and paperwork delay remains the single largest reason buyers abandon a purchase decision. Vendors that build dedicated subsidy facilitation capability convert quote-to-purchase rates meaningfully higher than competitors leaving buyers to navigate bureaucracy alone, according to MMA's expert interviews with cooperative purchasing committees. Continuing to treat subsidy paperwork as the buyer's problem rather than the vendor's opportunity risks ceding the fastest-growing distribution channel to competitors willing to build that capability first.
02 / FIBER SEGMENT INVESTMENT

Prioritize fiber-specific cutting engineering over incremental seed refinement

Jute and sisal fiber decorticators are growing at roughly 1.4 times the category average, pulled by packaging-regulation-driven demand that shows no sign of slowing through the forecast period covered in this report. Vendors that solve fiber cut-quality consistency first will capture disproportionate share in India's jute belt and East Africa's sisal-growing regions before competitors close the technical gap. Continuing to treat fiber decortication as an adaptation of seed-processing hardware rather than a distinct engineering discipline risks ceding the fastest-growing, most defensible segment to specialists.
03 / COOPERATIVE FINANCING PARTNERSHIPS

Formalize development-finance partnerships to reach unfinanceable smallholders

Smallholder financing access remains the binding constraint on adoption even where subsidy coverage exists, since many farmers still cannot access the working capital needed to cover the remaining purchase cost after subsidy discounts apply. Manufacturers that formalize cooperative-guaranteed lending partnerships with development finance institutions expand their addressable market well beyond subsidy-eligible purchasers alone, converting a financing gap into a growth channel competitors without similar partnerships cannot access. This remains underexploited by every player outside the two largest global vendors currently active in the category.
04 / REGIONAL MANUFACTURING POSITIONING

Expand West African service depots ahead of cooperative demand

West African groundnut and sisal cooperatives are growing quickly, yet regional manufacturing and service capacity remains concentrated in India and China, leaving a widening gap between demand growth and local support infrastructure across Nigeria, Senegal, and Tanzania. Vendors that establish service depots or assembly capability in West Africa now will secure preferred-vendor status with cooperative buyers before competitors catch up on lead time and repair responsiveness. Waiting for demand to fully materialize before investing risks losing first-mover advantage in one of the fastest-growing markets tracked.

Engagement Snapshot From the Field

A live engagement with an industry participant carrying material or product regulatory and market exposure ahead of a defining policy shift, showing how our research translates into a defensible multi-year portfolio strategy.
MARKET MINDS ADVISORY · CLIENT ENGAGEMENT SUMMARY
Decorticator Machine Producer Strategic Portfolio Review and Transition Roadmap 2026·Investment Scenario on Decorticator Machine Exposure Evaluation 2025-26
CLIENT PROFILE
The client is a cooperative network representing several thousand smallholder groundnut farmers across Senegal and Mali, most still relying on manual or semi-mechanized decortication that limited processing throughput and oil-grade kernel yield. Facing rising export contract volume commitments the network could not meet with existing manual capacity, cooperative leadership needed a financing and mechanization sequencing plan covering a planned capital outlay of roughly $28 million (client-reported, unverified by MMA).
STRATEGIC CHALLENGE
Cooperative leadership wanted to mechanize quickly to meet export contract volumes, but individual member farmers lacked the credit history required for direct equipment financing, and available development finance funding covered only a fraction of the machines needed. The network needed a sequencing plan prioritizing which processing centers to mechanize first, balancing export contract urgency against realistic financing availability across a multi-year rollout.
MMA APPROACH
MMA built a processing-center prioritization model combining export contract volume commitments, existing manual throughput gaps, and development finance funding availability, ranking all fifteen cooperative processing centers into three mechanization-priority tiers. The analysis drew on MMA's primary survey data and expert interviews with decorticator manufacturers and development finance institutions to benchmark realistic machine costs and cooperative-guaranteed financing terms available to a network of this scale.
KEY FINDINGS
  1. The three highest-volume processing centers accounted for over half of total export contract commitments, making them the clear first-priority mechanization tier regardless of available financing coverage elsewhere.
  2. Cooperative-guaranteed financing structures secured meaningfully lower default rates than individual member financing attempts, since shared harvest proceeds functioned as informal collateral development finance lenders valued highly.
  3. Processing centers furthest from paved transport routes showed the strongest standalone case for mechanization, since manual processing delays there most directly threatened export shipment deadlines.
  4. Member farmers responded far more positively to mechanization framed around meeting export contracts and preserving cooperative membership benefits than to messaging centered on efficiency alone.
CLIENT PROFILE
The client is a cooperative network representing several thousand smallholder groundnut farmers across Senegal and Mali, most still relying on manual or semi-mechanized decortication that limited processing throughput and oil-grade kernel yield. Facing rising export contract volume commitments the network could not meet with existing manual capacity, cooperative leadership needed a financing and mechanization sequencing plan covering a planned capital outlay of roughly $28 million (client-reported, unverified by MMA).
STRATEGIC CHALLENGE
Cooperative leadership wanted to mechanize quickly to meet export contract volumes, but individual member farmers lacked the credit history required for direct equipment financing, and available development finance funding covered only a fraction of the machines needed. The network needed a sequencing plan prioritizing which processing centers to mechanize first, balancing export contract urgency against realistic financing availability across a multi-year rollout.
MMA APPROACH
MMA built a processing-center prioritization model combining export contract volume commitments, existing manual throughput gaps, and development finance funding availability, ranking all fifteen cooperative processing centers into three mechanization-priority tiers. The analysis drew on MMA's primary survey data and expert interviews with decorticator manufacturers and development finance institutions to benchmark realistic machine costs and cooperative-guaranteed financing terms available to a network of this scale.
KEY FINDINGS
  1. The three highest-volume processing centers accounted for over half of total export contract commitments, making them the clear first-priority mechanization tier regardless of available financing coverage elsewhere.
  2. Cooperative-guaranteed financing structures secured meaningfully lower default rates than individual member financing attempts, since shared harvest proceeds functioned as informal collateral development finance lenders valued highly.
  3. Processing centers furthest from paved transport routes showed the strongest standalone case for mechanization, since manual processing delays there most directly threatened export shipment deadlines.
  4. Member farmers responded far more positively to mechanization framed around meeting export contracts and preserving cooperative membership benefits than to messaging centered on efficiency alone.
RECOMMENDED STRATEGY
Phase 1: Phase 1 (Months 1 to 6): Mechanize the three highest-volume processing centers and secure cooperative-guaranteed financing terms with development finance partners ahead of the next harvest. Phase 2: Phase 2 (Months 7 to 18): Mechanize remaining centers furthest from transport routes, applying financing terms validated in phase one to accelerate cooperative approval. Phase 3: Phase 3 (Months 19 to 36): Mechanize lower-volume centers opportunistically as financing capacity allows, using relationships built in earlier phases to sustain momentum.
OUTCOME
The cooperative network mechanized its three highest-priority centers within fourteen months of the engagement, ahead of the original two-year target, and reported meeting export contract volume commitments in full for the first time in three seasons (client-reported, unverified by MMA). Member participation in cooperative-guaranteed financing exceeded projections once export-contract framing replaced efficiency-focused messaging in outreach materials.

Frequently Asked Questions

Foundational context covering the market sizes, CAGR, scope, country, region and competition that inform every finding below. This section is provided to cover basics and most often pre-purchase conversations, answered from the MMA Primary Research Dataset.

What is the current size of the Decorticator Machine Market?

MMA estimates the global decorticator machine market at $1.1 billion in 2025. Growth concentrates in South Asia and Middle East and Africa, driven by mechanization subsidies and rising fiber and edible oil processing demand.

How large will the Decorticator Machine Market be by 2036?

MMA forecasts the market reaching $2.3 billion by 2036, up from $1.2 billion in 2026. That represents roughly a 1.92 times expansion over the ten-year forecast period.

What is the CAGR for the Decorticator Machine Market 2026 to 2036?

MMA's base case forecasts a 6.9% compound annual growth rate, with a bull case of 8.2% and a bear case of 5.6% depending on subsidy funding continuity.

Which segment is growing fastest?

Jute and sisal fiber decorticators lead at a 9.4% CAGR, roughly 1.4 times the overall market rate, as plastic-alternative packaging regulation pulls raw fiber demand upward faster than manual extraction can supply it.

Who are the major companies in the Decorticator Machine Market?

Lummus Corporation, Bühler Group, Bajaj Steel Industries, Alvan Blanch, and Amar Agro Industries lead the category, together holding an estimated 24% combined share on a revenue basis.

Which country is growing fastest?

India leads at an estimated 10.8% CAGR, outpacing the global average as its national mechanization subsidy scheme expands coverage from pilot districts to nationwide eligibility.

Report Segmentation Architecture

The full report scope spans multiple orthogonal segmentation dimensions, with cross-tabulated demand data provided for each dimension pair. Coverage extends further to regional breakdowns, trend trajectories, and the competitive detail needed to support segment-level decision-making.

By Crop Material Processed

  • Jute and Sisal Fiber Decorticators
  • Groundnut and Peanut Decorticators
  • Cotton Decorticators
  • Castor Seed Decorticators
  • Sunflower Seed Decorticators
  • Coffee Pulp and Husk Decorticators

By End-Use Industry

  • Textile and Cordage Manufacturing
  • Edible Oil Processing
  • Packaging and Technical Textiles
  • Food and Beverage Processing
  • Government and Cooperative Procurement

By Commercial Dimension

  • Direct Equipment Purchase
  • Subsidy-Linked Financed Purchase
  • Cooperative-Guaranteed Financing
  • Distributor and Dealer Channel

By Region

  • North America
  • Western Europe
  • East Asia
  • South Asia and Pacific
  • Latin America
  • Middle East and Africa
  • Eastern Europe

Scope, Methodology, and Coverage

Every figure in this report is reproducible from documented input assumptions. The scope below maps the historical period, the forecast horizon, the segmentation dimensions, and the countries covered, alongside the underlying primary and qualitative methodology.
Historical Period
2020 to 2025
Forecast Period
2026 to 2036
Base Year
2025 (USD billions; MMA Primary Research Dataset, August 2026)
Market Definition
This report covers mechanical and semi-automated equipment that separates fiber, husk, shell, or seed coat from raw agricultural material, spanning cotton, groundnut, jute, sisal, castor, sunflower, and coffee processing applications. It excludes downstream ginning, oil extraction, and spinning equipment that operates on already-decorticated material.
Quantitative Units
USD billions (current prices); unit shipment volumes where cited
Segmentation Dimensions
By Crop Material Processed; By End-Use Industry; By Commercial Dimension; By Region
Regions Covered
North America, Western Europe, East Asia, South Asia and Pacific, Latin America, Middle East and Africa, Eastern Europe
Countries Covered
USA, China, Germany, France, UK, Japan, South Korea, India, Australia, Canada, Brazil, Mexico, Indonesia, Vietnam, Thailand, Malaysia, UAE, Saudi Arabia, South Africa, Nigeria, Turkey, Poland, Netherlands, Italy, Spain, Sweden, Switzerland, Argentina, Colombia, Singapore, and additional markets relevant to this sector
Key Companies Profiled
Lummus Corporation, Bühler Group, Bajaj Steel Industries Limited, Alvan Blanch Development Co. Ltd., Amar Agro Industries, Lakshmi Machine Works Limited, Kisankraft Limited, Cimbria A/S, Petkus Technologie GmbH, Westrup A/S, Chanderpur Works Private Limited, National Engineering Industries, Continental Agri Machinery Inc., Anand Sales Corporation, Sunstar Overseas Limited, Jyoti Industries, Malik Industries, Suvidhi Engineering Works, Rajkot Agro Industries, Dongyi Machinery Manufacturing Co., Ltd.
Quantitative Methodology
Primary survey, n=3,800 respondents, Q4 2025, six countries; demand-side model with trade association cross-validation
Qualitative Methodology
47 expert interviews, Q4 2025; applied to validate demand model assumptions, identify emerging dynamics, and assess competitive positioning
Report Format
PDF and XLSX data workbook (Word format preview document)
Publisher
Market Minds Advisory
Report Code
MMA-2026-AGR-201
Published
August 2026
Contact
sales@marketmindsadvisory.com | www.marketmindsadvisory.com

Purchase the full Decorticator Machine Market Report (2026 to 2036).

The full report provides detailed market sizing and ten-year forecasts for the global decorticator machine market, broken out across all seven regions and six crop-material segments covered in this summary. It includes complete profiles of the top twenty manufacturers, including capacity, distribution footprint, and recent corporate developments, along with a detailed input-cost and subsidy-policy tracking model calibrated to primary survey data. Buyers receive a full regional data workbook, segment-level forecast tables through 2036, and a competitive benchmarking matrix built on the same commercially consistent basis used throughout this summary. A dedicated chapter addresses mechanization subsidy program tracking across major producing countries.
Full regional data workbook across all seven regions
Twenty-vendor competitive profiles with capacity benchmarking
Segment-level forecast tables through 2036 by crop type
Subsidy program tracking chapter across major producing countries
Input-cost and steel pricing sensitivity model
Access to MMA analyst inquiry for three months

Built For The People Who Decide

From boardroom strategy to bench-side execution, this report is read cover-to-cover by leaders shaping the next decade of their industry, turning demand scenarios, market dynamics and valuation benchmarks into decisions.
CXOs/ Presidents/ VPs/ Managers
M&A and Corporate Development
Strategy Teams and R&D Heads
Procurement and Product Directors
Regulatory and Compliance Leaders
Investor Relations and Equity Analysts