Market Minds Advisory
Decorative Paints Market

Decorative Paints Market: Repaint Economics, the Tinting Machine as Distribution Asset, and Titanium Dioxide Exposure

Almost three quarters of every litre sold goes onto a wall that was already painted, which means this market tracks housing transactions and consumer confidence rather than any construction forecast.

Lead Analyst

Bilal Shaikh

Published

September 2026

Make Smarter Decisions with Customized Research Insights

Request a free sample report and evaluate market opportunities, growth trends, and competitive dynamics relevant to your business needs.

2025 MARKET VALUE$92.6BMarket Size 2025
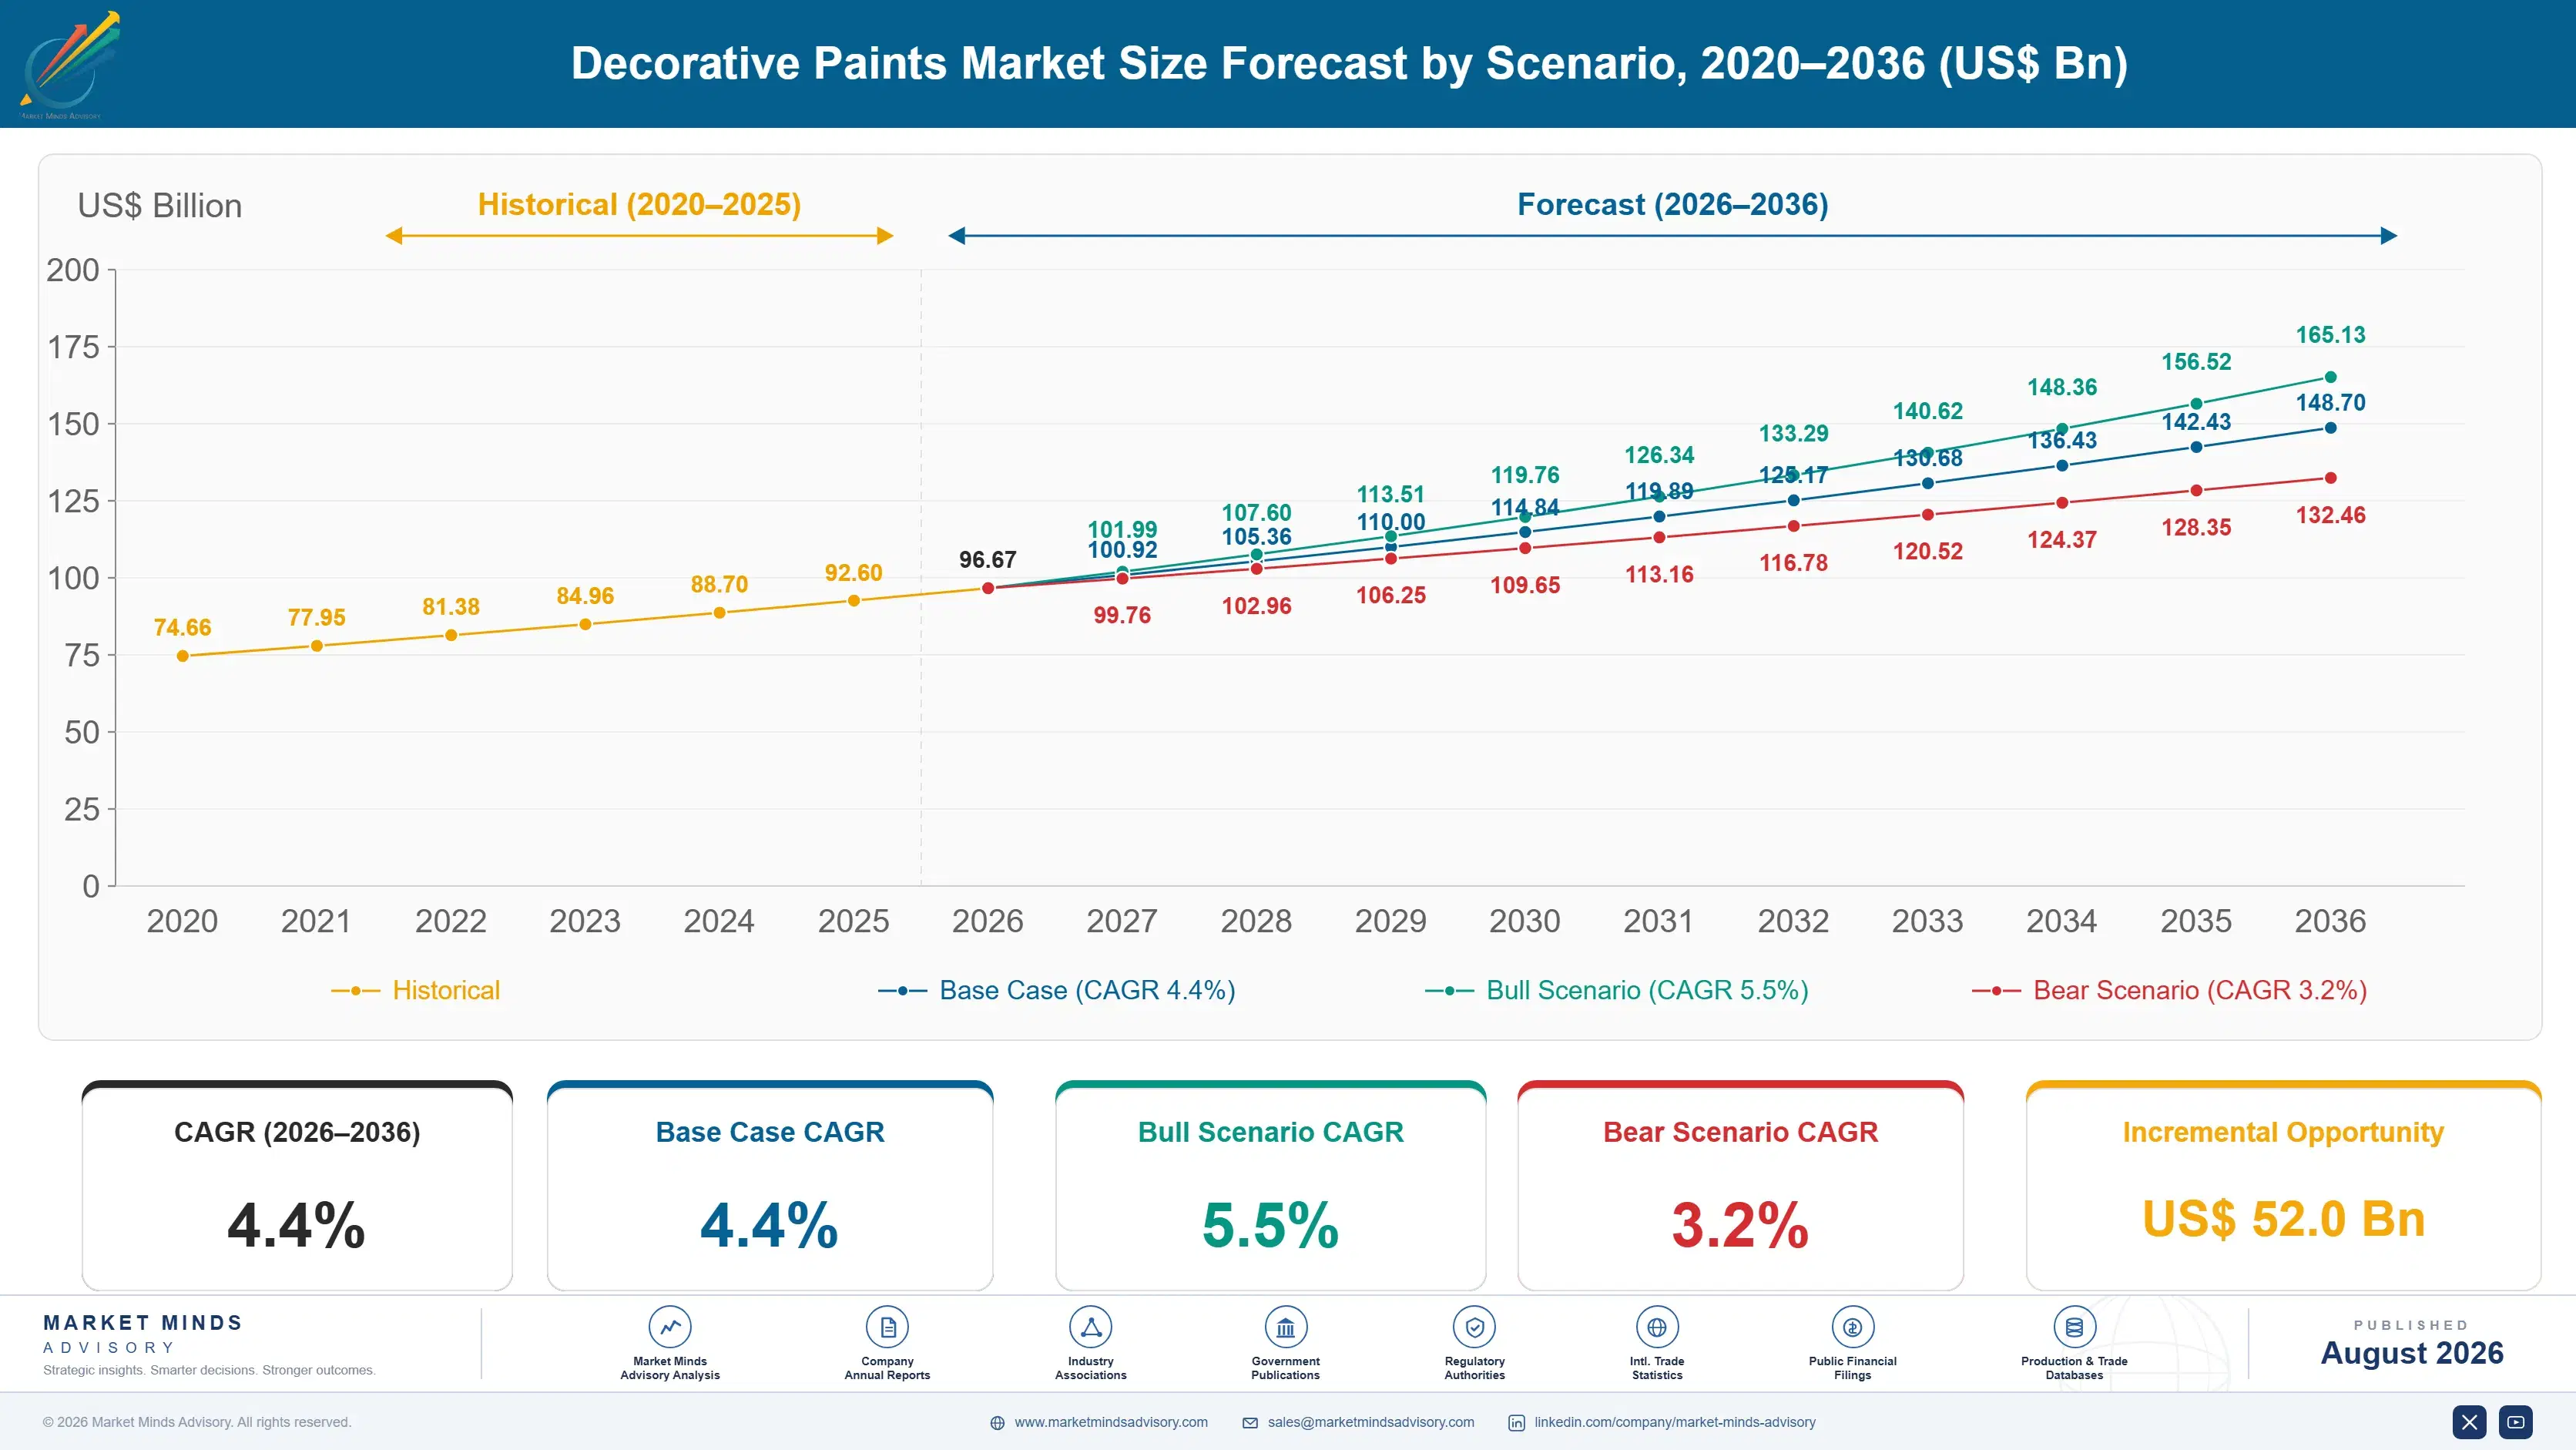
2036 FORECAST VALUE$148.7BBase Case , 2026 to 2036
CAGR 2026 TO 20364.4 %Bull 5.5% / Bear 3.2%
INCREMENTAL OPPORTUNITY$52.0BNet 10- year value creation
EXPANSION MULTIPLE1.54x2036 value over 2026 base
Strategic Levers
M&A Pipeline
Regional Outlook
Country Rankings
Competitive Intelligence
Segmental Deep-dive
Call-Us : 91 93563 13602

Executive Snapshot and Market Trajectory

Repainting supplies 72% of every litre sold, which makes this a consumer confidence market wearing construction industry clothing. Housing transactions, disposable income, and weather move volumes far more reliably than any building starts figure ever has. Manufacturers who plan production against construction data consistently forecast the wrong year.
Commercial power sits with whoever controls the tinting machine and the shelf, because colour is chosen at the point of sale and the machine standing there decides which brand gets mixed. Functional and specialty coatings grow fastest at 8.4%, roughly 1.91 times the market, and carry the only genuinely expanding margin pool. East Asia holds 30% of global value on Chinese, Japanese, and Korean demand together.
Concentration is low at roughly 31% for the top five, unusually so for a chemicals market, because distribution is local and brand loyalty is regional. Titanium dioxide alone is 24% of manufacturing cost and swings harder than any other input. Professional decorators apply 44% of volume and buy on entirely different criteria from consumers. Serving them well is what holds volume steady through the consumer downturns that flatten retail-weighted competitors entirely.
Market Definition
The market comprises architectural coatings applied to buildings for decorative and protective purposes, covering interior wall emulsions, exterior wall and masonry coatings, wood coatings and stains, primers, sealers and undercoats, functional and specialty decorative coatings, and texture and decorative finish systems. Value is measured at manufacturer level across retail, trade, and project channels. Industrial and protective coatings, automotive and marine paints, powder coatings, adhesives and sealants, and application labour fall outside scope.
Base Year Value
$92.6B in 2025 (MMA Primary Research Dataset, August 2026)
Forecast Period
2026 to 2036, eleven discrete annual values
CAGR
4.4% base case. Bull 5.5%. Bear 3.2%.
Fastest Growth Segment
Functional and Specialty Decorative Coatings: 8.4% CAGR
Fastest Growth Country
India: 7.4% CAGR
Fastest Growth Region
South Asia and Pacific: 6.4% CAGR
Largest Region
East Asia: 30% of 2025 global value
Market Leaders
Sherwin-Williams, PPG Industries, AkzoNobel, Nippon Paint Holdings, and Asian Paints lead on decorative paint revenue. Source: company annual reports and MMA Analysis, July 2026.
Primary Survey
n=3,800 procurement and R&D decision-makers, Q4 2025, six countries
Methodology
Demand-side build-up, cross-validated against public data, 47 expert interviews

Decorative Paints Market Forecast Scenarios

decorative-paints-market-trends-size-forecast-scenario-1787549106033
Between 2020 and 2025 the market went through a boom and a hangover. Households confined at home repainted at unprecedented rates, manufacturers could not make enough, and volumes then fell hard as that demand proved to have been pulled forward. Titanium dioxide and resin costs rose sharply and were passed through. The 3.6% historical growth averages a surge and a correction rather than describing any steady trend.
The 4.4% base case rests on three mechanisms. Repaint demand recovers as housing transaction volumes normalise, since moving house remains the single most reliable trigger for repainting a property. Emerging market premiumisation continues as households in India, Southeast Asia, and Latin America move from whitewash and low-grade distemper to branded emulsion. And functional coatings claiming stain resistance, air quality, or heat reflection keep taking share at prices well above standard products.
The 5.5% bull case assumes housing transactions recover strongly and premiumisation accelerates across emerging markets. The 3.2% bear case reflects prolonged housing market weakness, consumers deferring discretionary redecoration, and private label products taking share in retail channels where the shelf owner controls the customer relationship. Housing transactions, not construction, decide which case actually arrives. Public confidence matters more than policy.

Colour Is Chosen at the Shelf, Not the Factory

Three things set the commercial shape of this market. Distribution control comes first, because paint is heavy, cheap per litre, and bought locally, so whoever owns the outlet effectively owns the sale. Colour comes second, since the tinting machine standing in a store determines which brand can produce the shade a customer picked from a fan deck. Titanium dioxide comes third and dominates the cost sheet.
TOP-FIVE CONCENTRATION31%Share of global decorative paint volume held by leading producers
AVERAGE SELLING PRICEUSD 4.60 per litreBlended retail and trade pricing across mainstream interior products
REPAINT DEMAND SHARE72%Portion of volume going to repainting rather than new construction
TITANIUM DIOXIDE SHARE24%Pigment input within total decorative paint manufacturing cost
TINTING MACHINE COVERAGE38%Share of retail outlets equipped for in-store colour tinting
TRADE PAINTER SHARE44%Portion of volume applied by professional decorators rather than consumers
Three distribution models compete and rarely mix. Company-owned store networks give complete control of the customer and the colour system at high fixed cost. Big-box retail delivers enormous volume while handing the customer relationship to the retailer. Independent dealer networks sit between the two and depend on tinting machine placement and dealer loyalty programmes to hold position.
Functional claims are where the margin has gone. Standard interior emulsion is a commodity that consumers compare on price per litre, while coatings claiming stain resistance, odour reduction, air purification, or heat reflection sell at multiples of that with the claim rather than the chemistry doing the work. Substantiating those claims properly is what separates a premium range from a marketing exercise.
"Nobody walks into a store wanting paint. They want a particular shade of green on a wall by Sunday evening, and the brand that can tint it accurately while they wait wins by default. Manufacturers who think this is a chemistry business rather than a colour logistics business tend to lose share quietly for years."
Practice Director, Coatings and Building Products · MMA Chemicals and Materials Practice · August 2026

Market Trends

Functional Claims Rebuild Margin in a Commoditised Category

Standard interior emulsion sells on price per litre against private label and regional competitors, and manufacturers have limited room to defend it. Coatings claiming stain resistance, odour reduction, air quality improvement, or heat reflection sell at two to four times that pricing, and the category grows at 8.4% while the market grows at 4.4%. What matters commercially is substantiation, since consumers and increasingly trade buyers have learned to discount unsupported claims. Manufacturers with genuine test evidence behind a functional range defend both the price and the shelf space that a commodity product could never justify occupying.
Market Impact: Repaint supplies 72% of volume
Emerging Market Premiumisation Converts Volume Into Value

Households across India, Southeast Asia, Latin America, and parts of Africa are moving from whitewash, distemper, and unbranded products toward branded emulsion as incomes rise, and each step up multiplies revenue per household without adding a single square metre of wall. Asian Paints and Berger built substantial businesses on exactly this transition in India, and the same pattern is running earlier in Indonesia, Vietnam, and Nigeria. Dealer networks and colour systems are what capture it, since the household is buying reassurance and a shade rather than any technical specification they could evaluate.
Market Impact: Trade accounts for 44% of volume

Market Opportunities and Growth Drivers

Housing Transactions Rather Than Construction Drive Repaint Volume

Repainting supplies 72% of volume, and the most reliable trigger for repainting a property is somebody buying or selling it. Sellers paint to present the property and buyers paint to make it theirs, which means transaction volumes forecast paint demand far better than housing starts do. That relationship held through the interest rate cycle, with paint volumes falling alongside transactions in markets where borrowing costs froze the housing market. Manufacturers who track transaction data rather than construction statistics plan production and promotional spending considerably more accurately than those who do not.
Market Impact: Pigment is 24% of cost

Professional Decorator Demand Rewards Colour Speed and Coverage

Trade painters apply 44% of volume and buy on entirely different criteria from consumers, valuing coverage per litre, drying time between coats, and how quickly a merchant can mix an accurate colour match. A decorator losing an hour waiting for tinting loses money directly, which makes tinting machine availability and accuracy a genuine commercial weapon. Trade accounts also buy consistently through the year rather than seasonally, and they carry credit relationships that make switching inconvenient. Manufacturers serving the trade properly hold volumes far steadier than those dependent on consumer sentiment.
Market Impact: Economic radius under 400 kilometres

Market Restraints and Challenges

Titanium Dioxide Dominates Cost and Moves Without Warning

Titanium dioxide is 24% of manufacturing cost and there is no substitute that delivers comparable opacity at any acceptable price. The root cause is optical physics: hiding power depends on refractive index, and nothing else available comes close. Pigment pricing swings with ore supply, Chinese production policy, and anti-dumping measures now applied in Europe and India, none of which manufacturers influence. Mitigation runs through extender pigment optimisation, hollow polymer opacifiers that replace part of the load, and multi-supplier contracts, and each recovers a few percentage points at most. Nobody has found a genuine alternative.
Market Impact: Specialty coatings grow at 8.4%

Freight Economics Keep the Market Stubbornly Regional

Paint is mostly water, sold cheaply by the litre, and transporting it any distance destroys the economics. The root cause is that the product is roughly seventy percent carrier by weight, so a truck moves very little value. Plants therefore serve regional catchments, national brands are built plant by plant, and consolidation delivers far less scale benefit than the revenue figures suggest. Manufacturers mitigate through regional plant networks, tinting bases shipped as concentrates, and local dealer manufacturing arrangements in the least accessible markets. Consolidation delivers far less scale benefit than revenue figures imply.
Market Impact: Lifts revenue per household above 3x
4 additional market trends, 3 additional growth drivers, and 2 additional restraints and challenges are covered in the full report. Contact sales@marketmindsadvisory.com to access the complete intelligence.

Segment CAGR and Growth Architecture

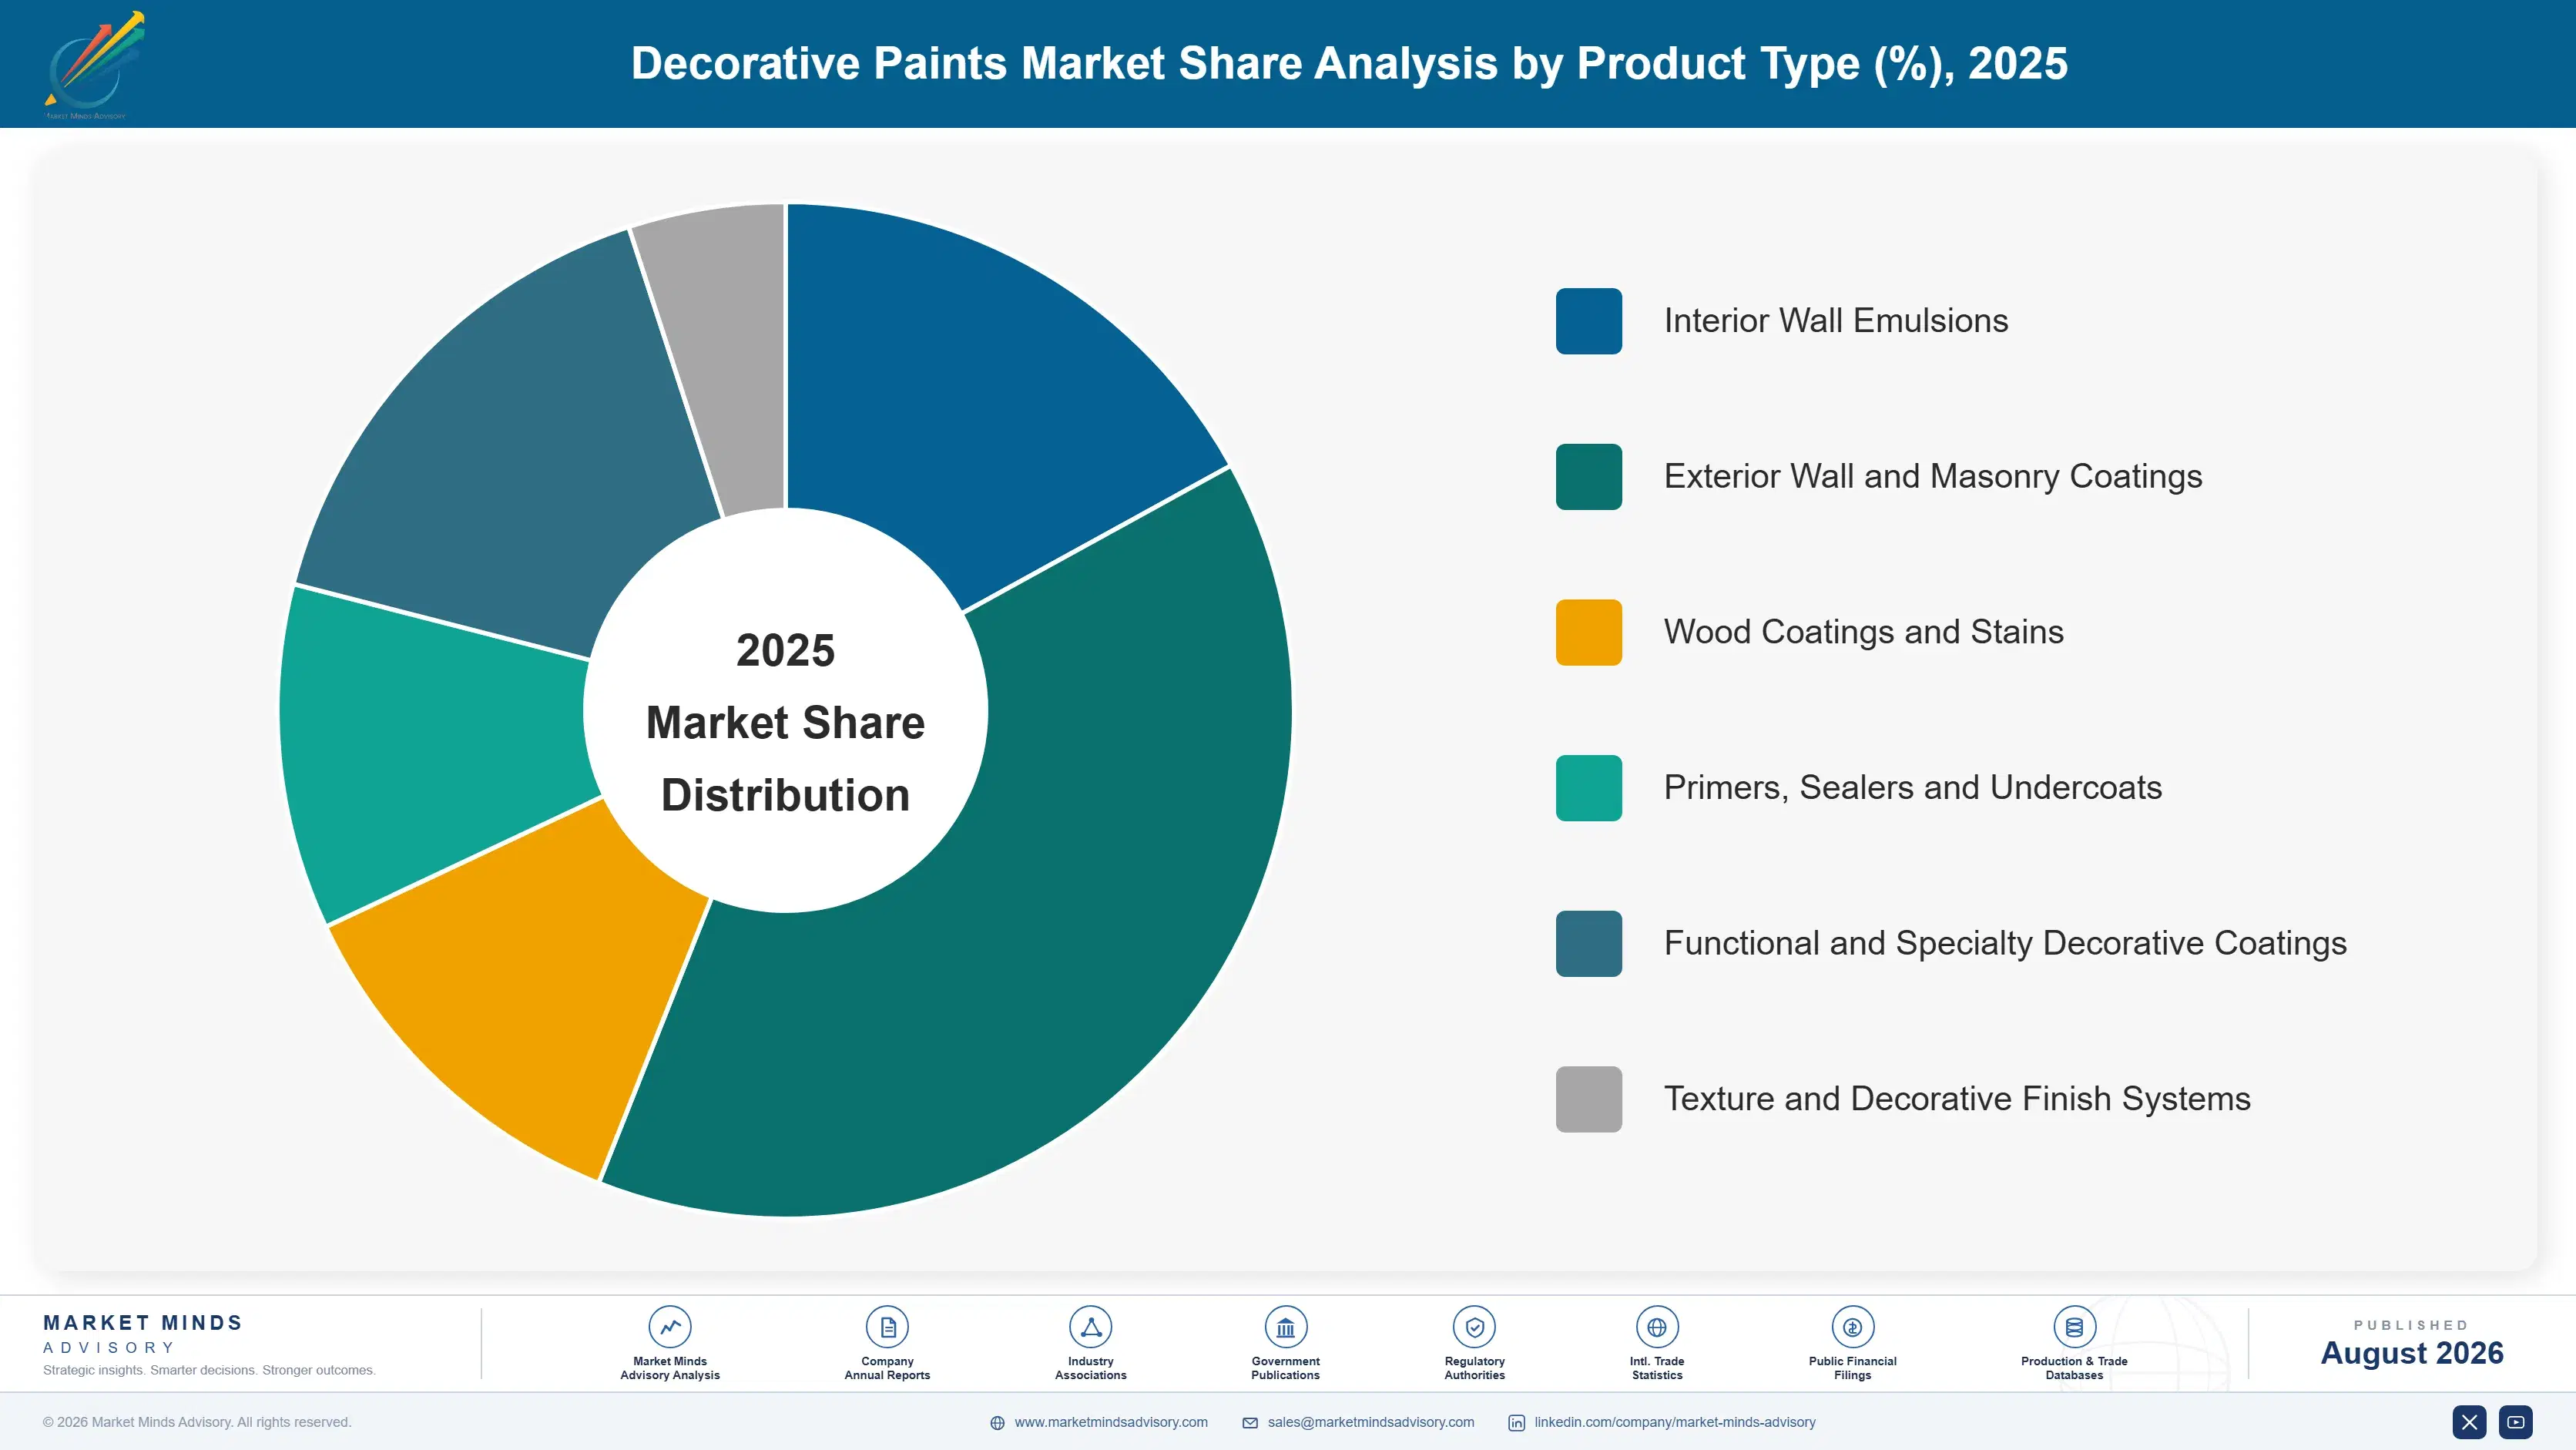
Segmentation follows product type, because the product determines substrate, durability requirement, application method, price positioning, and which channel actually sells it. Six product families cover commercial supply, and they compete very little with one another, since a wood stain and an exterior masonry coating address problems that share almost nothing beyond being applied with a brush.
decorative-paints-market-trends-market-share-analysis-1787549106571

Functional and Specialty Decorative Coatings

The fastest-growing family at 8.4%, roughly 1.91 times the market, and the only part of the category where margin is genuinely expanding. Stain-resistant interior finishes, low-odour and low-emission formulations, antimicrobial surfaces, air-purifying claims, and heat-reflective exterior coatings all sell at two to four times standard emulsion pricing. The commercial asset is substantiated claim evidence rather than formulation, since competitors match chemistry within a season but cannot match a testing programme quickly. Consumers and trade buyers have both grown sceptical of unsupported marketing, which increasingly separates ranges backed by independent testing from those relying on suggestive packaging alone. Shelf space follows the evidence, because retailers increasingly ask for test data before allocating premium facings to a new range.
CAGR 8.4%

Texture and Decorative Finish Systems

Second fastest at 5.7%, covering textured coatings, lime and mineral finishes, metallic and pearlescent effects, and multi-layer decorative systems applied mainly by professionals. Growth comes from interior design fashion cycles in developed markets and from exterior render finishes across southern Europe, Latin America, and the Middle East where masonry construction dominates. Application skill is the constraint and the opportunity together: these products need trained applicators, which limits volume but protects pricing because the specifier is buying an outcome rather than a tin. Manufacturers running applicator training programmes hold positions that pure product competition cannot easily reach or undercut. Fashion cycles in interior design drive replacement faster than durability ever would, which keeps the category refreshing itself.
CAGR 5.7%
Full segment breakdown across 6 segments available in the complete report.

Regional Architecture and Country Demand Map

Regional shares follow housing stock, household income, and construction material rather than population alone. Masonry-dominated regions consume far more exterior coating per home than timber-frame markets, and premiumisation stage explains most of the variation in value per litre sold. Distribution model differs by region as much as the products do.

North America

Three distribution models compete openly here and the contrast is instructive. Sherwin-Williams runs thousands of company-owned stores that give complete control of the trade customer and the colour system, Behr reaches enormous consumer volume through big-box retail while conceding the relationship to the retailer, and Benjamin Moore holds an independent dealer network on premium positioning. Repaint dominates and tracks existing home sales almost directly, which made the interest rate cycle brutally visible in volumes through 2023 and 2024. Timber frame construction means interior emulsion and wood coatings matter more than masonry products. Growth of 4.0% depends heavily on housing transaction recovery rather than any construction activity. Wood coating demand is larger here than in masonry markets.
Share: 24% | CAGR: 4.0% (2026 to 2036)

Western Europe

A mature, slow-growing market where regulation and fashion move value more than volume ever will. Emission and volatile organic compound limits are the strictest anywhere and drove waterborne conversion to essential completion years ago, so the remaining regulatory pressure falls on preservatives and microplastic content instead. Masonry construction across southern Europe supports substantial exterior render and mineral finish demand that northern markets lack. Trade decorators hold a larger share of application than in most regions, which favours manufacturers with merchant relationships and fast colour service. AkzoNobel, PPG, and a dense field of national brands including DAW and Cromology compete regionally. Growth of 2.9% is the slowest anywhere and reflects genuine saturation.
Share: 21% | CAGR: 2.9% (2026 to 2036)
Regional intelligence for 5 additional markets available in the complete report: East Asia, South Asia and Pacific, Latin America, Middle East and Africa, Eastern Europe. Contact sales@marketmindsadvisory.com.
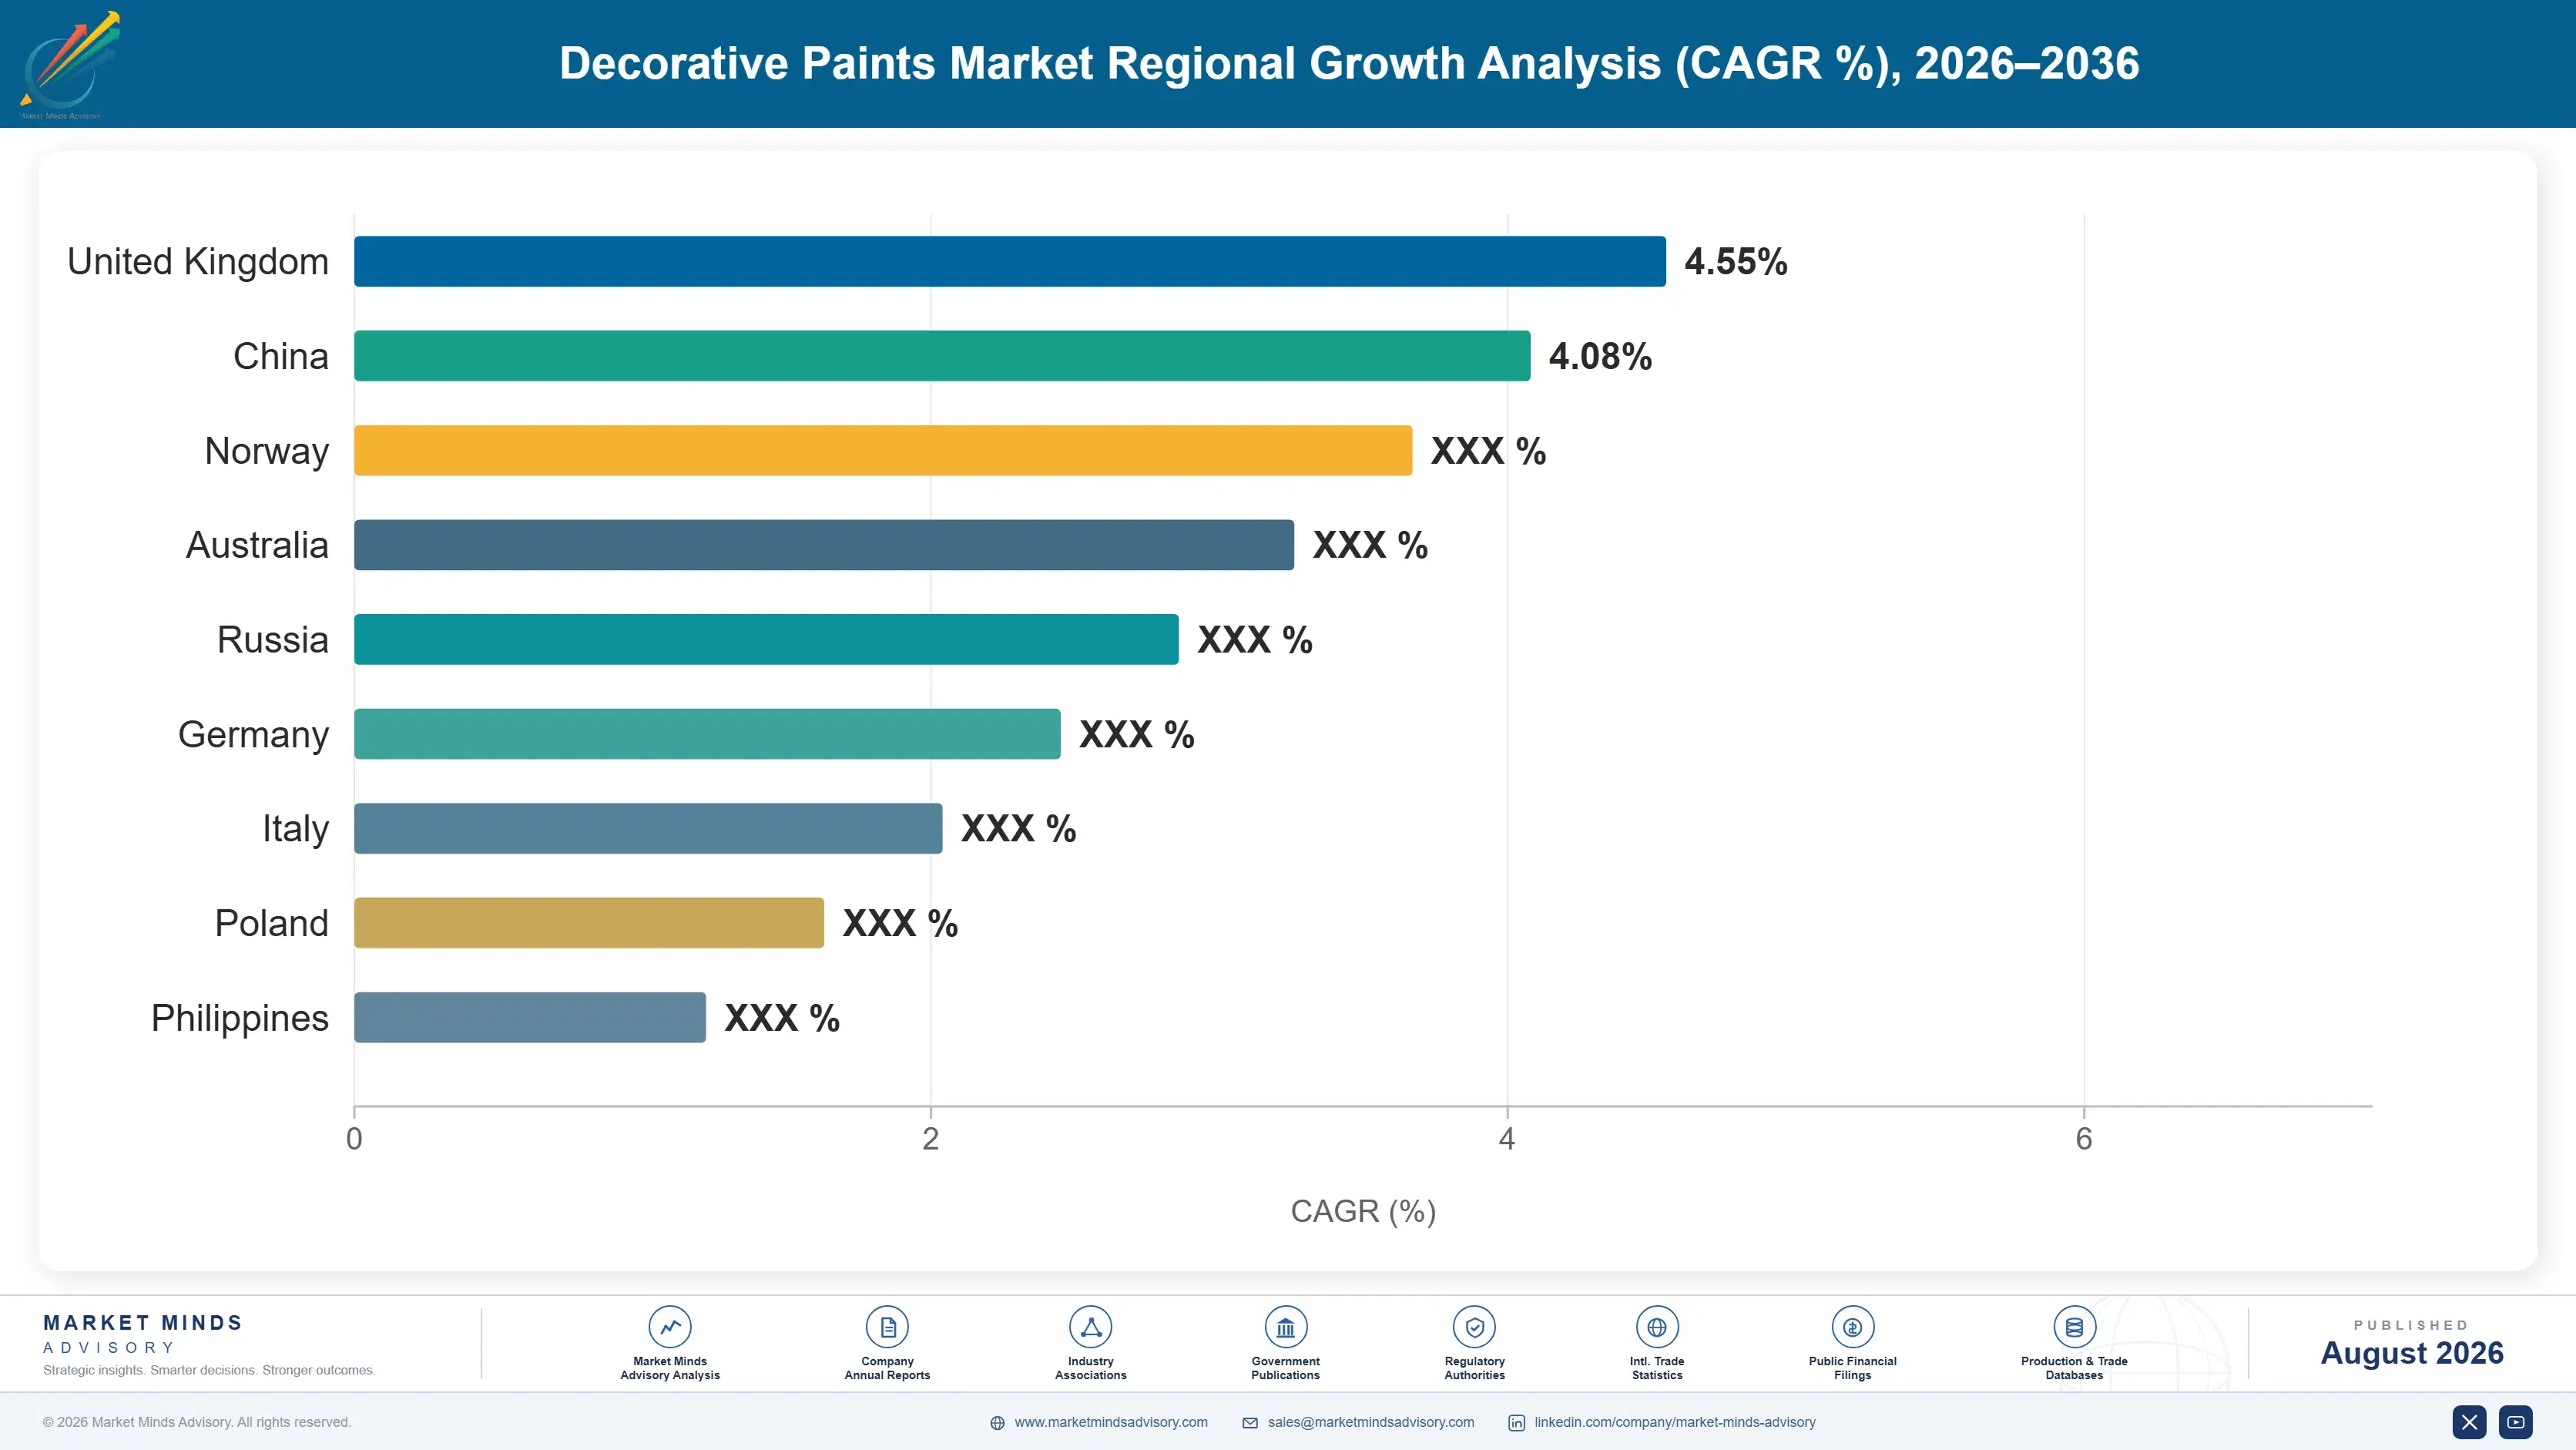
decorative-paints-market-trends-country-cagr-analysis-1787549107090

Four Moves That Change the Economics

Advantage in decorative paints comes from distribution control, colour service, and substantiated functional claims rather than from formulation, which every serious competitor matches within a season. Four moves are worth capital and management attention across the forecast period, and the first two are about owning the point where the purchase decision actually happens. None of them is a formulation project.

Place tinting machines wherever the customer chooses colour

A customer picks a shade from a fan deck and buys whichever brand the store can mix on the spot, which makes machine placement a direct determinant of share. Each installed unit costs perhaps $6,000 to $14,000 and typically returns that within eighteen months through the volume it captures and the switching friction it creates for the dealer. Asian Paints built a market-leading position substantially on this. Coverage sits at 38% of outlets across the industry, which leaves a great deal of contested ground still unclaimed in emerging markets. Sequencing the rollout by payback period matters more than total spend.
Market Impact: Returns machine cost within roughly 18 months typically

Substantiate functional claims with independent testing

Functional coatings sell at two to four times standard emulsion pricing and grow at 8.4%, but consumers and trade buyers now discount unsupported claims automatically. Independent test evidence for stain resistance, emission levels, or heat reflection costs perhaps $80,000 to $200,000 per claim and converts a marketing statement into a defensible price premium. Competitors match the formulation within a season and cannot match the evidence quickly. Manufacturers treating this as promotional spend rather than product development consistently underinvest and then wonder why their premium range sells at a discount. Retailers now ask for the data before allocating premium shelf.
Market Impact: Defends a 2 to 4 times price premium

Build trade decorator loyalty through colour speed and credit

Professional decorators apply 44% of volume, buy consistently through the year, and switch far less readily than consumers once a merchant relationship and credit line exist. A decorator waiting for a colour match loses billable time directly, so tinting speed and accuracy matter more to them than any product claim. Trade-focused manufacturers typically hold 10 to 18% higher volume stability through consumer downturns than retail-weighted competitors. Building it requires merchant relationships, credit management, and applicator support rather than advertising spend, which suits some organisations far better than others. Volume stability through downturns is worth more than margin.
Market Impact: Adds 10 to 18% more overall volume stability

Reduce titanium dioxide load through opacifier optimisation

Pigment is 24% of manufacturing cost and swings with ore markets and trade measures that no manufacturer controls. Hollow polymer opacifiers, optimised extender packages, and improved dispersion can cut titanium dioxide load 8 to 15% without measurable loss of hiding power in most interior formulations. The work is formulation science and requires requalification of the whole product range, which is why it gets deferred repeatedly. Manufacturers who completed it before the last pigment spike held margin while competitors repriced and lost shelf position to private label. Requalification across the shade range is the deterrent, not the science.
Market Impact: Cuts titanium dioxide load by 8 to 15%

Who Controls the Margin Pool

Concentration is low: the top five hold roughly 31% of global decorative paint volume, which is unusual in chemicals and follows directly from freight economics that keep markets regional. Sherwin-Williams leads through company-owned store networks that few competitors have attempted to replicate. PPG and AkzoNobel compete across multiple channels and geographies, while Nippon Paint has built commanding Asian positions and Asian Paints dominates India through dealer network density rather than product differentiation.
Competitive activity runs on three fronts. Distribution model is the first, and the choice between owned stores, big-box retail, and dealer networks shapes everything else a manufacturer can do. Colour system and tinting coverage is the second, and it decides which brand gets mixed when a customer has already chosen a shade. Functional claim substantiation is the third, and it is where premium pricing is now defended.

Pressure is building from two directions. Private label products in big-box retail take share from branded ranges wherever the retailer controls the customer relationship. And regional producers across Asia compete effectively on price in premiumising markets where brand equity is still being formed. Neither pressure threatens the leaders directly, and both compress the returns available in standard products.
decorative-paints-market-trends-company-positioning-matrix-1787549107614

Competitive Moat and Risk Dimensions

SHERWIN-WILLIAMS

Moat: Company-owned store network control

Owning thousands of stores gives direct control of the trade customer, the colour system, credit relationships, and pricing in a way no competitor selling through third parties can match. Trade decorators build their working routine around a store they visit daily, and displacing that habit requires more than a better product or a lower price could ever achieve.
SHERWIN-WILLIAMS

Risk: Fixed cost of owned distribution

A large owned store estate carries substantial fixed cost that must be covered whatever the housing market does, and repaint volumes fall hard when transactions freeze. Competitors selling through retail or dealers flex their cost base far more readily during downturns, which makes the model unusually exposed to prolonged weakness in housing activity.
ASIAN PAINTS

Moat: Dealer network density in India

Tinting machines placed across an enormous network of small independent dealers, combined with supply chain reach into towns competitors do not service reliably, gives Asian Paints a position built street by street over decades. A dealer with one machine mixes one brand, and replacing that machine means displacing a relationship rather than winning a product comparison.
ASIAN PAINTS

Risk: Concentration in one national market

Revenue depends overwhelmingly on India, which is growing fast but exposes the business fully to a single economy, monsoon patterns, and a domestic competitive field that now includes well-funded new entrants. International expansion has proved difficult, because the dealer density advantage does not transfer to markets where distribution is already organised differently.

Players Tracked

Prominent Players

Sherwin-Williams
PPG Industries
AkzoNobel
Nippon Paint Holdings
Asian Paints

Other Key Players

Berger Paints India
Kansai Paint
RPM International
Benjamin Moore
Jotun
Masco Corporation
Sika
Beckers Group
Cromology
DAW SE
Sto SE & Co. KGaA
SKSHU Paint
Carpoly Chemical Group
Indigo Paints
Hempel

Recent Developments

MARCH 2025

Nippon Paint expands Chinese repaint distribution

Additional dealer coverage and tinting capacity were rolled out across Chinese cities, targeting the repaint cycle now reaching apartment stock built during the construction boom. New residential completions have fallen, and repainting existing homes has become the larger opportunity for the first time. Machine placement accompanied the rollout.
Signal: Chinese demand is shifting from construction toward repaint, which rewards distribution reach over any project relationships
JULY 2025

Manufacturer launches independently tested functional range

A premium interior range carrying independently verified stain resistance and emission performance was introduced, with test certificates featured on packaging rather than in technical literature. The positioning responds to consumer scepticism toward functional claims that competitors have made without any supporting evidence. Pricing sat well above the standard range.
Signal: Substantiated evidence is becoming the differentiator in functional coatings, because unsupported claims no longer command a premium
OCTOBER 2025

Anti-dumping duties applied to imported titanium dioxide

Duties on imported titanium dioxide took effect in an additional major market, raising pigment costs for paint manufacturers who had relied on lower-priced supply. Producers with reduced-pigment formulations and multi-source contracts absorbed the change considerably better than competitors who had deferred that work. Reformulation programmes were accelerated across the industry.
Signal: Trade measures on pigment are now a recurring cost risk that formulation strategy has to anticipate directly

What Sets the Cost Base

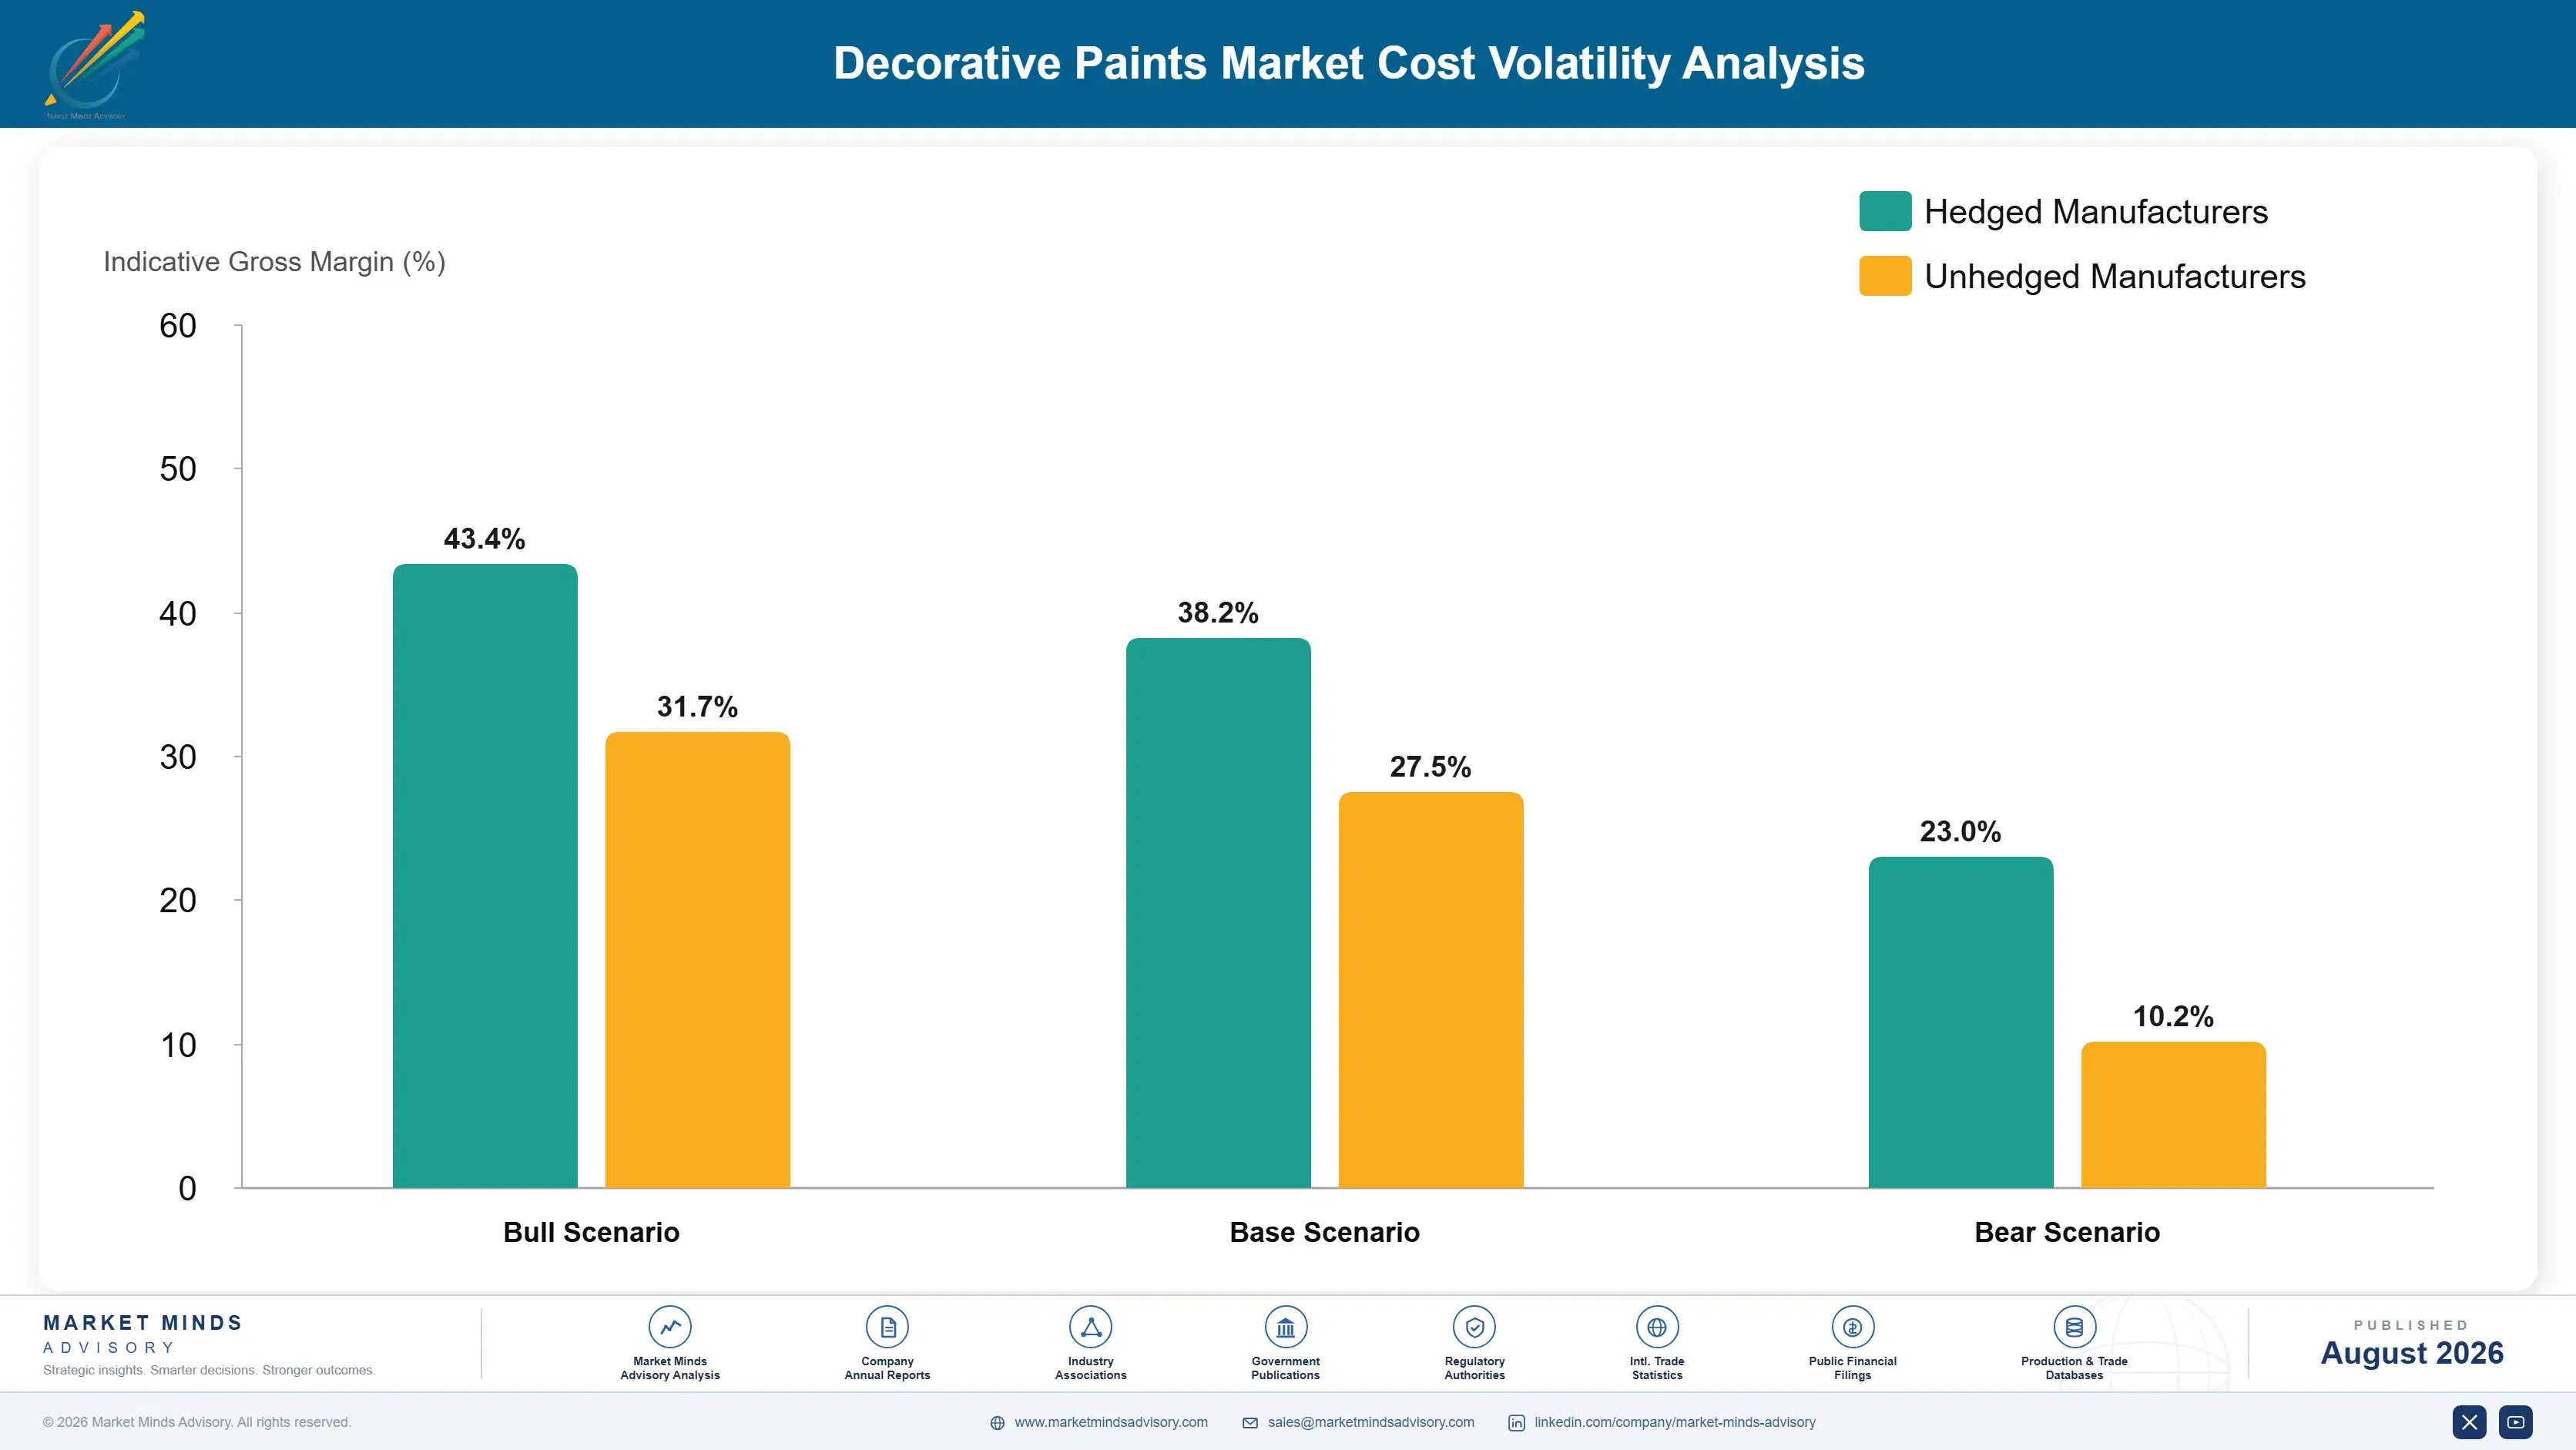
Titanium dioxide dominates at roughly 24% of manufacturing cost, and no alternative delivers comparable opacity at any workable price. Binder resins, principally acrylic and vinyl acetate emulsions, contribute a further 27% and track petrochemical monomer markets directly. Extenders, additives, biocides, and colourants take 14% between them. Packaging is unusually significant at 8%, and freight absorbs the balance.
The 2021 and 2022 period hit almost every line at once. Titanium dioxide tightened as Chinese production policy changed, acrylic monomer supply was disrupted by weather events and plant outages in the United States, and freight rates rose sharply. PPG and AkzoNobel both referenced raw material cost inflation and multiple pricing actions across their reporting for those years. Manufacturers repriced two or three times in a year, and big-box buyers resisted hardest.

Exposure divides on formulation discipline and channel structure rather than on scale. Manufacturers who had optimised pigment load and qualified multiple suppliers absorbed the pigment move far better than those running single-source contracts and legacy formulations. Channel matters as much: owned stores and dealer networks reprice within weeks while big-box retail contracts often hold for a full season, leaving that volume unprofitable through the worst of any input cycle.
decorative-paints-market-trends-cost-volatility-analysis-1787549107811

Optimise pigment load with hollow polymer opacifiers

Hollow polymer particles scatter light and replace part of the titanium dioxide load without measurable loss of hiding power in most interior formulations. Reductions of 8 to 15% are achievable, which is material against a 24% line. The obstacle is requalifying an entire product range across shades and substrates, work that gets deferred until a pigment spike makes it urgent.

Qualify multiple titanium dioxide suppliers across regions

Pigment supply is exposed to ore markets, Chinese production policy, and anti-dumping measures now applied in several jurisdictions. Holding qualified suppliers across different regions preserves both price leverage and availability when trade measures land. Qualification requires shade matching and stability testing across the range, which takes months and cannot be compressed once a disruption has already started.

Shorten repricing cycles in fixed-term retail contracts

Big-box retail contracts frequently hold pricing for a full season while owned stores and dealers reprice within weeks. That asymmetry left retail volume unprofitable through the last input cycle. Shorter review periods or index clauses shift the risk toward buyers with more ability to absorb it, and retailers resist firmly until they have lived through a severe cost cycle themselves.

Portfolio Architecture for Margin Defence

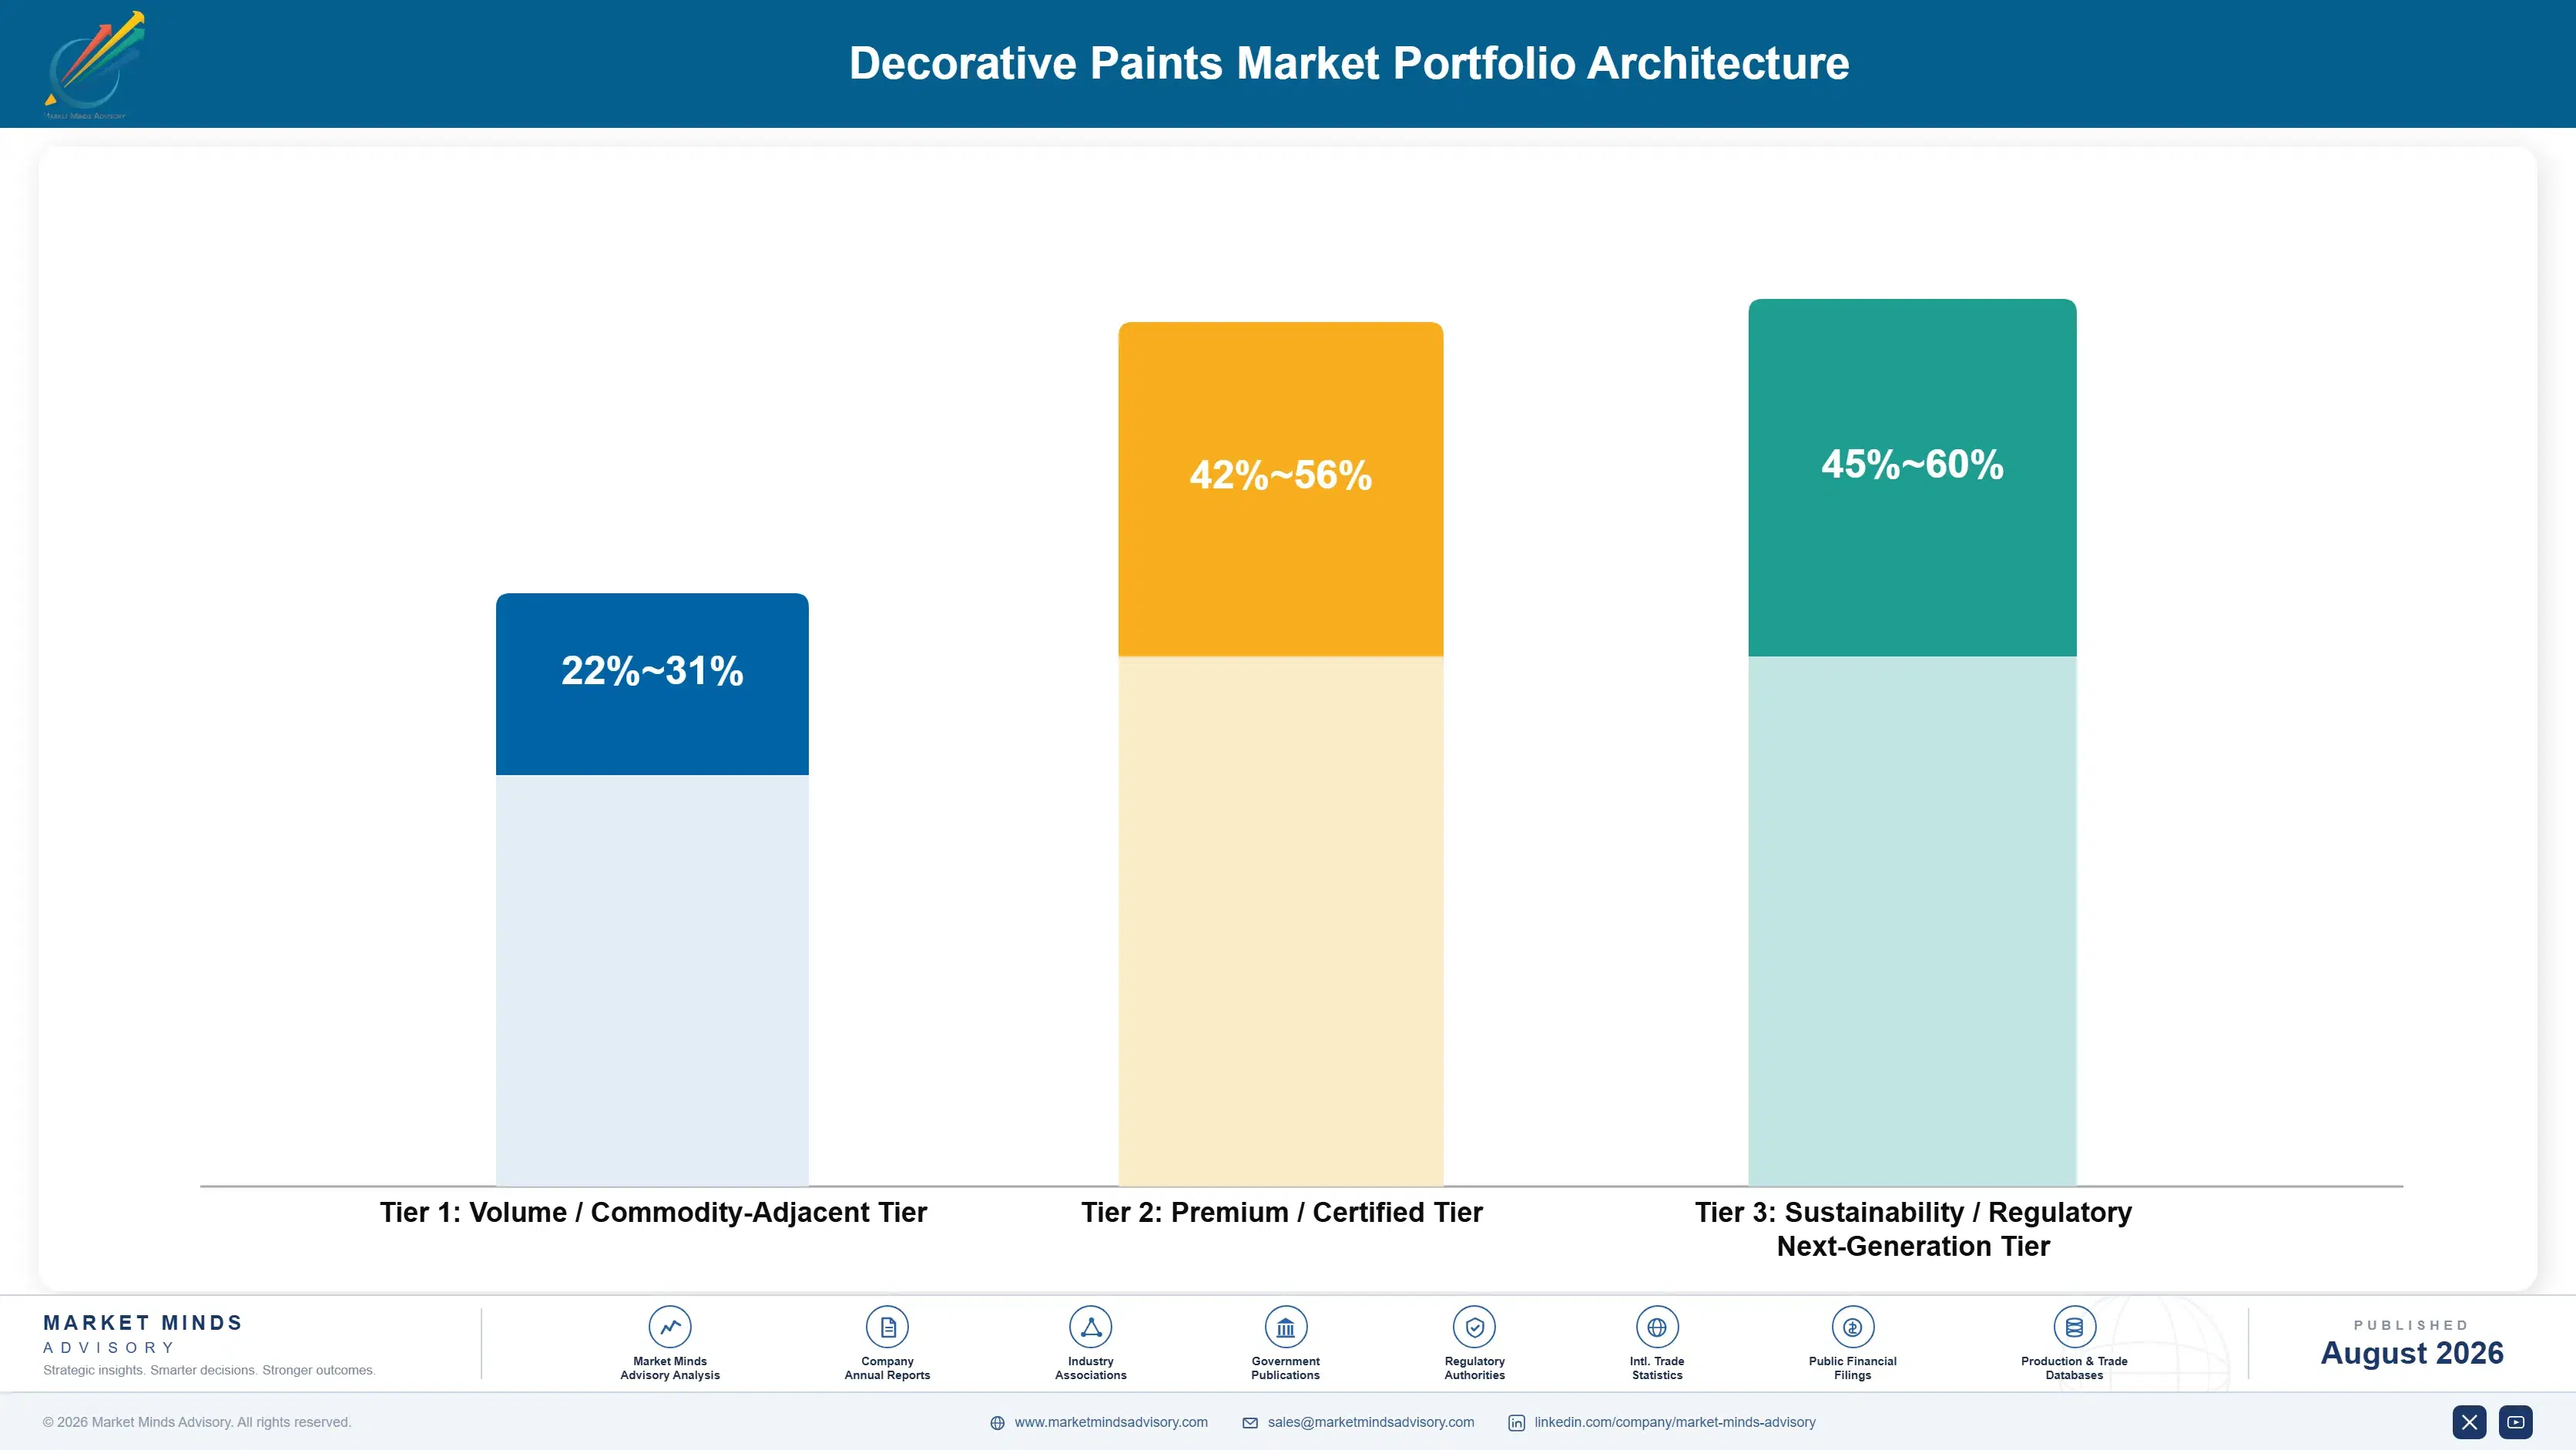
Margin follows claim and channel rather than product volume. Standard interior emulsion sold through big-box retail earns modest gross margin, because the retailer controls the shelf, private label sits alongside it, and consumers compare price per litre with no other reference point. Substantiated functional ranges sold through owned stores or premium dealers earn several times that, since the buyer is purchasing a claimed outcome and has no easy basis for comparison.
The volume and premium tension shows in distribution economics rather than in manufacturing. Big-box volume fills plants and supports purchasing scale on pigment and resin, which the premium business benefits from without paying for. Abandoning it looks attractive on a margin sheet and removes the buying power that makes the whole cost base work, which is why almost nobody actually does it.

High-value pools concentrate in three places: substantiated functional coatings, trade decorator supply through controlled distribution, and texture and decorative finish systems sold with applicator support. Each is defended by evidence, relationship, or skill rather than by price. Price competition arrives only when a competitor funds equivalent testing, builds comparable trade relationships, or trains applicators.

Volume / Commodity-Adjacent Tier

Standard interior emulsion and basic exterior products sold through big-box retail and mass distribution against private label. Competes on price per litre. The range reflects large differences in pigment cost position and channel structure.
Gross Margin: 22%-31%

Premium / Certified Tier

Substantiated functional ranges and trade-grade products sold through owned stores and premium dealer networks. The buyer purchases a verified outcome or professional performance rather than paint, and comparison is genuinely difficult.
Gross Margin: 42%-56%

Sustainability / Regulatory / Next-Generation Tier

Low-emission, bio-based binder, heat-reflective, and air-quality coatings carrying independent certification. Regulation and consumer preference drive adoption together. The range is wide because certification premiums vary enormously by market and claim.
Gross Margin: 45%-60%
decorative-paints-market-trends-portfolio-architecture-1787549108320

High-value Sub-segments and Strategic Watch-out

Substantiated Functional Coating Ranges

The only genuinely expanding margin pool in the category, growing at 8.4% against a 4.4% market. Independent test evidence rather than formulation defends the premium, because competitors copy chemistry within a season. Consumer scepticism punishes unsupported claims severely now. Fund the testing as product development.
Gross Margin: 44%-58%

Trade Decorator Supply Channel

Applies 44% of volume, buys consistently through the year, and switches far less than consumers once credit and colour service relationships exist. Tinting speed matters more to this buyer than any product claim. Volume stability through downturns is the real prize. Colour service speed decides these relationships.
Gross Margin: 34%-46%

Texture and Decorative Finish Systems

Applicator skill limits volume and protects pricing simultaneously, because the specifier buys a finished appearance rather than a tin of product. Training programmes create positions that product competition cannot reach. Masonry-dominated regions carry most of the demand. Applicator training is the entry requirement. Skill limits scale.
Gross Margin: 38%-50%

Big-Box Retail Standard Emulsion

The strategic watch-out. The retailer owns the customer, private label sits on the same shelf, and fixed-term contracts leave the volume unprofitable through input cycles. It fills plants and funds pigment buying scale, and that is the whole case. Price it for plant loading and buying scale.
Gross Margin: 22%-30%

How Demand Actually Reaches Manufacturers

The annuity here is the repaint cycle, and it is more reliable than the industry usually credits. Interior walls get repainted every five to eight years and exteriors every seven to twelve, which means 72% of demand recurs regardless of whether anything new is built. What makes it feel cyclical is the trigger: people repaint when they move, when they refinance, or when they have money and time together, so the cycle gets bunched by transactions and confidence rather than arriving smoothly.
Adoption depth varies sharply by buyer type. Professional decorators are the deepest and steadiest customers, buying weekly and valuing colour service above everything. Property managers and social housing bodies buy on tender against durability specifications. Consumers undertaking a project buy once and compare on price and colour. Developers buying for new build treat paint as a specification line and squeeze it accordingly.

The buyer increasingly arrives having already chosen a colour from social media or a retailer's app. That shifts the decision earlier and makes colour matching accuracy the deciding factor at the counter. Manufacturers whose machines reproduce those shades accurately first time convert far more of that pre-formed intent.
decorative-paints-market-trends-end-use-penetration-index-1787549108814

Where the Money Sits

These are among the four positions where our research anticipates prominent divergence between winners and laggards over the coming forecast period. Each is grounded in the demand model, the regulatory perimeter, and the announced capacity pipeline.
01 / COLOUR POINT CONTROL

Own the tinting machine, because it decides the purchase

A customer arrives having already chosen a shade and buys whatever brand the store can mix while they wait, which makes machine placement a more direct determinant of share than any advertising campaign. Each unit costs $6,000 to $14,000 and typically pays back inside eighteen months through captured volume and the switching friction it creates for the dealer. Coverage sits at only 38% of outlets industry-wide, which leaves a great deal of contested ground still unclaimed across the premiumising emerging markets.
02 / CLAIM SUBSTANTIATION INVESTMENT

Test the claims properly, because buyers stopped believing packaging

Functional coatings sell at two to four times standard emulsion pricing and grow at 8.4% against a market growing 4.4%, but unsupported claims now get discounted automatically by consumers and trade buyers alike. Independent testing costs $80,000 to $200,000 per claim and converts marketing language into a price premium competitors cannot match by copying the formulation. Manufacturers who book this as promotional spend rather than product development consistently underfund it and then find themselves selling a premium range at a discount.
03 / TRADE CHANNEL DEPTH

Serve decorators seriously, because they buy through downturns

Professional decorators apply 44% of total volume, purchase weekly rather than seasonally, and switch far less readily than consumers do once merchant credit and colour service relationships have been established. Trade-weighted manufacturers hold 10 to 18% more volume stability through consumer downturns than retail-dependent competitors, which is worth considerably more than any margin difference across a full economic cycle. Building the position takes merchant relationships, credit management, and applicator support rather than the advertising budgets that consumer brands depend upon.
04 / PIGMENT LOAD DISCIPLINE

Reformulate before the next titanium dioxide spike lands

Pigment is 24% of manufacturing cost and moves with ore markets, Chinese production policy, and anti-dumping measures that no manufacturer has any influence over whatsoever. Hollow polymer opacifiers and optimised extender packages cut load 8 to 15% without measurable loss of hiding power in most interior formulations. The work needs requalification across the whole range and therefore gets deferred, which is precisely why the manufacturers who finished it early held their margin while competitors repriced repeatedly and lost shelf space.

Engagement Snapshot From the Field

A live engagement with an industry participant carrying material or product regulatory and market exposure ahead of a defining policy shift, showing how our research translates into a defensible multi-year portfolio strategy.
MARKET MINDS ADVISORY · CLIENT ENGAGEMENT SUMMARY
Decorative Paints Producer Strategic Portfolio Review and Transition Roadmap 2026·Investment Scenario on Decorative Paints Exposure Evaluation 2025-26
CLIENT PROFILE
A Southeast Asian decorative paint manufacturer with two plants and revenue near USD 210 million (client-reported, unverified by MMA), selling standard emulsion and exterior products through independent dealers and a growing modern retail channel. The business held tinting machines in under a fifth of its dealer base and had no independently tested functional range at all.
STRATEGIC CHALLENGE
Volume growth had stalled while the market premiumised around the business, with international competitors placing tinting machines aggressively in the same dealer network and launching functional ranges at three times the client's average selling price. Management needed to know whether to compete on distribution investment, on product positioning, or both, and in what order.
MMA APPROACH
MMA analysed share movement against tinting machine placement at dealer level, sized the premiumisation opportunity by income segment and region, and modelled returns on machine investment against functional range development. Forty-seven expert interviews with dealers, professional decorators, and household purchasers established what actually determines brand choice at the point of sale.
KEY FINDINGS
  1. Dealers holding a competitor tinting machine gave that brand roughly four times the shelf facings and recommended it by default, regardless of any margin the client offered on standard products.
  2. Machine payback averaged fourteen months in urban dealers and twenty-six in rural ones, making a geographically sequenced rollout considerably more attractive than uniform national placement.
  3. Households in the top two income segments were buying functional claims from international brands the client had no comparable product against, and that segment carried most of the market's value growth.
  4. Professional decorators represented under a fifth of the client's volume against a market average near forty percent, and none of the sales organisation was structured to serve them.
CLIENT PROFILE
A Southeast Asian decorative paint manufacturer with two plants and revenue near USD 210 million (client-reported, unverified by MMA), selling standard emulsion and exterior products through independent dealers and a growing modern retail channel. The business held tinting machines in under a fifth of its dealer base and had no independently tested functional range at all.
STRATEGIC CHALLENGE
Volume growth had stalled while the market premiumised around the business, with international competitors placing tinting machines aggressively in the same dealer network and launching functional ranges at three times the client's average selling price. Management needed to know whether to compete on distribution investment, on product positioning, or both, and in what order.
MMA APPROACH
MMA analysed share movement against tinting machine placement at dealer level, sized the premiumisation opportunity by income segment and region, and modelled returns on machine investment against functional range development. Forty-seven expert interviews with dealers, professional decorators, and household purchasers established what actually determines brand choice at the point of sale.
KEY FINDINGS
  1. Dealers holding a competitor tinting machine gave that brand roughly four times the shelf facings and recommended it by default, regardless of any margin the client offered on standard products.
  2. Machine payback averaged fourteen months in urban dealers and twenty-six in rural ones, making a geographically sequenced rollout considerably more attractive than uniform national placement.
  3. Households in the top two income segments were buying functional claims from international brands the client had no comparable product against, and that segment carried most of the market's value growth.
  4. Professional decorators represented under a fifth of the client's volume against a market average near forty percent, and none of the sales organisation was structured to serve them.
RECOMMENDED STRATEGY
Phase 1: Phase one: place tinting machines across urban dealers on a sequenced rollout prioritised by payback period, funding it as distribution capital rather than as promotional expenditure. Phase 2: Phase two: develop a functional interior range with independent testing on stain resistance and emissions, priced against international competitors rather than against the existing portfolio. Phase 3: Phase three: build a dedicated trade decorator organisation with credit facilities and colour service commitments, targeting the volume share the business currently forfeits entirely.
OUTCOME
The client placed 1,840 tinting machines over two years and launched a tested functional range in the second year. Dealer share improved measurably wherever machines were placed, functional products reached 11% of revenue at three times average pricing, and blended gross margin improved 4.9 percentage points (client-reported, unverified by MMA).

Frequently Asked Questions

Foundational context covering the market sizes, CAGR, scope, country, region and competition that inform every finding below. This section is provided to cover basics and most often pre-purchase conversations, answered from the MMA Primary Research Dataset.

What is the current size of the Decorative Paints Market?

The market was valued at USD 92.6 billion in 2025, rising to an estimated USD 96.67 billion in 2026. East Asia holds the largest regional share at 30% of global value.

How large will the Decorative Paints Market be by 2036?

MMA forecasts USD 148.71 billion by 2036 under the base case, an expansion multiple of 1.54 times the 2026 value. That represents USD 52.04 billion of incremental value across the forecast period.

What is the CAGR for the Decorative Paints Market 2026 to 2036?

The base case CAGR is 4.4%, with a bull case of 5.5% and a bear case of 3.2%. The spread reflects uncertainty over housing transaction recovery and emerging market premiumisation pace.

Which segment is growing fastest?

Functional and specialty decorative coatings grow fastest at 8.4%, roughly 1.91 times the market rate. Texture and decorative finish systems follow at 5.7% on design cycles and masonry construction.

Who are the major companies in the Decorative Paints Market?

Sherwin-Williams, PPG Industries, AkzoNobel, Nippon Paint Holdings, and Asian Paints lead on decorative paint revenue. The top five hold only 31% of global volume, since freight economics keep markets regional.

Which country is growing fastest?

India grows fastest at 7.4%, driven by households moving from whitewash and distemper toward branded emulsion. Dealer network density rather than product differentiation determines who captures that transition.

Report Segmentation Architecture

The full report scope spans multiple orthogonal segmentation dimensions, with cross-tabulated demand data provided for each dimension pair. Coverage extends further to regional breakdowns, trend trajectories, and the competitive detail needed to support segment-level decision-making.

By Product Type

  • Interior Wall Emulsions
  • Exterior Wall and Masonry Coatings
  • Wood Coatings and Stains
  • Primers, Sealers and Undercoats
  • Functional and Specialty Decorative Coatings
  • Texture and Decorative Finish Systems

By End-Use Industry

  • Residential Repaint and Renovation
  • Residential New Construction
  • Commercial Offices and Retail Property
  • Hospitality and Institutional Buildings
  • Social Housing and Property Management

By Distribution Channel

  • Company-Owned Store Networks
  • Big-Box and Modern Retail
  • Independent Dealer Networks
  • Builders Merchant and Trade Supply
  • Direct Project and Specification Supply

By Region

  • North America
  • Western Europe
  • East Asia
  • South Asia and Pacific
  • Latin America
  • Middle East and Africa
  • Eastern Europe

Scope, Methodology, and Coverage

Every figure in this report is reproducible from documented input assumptions. The scope below maps the historical period, the forecast horizon, the segmentation dimensions, and the countries covered, alongside the underlying primary and qualitative methodology.
Historical Period
2020 to 2025
Forecast Period
2026 to 2036
Base Year
2025 (USD billions; MMA Primary Research Dataset, August 2026)
Market Definition
The market comprises architectural coatings applied to buildings for decorative and protective purposes, covering interior wall emulsions, exterior wall and masonry coatings, wood coatings and stains, primers, sealers and undercoats, functional and specialty decorative coatings, and texture and decorative finish systems. Value is measured at manufacturer level across retail, trade, dealer, and project channels in residential and commercial buildings. Industrial and protective coatings, automotive and marine paints, powder coatings, wood preservatives sold as biocidal products, adhesives and sealants, and application labour fall outside scope.
Quantitative Units
USD billions (current prices); million litres of decorative paint shipped annually; USD per litre by product type and channel
Segmentation Dimensions
By Product Type; By End-Use Industry; By Distribution Channel; By Region
Regions Covered
North America, Western Europe, East Asia, South Asia and Pacific, Latin America, Middle East and Africa, Eastern Europe
Countries Covered
United States, Canada, Mexico, Germany, France, United Kingdom, Italy, Spain, Netherlands, Nordics, Poland, Czechia, Romania, China, Japan, South Korea, India, Australia, Indonesia, Vietnam, Thailand, Brazil, Colombia, Argentina, Saudi Arabia, United Arab Emirates, Egypt, Nigeria, South Africa
Key Companies Profiled
Sherwin-Williams, PPG Industries, AkzoNobel, Nippon Paint Holdings, Asian Paints, Berger Paints India, Kansai Paint, RPM International, Benjamin Moore, Jotun, Masco Corporation, Sika, Beckers Group, Cromology, DAW SE, Sto SE & Co. KGaA, SKSHU Paint, Carpoly Chemical Group, Indigo Paints, Hempel
Quantitative Methodology
Primary survey, n=3,800 respondents, Q4 2025, six countries; demand-side model with trade association cross-validation
Qualitative Methodology
47 expert interviews, Q4 2025; applied to validate demand model assumptions, identify emerging dynamics, and assess competitive positioning
Report Format
PDF and XLSX data workbook (Word format preview document)
Publisher
Market Minds Advisory
Report Code
MMA-2026-CHM-155
Published
August 2026
Contact
sales@marketmindsadvisory.com | www.marketmindsadvisory.com

Purchase the full Decorative Paints Market Report (2026 to 2036).

The full report sizes decorative paint demand across six product types, five end-use categories, and seven regions with 2026 to 2036 forecasts under base, bull, and bear cases. It separates repaint demand from new construction and models it against housing transaction data rather than building starts. Competitive profiles cover twenty manufacturers assessed consistently on decorative paint revenue, distribution model, and tinting coverage. Cost analysis traces titanium dioxide and acrylic monomer exposure through recent input cycles by channel. Commercial guidance addresses colour point control, claim substantiation, trade channel depth, and pigment load discipline.
Six product types sized separately by region and channel
Repaint demand modelled against housing transaction data
Tinting machine coverage assessed as a share determinant
Functional claim premiums quantified against standard emulsion pricing
Titanium dioxide exposure traced by formulation and channel
Three competing distribution models compared on economics

Built For The People Who Decide

From boardroom strategy to bench-side execution, this report is read cover-to-cover by leaders shaping the next decade of their industry, turning demand scenarios, market dynamics and valuation benchmarks into decisions.
CXOs/ Presidents/ VPs/ Managers
M&A and Corporate Development
Strategy Teams and R&D Heads
Procurement and Product Directors
Regulatory and Compliance Leaders
Investor Relations and Equity Analysts