

Market Minds Advisory
Decision Intelligence Market

Decision Intelligence Market: Decision Intelligence Market. Trends and Forecast 2026 to 2036

Enterprises are deploying decision intelligence platforms combining data science, business rules, and generative AI to automate complex operational choices, forcing traditional business intelligence vendors to defend contracts against AI-native decision automation entrants.

Lead Analyst

Published

September 2026

Make Smarter Decisions with Customized Research Insights

Request a free sample report and evaluate market opportunities, growth trends, and competitive dynamics relevant to your business needs.

2025 MARKET VALUE$12.5BMarket Size 2025
2036 FORECAST VALUE$41.4BBase Case , 2026 to 2036
CAGR 2026 TO 203611.5 %Bull 12.8% / Bear 10.2%
INCREMENTAL OPPORTUNITY$27.5BNet 10- year value creation
EXPANSION MULTIPLE2.97x2036 value over 2026 base
Strategic Levers
M&A Pipeline
Regional Outlook
Country Rankings
Competitive Intelligence
Segmental Deep-dive
Call-Us : 91 93563 13602

Executive Snapshot and Market Trajectory.

Decision intelligence platforms are moving from analytics dashboards that inform human judgment toward systems that model, simulate, and increasingly automate complex operational decisions across enterprise functions and business units worldwide, reshaping how organizations structure decision authority, accountability, and workflow ownership across teams, reporting lines, and departments across the whole enterprise.
Supply chain and financial services enterprises drive the largest share of near-term platform adoption, valuing decision intelligence systems that reduce decision latency across high-volume operational choices requiring consistent judgment and repeatable outcomes across their organization. Generative AI-powered decision automation platforms are growing fastest as enterprises seek systems capable of reasoning through unstructured scenarios rather than only optimizing structured, rules-based decision workflows built for narrower use cases and legacy business processes.
Competitive intensity centers on established business intelligence and analytics vendors defending share against AI-native platforms built specifically around decision automation and simulation capability across multiple enterprise functions, industries, and geographic markets today and well beyond. Enterprise data integration depth and proven decision accuracy track records increasingly determine which vendors win larger multi-year platform contracts over point analytics solutions lacking comparable automation depth and engineering talent.
Market Definition
This report covers decision intelligence software platforms that combine data science, business rules, simulation, and machine learning to model and support or automate complex enterprise operational decisions. It excludes standalone business intelligence dashboards without decision modeling capability and general-purpose data visualization tools not specific to decision support workflows.
Base Year Value
$12.5B in 2025 (MMA Primary Research Dataset, September 2026)
Forecast Period
2026 to 2036, eleven discrete annual values
CAGR
11.5% base case. Bull 12.8%. Bear 10.2%.
Fastest Growth Segment
Generative AI-Powered Decision Automation Platforms: 18.0% CAGR
Fastest Growth Country
India: 15.5% CAGR
Fastest Growth Region
South Asia and Pacific: 13.5% CAGR
Largest Region
North America: 31% of 2025 global value
Market Leaders
Leading participants include Palantir Technologies, SAS Institute, IBM, Microsoft, and Aera Technology.
Primary Survey
n=3,800 procurement and R&D decision-makers, Q4 2025, six countries
Methodology
Demand-side build-up, cross-validated against public data, 47 expert interviews

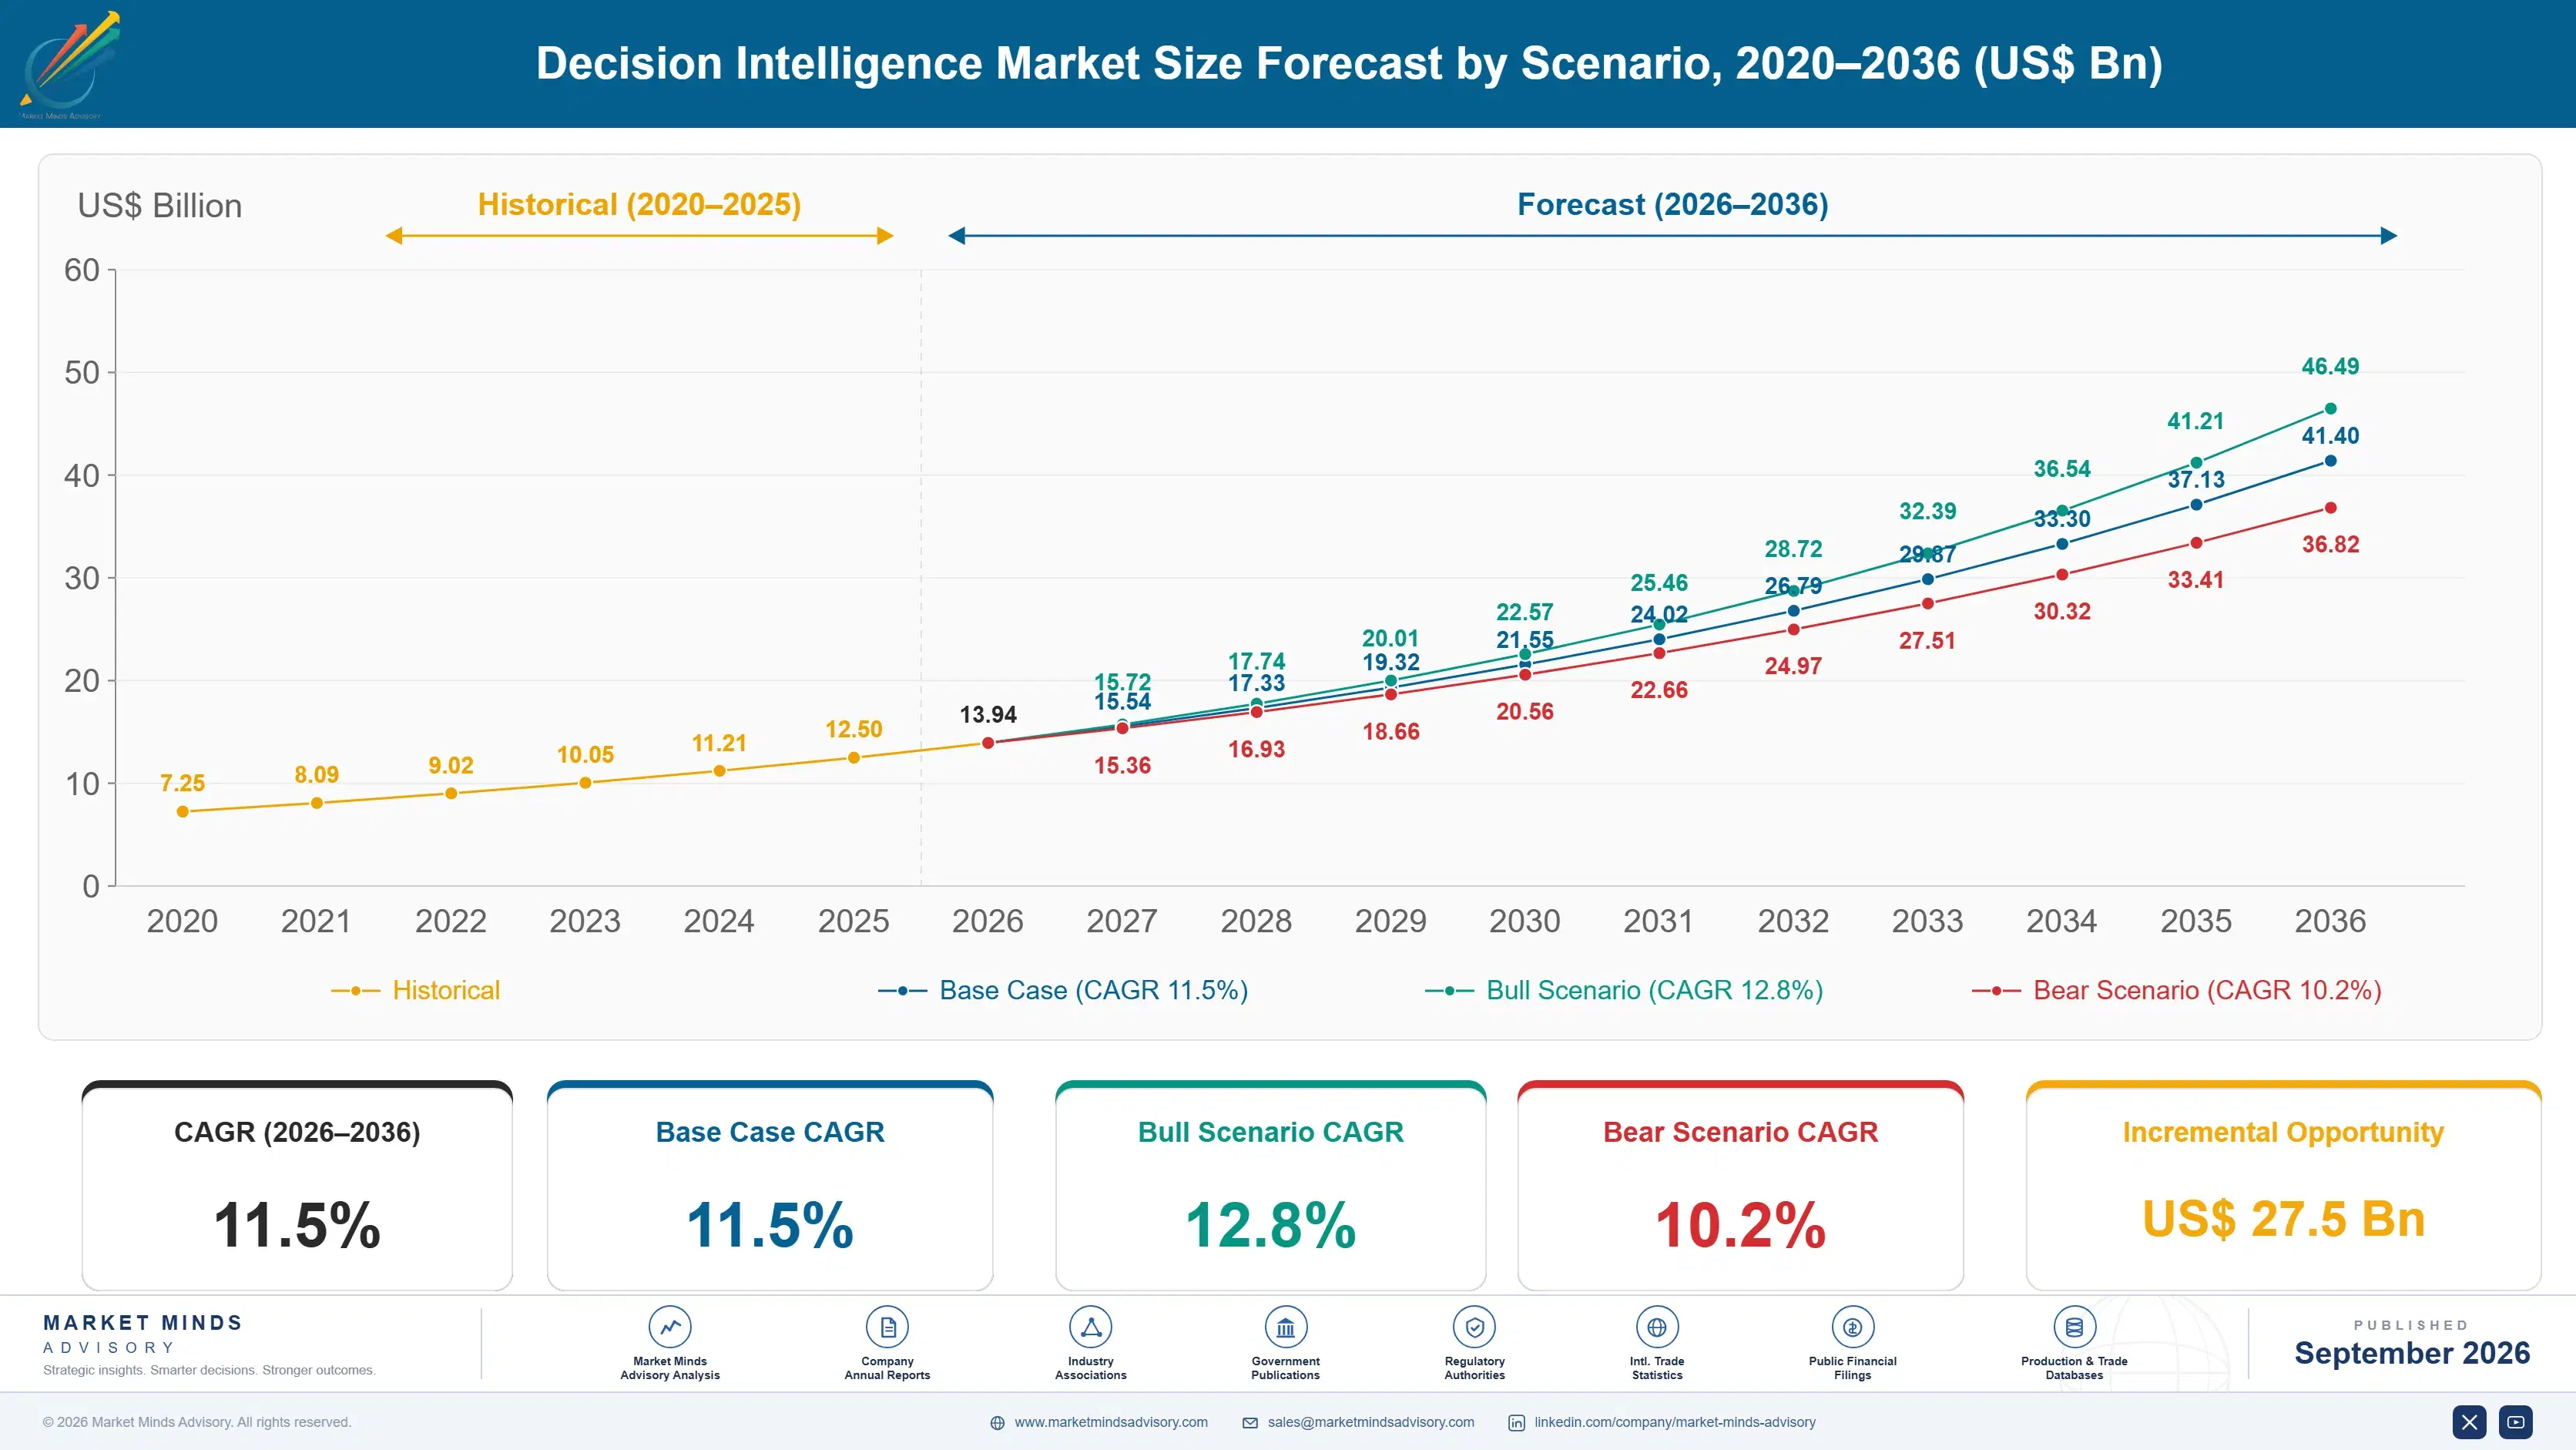
Decision Intelligence Market Forecast Scenarios

decision-intelligence-market-size-forecast-scenario-1788503587512
Decision intelligence platform demand between 2020 and 2025 grew steadily as enterprises accelerated digital transformation initiatives and sought to reduce decision latency across increasingly complex operational environments worldwide. Adoption concentrated initially in supply chain and financial services, with healthcare and manufacturing following as data infrastructure maturity expanded considerably across most enterprise sectors and geographic markets.
The base case assumes continued growth driven by three mechanisms: expanding enterprise data infrastructure maturity enabling more sophisticated decision modeling across operational functions, growing adoption of generative AI reasoning capability extending decision automation beyond structured rules-based workflows, and rising competitive pressure pushing enterprises toward faster, more consistent operational decision-making across every business unit and functional area. Software and platform subscription revenue grows meaningfully faster than consulting services industry-wide over the coming years.
The bull case centers on enterprises standardizing on unified decision intelligence platforms that automate an increasing share of operational decisions across their entire organization and value chain. The bear case involves generative AI capability becoming commoditized within general-purpose enterprise software platforms, displacing standalone decision intelligence vendors from their current specialized market position entirely within a handful of years.

Where Analytics Becomes Automated Judgment

The decision intelligence market has moved past its early business intelligence dashboard phase into a period defined by generative AI reasoning capability that models and increasingly automates complex operational decisions. Enterprises increasingly evaluate vendors on decision automation depth and simulation accuracy rather than basic data visualization capability alone, since decision latency directly affects competitive positioning.
MARKET CONCENTRATION32%Top five vendors hold combined global platform revenue share
AVERAGE CONTRACT VALUE$680,000Typical annual subscription for a large enterprise deployment
SUPPLY CHAIN APPLICATION SHARE31%Share of total platform revenue from supply chain use cases
DECISION LATENCY REDUCTION58%Typical improvement in decision cycle time after deployment
CONTRACT RENEWAL CYCLE3 yearsTypical multi-year enterprise subscription contract length nationwide today
AUTOMATED DECISION SHARE27%Share of covered decisions fully automated without human review
Supply chain and financial services enterprises drive the largest share of platform revenue, though healthcare and manufacturing sectors are adopting comparable decision automation density fastest given rising operational complexity. Generative AI-powered decision automation capability is capturing growing share of new enterprise contracts as organizations confront mounting decision volume that exceeds human review capacity. Enterprises increasingly treat this capability as a baseline expectation rather than a differentiating premium feature worth extra cost.
Vendor differentiation increasingly centers on generative AI reasoning capability and decision simulation accuracy rather than basic dashboard functionality alone, with vendors investing in domain-specific decision models becoming the primary competitive battleground. Enterprise customers increasingly favor vendors demonstrating proven decision accuracy track records across multiple operational functions and industries. Vendors unable to demonstrate this decision accuracy increasingly struggle to win larger multi-year enterprise contracts.
"A dashboard tells you what happened. This category exists because enterprises got tired of waiting for someone to read it and decide."
Senior Analyst, Enterprise AI and Decision Systems Practice · MMA Technology Practice · September 2026

Market Trends

Generative AI Extends Automation to Unstructured Decisions

Decision intelligence platforms are integrating large language model-based reasoning capability that lets enterprises automate decisions involving unstructured inputs like customer correspondence, contract language, and qualitative risk factors, extending automation well beyond the structured, rules-based decisions earlier generation platforms handled exclusively. This capability shift is expanding the addressable decision volume considerably, since most enterprise decisions historically required human judgment specifically because they involved unstructured information that earlier rules-based systems could not adequately parse or reason through reliably. Vendors expect this capability to become standard across most enterprise deployments within the next several years of continued platform maturation and adoption.
Market Impact: Enterprise decision volume grew 48%

Decision Simulation Capability Becomes Standard Feature

Vendors are integrating decision simulation capability that lets enterprises model the projected outcomes of alternative decision paths before committing to an action, addressing the historical limitation of decision intelligence platforms that could only optimize within a single predefined decision framework. This simulation capability gives enterprises confidence to expand automated decision-making into higher-stakes operational areas where the cost of an incorrect decision previously kept human review mandatory regardless of platform recommendation accuracy. Vendors report meaningfully higher automated decision adoption rates when simulation capability precedes broader deployment expansion across the organization. today.
Market Impact: Faster decision cycles lifted revenue 31%

Market Opportunities and Growth Drivers

Decision Volume Growth Outpaces Human Review Capacity

Enterprise operational decision volume continues growing substantially faster than the human staff available to review and approve each decision individually, creating an operational gap that decision intelligence platforms are increasingly necessary to close across most large enterprise operations. Organizations that previously routed every significant operational decision through human managers now automate a meaningful share of routine and moderately complex decisions, a scale transition that makes decision intelligence platforms an operational necessity rather than a discretionary technology investment for operations leadership. This scale transition shows no sign of slowing as enterprises continue expanding automated operational decision-making capability.
Market Impact: Accuracy concerns limited automation 33%

Competitive Pressure Rewards Faster Decision Cycles

Enterprises across most industries face intensifying competition where decision speed increasingly determines competitive outcomes, particularly in pricing, inventory allocation, and customer response scenarios where delayed decisions directly translate into lost revenue or increased cost. Companies increasingly view decision intelligence platform adoption as a direct driver of competitive positioning rather than a secondary operational efficiency consideration, pushing technology investment budgets toward decision automation capability that competitors without comparable systems cannot match in response speed or consistency. This competitive pressure shows no sign of easing across most industries facing comparable operational decision speed requirements.
Market Impact: Integration delays added 27% to timelines

Market Restraints and Challenges

Decision Accuracy Concerns Limit High-Stakes Automation

Enterprises remain hesitant to fully automate high-stakes decisions involving significant financial exposure or regulatory compliance risk, given persistent concerns about AI reasoning errors and the difficulty of auditing exactly how a given automated decision was reached. The root cause lies in the inherent complexity of explaining large language model-based reasoning processes in terms regulators and internal auditors find satisfactory for high-stakes decision categories. Vendors are responding with explainability features and human-in-the-loop review layers for the highest-stakes decision categories. This trust-building process remains incomplete across much of the highest-stakes enterprise decision category segment.
Market Impact: Automated decision coverage expanded 42%

Legacy Data Infrastructure Complicates Platform Integration

Enterprises with fragmented, siloed legacy data infrastructure across different business units face significant integration challenges when deploying decision intelligence platforms that require unified data access to generate reliable recommendations across the enterprise. The root cause traces to decades of accumulated departmental data systems built independently without consideration of future cross-functional decision intelligence integration requirements. Vendors are responding with pre-built data connector libraries and phased integration approaches that reduce upfront data unification burden for enterprises. This connector-based approach gradually reduces the integration burden for enterprises with fragmented legacy data infrastructure. today.
Market Impact: Simulation-enabled deployments grew 35% since 2024
3 additional market trends, 4 additional growth drivers, and 2 additional restraints and challenges are covered in the full report. Contact sales@marketmindsadvisory.com to access the complete intelligence.

Segment CAGR and Growth Architecture

The decision intelligence market segments by decision automation capability rather than by industry vertical, since the same modeling, simulation, and reasoning architecture serves supply chain, financial services, and healthcare customers with comparable technical requirements across most deployment scales. This dimension captures the functional distinction driving vendor investment priorities and pricing strategy across the industry.
decision-intelligence-market-market-share-analysis-1788503588046

Generative AI-Powered Decision Automation Platforms

Generative AI-powered decision automation platforms use large language model-based reasoning to automate decisions involving unstructured inputs like customer correspondence and qualitative risk factors, extending automation well beyond the structured, rules-based decisions earlier platforms handled exclusively. This segment commands the fastest growth in the entire market, driven by enterprises seeking measurable decision volume coverage that traditional rules-based systems cannot deliver reliably at meaningful scale. Adoption concentrates initially among larger enterprises with sufficient historical decision data volume to train meaningful reasoning models, though smaller organizations are beginning to adopt shared industry benchmarking models that lower the data threshold required for meaningful adoption. This shared-benchmarking trend meaningfully expands the segment's addressable market beyond large enterprises alone.
CAGR 18.0%

Decision Explainability and Governance Tools

Decision explainability and governance tools provide auditable documentation of how automated decisions were reached, addressing enterprise and regulatory concerns about deploying AI reasoning for high-stakes decisions without transparent accountability mechanisms. This segment grows faster than basic decision automation platforms as enterprises increasingly recognize explainability as a prerequisite for expanding automation into regulated or financially significant decision categories. Vendors with proven regulatory compliance track records capture disproportionate share of this segment's expanding demand relative to vendors offering opaque, black-box decision automation without comparable governance infrastructure. Vendors expect this governance requirement to intensify further as automation expands into increasingly regulated decision categories across most industries served. This advantage compounds meaningfully across successive product generations.
CAGR 14.5%
Full segment breakdown across 6 segments available in the complete report.

Regional Architecture and Country Demand Map

North America leads as the largest regional market given concentrated enterprise AI vendor headquarters and early production-scale decision automation deployment, while South Asia and Pacific grows fastest on rapid enterprise digitization. Regional shares reflect vendor concentration, data infrastructure maturity, and enterprise AI adoption pace worldwide.

North America

North America's leading regional share reflects concentrated enterprise AI and decision intelligence vendor headquarters across the United States, where major cloud platforms and specialized decision automation companies compete for large enterprise contracts. American financial services and supply chain enterprises drive the largest share of near-term platform spend, valuing measurable decision latency reduction across increasingly complex operational environments. Canadian enterprises follow comparable adoption patterns at a smaller scale, often through the same North American vendors serving US customers. Growth here trails the fastest-expanding Asian markets given already-substantial existing platform penetration across most large enterprise segments and industry verticals. This dominant position appears durable given the depth of enterprise relationships and specialized AI talent concentrated across the region's technology hubs.
Share: 31% | CAGR: 12.0% (2026 to 2036)

Western Europe

Western Europe combines mature enterprise analytics adoption in Germany, the United Kingdom, and France with growing decision intelligence investment responding to intensifying competitive pressure across major national industries. Regional growth trails North America and East Asia given already-established analytics platform baselines across major enterprise customers and comparatively slower generative AI reasoning adoption relative to US counterparts given data governance considerations. German and British vendors increasingly compete for the same multinational enterprise accounts, keeping regional pricing more standardized than the fragmented US market currently exhibits across comparable enterprise segments. This dynamic keeps competitive intensity concentrated among a smaller set of established vendors serving comparable multinational enterprise accounts. across most enterprise sectors served.
Share: 22% | CAGR: 10.0% (2026 to 2036)
Regional intelligence for 5 additional markets available in the complete report: East Asia, South Asia and Pacific, Latin America, Middle East and Africa, Eastern Europe. Contact sales@marketmindsadvisory.com.
decision-intelligence-market-country-cagr-analysis-1788503588564

How Vendors Grow Enterprise Contract Value

Decision intelligence vendors are moving well beyond one-time platform licensing toward layered commercial relationships that capture recurring revenue across an enterprise's full decision automation lifecycle, from initial deployment through years of subsequent model refinement, consulting, and governance services spanning the entire enterprise relationship nationwide and across every single international market currently actively being served.

Bundle Decision Governance Reporting with Core Platform

Vendors are attaching decision governance and audit trail reporting subscriptions directly to core automation platform sales, capturing recurring revenue while giving enterprises the compliance documentation regulators increasingly require for automated decisions. This shift has lifted average enterprise contract value by roughly 34% compared to automation-only subscriptions, since governance reporting continues generating revenue across the full multi-year platform relationship regardless of decision volume changes. Enterprises increasingly negotiate this bundle upfront rather than adding governance reporting as a later procurement amendment across their deployment. This creates a durable moat competitors selling standalone automation without comparable governance cannot easily replicate.
Market Impact: Governance bundling lifts contract value by roughly 34%

Offer Domain-Specific Decision Model Consulting Services

Vendors with deep industry vertical expertise are expanding into paid consulting services, helping enterprises customize decision models for specific regulatory and operational contexts before committing to broader platform deployment across their organization. This higher-margin services layer commands premium consulting rates well above standard platform licensing, and vendors report win rates for expanded platform contracts rising by roughly 28% when consulting engagements precede the sale. Enterprises value this sequencing since it reduces uncertainty before committing to broader platform expansion investment. Vendors report meaningfully stronger long-term account relationships when consulting precedes platform negotiation.
Market Impact: Consulting-first engagements lift win rates by roughly 28%

Expand into Cross-Functional Decision Orchestration Platforms

Vendors with established single-function decision automation relationships are cross-selling cross-functional orchestration capability that coordinates decisions across multiple business units rather than isolated departmental deployments negotiated separately, capturing additional wallet share without incurring new customer acquisition cost. This uses existing trust and technical credibility to capture a broader enterprise footprint, lifting per-enterprise revenue by an estimated 25% where cross-selling succeeds. Enterprises welcome this consolidation since it simplifies vendor management across their entire decision automation footprint. Vendors report enterprises rarely resist this expansion once initial deployment proves technically reliable and trusted. nationwide.
Market Impact: Orchestration cross-selling lifts revenue by roughly 25 percent

License Decision Reasoning Models to Smaller Vendors

Vendors with proven generative AI decision reasoning models are licensing this technology directly to smaller regional analytics vendors rather than only deploying it within their own branded platform, an asset-light model that expands addressable revenue considerably beyond direct enterprise sales capacity. This lets model developers capture licensing revenue across a far broader vendor base than their own sales organization could reach, with licensing fees typically representing 10% to 15% of the licensee's platform revenue. This model scales efficiently since marginal support costs stay low across each additional licensee relationship. nationwide.
Market Impact: Licensing fees capture 10-15% of the licensee's revenue

Who Controls the Margin Pool

Concentration among the top five decision intelligence vendors sits near thirty-two percent of global platform revenue, reflecting a genuinely fragmented market where enterprise software giants and specialized decision automation startups compete across different enterprise segments. Palantir and SAS lead on data integration depth and analytics maturity respectively, with a meaningful gap separating them from IBM, Microsoft, and Aera Technology, each building distinct positioning around enterprise AI platform breadth, cloud infrastructure integration, or supply chain decision automation specifically.
Current competitive activity centers on integrating generative AI reasoning capability and decision explainability tooling into existing analytics offerings, alongside expanding domain-specific decision models addressing regulated industry compliance requirements. Vendors are also pursuing partnerships with cloud hyperscalers to secure infrastructure access ahead of large enterprise deployments rather than competing purely on analytics specifications after platform decisions are finalized.

Rankings could shift meaningfully as AI-native startups building genuine generative reasoning capability win larger enterprise contracts previously distributed across a more fragmented analytics vendor base. Established vendors slow to develop dedicated decision automation and explainability capability risk ceding the fastest-growing segment of the market to challengers built specifically around next-generation enterprise decision requirements.
decision-intelligence-market-company-positioning-matrix-1788503589090

Competitive Moat and Risk Dimensions

PALANTIR TECHNOLOGIES

Moat: Deep Data Integration Legacy

Palantir's decades of complex enterprise and government data integration experience give it technical credibility and deployment relationships that newer entrants cannot replicate quickly, letting it win large multi-year contracts bundling decision intelligence with broader data platform infrastructure services. This installed base advantage is difficult for newer entrants to replicate given the long sales cycles and switching costs involved.
PALANTIR TECHNOLOGIES

Risk: Premium Pricing Limits Broader Adoption

Palantir's premium pricing tied to its custom integration depth limits its addressable market among mid-sized enterprises with more constrained technology budgets, potentially ceding faster-growing volume segments to lower-cost, more standardized competing platforms. Competitors offering simpler, faster-to-deploy platforms increasingly win accounts where custom integration depth matters less.
SAS INSTITUTE

Moat: Analytics Methodology Depth

SAS Institute's decades-long reputation for statistical and analytics methodology rigor gives it credibility with regulated industry customers wary of decision accuracy risk, supporting premium pricing that newer AI-native competitors struggle to match given SAS's established validation track record. This methodology credibility remains difficult for AI-native competitors lacking comparable validation history to replicate quickly.
SAS INSTITUTE

Risk: Legacy Architecture Slower to Modernize

SAS Institute's traditional analytics architecture has made it comparatively slower to integrate generative AI reasoning capability than venture-backed specialists, risking share loss in the fastest-growing segment if this development gap persists over time. Competitors built natively around generative AI increasingly outpace this legacy development approach in feature releases.

Players Tracked

Prominent Players

Palantir Technologies
SAS Institute
IBM
Microsoft
Aera Technology

Other Key Players

Google Cloud
AWS
Salesforce
ServiceNow
C3.ai
DataRobot
Alteryx
Anaplan
o9 Solutions
Kinaxis
Blue Yonder
Sisense
Domo
Qlik
TIBCO Software

Recent Developments

AUGUST 2025

Palantir acquired a decision explainability startup in August 2025 to accelerate integration of auditable AI reasoning documentation into its existing decision intelligence platform, strengthening its competitive position against vendors already offering comparable governance capability to regulated enterprise customers evaluating automation platforms across multiple industries and jurisdictions.
Signal: Signals established analytics vendors racing to close the explainability capability gap through targeted acquisition rather than internal development
NOVEMBER 2025

SAS Institute entered a strategic partnership with a leading cloud hyperscaler in November 2025 to co-develop generative AI reasoning modules optimized for enterprise decision automation, securing preferred infrastructure access ahead of upcoming enterprise platform migration cycles across multiple industry verticals and geographic regions worldwide today.
Signal: Signals vendors pursuing preferred cloud infrastructure access to secure design-in positions ahead of enterprise migration cycles
FEBRUARY 2026

Aera Technology launched an expanded cross-functional decision orchestration platform in February 2026 enabling enterprises to coordinate automated decisions across supply chain, finance, and operations simultaneously, addressing growing enterprise demand for unified decision governance across increasingly complex organizational structures, reporting hierarchies, and cross-departmental workflows nationwide today.
Signal: Signals vendors building cross-functional orchestration capability to address growing enterprise demand for unified decision governance today

Cloud Compute Cost and Model Efficiency Risk

Decision intelligence platform cost structure concentrates in cloud computing infrastructure, machine learning engineering labor, and enterprise data integration services, together representing roughly sixty percent of total operating cost. Cloud infrastructure spend runs through major hyperscale providers under enterprise agreements, while data integration services scale directly with the complexity of a customer's legacy enterprise system landscape. Data integration services costs continue rising as enterprise legacy systems grow more fragmented over time.
Rising cloud computing costs tied to generative AI model training and inference during 2023 and 2024 pushed platform vendors' infrastructure spend meaningfully higher, a dynamic several company annual reports and investor filings across the enterprise software industry documented as compressing gross margins for AI-heavy platform businesses. Vendors running increasingly sophisticated reasoning models absorbed higher compute costs before passing them through to enterprise customers via subscription price increases.

Smaller decision intelligence vendors lacking scale to negotiate favorable enterprise cloud computing agreements face materially higher infrastructure costs per customer than Palantir or Microsoft, whose purchasing scale secures preferential hosting rates. This exposure gap widens further for vendors running compute-intensive generative AI reasoning models without the negotiating leverage larger competitors have already secured with major cloud infrastructure providers.
decision-intelligence-market-cost-volatility-analysis-1788503589286

Diversifying Cloud Infrastructure Provider Relationships

Vendors are qualifying additional cloud infrastructure providers beyond their primary hosting partner, spreading cost negotiation leverage across a broader provider base and reducing exposure to any single vendor's pricing changes during periods of rising compute costs nationwide and internationally across every major product line, customer segment, deployment scale, and current geographic market being served.

Optimizing Reasoning Model Compute Efficiency

Vendors are investing in more efficient reasoning model architectures that deliver comparable decision accuracy at lower computational cost, reducing infrastructure spend per customer without sacrificing the analytical capability enterprises increasingly expect from modern decision intelligence platforms across every deployment scale, customer segment, geographic market, industry vertical, and current specific use case being served nationwide.

Portfolio Architecture for Margin Defence

The decision intelligence market splits into a volume tier built around standard rules-based decision support systems, a premium tier centered on generative AI decision automation and simulation, and an emerging tier tied to governance and licensing services. Gross margins widen considerably moving up this ladder, and vendors increasingly structure product roadmaps around migrating enterprises toward these higher-margin tiers over successive contract renewal cycles. nationwide.
Volume-tier rules-based decision support competes largely on price and basic reliability, compressing margins toward the low twenties percent range as basic functionality commoditizes across most vendors. Premium generative AI automation and simulation platforms command margins in the high thirties to mid fifties percent range, reflecting the specialized machine learning engineering and continuous model refinement bundled into these higher-value enterprise relationships.

High-value pools concentrate overwhelmingly in generative AI decision automation and governance services, where enterprises pay for measurable decision volume coverage and regulatory confidence rather than basic rules-based logic alone. Vendors unable to shift their portfolio mix toward these tiers face continued margin compression as commodity decision support faces ongoing price pressure from cloud hyperscalers bundling comparable capability into existing infrastructure offerings.

Standard rules-based decision support systems competing primarily on price and basic reliability against increasingly commoditized functionality, with gross margins typically in the eighteen to twenty-five percent range. across most enterprise segments.
Gross Margin

Generative AI decision automation and simulation platforms bundled with continuous model refinement and specialized engineering support, commanding gross margins in the thirty-five to fifty percent range given the technical complexity involved.
Gross Margin

Decision governance reporting and reasoning model licensing services layered on core platforms, where recurring compliance and licensing revenue supports gross margins in the forty-five to sixty percent range for qualified vendors.
Gross Margin
decision-intelligence-market-portfolio-architecture-1788503589800

High-value Sub-segments and Strategic Watch-out

Generative AI-Powered Decision Automation Platforms

Generative AI-Powered Decision Automation Platforms combine the fastest unit growth in the entire market with the highest achievable margins, driven by enterprises seeking measurable decision volume coverage that rules-based systems cannot deliver, making this segment the clearest investment priority for vendors over the coming several years.

Decision Explainability and Governance Tools

Decision Explainability and Governance Tools deliver strong margins tied to regulatory compliance demand, though unit growth trails automation platforms as this capability spreads more gradually across regulated industry customers still evaluating investment priorities worldwide over the coming several years of continued expansion across most industry verticals.

Rules-Based Decision Support Systems

Rules-Based Decision Support Systems remain a substantial revenue base today but face growing pricing pressure from generative AI substitution and cloud hyperscaler bundling, keeping margins moderate even as absolute contract volume stays meaningful given existing enterprise deployment scale globally across most industries and geographic markets.

Decision Integration and Orchestration Platforms

Decision Integration and Orchestration Platforms warrant close monitoring as a slower-growing segment, vulnerable to further share loss as unified platforms absorb standalone integration functionality rather than sold separately, a dynamic worth tracking closely for vendors weighing continued investment in this narrower category across most enterprise segments.

Where Automation Compounds Value

Decision intelligence platforms generate durable multi-year revenue once embedded into an enterprise's operational workflows, since organizations rarely switch platform vendors mid-deployment given the cost of retraining decision models and re-validating automation accuracy across every affected business process. This creates an annuity-like revenue stream for incumbent vendors spanning the full four-to-six-year contract cycle typical of enterprise decision automation procurement across most industry sectors.
Adoption stickiness varies sharply by decision category. Financial services and supply chain enterprises embed platforms deep into regulatory reporting and operational planning infrastructure, making switching costly even when a competitor offers marginally better analytics, whereas smaller commercial deployments treat platforms as more interchangeable given simpler decision requirements. Healthcare and government customers sit between these poles, valuing proven governance certification enough to resist casual vendor switching without demanding the same integration depth financial services requires.

A generational shift is underway as procurement authority moves from IT operations veterans favoring familiar analytics vendors toward data science and AI teams evaluating decision platforms as part of broader enterprise automation strategies. Younger technology leaders increasingly demand open API access and third-party model integration alongside basic decision support functionality, reshaping what differentiates a winning decision intelligence vendor over the coming product generations.
decision-intelligence-market-end-use-penetration-index-1788503590280

Where Vendors Should Focus Next

These are among the four positions where our research anticipates prominent divergence between winners and laggards over the coming forecast period. Each is grounded in the demand model, the regulatory perimeter, and the announced capacity pipeline.
01 / GENERATIVE AI CAPABILITY INVESTMENT

Prioritize generative AI reasoning over rules-based refinement

Generative AI-powered decision automation platforms carry both the fastest unit growth and the widest achievable margins in this entire market, well ahead of standard rules-based decision support systems. Vendors still allocating engineering resources evenly across rules refinement and generative AI development are ceding ground to competitors building measurable decision volume coverage faster than incumbents willing to commit comparable investment and talent. The clearest path to sustained margin expansion runs directly through this capability over the next several years of forecast growth.
02 / DECISION GOVERNANCE INFRASTRUCTURE BUILD

Build decision explainability infrastructure ahead of regulation

Regulatory bodies increasingly require enterprises to maintain auditable documentation of automated decision reasoning, making explainability infrastructure a genuine competitive differentiator rather than a checkbox requirement enterprises treat as interchangeable across competing vendors nationwide and internationally today. Companies investing early in transparent, auditable decision documentation build a defensible position that is difficult for competitors lacking comparable governance infrastructure to replicate quickly at comparable scale and cost. This advantage compounds as regulatory scrutiny of automated decisions continues intensifying across major global markets.
03 / CROSS-FUNCTIONAL ORCHESTRATION EXPANSION

Expand into cross-functional decision orchestration capability

Enterprises increasingly seek platforms that coordinate decisions across multiple business units rather than isolated departmental deployments negotiated separately with different vendors for each individual function and workflow across the whole entire organization today. Vendors that build genuine cross-functional orchestration capability capture broader enterprise access than single-function competitors can achieve, building customer relationships that narrower platforms struggle to replicate quickly at comparable organizational scale, depth, and complexity. This orchestration capability increasingly determines who wins the next decade of enterprise contract expansion.
04 / DOMAIN-SPECIFIC MODEL STRATEGY

Build domain-specific decision models for regulated industries

Enterprises in regulated industries increasingly require decision models tuned to specific regulatory and operational contexts that generic, horizontally applicable platforms often cannot address adequately without extensive customization work, domain expertise, and specialized engineering talent investment over time. Vendors that build genuine domain-specific model depth capture disproportionate share of regulated industry demand relative to horizontal competitors lacking comparable vertical expertise and compliance track records built over many years of experience. This specialization increasingly separates category leaders from generalist decision intelligence competitors.

Engagement Snapshot From the Field

A live engagement with an industry participant carrying material or product regulatory and market exposure ahead of a defining policy shift, showing how our research translates into a defensible multi-year portfolio strategy.
MARKET MINDS ADVISORY · CLIENT ENGAGEMENT SUMMARY
Decision Intelligence Producer Strategic Portfolio Review and Transition Roadmap 2026·Investment Scenario on Decision Intelligence Exposure Evaluation 2025-26
CLIENT PROFILE
The client is a regional financial services firm processing high-volume loan approval and risk assessment decisions, with an existing rules-based decision support system lacking generative AI reasoning capability for handling unstructured application data such as supporting documentation and correspondence. Annual technology budget for decision systems ran in the low tens of millions of dollars (client-reported, unverified by MMA), covering platform licensing and integration services.
STRATEGIC CHALLENGE
The client faced mounting pressure to significantly reduce loan decision turnaround time given intensifying competition from faster, more agile digital-native lenders in the market, while remaining uncertain whether upgrading to generative AI decision automation would deliver sufficient speed and accuracy improvement to justify the integration cost and regulatory validation effort required.
MMA APPROACH
MMA conducted a comparative analysis of platform upgrade scenarios, drawing on primary interviews with the client's own underwriting and compliance staff and benchmarking against four peer regional financial institutions already using generative AI decision platforms. The engagement modeled projected turnaround time and accuracy improvement under multiple regulatory validation timeline assumptions.
KEY FINDINGS
  1. Full platform upgrade would require an estimated $4.5 million in integration and regulatory validation investment overall across the firm (client-reported, unverified by MMA).
  2. A phased deployment targeting standard loan categories first captured sixty percent of the projected turnaround benefit at thirty percent of total cost (client-reported, unverified by MMA).
  3. Decision turnaround delays correlated most strongly with unstructured document review rather than the core underwriting calculation process itself (client-reported, unverified by MMA).
  4. Generative AI reasoning was projected to reduce average loan decision turnaround time by an estimated forty percent based on peer institution data (client-reported, unverified by MMA).
CLIENT PROFILE
The client is a regional financial services firm processing high-volume loan approval and risk assessment decisions, with an existing rules-based decision support system lacking generative AI reasoning capability for handling unstructured application data such as supporting documentation and correspondence. Annual technology budget for decision systems ran in the low tens of millions of dollars (client-reported, unverified by MMA), covering platform licensing and integration services.
STRATEGIC CHALLENGE
The client faced mounting pressure to significantly reduce loan decision turnaround time given intensifying competition from faster, more agile digital-native lenders in the market, while remaining uncertain whether upgrading to generative AI decision automation would deliver sufficient speed and accuracy improvement to justify the integration cost and regulatory validation effort required.
MMA APPROACH
MMA conducted a comparative analysis of platform upgrade scenarios, drawing on primary interviews with the client's own underwriting and compliance staff and benchmarking against four peer regional financial institutions already using generative AI decision platforms. The engagement modeled projected turnaround time and accuracy improvement under multiple regulatory validation timeline assumptions.
KEY FINDINGS
  1. Full platform upgrade would require an estimated $4.5 million in integration and regulatory validation investment overall across the firm (client-reported, unverified by MMA).
  2. A phased deployment targeting standard loan categories first captured sixty percent of the projected turnaround benefit at thirty percent of total cost (client-reported, unverified by MMA).
  3. Decision turnaround delays correlated most strongly with unstructured document review rather than the core underwriting calculation process itself (client-reported, unverified by MMA).
  4. Generative AI reasoning was projected to reduce average loan decision turnaround time by an estimated forty percent based on peer institution data (client-reported, unverified by MMA).
RECOMMENDED STRATEGY
Phase 1: Phase one: deploy generative AI reasoning for standard loan categories first, capturing the largest possible overall share of projected benefit. Phase 2: Phase two: closely evaluate phase one turnaround and accuracy data after a full six months before committing to broader deployment expansion. Phase 3: Phase three: complete deployment across complex loan categories only if phase one data clearly confirms sufficient regulatory validation success overall.
OUTCOME
The client approved phase one deployment for standard loan categories, with implementation completed within seven months of the engagement's conclusion. Early turnaround and accuracy data from the first quarter post-launch tracked ahead of the base case projection, giving leadership sufficient confidence to begin planning phase two evaluation ahead of schedule (client-reported, unverified by MMA).

Frequently Asked Questions

Foundational context covering the market sizes, CAGR, scope, country, region and competition that inform every finding below. This section is provided to cover basics and most often pre-purchase conversations, answered from the MMA Primary Research Dataset.

What is the current size of the Decision Intelligence Market?

The market reached an estimated 12.5 billion dollars in 2025. This figure spans generative AI automation, simulation, rules-based, and governance platforms deployed across enterprise operational functions worldwide.

How large will the Decision Intelligence Market be by 2036?

The market is projected to reach approximately 41.395 billion dollars by 2036. This represents roughly a 2.97 times expansion from the 2026 base as generative AI adoption accelerates globally.

What is the CAGR for the Decision Intelligence Market 2026 to 2036?

The market is expected to grow at a compound annual growth rate of 11.5 percent between 2026 and 2036. Generative AI-powered decision automation platforms are expected to grow well above this overall average rate.

Which segment is growing fastest?

Generative AI-Powered Decision Automation Platforms is the fastest-growing segment, expanding at 18.0 percent annually, roughly 1.57 times the overall market rate. This reflects enterprise demand for measurable decision volume coverage.

Who are the major companies in the Decision Intelligence Market?

Leading participants include Palantir Technologies, SAS Institute, IBM, Microsoft, and Aera Technology. These five companies hold a combined revenue concentration ratio near thirty-two percent globally.

Which country is growing fastest?

India is the fastest-growing country at an estimated 15.5 percent annually, driven by rapid enterprise digitization and expanding financial services and logistics platform adoption. This outpaces most mature market growth rates meaningfully.

Report Segmentation Architecture

The full report scope spans multiple orthogonal segmentation dimensions, with cross-tabulated demand data provided for each dimension pair. Coverage extends further to regional breakdowns, trend trajectories, and the competitive detail needed to support segment-level decision-making.

By Primary Market Dimension

  • Generative AI-Powered Decision Automation Platforms
  • Decision Modeling and Simulation Platforms
  • Rules-Based Decision Support Systems
  • Predictive Decision Analytics Platforms
  • Decision Explainability and Governance Tools
  • Decision Integration and Orchestration Platforms

By End-Use Industry

  • Financial Services
  • Supply Chain and Logistics
  • Healthcare
  • Manufacturing
  • Retail and E-Commerce
  • Government and Public Sector

By Commercial Dimension

  • Enterprise Subscription Licensing
  • Consulting and Integration Services
  • Governance Reporting Revenue Share
  • Technology Licensing Agreements

By Region

  • North America
  • Western Europe
  • East Asia
  • South Asia and Pacific
  • Latin America
  • Middle East and Africa
  • Eastern Europe

Scope, Methodology, and Coverage

Every figure in this report is reproducible from documented input assumptions. The scope below maps the historical period, the forecast horizon, the segmentation dimensions, and the countries covered, alongside the underlying primary and qualitative methodology.
Historical Period
2020 to 2025
Forecast Period
2026 to 2036
Base Year
2025 (USD billions; MMA Primary Research Dataset, September 2026)
Market Definition
This report covers decision intelligence software platforms that combine data science, business rules, simulation, and machine learning to model and support or automate complex enterprise operational decisions. It excludes standalone business intelligence dashboards without decision modeling capability and general-purpose data visualization tools not specific to decision support workflows.
Quantitative Units
USD billions, enterprise seat and decision volume counts where disclosed
Segmentation Dimensions
Decision Automation Capability, End-Use Industry, Commercial Dimension, Region
Regions Covered
North America, Western Europe, East Asia, South Asia and Pacific, Latin America, Middle East and Africa, Eastern Europe
Countries Covered
Global, with detailed regional context across North America, East Asia, Western Europe, South Asia and Pacific, Latin America, Middle East and Africa, and Eastern Europe
Key Companies Profiled
Palantir Technologies, SAS Institute, IBM, Microsoft, Aera Technology, Google Cloud, AWS, Salesforce, ServiceNow, C3.ai, DataRobot, Alteryx, Anaplan, o9 Solutions, Kinaxis, Blue Yonder, Sisense, Domo, Qlik, TIBCO Software
Quantitative Methodology
Primary survey, n=3,800 respondents, Q4 2025, six countries; demand-side model with trade association cross-validation
Qualitative Methodology
47 expert interviews, Q4 2025; applied to validate demand model assumptions, identify emerging dynamics, and assess competitive positioning
Report Format
PDF and XLSX data workbook (Word format preview document)
Publisher
Market Minds Advisory
Report Code
MMA-2026-TEC-703
Published
September 2026
Contact
sales@marketmindsadvisory.com | www.marketmindsadvisory.com

Purchase the full Decision Intelligence Market Report (2026 to 2036).

This report provides a comprehensive assessment of the global decision intelligence market across all major automation capability segments through 2036. It covers market sizing, segmentation, competitive positioning, regional dynamics, input cost exposure, and portfolio economics in significant analytical detail across every chapter of the document. Readers gain quantified forecasts, vendor-level competitive benchmarking, and actionable strategic recommendations grounded firmly in primary survey data and expert interviews conducted throughout Q4 2025 across six countries. The analysis also includes an anonymized client case study illustrating practical application of these findings for platform investment decisions.
Ten-year quantified market forecast through 2036
Six-segment MECE market segmentation framework detailed
Regional analysis across all seven world regions
Competitive benchmarking of twenty leading vendors
Cloud compute cost and model efficiency assessment
Anonymized client case study with strategy roadmap

Built For The People Who Decide

From boardroom strategy to bench-side execution, this report is read cover-to-cover by leaders shaping the next decade of their industry, turning demand scenarios, market dynamics and valuation benchmarks into decisions.
CXOs/ Presidents/ VPs/ Managers
M&A and Corporate Development
Strategy Teams and R&D Heads
Procurement and Product Directors
Regulatory and Compliance Leaders
Investor Relations and Equity Analysts