Market Minds Advisory
Deburring Machine Market

Deburring Machine Market: Nobody Specifies The Last Operation

Around 22% of part finishing hours are still spent removing burrs by hand, on parts whose design nobody checked for whether a machine could reach the edges at all. That gap is the whole market.

Lead Analyst

David Horsley

Published

September 2026

Make Smarter Decisions with Customized Research Insights

Request a free sample report and evaluate market opportunities, growth trends, and competitive dynamics relevant to your business needs.

2025 MARKET VALUE$1.4BMarket Size 2025
2036 FORECAST VALUE$2.8BBase Case , 2026 to 2036
CAGR 2026 TO 20366.6 %Bull 7.8% / Bear 5.4%
INCREMENTAL OPPORTUNITY$1.3BNet 10- year value creation
EXPANSION MULTIPLE1.89x2036 value over 2026 base
Strategic Levers
M&A Pipeline
Regional Outlook
Country Rankings
Competitive Intelligence
Segmental Deep-dive
Call-Us : 91 93563 13602

Executive Snapshot and Market Trajectory

Deburring is the operation nobody designs for. It absorbs roughly 22% of part finishing hours, most of it still manual, and it exists because a machining or stamping process left an edge condition that somebody downstream has to remove before the part will work.
Growth runs at 6.6% and robotic cells lead it. Robotic deburring grows at 9.9%, exactly 1.50 times the market rate, driven by skilled labour scarcity rather than by any cost advantage over a hand file. East Asia holds 36%, above band, because Chinese, Japanese, and Korean precision machining and stamping bases are the largest concentration of burred parts anywhere. Labour scarcity rather than payback arithmetic drives most purchases now.
Concentration is very low at 26% across the top five measured on machine revenue, and application specificity explains it. Every customer part is different, so machines are sold on trial results rather than specification sheets, and a builder with a deep library of proven part applications holds something a competitor cannot assemble quickly. That library accumulates over decades of trials. Robot integrators without any finishing heritage have begun winning cell work on automation capability alone.
Market Definition
This market covers deburring and edge finishing machines supplied for metal and composite part production, spanning belt and brush deburring machines, mass finishing and vibratory systems, high-pressure waterjet deburring systems, electrochemical and thermal energy deburring systems, and robotic deburring cells. Hand tools and abrasive consumables sold independently of machines, general surface grinding and polishing equipment, shot blasting and peening systems, parts washing and cleaning lines, and contract deburring services fall outside scope.
Base Year Value
$1.4B in 2025 (MMA Primary Research Dataset, August 2026)
Forecast Period
2026 to 2036, eleven discrete annual values
CAGR
6.6% base case. Bull 7.8%. Bear 5.4%.
Fastest Growth Segment
Robotic Deburring Cells: 9.9% CAGR
Fastest Growth Country
India: 9.2% CAGR
Fastest Growth Region
South Asia and Pacific: 8.7% CAGR
Largest Region
East Asia: 36% of 2025 global value
Market Leaders
Rosler Oberflaechentechnik, Timesavers, LISSMAC Maschinenbau, Costa Levigatrici, Walther Trowal. Source: MMA Analysis based on company annual reports.
Primary Survey
n=3,800 procurement and R&D decision-makers, Q4 2025, six countries
Methodology
Demand-side build-up, cross-validated against public data, 47 expert interviews

Deburring Machine Market Forecast Scenarios

deburring-machine-market-size-forecast-scenario-1787302384904
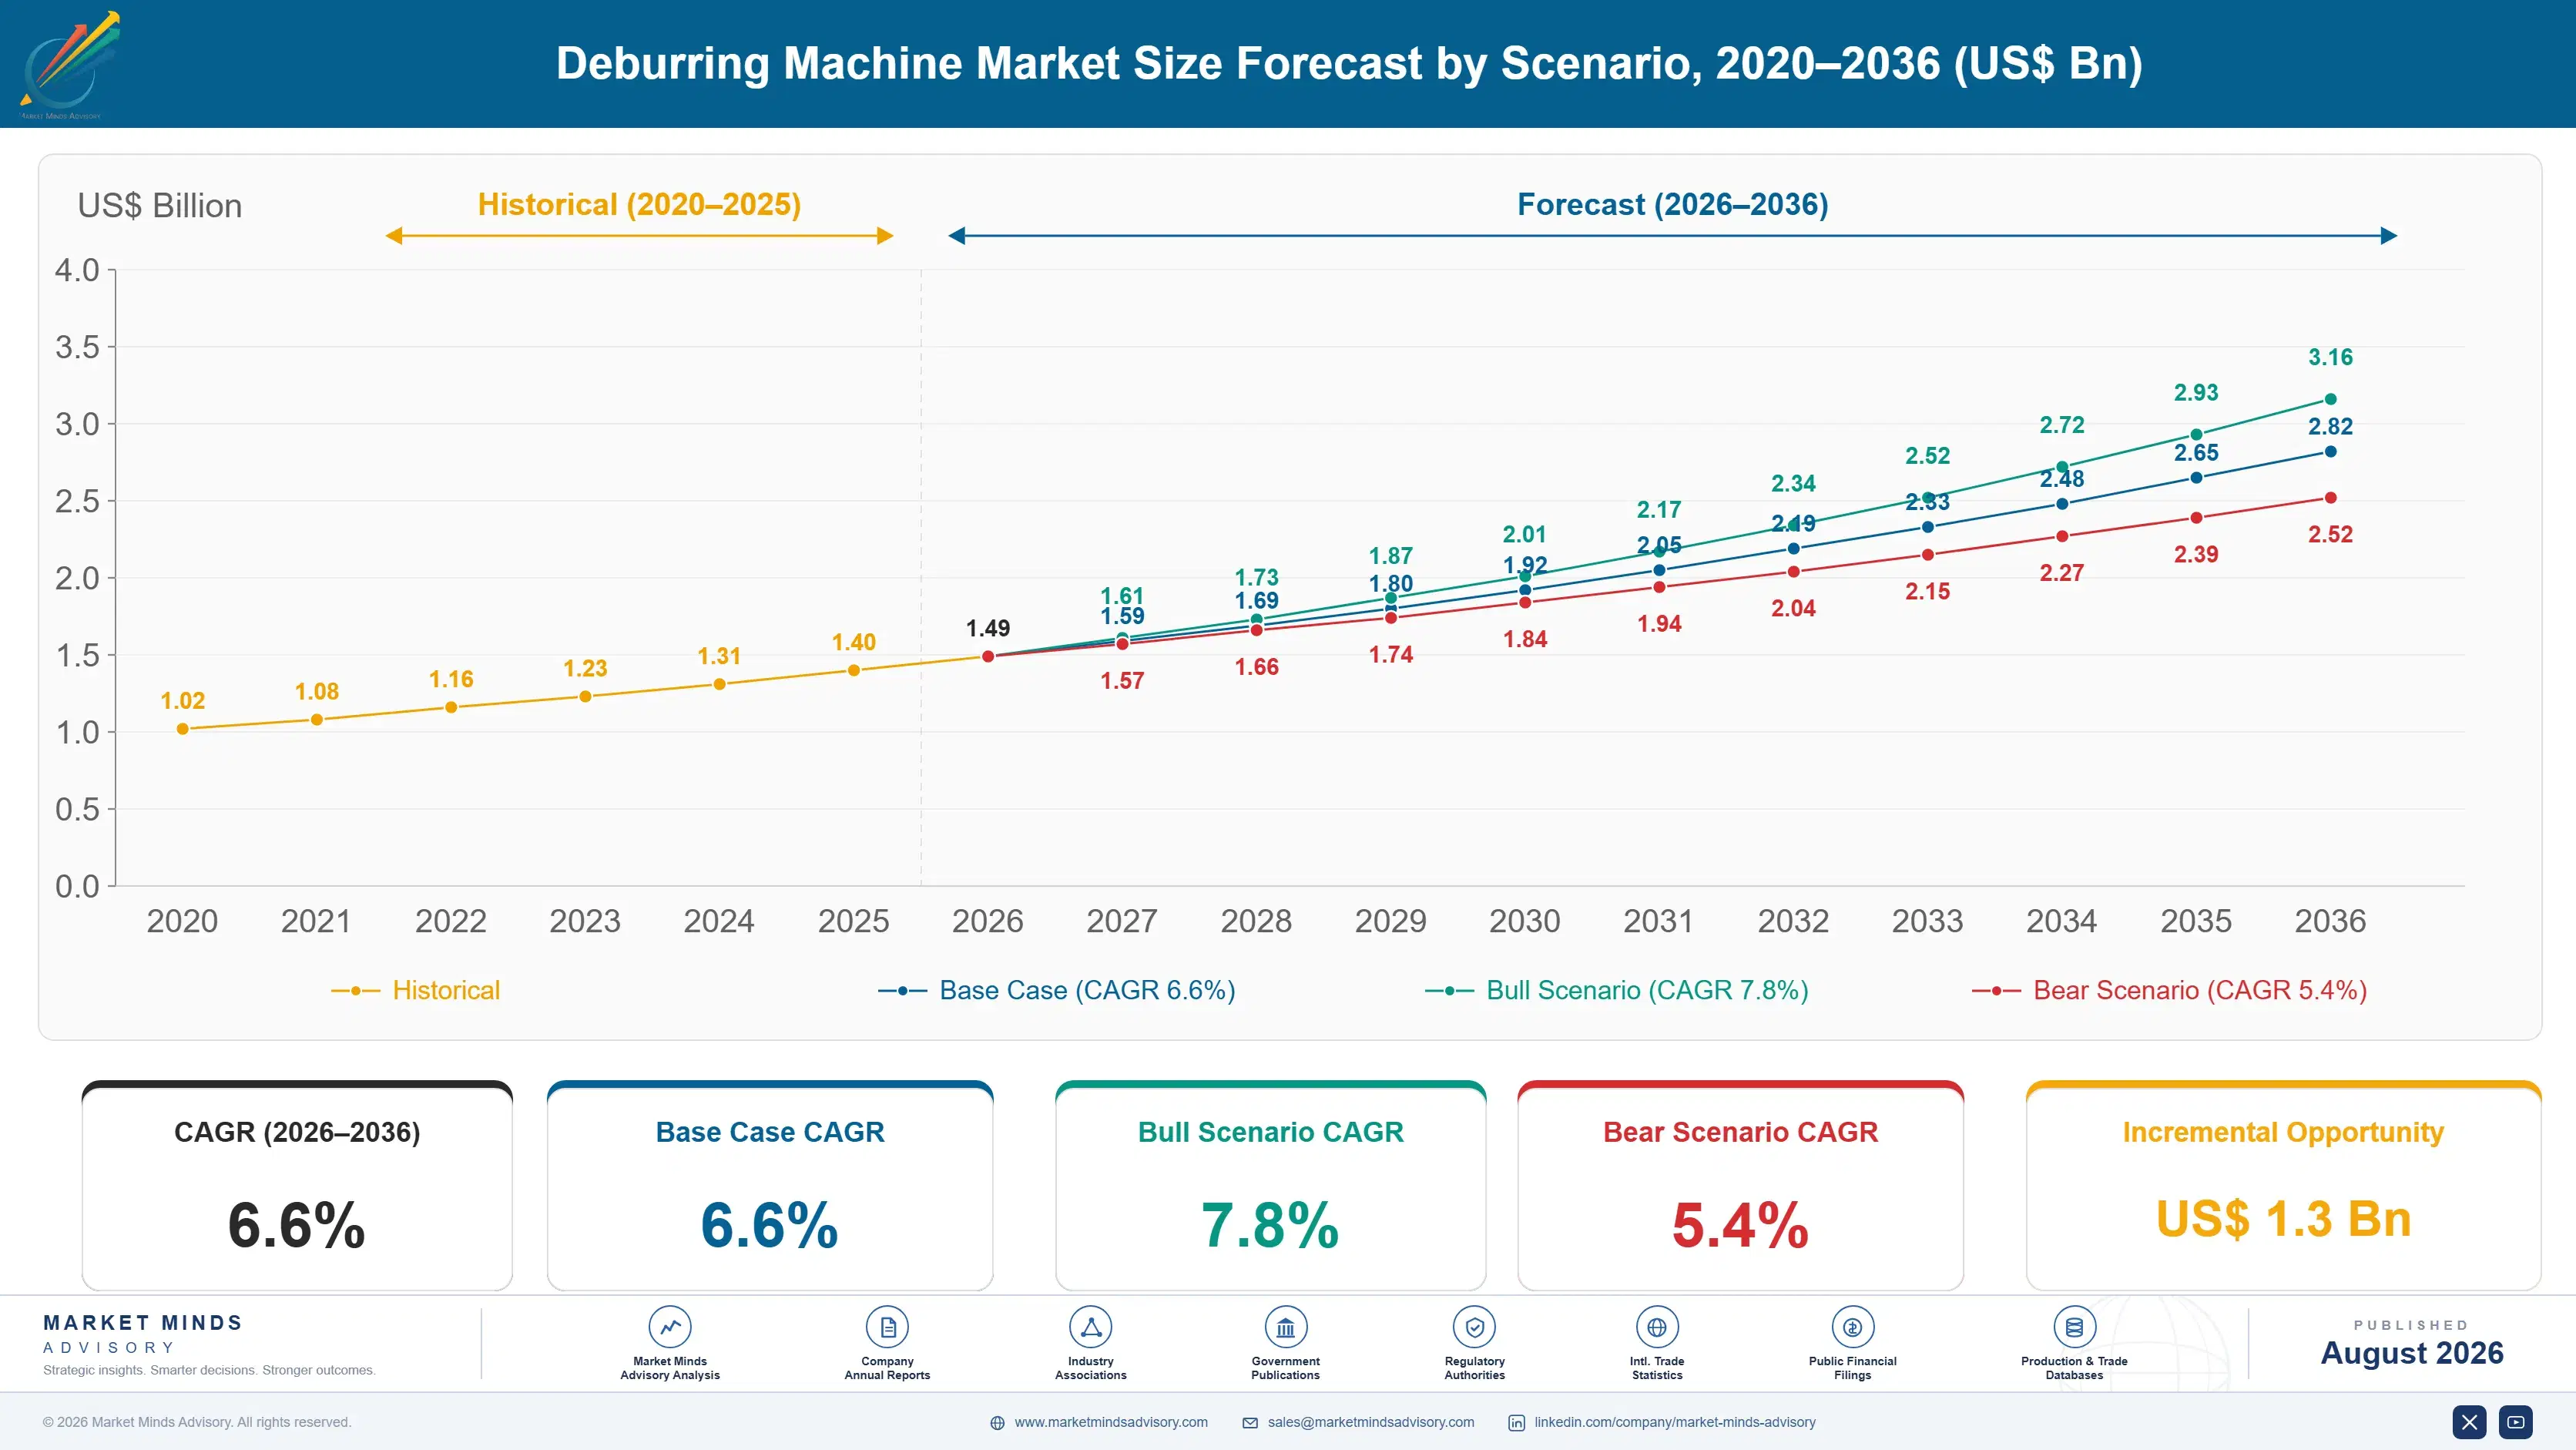
The 2020 to 2025 period ran at 5.6% and the driver behind it changed markedly. Early growth came from automotive and general engineering capacity, then stalled through 2020 and 2021 as capital spending paused. From 2022 the pull came from a different direction entirely: manufacturers could not recruit the skilled hand deburring labour they had always relied on, and automation became a staffing decision rather than a cost one.
Three mechanisms carry the 6.6% base case. Skilled labour scarcity is the largest, since hand deburring is unpleasant, repetitive work that manufacturers across every developed market struggle to staff at any wage. Electric vehicle component production is the second, where busbar and battery tray edge quality is a safety requirement. And precision tolerance tightening is the third, as burr-related rejects become less tolerable. None of the three depends on general machinery capital recovering.
The 7.8% bull case rests on robotic cell prices falling far enough to reach small and medium job shops, which represent most burred parts and almost no current automation. The 5.4% bear case is a general machinery capital slowdown, since deburring equipment is a secondary purchase that gets deferred whenever the primary machining investment does.

Sold On Trials, Not Specifications

Burrs are a consequence rather than a product. Every cutting, stamping, and forming operation leaves an edge condition that has to be removed before a part will assemble, seal, or survive fatigue loading, and roughly 22% of finishing hours still go to doing that by hand. Nobody designs a part around deburring, which is exactly why the operation is so awkward and so persistently manual.
TOP FIVE CONCENTRATION26%Very fragmented, with regional builders serving local machining bases
MANUAL DEBURRING LABOUR SHARE22%Of total part finishing hours still performed entirely by hand
APPLICATION TRIAL DURATION6 weeksFrom part submission to a proven process recommendation for purchase
MACHINE PAYBACK PERIOD19 monthsTypical return measured against the manual labour it displaces
BURR-RELATED REJECT RATE3%Of precision machined parts failing on edge condition alone
AFTERMARKET REVENUE SHARE31%Of builder revenue from consumables, media, and ongoing support
That awkwardness explains how machines get sold. Every customer part has different geometry, material, and burr condition, so a machine that works beautifully on one component may be useless on the next, and no specification sheet resolves the question. Builders run application trial laboratories, take customer parts, and demonstrate a process over roughly six weeks before anybody signs anything. Recruitment failure now drives more purchases than economics does.
Concentration at 26% follows from that directly. A builder's real asset is a library of proven applications across thousands of trialled parts, which tells it quickly whether a new enquiry is winnable and how. That library is regional, because it reflects the machining base around the builder, and it cannot be bought or hurried by a competitor entering from elsewhere.
"A customer sends us a part and asks for a quote. We send back a trial date. Anybody who quotes a deburring machine off a drawing has either seen that exact part before or is about to have a very difficult installation."
Director, Metal Finishing and Production Equipment Practice · MMA Industrial Equ

Market Trends

Labour Scarcity Turns Automation Into A Staffing Decision

Hand deburring is repetitive, physically unpleasant work that manufacturers across developed markets can no longer reliably staff at any wage, and robotic cells grow at 9.9% against 6.6% for the market as a result. The business case has changed character rather than improved: buyers are replacing labour they cannot hire rather than labour they want to save money on. Payback calculations at around 19 months matter considerably less than they once did. Programming effort per part remains the practical barrier to robotic adoption. Offline programming from part models has reduced it. It has not removed it entirely.
Market Impact: Roughly 3% fail on edges
Electric Vehicle Components Make Edge Quality A Safety Matter

Battery busbars, cooling plates, and battery tray components fail dangerously when a burr punctures insulation or seeds a crack under vibration, which moves edge condition from a cosmetic question into a safety-critical one. That has pulled deburring specification upstream into design review at some manufacturers for the first time. Volumes are high and tolerances tight, which suits automated cells rather than the hand finishing these parts would previously have received. Deburring has moved into design review at some manufacturers for the first time as a result. That has never happened before in this industry.
Market Impact: Aftermarket is 31% of revenue

Market Opportunities and Growth Drivers

Burr-Related Rejects Cost More Than The Machines

Around 3% of precision machined parts fail inspection on edge condition alone, and in hydraulic, aerospace, and medical applications a burr that escapes inspection causes a field failure whose cost dwarfs any finishing equipment. Manufacturers reaching that conclusion buy machines to remove variability rather than labour. That argument works in exactly the industries where parts are most valuable, which is where machine builders find their best margins. Manufacturers reaching that conclusion buy machines to remove variability rather than to save wages. The two arguments reach different buyers. Only one of them reaches the good margins.
Market Impact: Trials take about 6 weeks

Aftermarket Media And Consumables Sustain Builder Revenue

Abrasive media, brushes, belts, and compounds account for roughly 31% of builder revenue and recur for the machine's whole operating life, which turns a capital sale into an annuity. Customers rarely switch media supplier once a process is validated, since changing consumables means revalidating the edge result that took six weeks to establish. That makes the installed base considerably more valuable than the machine margin alone suggests. Installed base size therefore matters considerably more than any single year of order intake does. Builders rarely measure the business that way. Third-party media suppliers do.
Market Impact: Payback runs about 19 months

Market Restraints and Challenges

Part Specificity Prevents Any Standard Product Sale

Geometry, material, and burr condition differ on every component, and the root cause is that burrs are a by-product of an upstream process nobody optimised for downstream removal. Commercial impact is that machines cannot be sold from a catalogue, trials run roughly six weeks, and sales cycles stretch accordingly. Mitigation runs through application libraries built from previous trials, modular machine platforms configured per application, and remote trial services that shorten the customer's evaluation. None of those removes the trial itself, since the customer still needs to see its own part finished. Nothing substitutes for that demonstration.
Market Impact: Robotic cells grow at 9.9%

Secondary Capital Status Delays Every Purchase

Deburring equipment is bought after the machining or stamping investment that created the burr, and the root cause is that nobody budgets for an operation they did not plan on needing. Commercial impact is that purchases defer whenever primary capital defers, and manufacturers run manual finishing far longer than any payback calculation justifies. Mitigation runs through selling into the machine tool specification process, leasing structures, and quantifying reject cost rather than labour savings. Manufacturers run manual finishing far longer than any payback calculation would justify as a result. The budget was spent upstream.
Market Impact: Burr rejects run near 3%
3 additional market trends, 4 additional growth drivers, and 2 additional restraints and challenges are covered in the full report. Contact sales@marketmindsadvisory.com to access the complete intelligence.

Segment CAGR and Growth Architecture

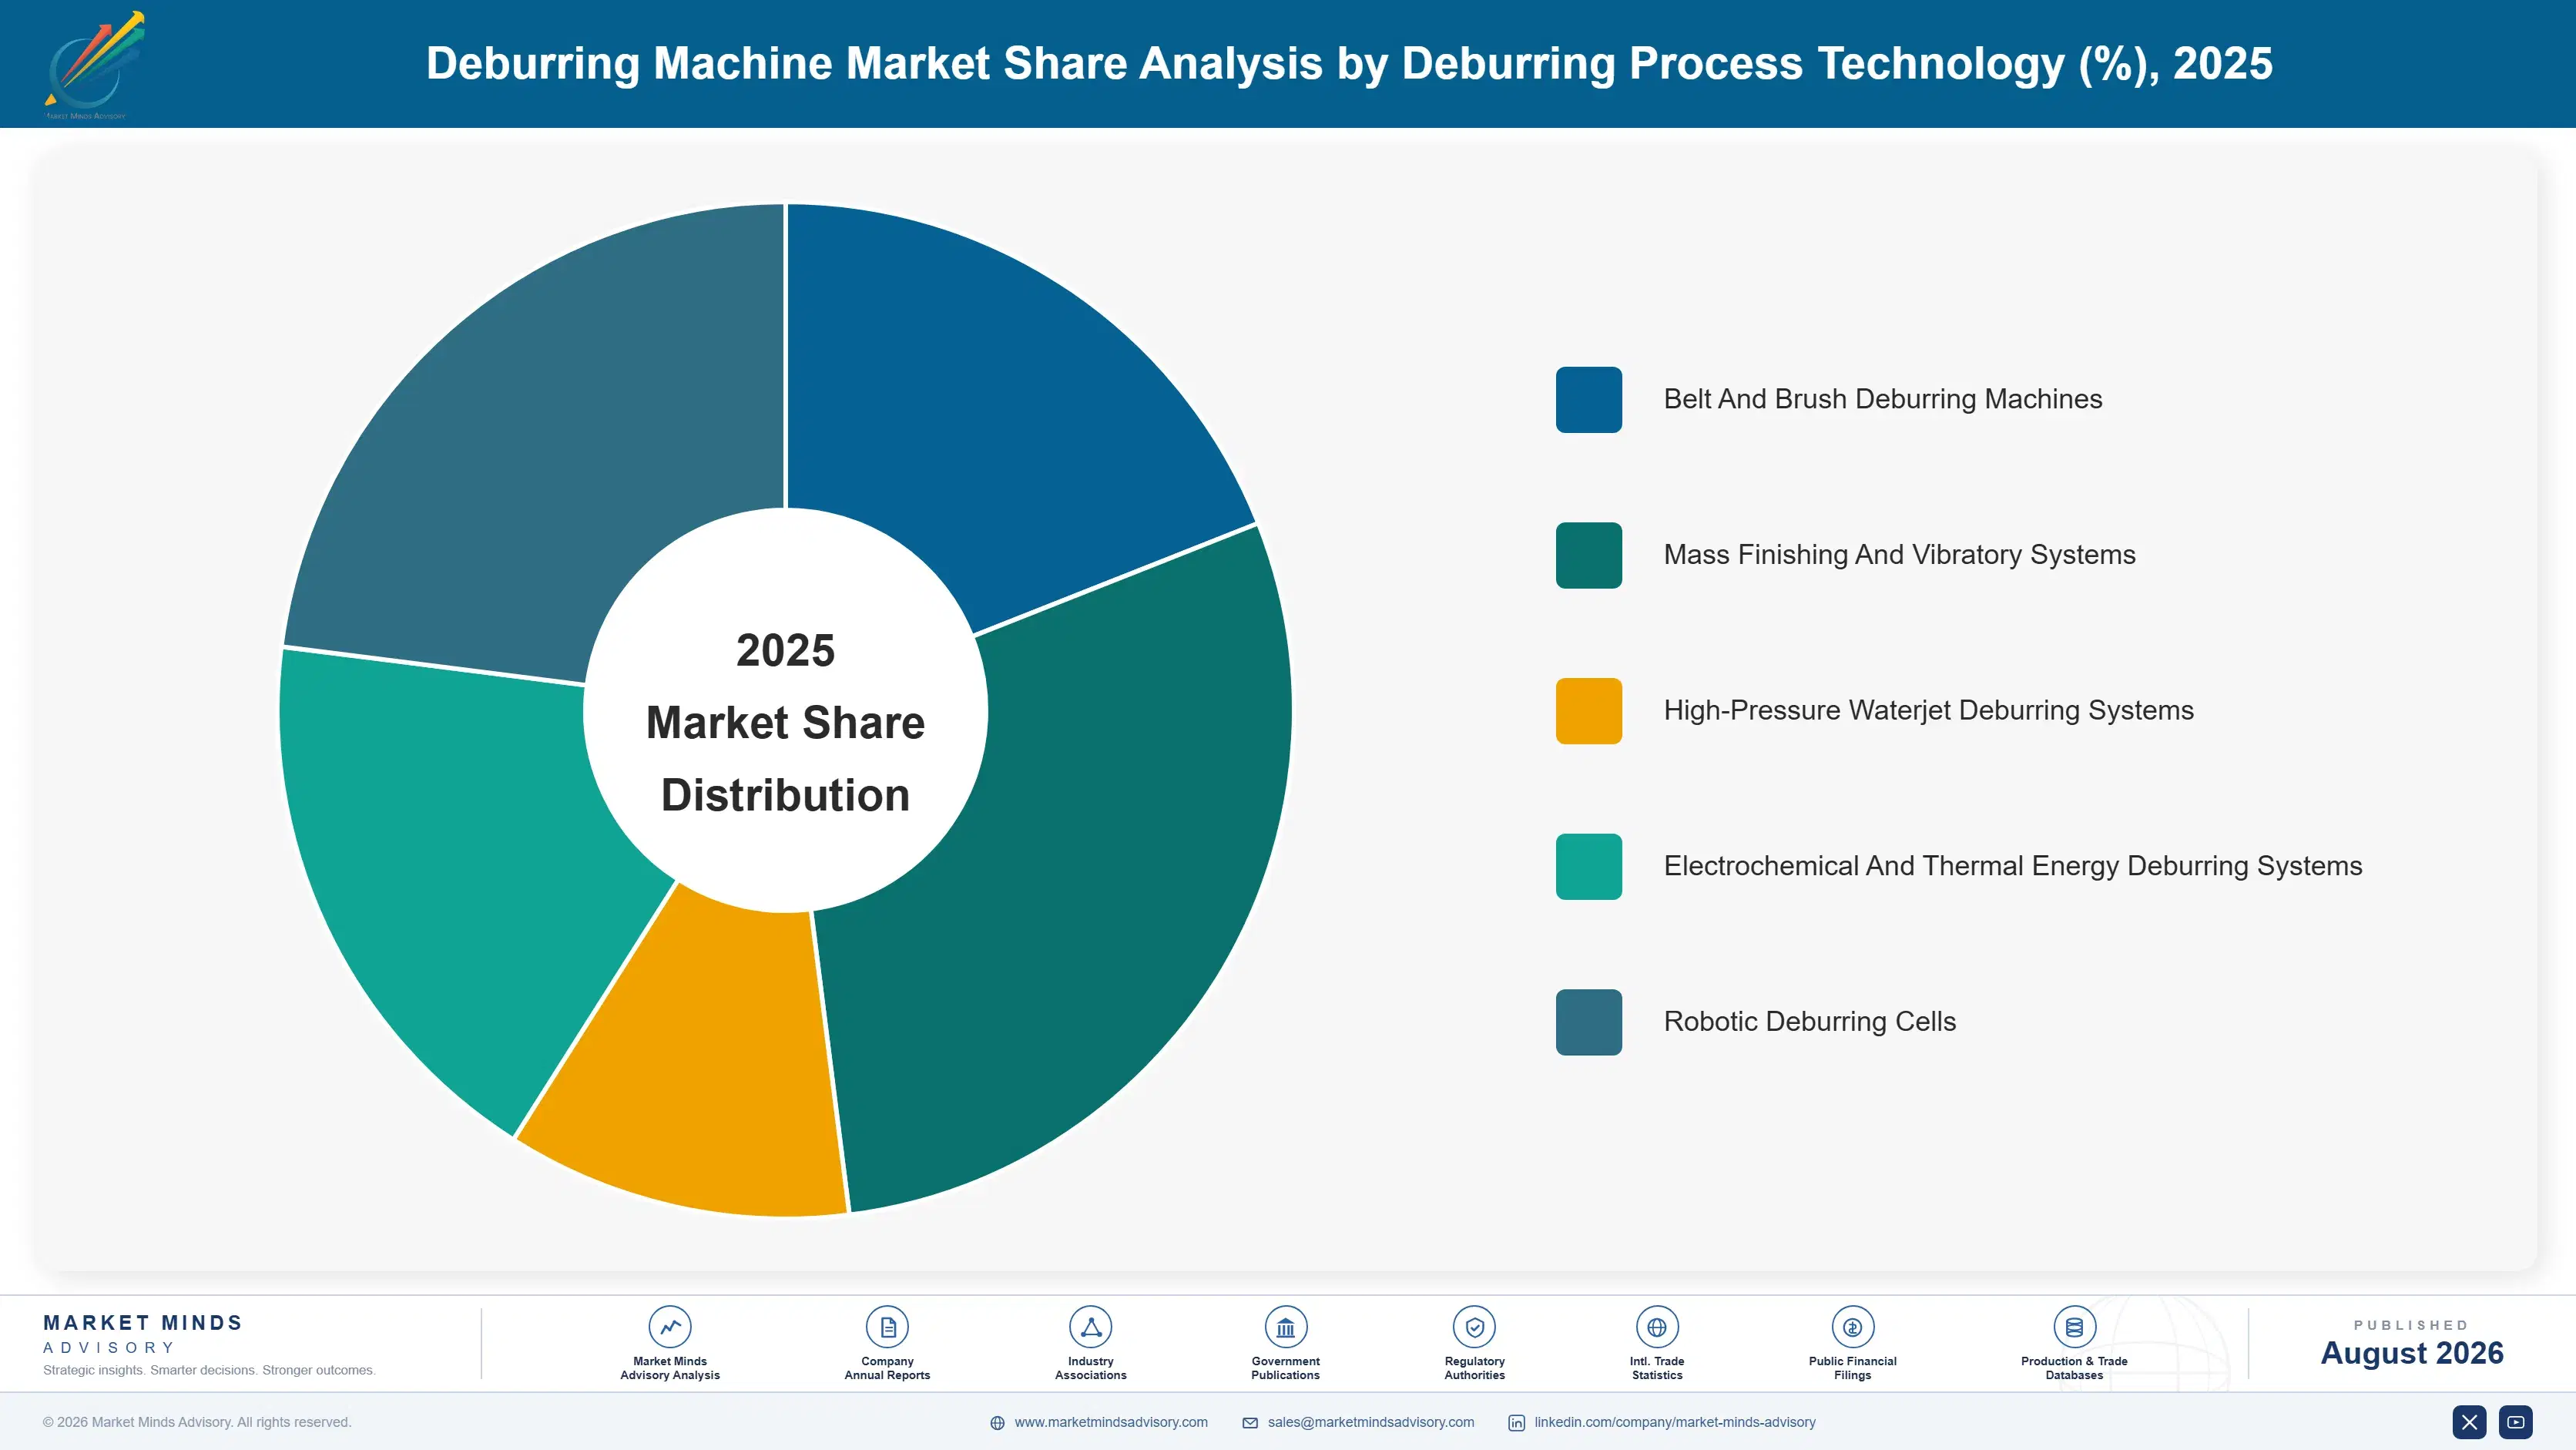
Segmentation follows the deburring process technology, because that determines which part geometries and burr conditions a machine can address, its cycle time, its consumable requirement, and the capital involved. Part material and end-use industry both cut across every process rather than separating them, which makes either a weaker primary dimension here. Process is what the trial actually proves.
deburring-machine-market-market-share-analysis-1787302385474

Robotic Deburring Cells

The fastest process at 9.9%, exactly 1.50 times the market rate, using force-compliant tooling on a robot arm to follow contoured edges that fixed machines cannot reach. Growth comes from labour scarcity rather than from cost advantage, since a hand file remains cheaper on low volumes and always will be. Programming effort per part is the practical barrier, and offline programming from part models has reduced it considerably without eliminating it. Cell prices remain out of reach for most small job shops, which is where the majority of burred parts are actually produced. Robot integrators without any deburring heritage have begun winning this work on automation capability alone. Traditional finishing builders find that uncomfortable.
CAGR 9.9%

Electrochemical And Thermal Energy Deburring Systems

Second fastest at 8.1%, reaching internal passages, cross-drilled intersections, and cavities that no mechanical process can physically touch. Hydraulic manifolds, fuel system components, and medical devices carry most of the volume, and for many of those parts there is no alternative process at any price. Capital and operating costs are high, cycle times are short, and the consumable and safety requirements are considerable. Application specificity is at its most extreme here, which is why trials are mandatory and sales cycles run longest in this segment. Customers here are buying a capability rather than comparing options, since no mechanical process reaches a cross-drilled intersection. Price sensitivity is correspondingly low. Very few builders serve the segment at all.
CAGR 8.1%
Full segment breakdown across 5 segments available in the complete report.

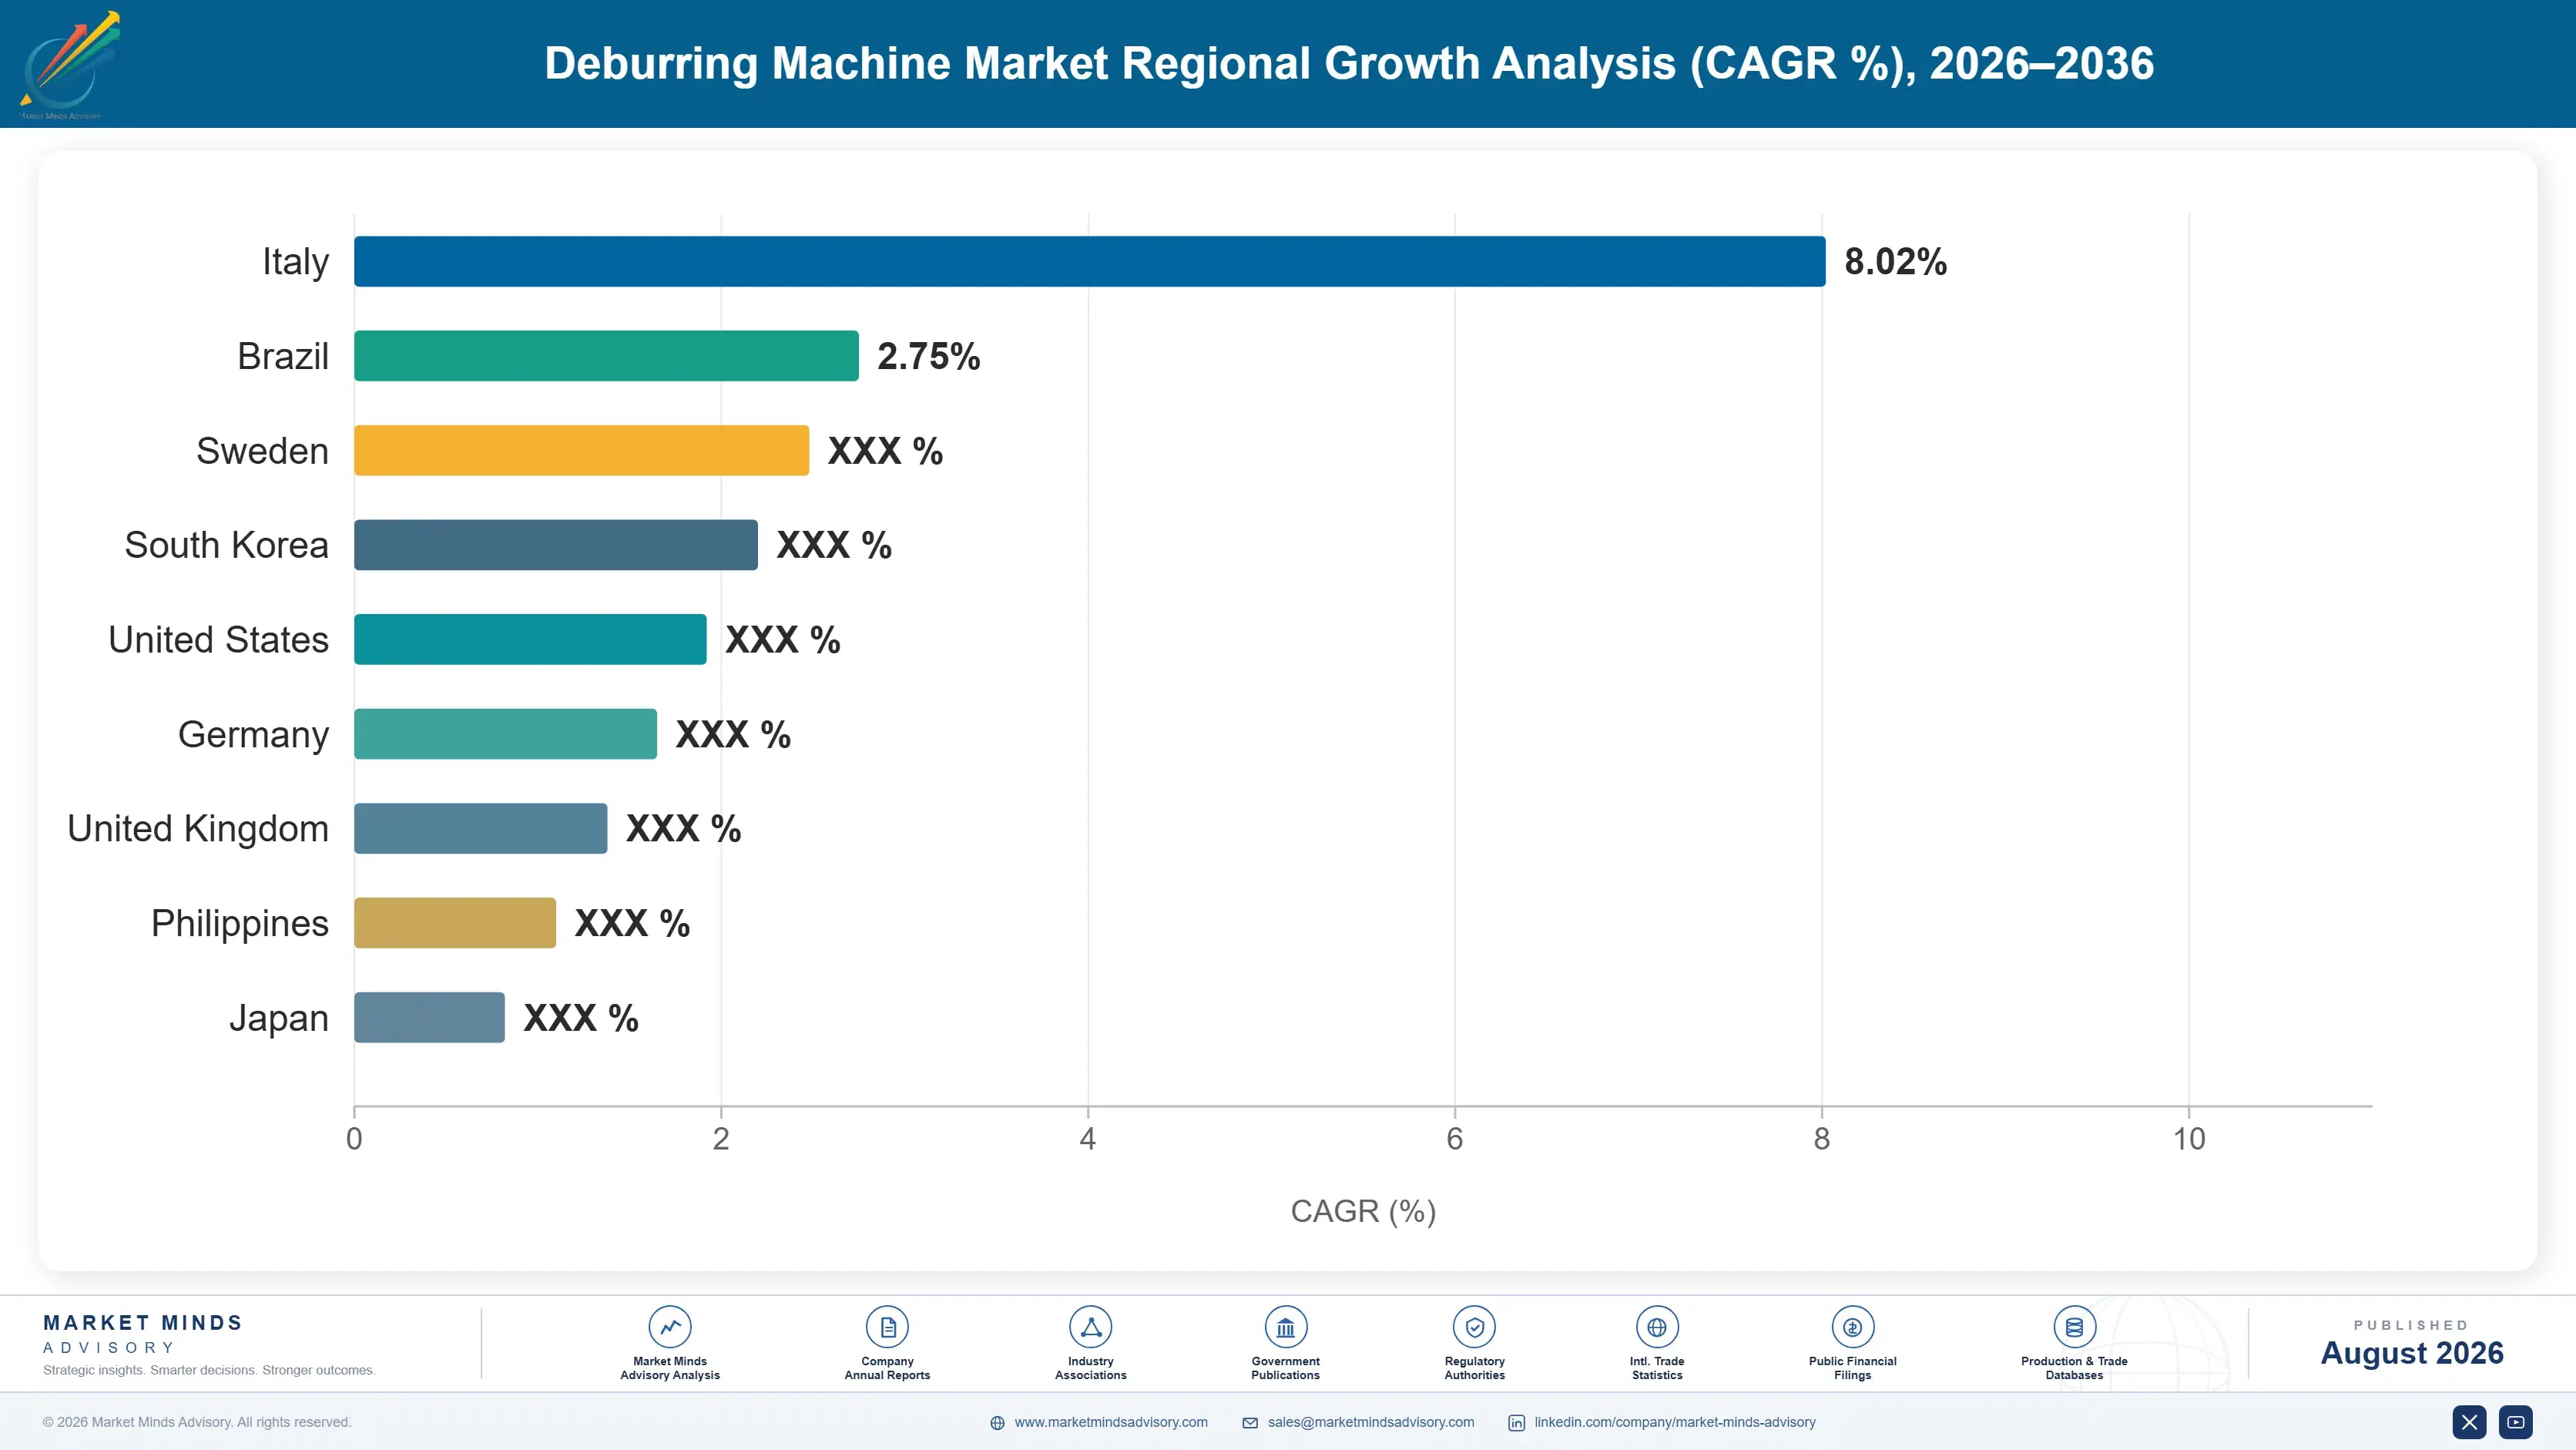
Regional Architecture and Country Demand Map

East Asia leads at 36%, above band, because Chinese, Japanese, and Korean precision machining and stamping bases produce more burred parts than anywhere else. Western Europe follows on builder concentration. India grows fastest. Four regional shares sit outside their framework bands. Machining base geography explains all four of them.

East Asia

Thirty-six percent, above the framework band, and justified because Chinese, Japanese, and Korean precision machining, stamping, and die casting capacity produces more burred parts than any other concentration in the world. Japanese builders hold the technically demanding processes while Chinese builders serve volume applications at prices European machines cannot approach. Labour scarcity is arriving here later than in Europe but arriving nonetheless. Growth at 7.5% runs above the market rate on electric vehicle component production expanding quickly across the region. Application libraries here reflect the regional part mix rather than European geometries, which is why imported machines frequently need fresh trials anyway. Local builders quote considerably faster as a result.
Share: 36% | CAGR: 7.5% (2026 to 2036)

Western Europe

Twenty-two percent, and the region contains more established deburring machine builders than anywhere else, which makes its commercial weight larger than its share of parts produced. German, Italian, and Dutch builders hold application libraries accumulated over decades of trials for regional machining customers. Labour scarcity in hand finishing arrived here first and has driven automation further than elsewhere. Growth at 5.0% is the slowest of any region, reflecting flat manufacturing output rather than any reluctance to automate. Consumable and media annuities are best captured here, since builders integrated media supply into machine sales decades before competitors elsewhere considered it. That revenue is the steadiest in the industry. Customers almost never switch it.
Share: 22% | CAGR: 5.0% (2026 to 2036)
Regional intelligence for 5 additional markets available in the complete report: North America, South Asia and Pacific, Eastern Europe, Latin America, Middle East and Africa. Contact sales@marketmindsadvisory.com.
deburring-machine-market-country-cagr-analysis-1787302386009

Trials, Libraries And Media Annuities

Manual work is still 22% of finishing hours, trials run six weeks, payback sits near 19 months, and aftermarket carries 31% of revenue. Value comes from application libraries, from consumable annuities, and from reaching customers before the machining investment is made. Machine specification decides least of all. Trial results decide the rest of it.

Treat The Application Library As The Core Asset

Every part is different, trials run roughly six weeks, and a builder that has already proven a process on a similar component quotes faster and wins more often than one starting from nothing. That library is built from thousands of previous trials and cannot be bought or accelerated. Concentration at 26% exists because those libraries are regional and reflect the machining base around each builder rather than any capital constraint. Builders who never codified their trial history repeat the same engineering work indefinitely without noticing. Application engineering runs near 19% of builder cost.
Market Impact: Trials take roughly 6 weeks for eac

Sell Reject Cost Rather Than Labour Displacement

Around 3% of precision machined parts fail on edge condition, and in hydraulic, aerospace, and medical work a burr that escapes inspection causes a field failure costing far more than the machine. Payback calculations at 19 months against manual labour are the weaker argument and the one most builders lead with. Buyers in high-value applications respond to variability elimination, and they are the buyers with the best margins available. A field failure in a hydraulic or aerospace component costs many times what the machine did. Buyers in those industries respond to that argument immediately.
Market Impact: Edge rejects run near 3% of all par

Build Consumable Annuities Into Every Installation

Media, brushes, belts, and compounds carry roughly 31% of builder revenue and recur for the machine's operating life, because changing consumables means revalidating an edge result that took six weeks to establish. Customers therefore rarely switch. Builders treating consumables as a low-margin obligation rather than the annuity they are leave the most predictable revenue in this business to third-party media suppliers who did nothing to earn it. Installed base size therefore matters more than order intake in any given year of trading. Media revenue recurs without any selling activity at all.
Market Impact: Consumables carry 31% of all the bu

Reach Customers During Machine Tool Specification

Deburring is bought after the machining investment that created the burr, which means every purchase competes against a budget already spent and defers whenever primary capital does. Builders present during machine tool specification can size the finishing requirement into the original capital case rather than fighting for a supplementary one later. Very few do this, and the ones that do face a considerably shorter sales cycle than the six week trial suggests. Manual finishing still absorbs roughly 22% of part finishing hours across most machining operations. That is the volume nobody has budgeted to remove.
Market Impact: Manual work is 22% of all finishing

Who Controls the Margin Pool

Concentration is very low at 26% across the top five measured on machine revenue, and part specificity rather than any absence of consolidation explains it. A builder wins on demonstrated results for a customer's actual component, and its ability to demonstrate quickly depends on an application library reflecting the machining base around it. That asset is regional by nature, which is why national and global
Competitive activity runs on three fronts. Application library depth is the first and the least visible, since it determines quoting speed and win rate without appearing in any product comparison. Consumable annuity capture is the second, where the most predictable revenue in the business sits. And robotic cell capability is the third, which is where growth has moved and where traditional machine builders are weakest.

Pressure arrives from two directions. Robot integrators without any deburring heritage are building cells and competing on automation capability. And Chinese builders serve volume applications at prices European machines cannot approach. Rankings shift on application wins rather than on product launches. Neither pressure reaches electrochemical and thermal work, where capability rather than price decides and very few builders can compete at all. That tier behaves as a separate market.
deburring-machine-market-company-positioning-matrix-1787302386532

Competitive Moat and Risk Dimensions

ROSLER OBERFLAECHENTECHNIK

Moat: Application library and media integration

Decades of mass finishing trials across an enormous range of components give quoting speed and process confidence that a competitor cannot assemble without the same history. Media supply integrated with the machines captures the consumable annuity that customers will not switch once a process is validated. Both advantages compound with every installation rather than with capital investment.
ROSLER OBERFLAECHENTECHNIK

Risk: Robotic cells outside core heritage

Robotic deburring grows at 9.9% and requires programming, force control, and integration capability that mass finishing heritage does not supply. Robot integrators entering from automation are competing there without any deburring library, and winning some of it. Growth in the fastest segment favours a skill set traditional finishing builders have to acquire rather than extend.
TIMESAVERS

Moat: Sheet metal edge processing depth

Deep specialisation in flat part edge rounding and deslagging after laser and plasma cutting gives a defensible position in a high-volume application where results are consistent and trials are shorter than elsewhere. Fabrication customers buy repeatedly as capacity expands. The narrower application focus makes the library denser rather than broader, which works well within it.
TIMESAVERS

Risk: Narrow application base exposure

A position concentrated in flat sheet metal parts participates little in the machined component work where electrochemical and robotic processes are growing fastest. Fabrication capital cycles also move together, which concentrates demand risk rather than spreading it. Broadening the library into three-dimensional machined parts means starting the trial history largely from the beginning.

Players Tracked

Prominent Players

Rosler Oberflaechentechnik
Timesavers
LISSMAC Maschinenbau
Costa Levigatrici
Walther Trowal

Other Key Players

Loeser
Q-Fin Quality Finishing Machines
ARKU Maschinenbau
Grind Master Machines
Extrude Hone
Fladder Danmark
Bel Air Finishing
Giant Finishing
Kuhlmeyer Maschinenbau
Sugino Machine
Tipton
Sinto Group
PFERD
Boeck
Rump Strahlanlagen

Recent Developments

FEBRUARY 2025

Builder opens regional application trial laboratory

A deburring machine builder opened a trial laboratory in a growing regional machining cluster, having previously required customers to ship parts across a continent for process demonstration. The investment was organic facility construction rather than any acquisition, joint venture, or partnership arrangement with a local distributor. Parts had
Signal: Trial proximity shortens the sales cycles
MAY 2025

Battery manufacturer specifies deburring at design review

An electric vehicle battery manufacturer added edge condition requirements to component design review after burr-related insulation failures were traced during qualification testing on busbar assemblies. The change was an internal engineering standard rather than any regulatory requirement or supplier arrangement. Qualification testing had exposed the failures.
Signal: Edge quality is moving upstream into desig
SEPTEMBER 2025

Robot integrator wins deburring cell without finishing heritage

An industrial robot integrator secured a multi-cell deburring installation at a machining customer, competing successfully against established finishing machine builders on programming and integration capability rather than on process knowledge. The award was a competitive tender outcome rather than any partnership or acquisition. No deburring heritage was involved.
Signal: Automation capability is now beginning to

Steel, Drives and Application Engineering

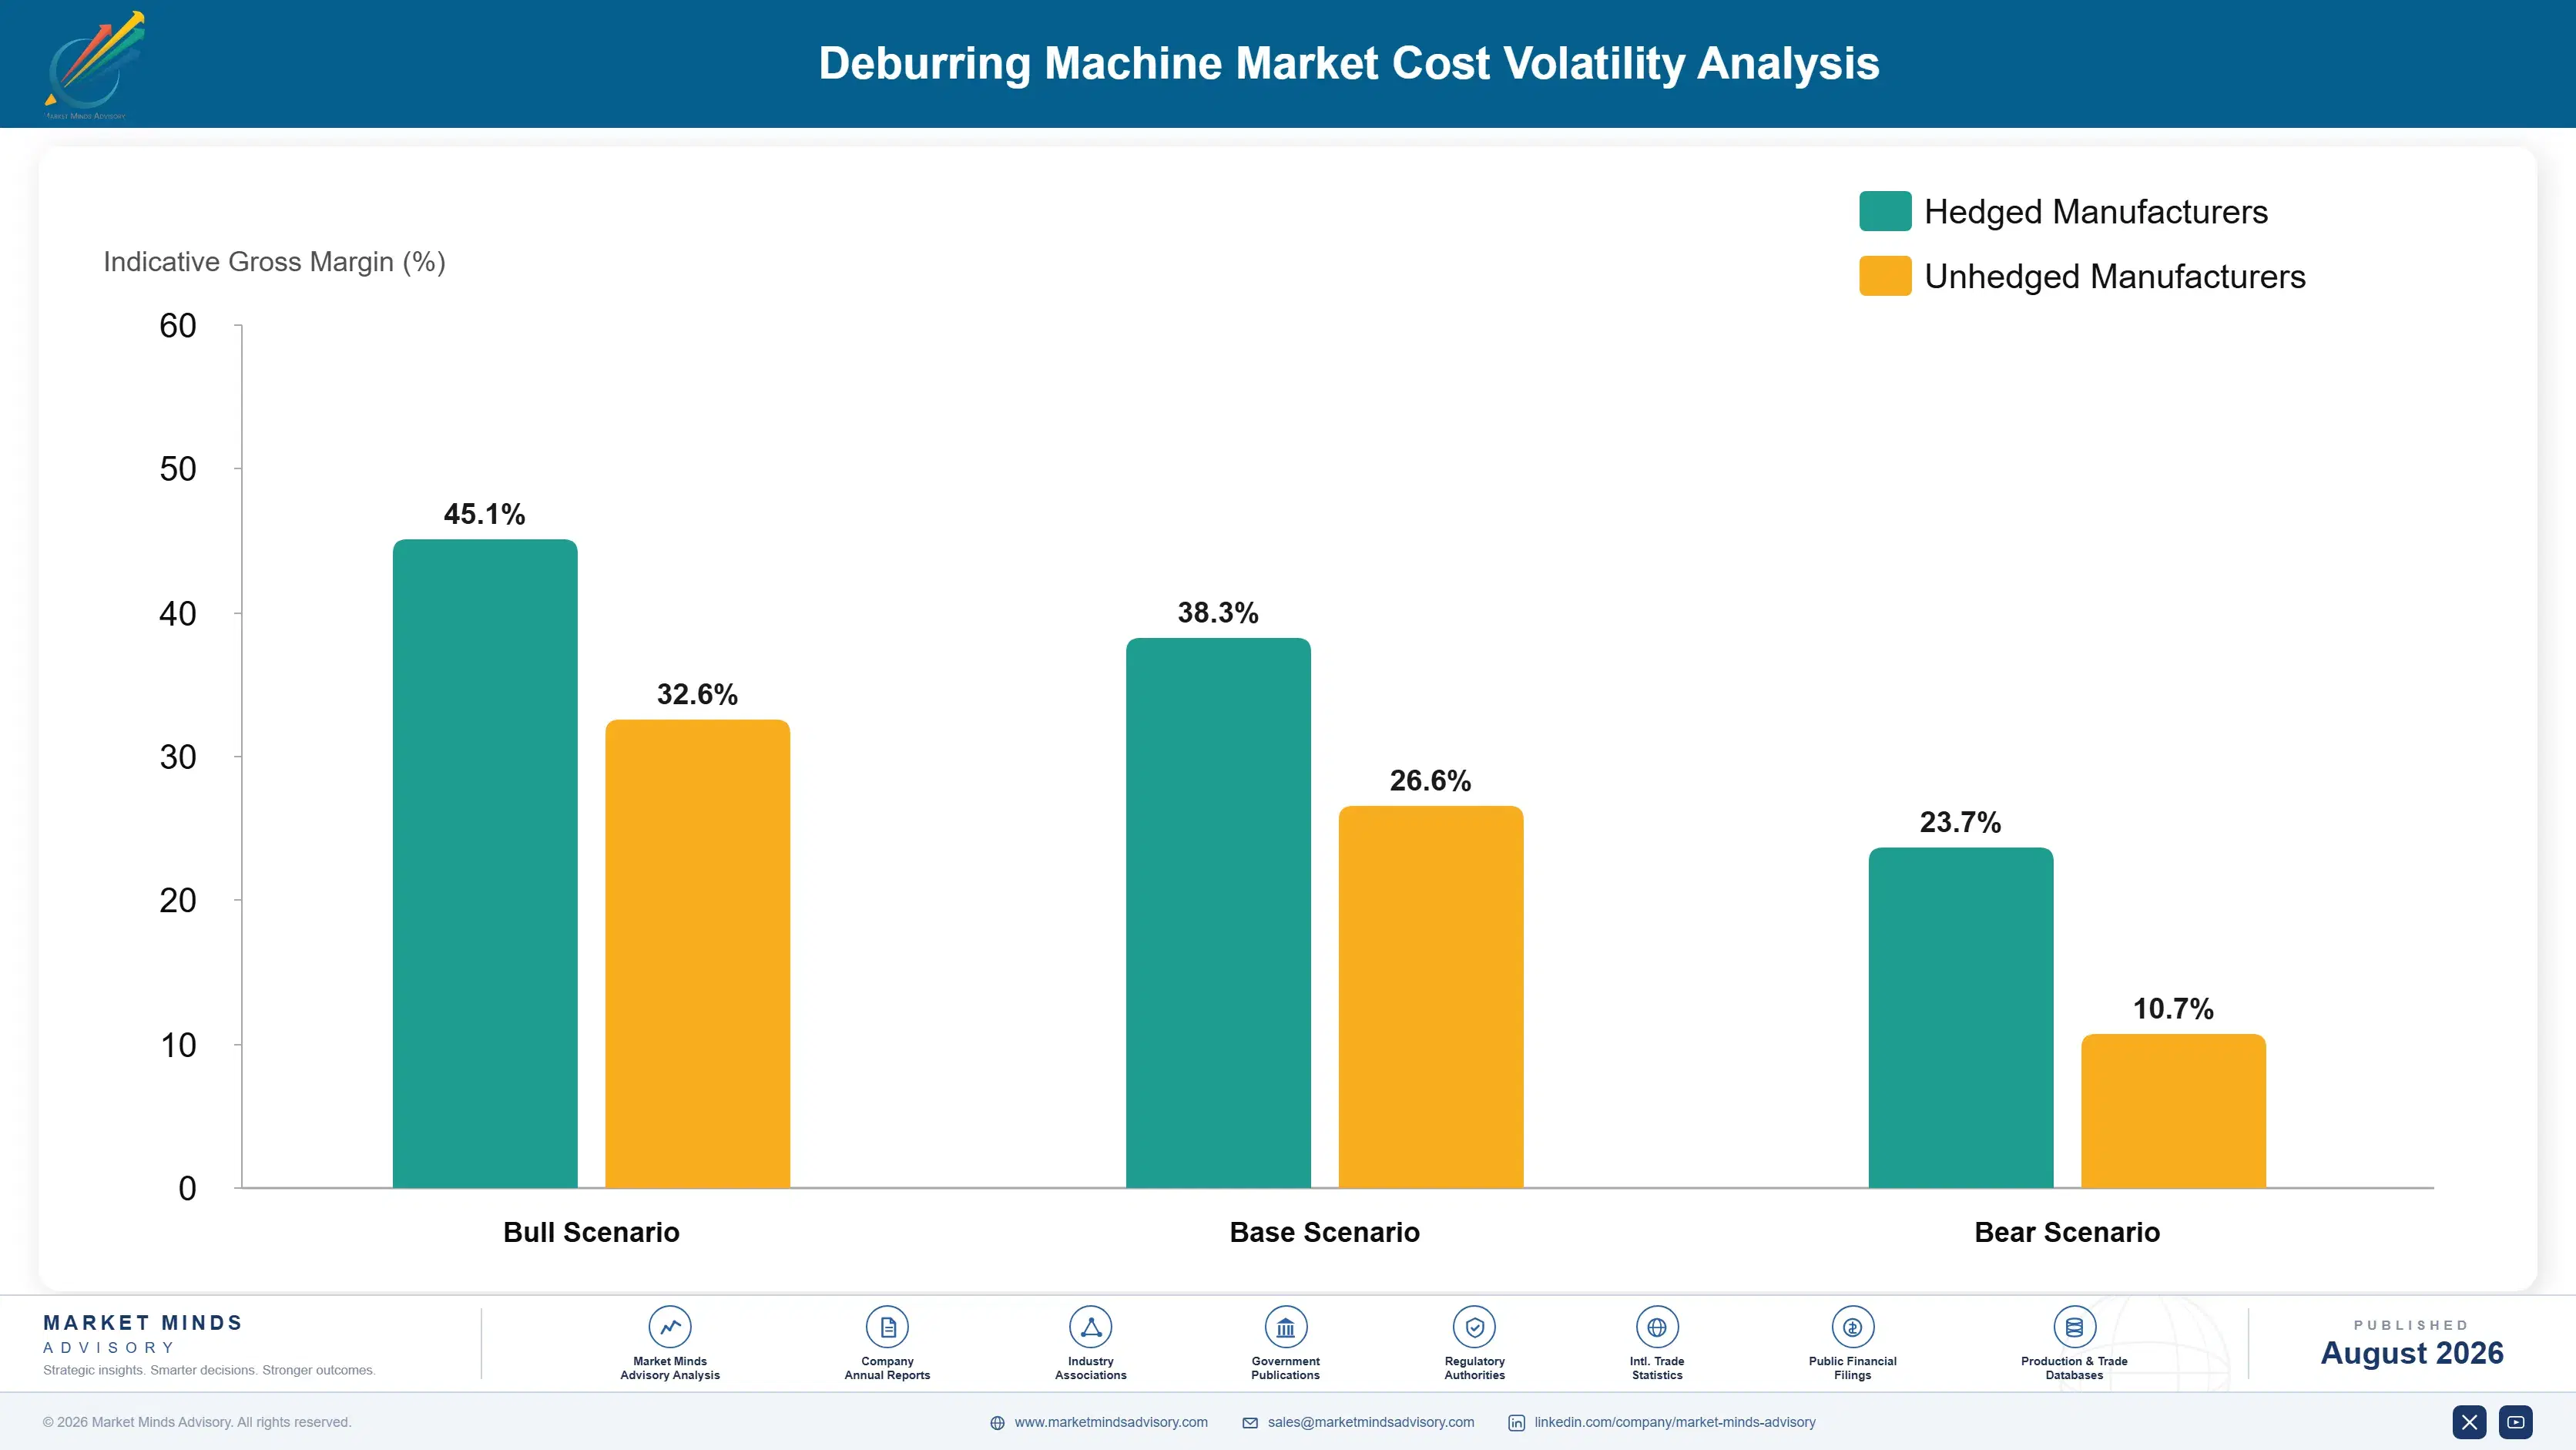
Builder cost divides between fabricated steel structure and machined components at roughly 27%, drives, motors, controls, and automation hardware near 24%, application engineering and trial laboratory operation around 19%, assembly and commissioning labour about 17%, and warranty, freight, and overhead the balance. Application engineering is the distinctive line here and has no real equivalent in standard machinery, where a product is designed once and sold repeatedly.
Steel and drive component costs both rose sharply through 2021 and 2022 as material pricing and semiconductor availability tightened together, and several machinery builders disclosed input cost increases and extended lead times in filings covering those years. Robot arm pricing moved separately and less sharply. Recovery was slow, since machines are quoted months before build and price escalation clauses are uncommon in this part of the industry.

The competitive disadvantage mechanism runs through application engineering load rather than through manufacturing cost. Steel and drives cost broadly the same for every builder, while a builder without a relevant application library spends far more engineering hours per quotation and wins a smaller share of them. That cost sits in overhead rather than in cost of goods, which is why it rarely gets measured properly.
deburring-machine-market-cost-volatility-analysis-1787302386727

Codify trial results into a searchable application library

Application engineering carries roughly 19% of builder cost and most of it is spent rediscovering processes the business has already proven on similar parts. A searchable library indexed by geometry, material, and burr condition converts that spend into a reusable asset. Builders who never codified their trial history repeat the same engineering work indefinitely without ever noticing the cost.

Standardise machine platforms and configure per application

Fabricated structure and drives carry over half of builder cost and bespoke machines multiply engineering, spares holding, and commissioning time on every order. Modular platforms configured for each application capture most of the flexibility at a fraction of the engineering load. The constraint is that genuinely unusual parts still need bespoke solutions, and those should be priced accordingly.

Quote with material escalation clauses on long lead builds

Steel, drives, and controls carry roughly half of builder cost and machines are quoted months before build begins, which leaves the builder carrying material movement across that window entirely. Escalation clauses referenced to published indices shift it to the customer. Customers resist them and accept them more readily when lead times are long and alternatives are scarce.

Portfolio Architecture for Margin Defence

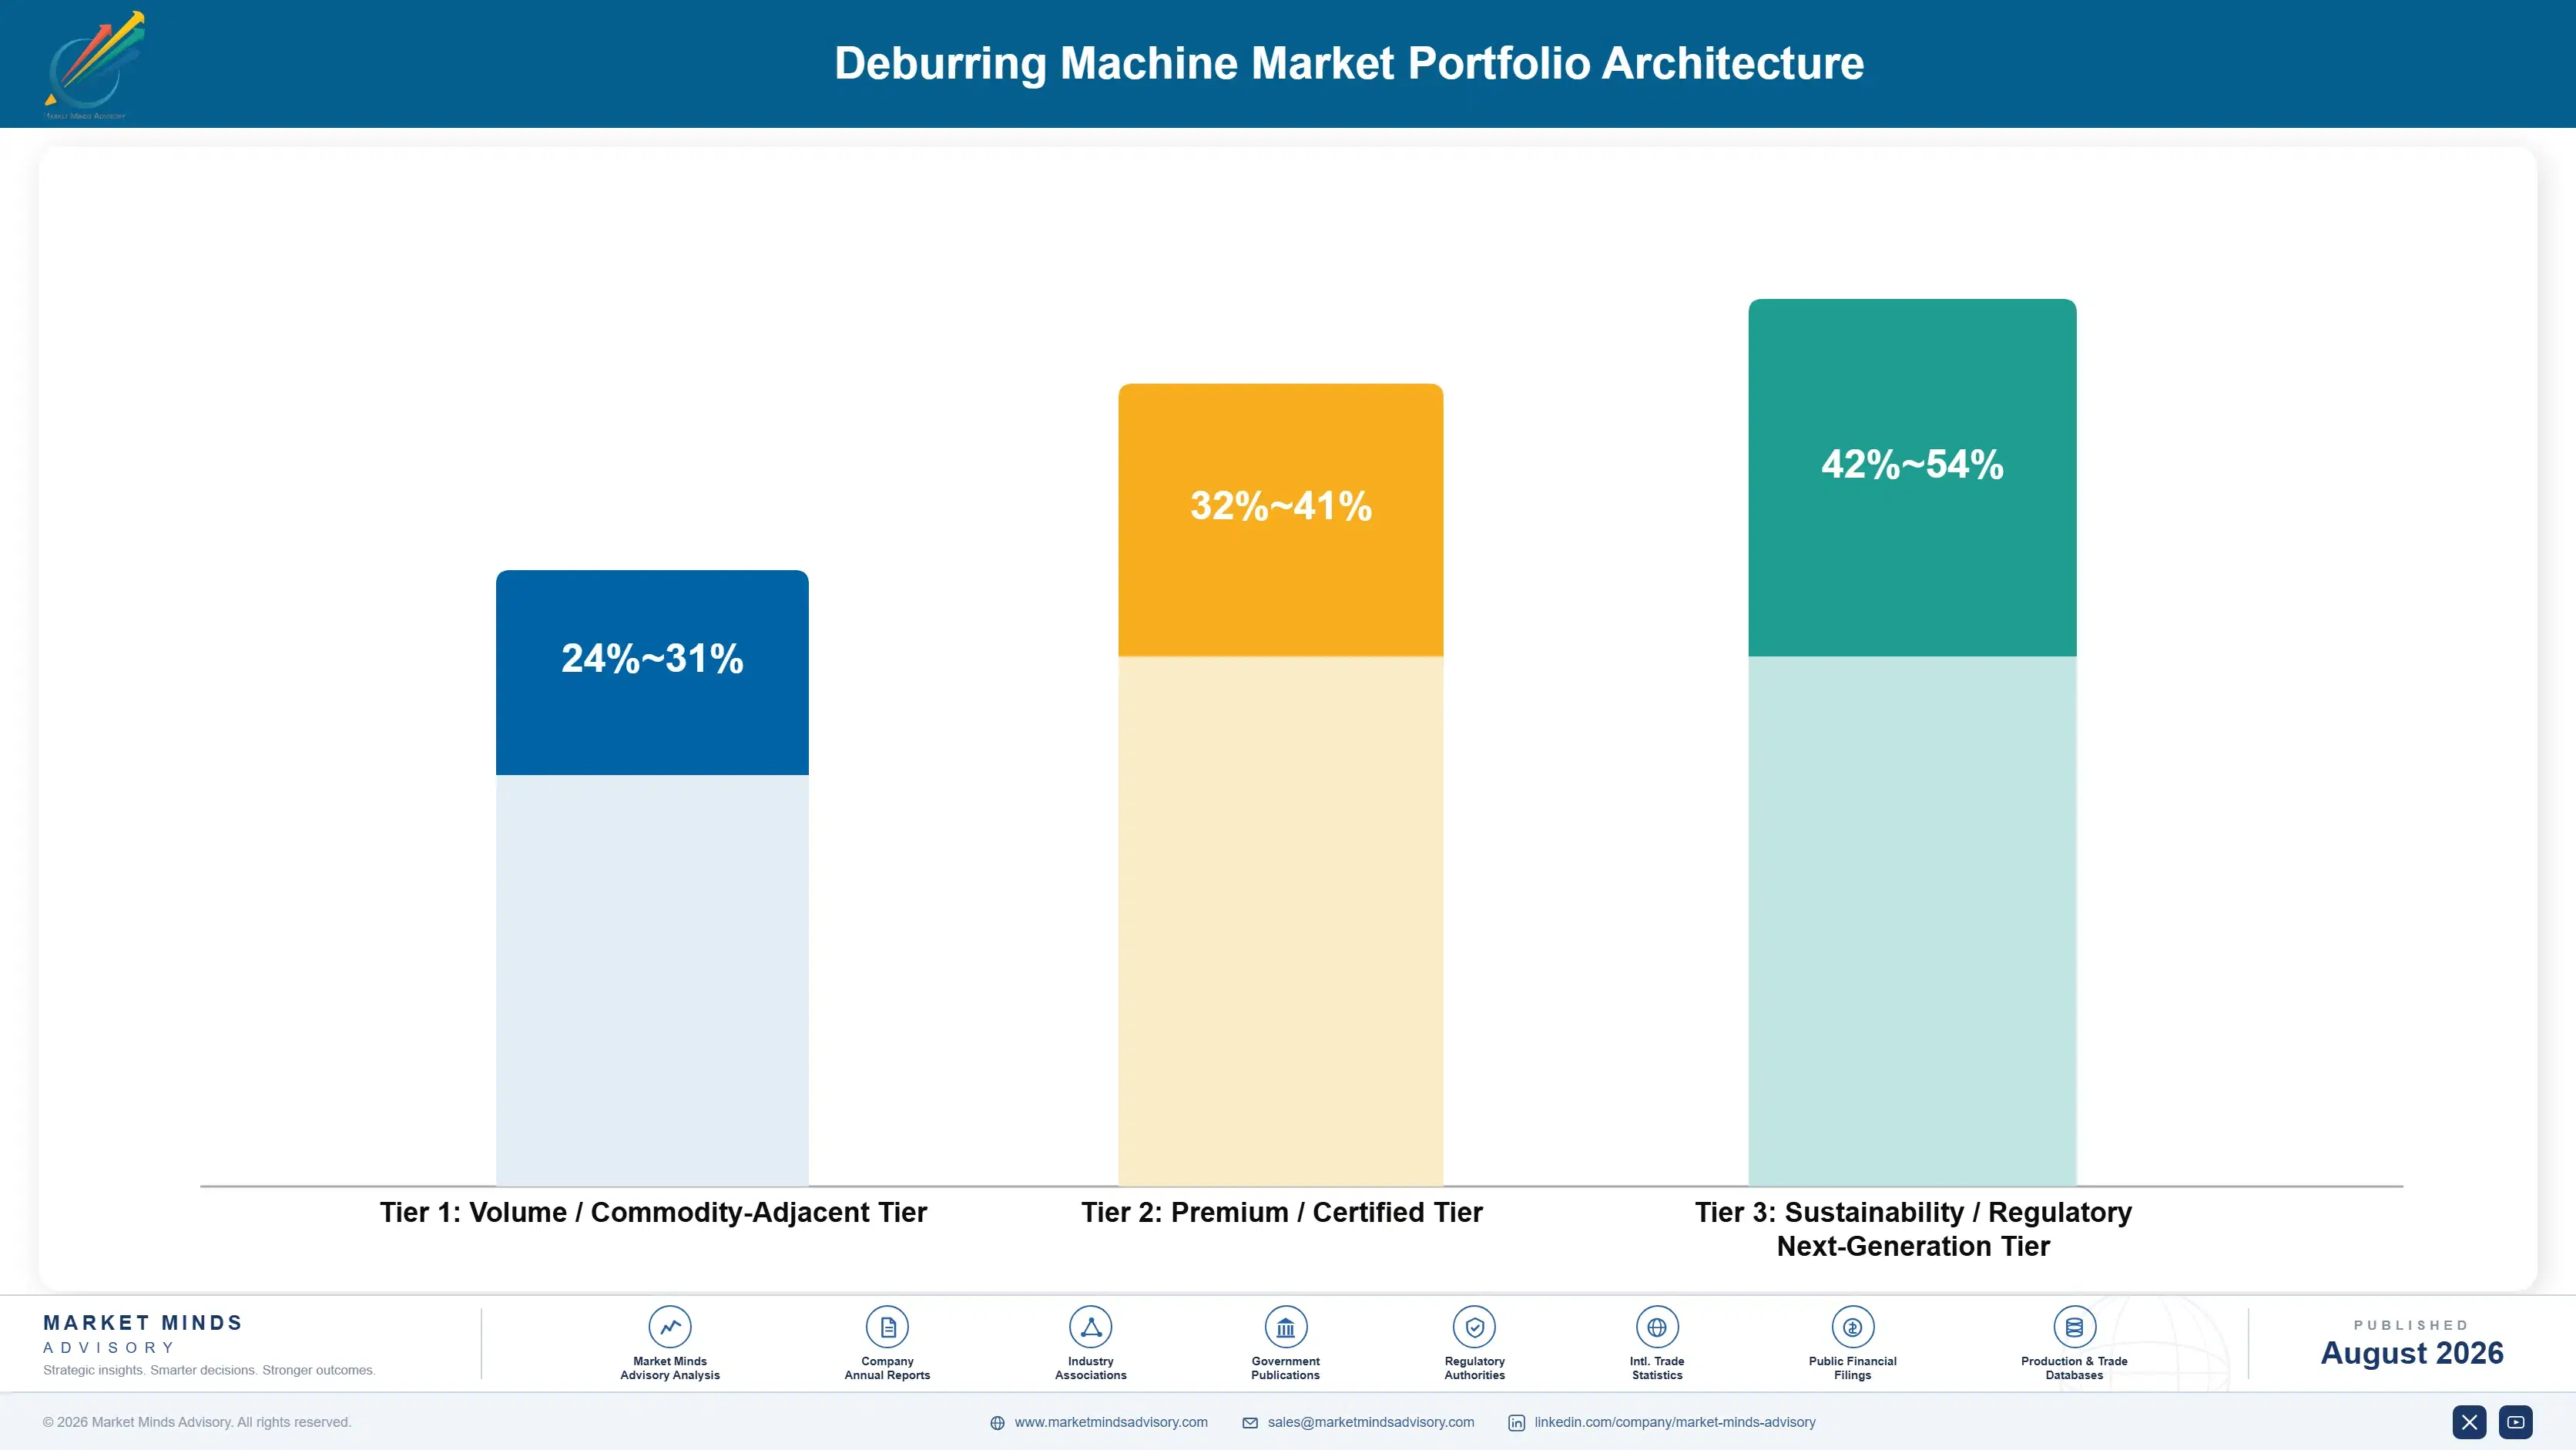
Three tiers describe this business and the spread follows application difficulty rather than machine size. Belt and brush machines for flat parts sit at the bottom, where results are predictable, trials are short, and regional builders compete on price. Mass finishing and waterjet systems occupy the middle. Electrochemical, thermal, and robotic cells sit at the top, where the part cannot be finished any other way or
The tension is that the bottom tier carries volume and the shortest sales cycles while offering the least defence, since any competent builder can quote a flat part machine from a drawing. A builder weighted there competes on price against Chinese equipment. One weighted toward electrochemical and robotic work carries long sales cycles, heavy application engineering, and revenue that arrives unevenly across quarters.

High-value pools concentrate where no alternative process exists. Electrochemical and thermal deburring of internal passages is the clearest case, since cross-drilled intersections in a hydraulic manifold cannot be reached mechanically at any price, and the customer is buying capability rather than comparing options. Robotic cells are the second such pool, where the customer cannot recruit the labour and no cheaper answer exists. Neither pool is decided on machine price.

Volume / Commodity-Adjacent Tier

Belt and brush machines for flat sheet and plate parts where results are predictable and trials are short. Any competent builder can quote from a drawing, and Chinese equipment competes hard on price.
Gross Margin: 24-31%

Premium / Certified Tier

Mass finishing systems and high-pressure waterjet deburring where media selection and process development genuinely differentiate builders. Consumable annuities are strongest here across the whole portfolio. Media selection drives the process outcome as much as the machine does.
Gross Margin: 32-41%

Sustainability / Regulatory / Next-Generation Tier

Electrochemical, thermal energy, and robotic deburring cells serving parts that cannot be finished any other way. Long sales cycles, heavy application engineering, and the best margin available anywhere. Revenue arrives unevenly across quarters.
Gross Margin: 42-54%
deburring-machine-market-portfolio-architecture-1787302387229

Trials, Installations and Media

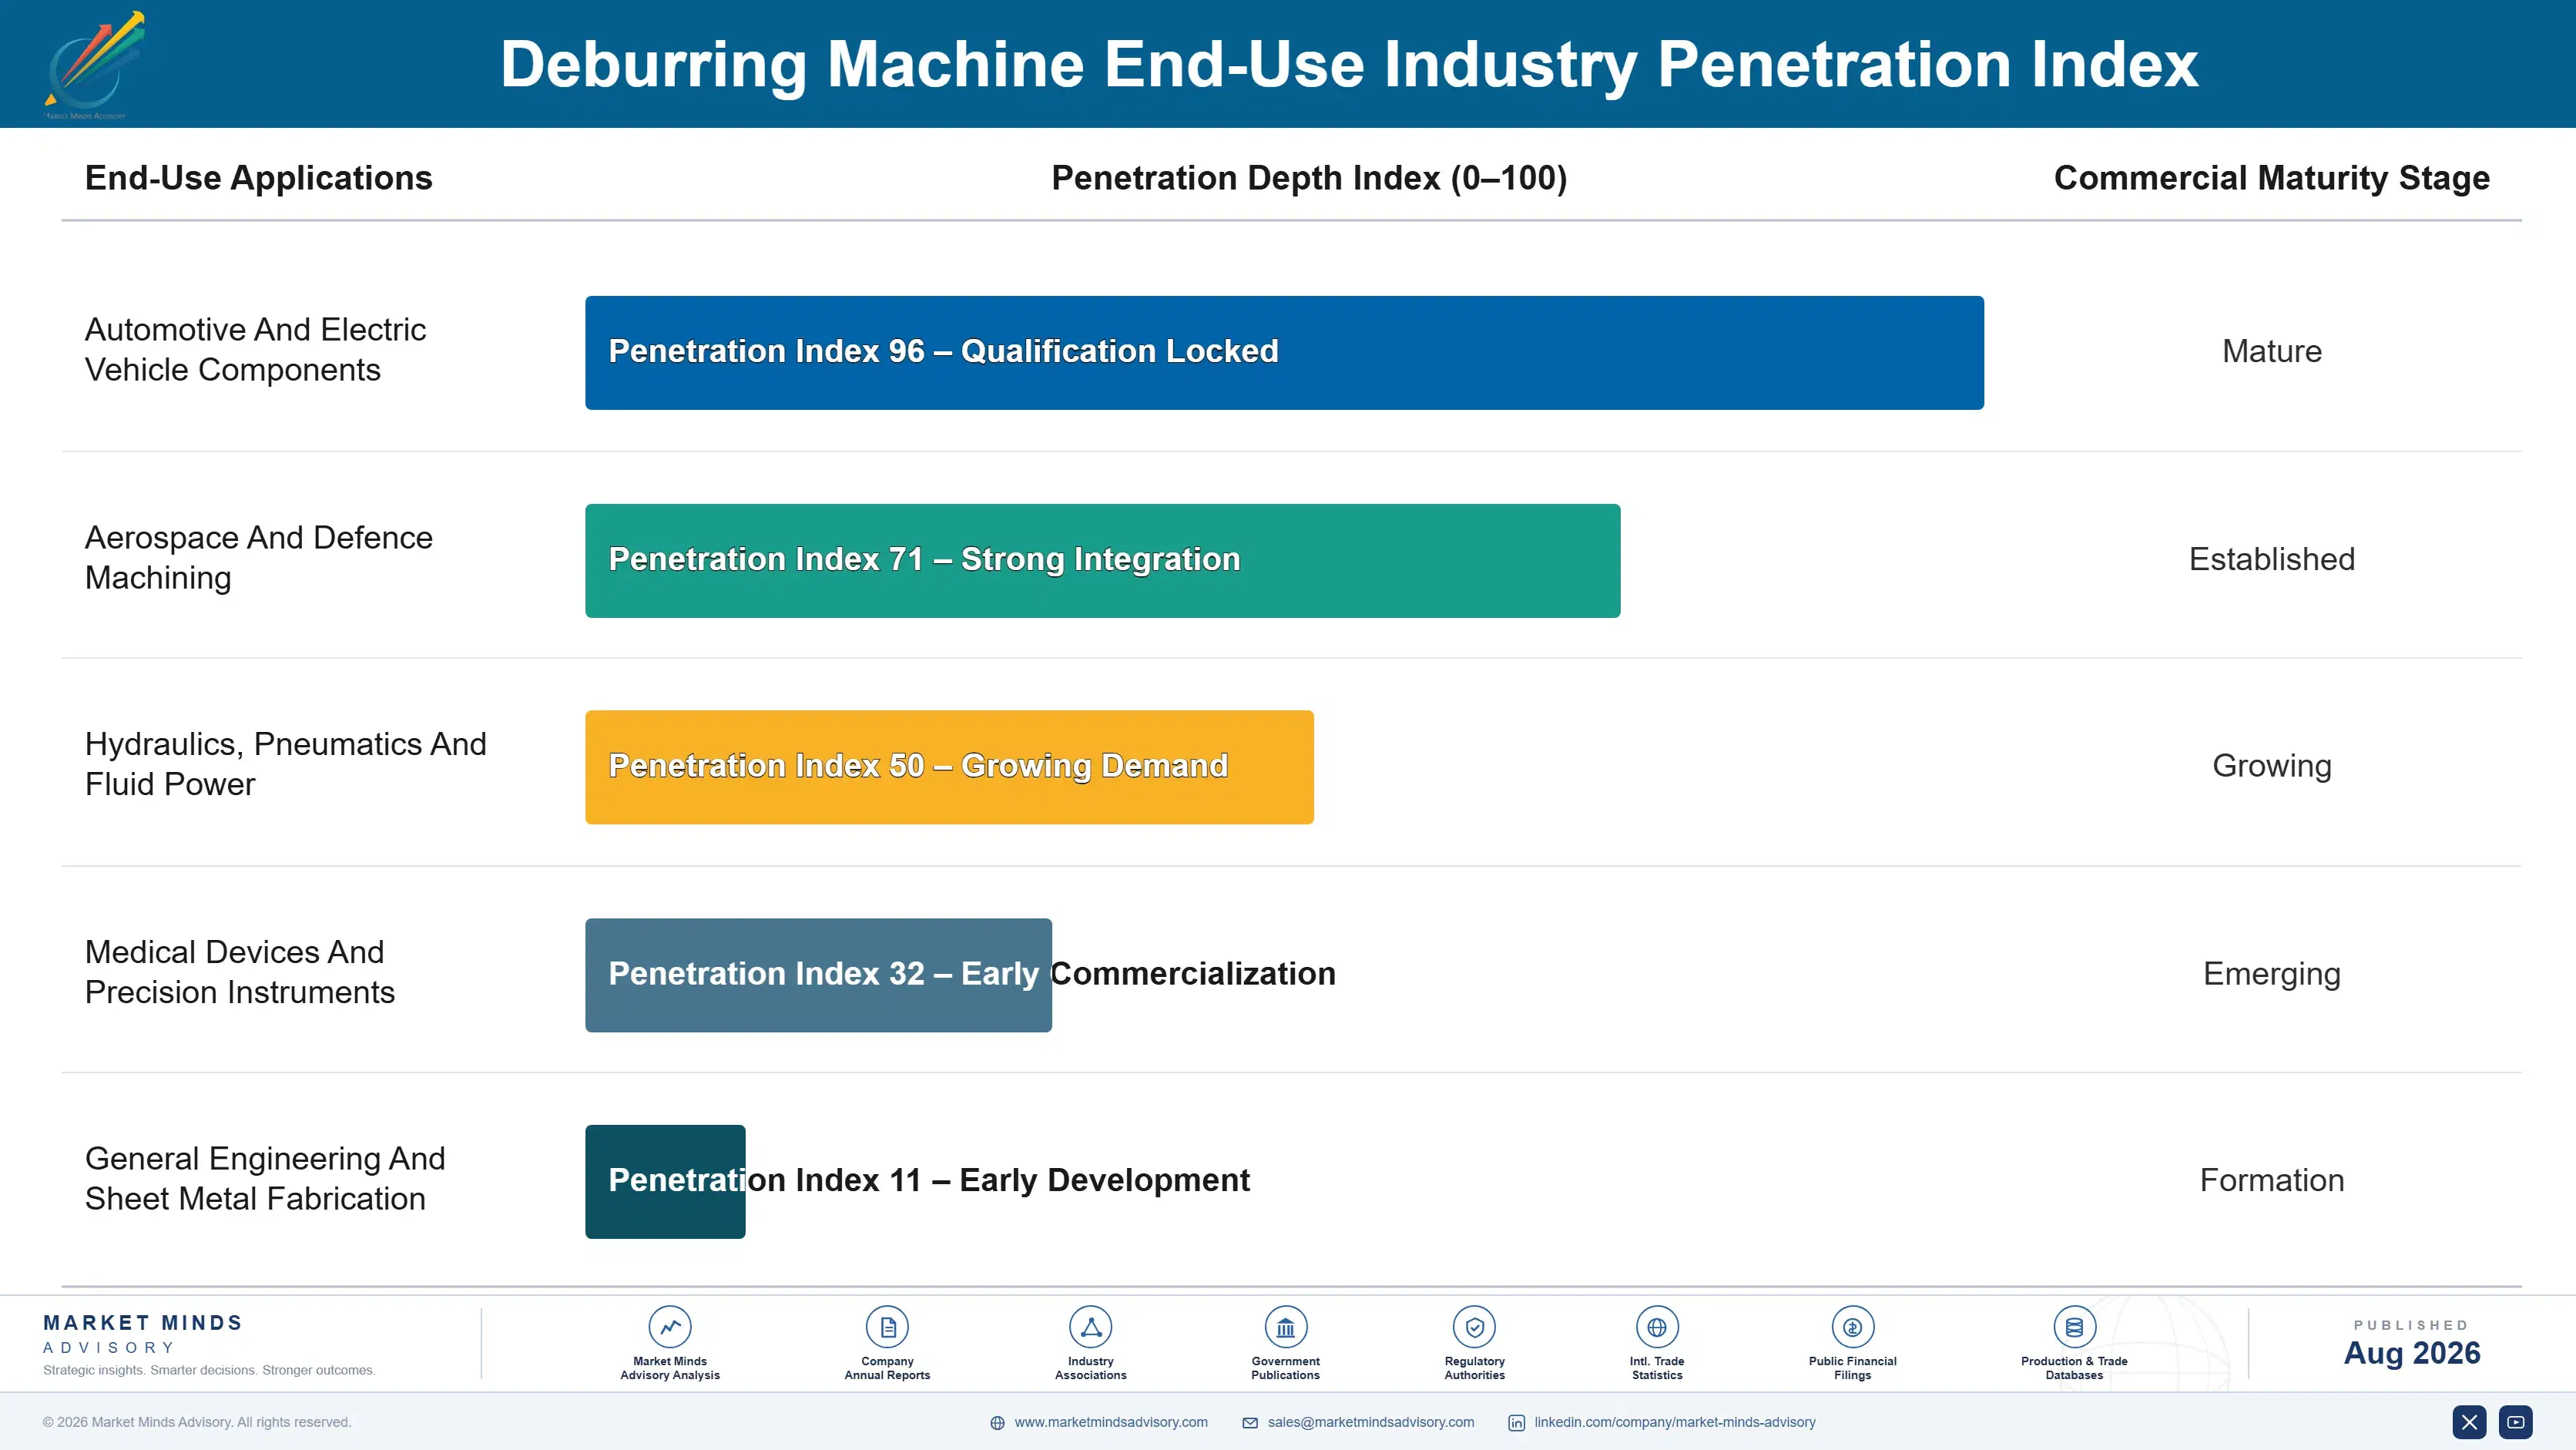
Revenue arrives as capital sales followed by a consumable annuity that lasts the machine's operating life, and the second part is more predictable than the first by a wide margin. Media, brushes, and compounds carry roughly 31% of builder revenue and recur without any selling activity, because changing them means revalidating an edge result nobody wants to revisit. Installed base size therefore matters more than any single year's order intake.
Stickiness runs through process validation rather than through equipment preference. A validated deburring process is documented in a quality system, referenced in customer approvals, and connected to a media specification, which makes changing any part of it an exercise nobody undertakes casually. Flat part machines stick least, since the process is simple enough to reproduce. Electrochemical installations stick most firmly of all.

Buyer profiles shifted as labour scarcity and edge quality requirements grew. The earlier buyer was a production manager comparing machine payback against hand finishing wages. The current conversation increasingly involves a plant manager who cannot recruit finishing staff at all, or a quality engineer responding to a customer specification that arrived from a design review upstream.
deburring-machine-market-end-use-penetration-index-1787302387728

What We Would Tell a Board

These are among the four positions where our research anticipates prominent divergence between winners and laggards over the coming forecast period. Each is grounded in the demand model, the regulatory perimeter, and the announced capacity pipeline.
01 / APPLICATION LIBRARY INVESTMENT

The trial history is the actual business asset

Every customer part differs in geometry, material, and burr condition, trials run roughly six weeks, and a builder that has already proven a similar process quotes faster and wins considerably more often. That library accumulates from thousands of previous trials over decades and cannot be bought, hurried, or copied by any competitor arriving from another region. Concentration at just 26% across the top five exists because those libraries are inherently regional rather than because capital or capability is scarce anywhere.
02 / VALUE ARGUMENT REFRAMING

Lead with reject cost, not labour payback

Around 3% of precision machined parts fail inspection on edge condition, and in hydraulic, aerospace, and medical work a burr that escapes inspection causes a field failure costing many times the machine. Payback at roughly 19 months against manual wages is the weaker argument, and it is the one most builders still lead with in every proposal. Variability elimination is the argument that reaches buyers in high-value industries, and those are precisely the buyers whose work carries the best margins available.
03 / CONSUMABLE ANNUITY CAPTURE

Media revenue is the annuity you keep giving away

Media, brushes, belts, and compounds carry roughly 31% of builder revenue and recur for a machine's entire operating life, because switching them means revalidating an edge result that took roughly six weeks of trial work to establish in the first place. Customers therefore almost never change supplier once a process has been validated and written into their own quality documentation. Builders treating consumables as a low-margin obligation quietly hand the most predictable revenue in this business to third-party media suppliers who did nothing to earn it.
04 / SPECIFICATION TIMING MOVE

Get into the machine tool capital case

Deburring equipment is bought after the machining investment that created the burr, so every purchase competes against a budget already committed and defers whenever the primary capital does. Builders present during machine tool specification can size the finishing requirement into the original capital case rather than fighting for a supplementary one afterwards. Very few builders work that far upstream at all, and the ones that do face far shorter sales cycles than the six week trial requirement would otherwise suggest.

Engagement Snapshot From the Field

A live engagement with an industry participant carrying material or product regulatory and market exposure ahead of a defining policy shift, showing how our research translates into a defensible multi-year portfolio strategy.
MARKET MINDS ADVISORY · CLIENT ENGAGEMENT SUMMARY
Deburring Machine Producer Strategic Portfolio Review and Transition Roadmap 2026·Investment Scenario on Deburring Machine Exposure Evaluation 2025-26
CLIENT PROFILE
A precision machining group with approximately 210 million dollars in annual revenue (client-reported, unverified by MMA), operating five plants producing hydraulic, aerospace, and medical components. Hand deburring absorbed a substantial share of finishing labour, two plants had unfilled finishing vacancies for over a year, and three previous automation business cases had been rejected on payback grounds.
STRATEGIC CHALLENGE
Operations leadership wanted to understand why automation cases kept failing internally when finishing positions could not be filled at any wage offered, and which parts across the five plants were genuinely automatable rather than assumed to be. Nobody had quantified what the burr-related rejects and unfilled vacancies were actually costing the group.
MMA APPROACH
We classified the group's part portfolio by geometry, material, and burr condition against automatable process options. Burr-related reject and field return costs were quantified separately from labour. Vacancy and overtime costs were traced across two years, and application trial requirements were scoped with three machine builders. Every rejected business case was then reconstructed.
KEY FINDINGS
  1. Burr-related rejects and two field returns had cost the group substantially more over two years than the automation capital that had been rejected on payback grounds.
  2. Roughly 40% of parts by volume were straightforwardly automatable with existing processes, while a further quarter needed electrochemical methods nobody had evaluated.
  3. The rejected business cases had all been built on labour displacement alone, which understated the benefit and ignored the reject and recruitment costs entirely.
  4. Unfilled vacancies had been covered through overtime at a cost the finishing budget absorbed without ever appearing in any automation comparison. Nobody had connected the two budgets at all.
CLIENT PROFILE
A precision machining group with approximately 210 million dollars in annual revenue (client-reported, unverified by MMA), operating five plants producing hydraulic, aerospace, and medical components. Hand deburring absorbed a substantial share of finishing labour, two plants had unfilled finishing vacancies for over a year, and three previous automation business cases had been rejected on payback grounds.
STRATEGIC CHALLENGE
Operations leadership wanted to understand why automation cases kept failing internally when finishing positions could not be filled at any wage offered, and which parts across the five plants were genuinely automatable rather than assumed to be. Nobody had quantified what the burr-related rejects and unfilled vacancies were actually costing the group.
MMA APPROACH
We classified the group's part portfolio by geometry, material, and burr condition against automatable process options. Burr-related reject and field return costs were quantified separately from labour. Vacancy and overtime costs were traced across two years, and application trial requirements were scoped with three machine builders. Every rejected business case was then reconstructed.
KEY FINDINGS
  1. Burr-related rejects and two field returns had cost the group substantially more over two years than the automation capital that had been rejected on payback grounds.
  2. Roughly 40% of parts by volume were straightforwardly automatable with existing processes, while a further quarter needed electrochemical methods nobody had evaluated.
  3. The rejected business cases had all been built on labour displacement alone, which understated the benefit and ignored the reject and recruitment costs entirely.
  4. Unfilled vacancies had been covered through overtime at a cost the finishing budget absorbed without ever appearing in any automation comparison. Nobody had connected the two budgets at all.
RECOMMENDED STRATEGY
Phase 1: Phase 1 (months one to eight): rebuild the business case around reject, field return, and overtime cost rather than around displaced wages. Phase 2: Phase 2 (months eight to twenty-four): submit the automatable part families for trial and install at the two plants with unfilled vacancies. Phase 3: Phase 3 (months twenty-four to forty-two): evaluate electrochemical processes for the internal passage parts that mechanical methods cannot reach. Trial them before any commitment.
OUTCOME
The rebuilt business case was approved within two quarters, having been rejected three times on the previous basis. Two installations were commissioned and trials began on the electrochemical part families, with overtime in finishing falling substantially at both plants (client-reported, unverified by MMA). Reject cost tracking was added to the standing capital review process.

Frequently Asked Questions

Foundational context covering the market sizes, CAGR, scope, country, region and competition that inform every finding below. This section is provided to cover basics and most often pre-purchase conversations, answered from the MMA Primary Research Dataset.

What is the current size of the Deburring Machine Market?

The market is valued at USD 1.4 billion in 2025, rising to USD 1.49 billion in 2026. Scope covers deburring and edge finishing machines, not hand tools, abrasive consumables sold separately, or contract deburring services.

How large will the Deburring Machine Market be by 2036?

MMA forecasts USD 2.82 billion by 2036, an increase of USD 1.33 billion over the 2026 base. That represents an expansion multiple of 1.89 times across the forecast period.

What is the CAGR for the Deburring Machine Market 2026 to 2036?

The base case CAGR is 6.6%, with a bull case of 7.8% and a bear case of 5.4%. The historical rate from 2020 to 2025 was 5.6%, interrupted by the capital spending pause.

Which segment is growing fastest?

Robotic deburring cells at 9.9%, exactly 1.50 times the market rate. Growth comes from finishing labour that manufacturers cannot recruit rather than from any cost advantage over hand work.

Who are the major companies in the Deburring Machine Market?

Rosler Oberflaechentechnik, Timesavers, LISSMAC Maschinenbau, Costa Levigatrici, and Walther Trowal lead on machine revenue. The top five hold only 26%, because application libraries are inherently regional.

Which country is growing fastest?

India at 9.2%, where precision machining and automotive component capacity are expanding together. Export customers impose edge quality requirements that domestic buyers historically did not ask for.

Report Segmentation Architecture

The full report scope spans multiple orthogonal segmentation dimensions, with cross-tabulated demand data provided for each dimension pair. Coverage extends further to regional breakdowns, trend trajectories, and the competitive detail needed to support segment-level decision-making.

By Deburring Process Technology

  • Belt And Brush Deburring Machines
  • Mass Finishing And Vibratory Systems
  • High-Pressure Waterjet Deburring Systems
  • Electrochemical And Thermal Energy Deburring Systems
  • Robotic Deburring Cells

By End-Use Industry

  • Automotive And Electric Vehicle Components
  • Aerospace And Defence Machining
  • Hydraulics, Pneumatics And Fluid Power
  • Medical Devices And Precision Instruments
  • General Engineering And Sheet Metal Fabrication

By Commercial Model

  • Direct Machine Sales With Application Trials
  • Consumable And Media Supply Agreements
  • Distributor And Regional Agent Channels
  • Retrofit And Cell Integration Projects
  • Service, Spares And Process Support Contracts

By Region

  • East Asia
  • Western Europe
  • North America
  • South Asia and Pacific
  • Eastern Europe
  • Latin America
  • Middle East and Africa

Scope, Methodology, and Coverage

Every figure in this report is reproducible from documented input assumptions. The scope below maps the historical period, the forecast horizon, the segmentation dimensions, and the countries covered, alongside the underlying primary and qualitative methodology.
Historical Period
2020 to 2025
Forecast Period
2026 to 2036
Base Year
2025 (USD billions; MMA Primary Research Dataset, August 2026)
Market Definition
This market comprises deburring and edge finishing machines supplied for metal, composite, and plastic part production, measured at builder revenue across direct sales, consumable supply, distribution, integration, and service channels. Coverage spans belt and brush deburring machines, mass finishing and vibratory systems including barrel, bowl, and centrifugal equipment, high-pressure waterjet deburring systems, electrochemical and thermal energy deburring systems, and robotic deburring cells with force-compliant tooling. Hand tools and abrasive consumables sold independently of a machine relationship, general surface grinding, lapping and polishing equipment, shot blasting and peening systems, parts washing and degreasing lines, coating and plating equipment, inspection systems, and contract deburring services performed by third parties fall outside scope.
Quantitative Units
USD billions (current prices); machines shipped by process type; price per machine by segment; consumable revenue per installed unit
Segmentation Dimensions
By Deburring Process Technology; By End-Use Industry; By Commercial Model; By Region
Regions Covered
East Asia, Western Europe, North America, South Asia and Pacific, Eastern Europe, Latin America, Middle East and Africa
Countries Covered
China, Japan, South Korea, Taiwan, Germany, Italy, Netherlands, Switzerland, France, United Kingdom, United States, Canada, Mexico, India, Vietnam, Thailand, Australia, Brazil, Turkey, South Africa, Poland, Czechia, Slovakia, and additional markets relevant to this sector
Key Companies Profiled
Rosler Oberflaechentechnik, Timesavers, LISSMAC Maschinenbau, Costa Levigatrici, Walther Trowal, Loeser, Q-Fin Quality Finishing Machines, ARKU Maschinenbau, Grind Master Machines, Extrude Hone, Fladder Danmark, Bel Air Finishing, Giant Finishing, Kuhlmeyer Maschinenbau, Sugino Machine, Tipton, Sinto Group, PFERD, Boeck, Rump Strahlanlagen
Quantitative Methodology
Primary survey, n=3,800 respondents, Q4 2025, six countries; demand-side model with trade association cross-validation
Qualitative Methodology
47 expert interviews, Q4 2025; applied to validate demand model assumptions, identify emerging dynamics, and assess competitive positioning
Report Format
PDF and XLSX data workbook (Word format preview document)
Publisher
Market Minds Advisory
Report Code
MMA-2026-CON-840
Published
August 2026
Contact
sales@marketmindsadvisory.com | www.marketmindsadvisory.com

Purchase the full Deburring Machine Market Report (2026 to 2036).

The full report sizes deburring machines across five process technologies, five end-use industries, five commercial models, and seven regions, with application library depth assessed builder by builder throughout. Consumable annuity capture is quantified separately from machine revenue, since it is the more predictable half of the business. Part automatability is modelled by geometry and burr condition across major component families. Competitive profiling covers twenty builders on machine revenue, and robotic cell capability is assessed separately from traditional finishing heritage. Regional demand is built from machining base geography rather than from general industrial output.
Application library depth assessed builder by builder across regions
Consumable annuity capture quantified separately from machine capital revenue
Part automatability modelled by geometry and burr condition
Robotic cell capability assessed separately from traditional finishing heritage
Burr-related reject and field failure costs quantified by industry
Finishing labour availability tracked against automation adoption rates

Built For The People Who Decide

From boardroom strategy to bench-side execution, this report is read cover-to-cover by leaders shaping the next decade of their industry, turning demand scenarios, market dynamics and valuation benchmarks into decisions.
CXOs/ Presidents/ VPs/ Managers
M&A and Corporate Development
Strategy Teams and R&D Heads
Procurement and Product Directors
Regulatory and Compliance Leaders
Investor Relations and Equity Analysts