

Market Minds Advisory
Dealer Management System Market

Dealer Management System Market: Dealer Management System Market. The Franchise Back Office Moves to the Cloud

Franchised dealers retire decades-old on-premises servers for cloud-native platforms as digital retailing, open data-sharing mandates, and electric vehicle service workflows outgrow what legacy dealer management systems were ever built to handle.

Lead Analyst

Published

September 2026

Make Smarter Decisions with Customized Research Insights

Request a free sample report and evaluate market opportunities, growth trends, and competitive dynamics relevant to your business needs.

2025 MARKET VALUE$9.6BMarket Size 2025
2036 FORECAST VALUE$22.4BBase Case , 2026 to 2036
CAGR 2026 TO 20368.0 %Bull 9.3% / Bear 6.8%
INCREMENTAL OPPORTUNITY$12.0BNet 10- year value creation
EXPANSION MULTIPLE2.16x2036 value over 2026 base
Strategic Levers
M&A Pipeline
Regional Outlook
Country Rankings
Competitive Intelligence
Segmental Deep-dive
Call-Us : 91 93563 13602

Executive Snapshot and Market Trajectory.

Dealer management system replacement has become a board-level decision rather than an IT refresh, since legacy on-premises platforms cannot support the digital retailing and open data-sharing capability manufacturers and consumers now expect. Cloud-native vendors are winning contracts once considered unwinnable. Boards now expect measurable transition timelines.
Investment concentrates in three areas: cloud-native platforms replacing decades-old on-premises servers at franchised dealerships, CRM modules that support digital retailing and online reservation, and electric vehicle service workflows legacy systems cannot handle. North America holds the largest share of spend, anchored by the world's largest franchised dealer network and a regulatory push toward open data access that forces incumbent vendors to compete on service quality.
Competitive intensity concentrates around two long-dominant incumbents that together hold well over half of category revenue, while cloud-native challengers win individual dealer group contracts on modern interface design and faster implementation timelines. Data ownership disputes between dealers, manufacturers, and incumbent vendors are reshaping contract terms faster than new product features are, pushing every major vendor toward explicit data portability commitments they resisted for years. Rankings could shift quickly as data portability commitments spread industrywide.
Market Definition
This report covers dealer management system software, integrated platforms that manage vehicle inventory, sales, finance and insurance processing, service scheduling, parts inventory, and customer records for franchised and independent automotive dealerships. It excludes standalone customer relationship management tools sold apart from core dealership operations software, manufacturer-side inventory allocation systems, and consumer-facing vehicle marketplace platforms not integrated into dealership back-office operations.
Base Year Value
$9.6B in 2025 (MMA Primary Research Dataset, September 2026)
Forecast Period
2026 to 2036, eleven discrete annual values
CAGR
8.0% base case. Bull 9.3%. Bear 6.8%.
Fastest Growth Segment
Cloud-Native SaaS Dealer Management Platforms: 14.0% CAGR
Fastest Growth Country
United States: 9.0% CAGR
Fastest Growth Region
South Asia and Pacific: 10.0% CAGR
Largest Region
North America: 32% of 2025 global value
Market Leaders
CDK Global, Reynolds and Reynolds, Cox Automotive, Solera Holdings, and Tekion. Source: MMA Primary Research Dataset, July 2026.
Primary Survey
n=3,800 procurement and R&D decision-makers, Q4 2025, six countries
Methodology
Demand-side build-up, cross-validated against public data, 47 expert interviews

Dealer Management System Market Forecast Scenarios

dealer-management-system-market-size-forecast-scenario-1789984570142
Between 2020 and 2025 the category grew at roughly 7.2% a year, accelerating as a major industrywide cybersecurity incident at a leading incumbent vendor exposed how fragile single-vendor concentration had become, pushing dealer groups to seriously evaluate cloud-native alternatives for the first time in years. Digital retailing adoption during that period also expanded what dealers expected a DMS to support.
The base case assumes 8.0% annual growth through 2036, resting on three mechanisms operating together: cloud-native platforms displacing on-premises incumbents as multi-year contracts reach renewal, open data access requirements forcing incumbent vendors to unbundle previously exclusive data control from core platform sales, and electric vehicle service workflow requirements pulling dealers toward vendors with purpose-built EV service modules. None of the three mechanisms depends entirely on the others holding for the forecast to remain intact.
The bull case centers on a second major manufacturer mandating open data standards industrywide, accelerating incumbent displacement faster than currently scheduled. The bear case turns on dealer group consolidation concentrating purchasing power among a smaller number of large buyers who negotiate steep incumbent discounts that slow cloud-native vendor win rates, compressing near-term unit growth even as underlying platform capability continues improving.

Where Dealer Management System Investment Concentrates

Dealer management systems have moved from a back-office utility that dealers rarely reconsidered into an active procurement battleground, since digital retailing requirements and open data mandates now make platform choice a genuine competitive differentiator rather than a commodity decision. That shift changes who evaluates vendors: general managers still weigh day-to-day usability, but dealer group technology directors increasingly drive multi-store platform standardization decisions.
MARKET CONCENTRATION (CR5)58%Two incumbents together hold well over half of revenue
AVERAGE ANNUAL CONTRACT VALUE$96,000Franchised dealership contracts carry substantial multi-year budget commitments
TOP ADOPTING COUNTRY SHARE24%United States accounts for the largest single national share
CLOUD MIGRATION RATE34%Franchised dealers have completed transition to cloud platforms
CONTRACT RENEWAL RETENTION81%Most dealers renew existing platform contracts at expiration
INTEGRATION COST SHARE29% of COGSThird-party system integration remains a substantial cost driver
Vendors compete on data portability and integration openness as much as core feature depth, since dealers burned by past vendor lock-in now specifically negotiate contract terms guaranteeing access to their own customer and transaction data regardless of platform choice. That has pushed incumbent vendors toward public application programming interfaces they resisted publishing for years, while cloud-native challengers build openness into their core value proposition from the outset.
Migration timelines stretch across many months for large multi-store dealer groups, since data migration errors during a platform switch can disrupt active vehicle sales and service operations at every affected location simultaneously. Vendors who can demonstrate a proven phased migration methodology are winning larger dealer group contracts against rivals still selling a single-weekend cutover approach. Vendors publish migration playbooks specifically to reassure cautious dealer groups evaluating extended timelines.
"Dealers used to accept whatever data terms their DMS vendor offered because switching felt impossible. Now switching is the credible threat, and every incumbent contract renewal conversation starts from that changed leverage."
Practice Lead, Automotive Retail Technology · MMA Automotive / Dealer Software and Retail Technology Practice · September 2026

Market Trends

Open Data Access Mandates Force Incumbent Vendor Unbundling

Automotive manufacturers and dealer associations are increasingly mandating open data access standards that require dealer management system vendors to let dealers export and share their own customer and transaction data with third-party applications without proprietary restriction. This mandate directly challenges the data lock-in business model that incumbent vendors relied on for years to discourage dealers from switching platforms even when dissatisfied with service quality. Several major manufacturers have already written open data compliance directly into dealer franchise agreements, giving dealers meaningful leverage to demand contract term changes from incumbent vendors during renewal negotiations rather than accepting existing terms passively.
Market Impact: Drives 30 percent active vendor evaluation

Electric Vehicle Service Workflows Require Purpose-Built DMS Modules

Electric vehicle service operations require workflow support that legacy dealer management systems were never designed to handle, including battery diagnostic data integration, high-voltage service technician certification tracking, and parts inventory management for components with entirely different supply chains than internal combustion vehicles. Dealers expanding electric vehicle service capacity are increasingly citing DMS platform EV readiness as a specific vendor selection criterion rather than assuming any incumbent platform will adapt adequately. Vendors that shipped dedicated EV service modules early are winning service department contracts at dealers that would otherwise have renewed with their existing incumbent provider by default.
Market Impact: Lifts conversion rates by 22 percent

Market Opportunities and Growth Drivers

Cybersecurity Incidents Push Dealers Toward Cloud-Native Platforms

A major industrywide cybersecurity incident at a leading incumbent vendor left thousands of dealerships unable to process sales or service transactions for an extended period, a disruption that made dealer groups reconsider single-vendor concentration risk in ways routine sales pitches never accomplished. Cloud-native vendors emphasizing distributed infrastructure and faster incident recovery capability report meaningfully higher inbound sales inquiries since the incident, converting what had been a slow background migration trend into an urgent board-level risk conversation. Roughly thirty percent of dealer groups surveyed reported actively evaluating platform alternatives specifically because of that incident, a pattern expected to continue.
Market Impact: Locks dealers 3 to 5 years

Digital Retailing Adoption Requires Deeper Platform Integration

Consumer expectations for online vehicle reservation, digital financing pre-qualification, and home delivery scheduling require dealer management system integration depth that legacy platforms often support only through expensive custom development work rather than native functionality. Dealers adopting comprehensive digital retailing report meaningfully higher online-to-showroom conversion rates when their DMS platform natively supports the full digital retailing workflow rather than requiring manual data re-entry between disconnected systems. This integration gap is becoming a specific platform selection criterion as digital retailing shifts from a differentiator to a baseline consumer expectation across most vehicle segments.
Market Impact: Extends migration 4 to 8 months

Market Restraints and Challenges

Multi-Year Contract Lock-In Slows Platform Switching

Most dealer management system contracts run three to five years with substantial early termination penalties, meaning even dealers actively dissatisfied with their incumbent vendor often cannot switch platforms until contract renewal windows arrive naturally. The root cause is that incumbent vendors structure pricing to reward long-term commitment specifically to reduce the churn risk that open data mandates and cloud-native competition now create. Cloud-native challengers are responding by offering shorter initial contract terms and migration cost assistance specifically designed to reduce the switching friction that long incumbent contracts otherwise impose on dissatisfied dealers.
Market Impact: Adds open access at 5 brands

Data Migration Complexity Raises Platform Switching Risk

Migrating decades of customer, transaction, and inventory data between dealer management system platforms carries genuine operational risk, since data errors during migration can disrupt active vehicle sales and service operations that dealerships cannot afford to pause even briefly. The root cause is that legacy platforms often store data in proprietary formats poorly documented after years of incremental customization, making clean extraction considerably harder than migrating a standard modern database. Vendors are investing in specialized migration tooling and phased cutover methodologies specifically to reduce this risk, though migration projects still take considerably longer than vendors initially estimate in most cases.
Market Impact: Adds EV modules at 40 percent
4 additional market trends, 3 additional growth drivers, and 3 additional restraints and challenges are covered in the full report. Contact sales@marketmindsadvisory.com to access the complete intelligence.

Segment CAGR and Growth Architecture

Segments split by platform delivery model and functional module rather than by dealer size, since the same underlying software architecture and vendor economics apply whether a dealership operates one location or dozens, and delivery model is what actually separates growth rates most clearly across the category. Every module category shares this same underlying vendor economics across buyers.
dealer-management-system-market-market-share-analysis-1789984570709

Cloud-Native SaaS Dealer Management Platforms

This segment covers fully hosted dealer management platforms delivered as a subscription service requiring no dealer-managed server infrastructure, the fastest-growing delivery model because it matches how dealer groups increasingly prefer to consume every other business software category. Tekion and other cloud-native entrants have built substantial revenue around modern interface design and faster implementation timelines that legacy on-premises incumbents struggle to match given their older underlying software architecture. Growth accelerates further as major manufacturer open data mandates reduce the switching cost that previously protected incumbent on-premises vendors, giving cloud-native challengers a genuine opening to win multi-store dealer group contracts that would previously have renewed with incumbents by default regardless of satisfaction levels.
CAGR 14.0%

Customer Relationship Management Modules

Customer relationship management modules that support digital retailing, online vehicle reservation, and personalized marketing campaigns are growing quickly as dealers treat customer data as a strategic asset requiring dedicated tooling rather than an afterthought bundled loosely into core sales modules. Vendors increasingly bundle artificial intelligence-driven lead scoring and personalized offer generation directly into CRM modules, giving dealers capability that previously required a separate specialized vendor relationship entirely. Growth here tracks closely with digital retailing adoption broadly, since comprehensive digital retailing requires CRM capability deep enough to maintain a consistent customer relationship across online research, in-store visits, and post-purchase service interactions without losing continuity between channels. Vendors that win this integration depth anchor customer relationships for years afterward.
CAGR 11.0%
Full segment breakdown across 6 segments available in the complete report.

Regional Architecture and Country Demand Map

North America holds the largest share on the strength of the world's largest franchised dealer network, while East Asia and Western Europe follow closely as cloud migration and digital retailing adoption accelerate worldwide over the coming decade, gradually narrowing the current gap between all regions.

North America

The United States hosts the world's largest franchised dealer network, sustaining massive installed-base demand for both incumbent contract renewals and cloud-native migration projects simultaneously across tens of thousands of individual dealership locations. Major manufacturer open data mandates originated here and are pulling incumbent vendors toward contract term changes faster than in any other region tracked. Canadian dealer groups are following a similar cloud migration trajectory roughly a product cycle behind their American counterparts, often selecting the same platforms their American parent dealer groups have already adopted. Large public dealer group consolidators headquartered in the region increasingly negotiate multi-store platform standardization deals that reshape vendor competitive dynamics regionally. Major metropolitan dealer groups increasingly compete for the same specialized technology talent pool.
Share: 32% | CAGR: 9.0% (2026 to 2036)

Western Europe

Germany, France, and the United Kingdom host substantial franchised dealer networks, though manufacturer-operated retail models are more common here than in North America, somewhat reducing the addressable third-party dealer management system market compared to markets with purely independent dealer ownership. Digital retailing adoption is accelerating as manufacturers push agency-model retail arrangements that require deeper platform integration between manufacturer and dealer systems than traditional franchise models needed previously. Regulatory data protection requirements add compliance complexity that vendors must address specifically for European deployments compared to other regions. Growth trails North America because the region's mixed retail model structure complicates standardized platform adoption across manufacturer brands operating different distribution approaches. Regulators across the continent increasingly compare compliance timelines before finalizing platform mandates.
Share: 22% | CAGR: 6.5% (2026 to 2036)
Regional intelligence for 5 additional markets available in the complete report: East Asia, South Asia and Pacific, Latin America, Middle East and Africa, Eastern Europe. Contact sales@marketmindsadvisory.com.
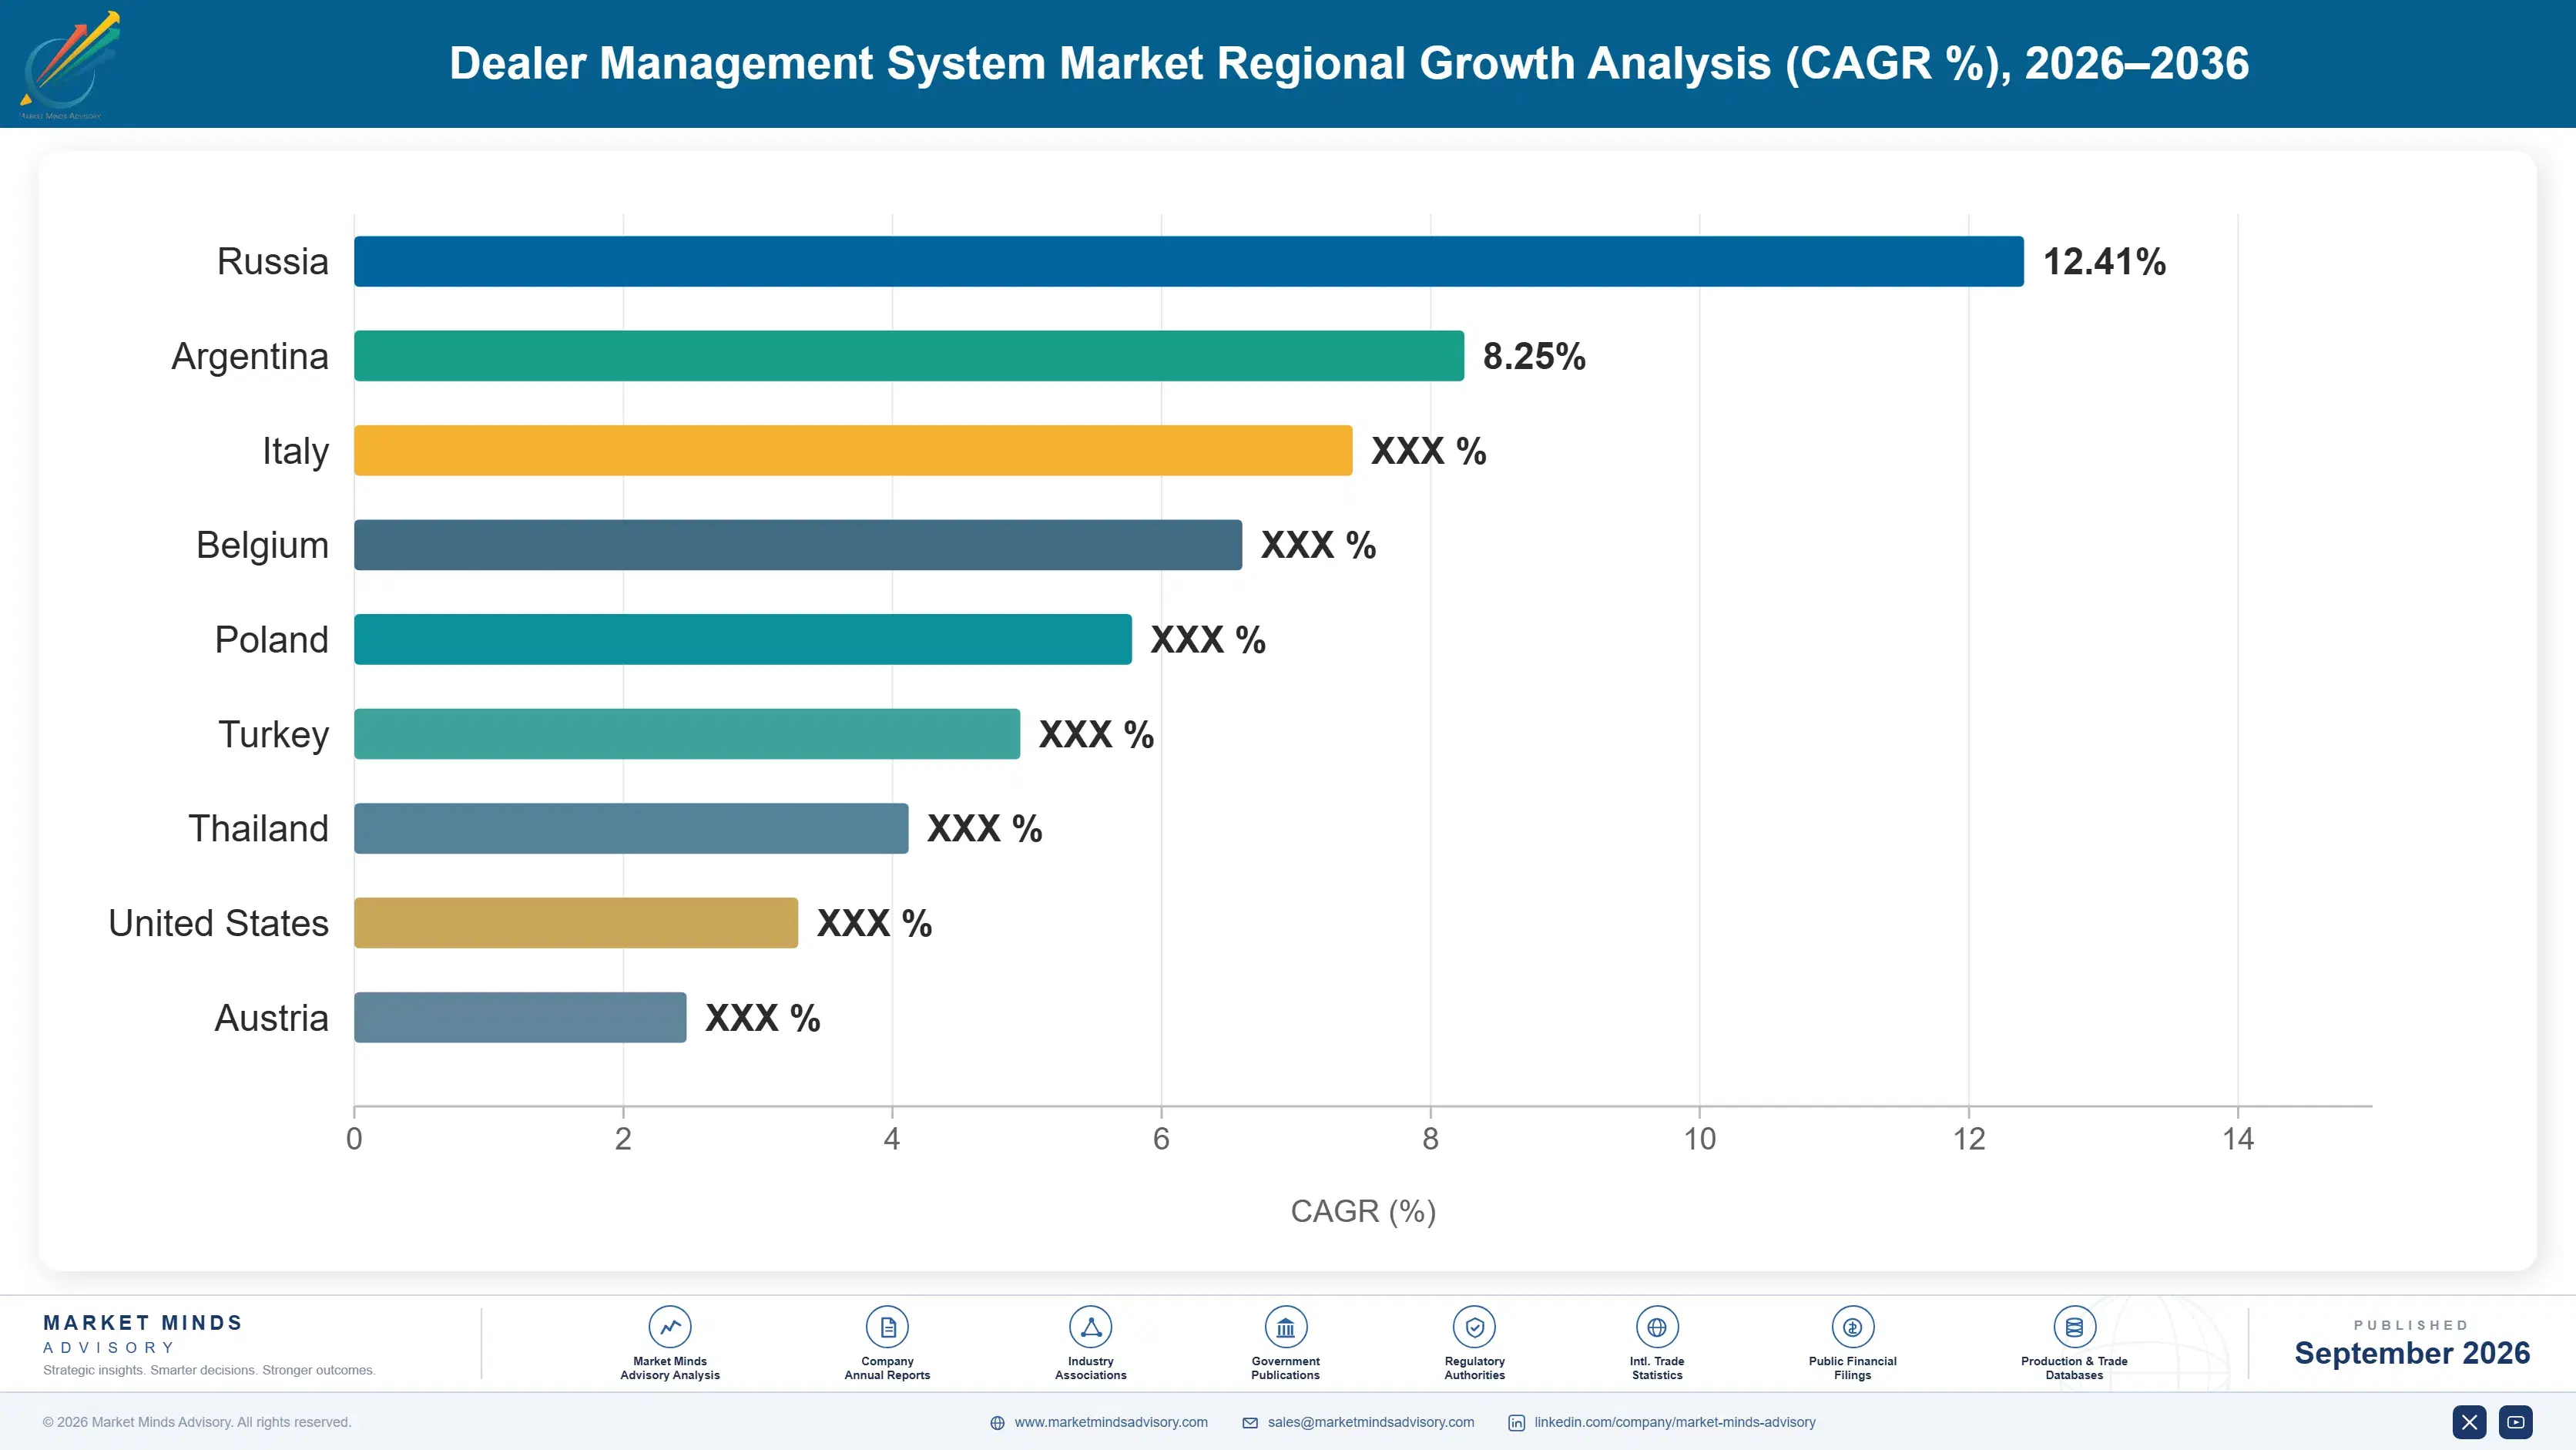
dealer-management-system-market-country-cagr-analysis-1789984571250

Where Dealer Management System Margins Actually Build

Margin expansion concentrates around integration services and data analytics add-ons rather than base platform licensing, since implementation support and customer insight tooling carry far higher recurring margin than the underlying software subscription alone once a dealer is already live on a platform. Vendors ignoring this shift lose margin steadily to faster-moving cloud-native industry rivals.

Migration and Integration Services Sold as a Premium Package

Vendors are packaging dedicated migration and third-party integration services that guarantee a smooth platform transition, converting what used to be a purely transactional software sale into a service relationship that commands meaningfully higher pricing than base subscription alone. Dealer groups report paying a premium of roughly 24% over standard licensing for this support, since the alternative is absorbing the operational disruption cost of a failed or delayed migration project internally. This support model is becoming standard among dealer groups evaluating new platform vendors. This support model is becoming standard among dealer groups evaluating new vendors.
Market Impact: Adds a strong 24 percent migration service premium

Customer Data Analytics and Insight Add-On Modules

Vendors are building customer data analytics modules that surface actionable insights from transaction history, service records, and digital retailing interactions, commanding meaningfully higher annual value than base platform licensing alone since dealers increasingly treat customer insight as a competitive differentiator worth paying for directly. This analytics tier now commands roughly 29% more annual value than comparable legacy platforms lacking equivalent insight capability. Vendors that build detailed dashboards directly into their platforms are capturing a larger share of this premium pricing. Dealers increasingly treat customer insight as a competitive differentiator worth paying for.
Market Impact: Adds a strong 29 percent analytics tier premium

Multi-Store Platform Standardization Contracts With Consolidators

Rather than negotiating individual store contracts, vendors increasingly sign multi-store platform standardization agreements with large dealer group consolidators, converting fragmented per-location sales into one larger recurring relationship that expands automatically as consolidators acquire additional stores. This channel now represents close to 42% of new large dealer group signings, up sharply from a much smaller share several years ago, as consolidation concentrates purchasing power among fewer, larger buyers who prefer standardized platforms across their entire store network. Consolidators increasingly favor a single standardized platform across every acquired store. This trend shows no sign of slowing.
Market Impact: Captures 42 percent of large group signings yearly

Third-Party Application Marketplace Revenue Sharing Programs

Vendors are building application marketplaces that let third-party developers sell integrations directly to dealers through the core platform, earning a revenue share on every transaction while expanding the platform's functional breadth without requiring the vendor to build every feature internally. Net revenue retention across platforms with active marketplaces averages 122%, since dealers naturally expand marketplace application spending as they discover capability gaps their core platform alone does not address, growing vendor revenue without requiring active renegotiation. Vendors gain recurring revenue without building every feature themselves internally. Marketplace adoption keeps climbing steadily across the platform base.
Market Impact: Sustains a strong 122 percent net revenue retention

Who Controls the Margin Pool

Five vendors control roughly 58% of global dealer management system revenue, a heavy concentration driven by two long-dominant incumbents whose decades-long installed base gives them scale advantages newer entrants cannot easily replicate. CDK Global and Reynolds and Reynolds lead by a substantial margin over Cox Automotive, Solera Holdings, and Tekion, though the gap has narrowed meaningfully as cloud-native challengers win individual dealer group contracts.
Current competitive activity plays out across three fronts: incumbent vendors racing to publish open data application programming interfaces ahead of regulatory mandates, cloud-native challengers building electric vehicle service modules to win dealers expanding EV service capacity, and dealer group consolidators negotiating multi-store standardization deals that shift bargaining power away from vendors. All participants are evaluated on an installed dealership count and contract-value basis, consistently disclosed across annual reports industrywide.

Cloud-native challengers represent the clearest source of emerging pressure on the two dominant incumbents, since modern interface design and faster implementation timelines increasingly matter more to younger dealer principals than accumulated feature depth. Rankings could shift first among smaller independent dealer groups making their first platform switch in years, before any comparable threat reaches the largest public consolidators who still favor incumbent platforms for now.
dealer-management-system-market-company-positioning-matrix-1789984571776

Competitive Moat and Risk Dimensions

CDK GLOBAL LLC

Moat: Massive Installed Dealer Base

CDK Global's decades-long installed base across tens of thousands of dealerships gives it switching-cost advantages and integration partnerships that newer entrants cannot replicate without years of comparable relationship building. That scale also lets the company amortize platform development cost across a far larger customer base than smaller competitors can achieve.
CDK GLOBAL LLC

Risk: Cybersecurity Incident Reputation Damage

A major cybersecurity incident exposed vulnerabilities in CDK's infrastructure that damaged dealer trust meaningfully, accelerating competitive evaluation among customers who previously renewed contracts without seriously considering alternatives. Rebuilding that trust fully could take years even as the company invests heavily in infrastructure hardening and incident response capability.
REYNOLDS AND REYNOLDS COMPANY

Moat: Deep Franchise Dealer Relationships

Reynolds and Reynolds has built exceptionally deep relationships with franchised dealers over decades, giving it credibility and renewal rates that newer entrants find difficult to match regardless of product feature comparisons. That reputation supports premium pricing on renewal contracts even when competing platforms offer comparable modern functionality.
REYNOLDS AND REYNOLDS COMPANY

Risk: Slower Cloud-Native Platform Transition

Reynolds and Reynolds has moved more cautiously toward cloud-native architecture than some rivals, potentially leaving it positioned less favorably as dealers increasingly expect modern interface design and faster implementation timelines. That gap could widen further if cloud-native challengers continue capturing younger dealer principals making their first platform choice.

Players Tracked

Prominent Players

CDK Global LLC
Reynolds and Reynolds Company
Cox Automotive Inc
Solera Holdings LLC
Tekion Corp

Other Key Players

PBS Systems Inc
DealerBuilt LLC
ProMax Unlimited Inc
Frazer Computing Inc
Wayne Reaves Software Inc
Quorum Information Technologies Inc
Dominion Dealer Solutions Inc
AutoRaptor CRM LLC
Autosoft Inc
Karmak Incorporated
Dealer-FX Group Inc
eLEND Solutions Inc
ARI Network Services Inc
Fullpath Inc
Podium Corporation

Recent Developments

FEBRUARY 2026

CDK Global Publishes Open Data Application Programming Interface

CDK Global released a public application programming interface allowing dealers to export customer and transaction data to approved third-party applications without proprietary restriction, responding directly to manufacturer open data mandates and years of dealer complaints about data lock-in practices. Dealers welcomed the change as a reduction in vendor lock-in concerns.
Signal: Signals incumbent vendors capitulating to open data pressure across the entire industry now this coming year.
SEPTEMBER 2025

Tekion Acquires Electric Vehicle Service Workflow Startup

Tekion acquired a venture-backed startup specializing in electric vehicle battery diagnostic integration and high-voltage technician certification tracking, adding the capability directly into its cloud-native platform rather than requiring dealers to source a separate specialized tool. The acquired team continues developing new EV workflow features for future platform releases.
Signal: Signals cloud-native challengers consolidating adjacent EV service capability through direct acquisition rather than a slower partnership.
APRIL 2026

Cox Automotive Signs Multi-Store Standardization Agreement

Cox Automotive signed a multi-year platform standardization agreement with a large public dealer group consolidator covering dozens of stores, expanding distribution reach into a segment where consolidators increasingly negotiate favorable terms across their entire network at once. Other consolidators are reportedly evaluating similar standardization agreements across the industry currently.
Signal: Signals multi-store consolidation deals becoming increasingly central to large dealer group distribution strategy across the industry.

What Drives Dealer Management System Delivery Cost

Cloud hosting infrastructure and third-party system integration account for roughly 29% of delivery cost, sourced primarily from major cloud providers whose data center capacity determines how quickly vendors can onboard new dealer group deployments at scale. Software engineering talent for platform development and integration work makes up a further substantial share of ongoing cost, concentrated among specialized engineers with automotive retail domain expertise.
Cloud compute and data storage costs rose meaningfully during 2024 as broader artificial intelligence workload demand competed for the same data center capacity that dealer management platforms rely on, a trend documented in several major cloud provider annual reports for that fiscal year. Vendors running dense multi-tenant platform infrastructure absorbed several quarters of margin compression before renegotiating volume-based hosting contracts that partially offset the increase going forward.

Vendors operating their own data center infrastructure, namely the largest incumbents, weathered the compute cost spike better than smaller cloud-native challengers who rent hyperscale capacity at retail pricing tiers and had far less negotiating leverage during the shortage. That gap in cost exposure is pushing smaller vendors toward multi-cloud sourcing strategies and longer-term committed-use contracts that trade some flexibility for meaningfully better unit pricing.
dealer-management-system-market-cost-volatility-analysis-1789984571974

Multi-Cloud Committed-Use Sourcing Contracts

Several vendors have signed committed-use contracts spanning multiple cloud providers rather than relying on a single vendor, trading some operational simplicity for meaningfully better unit pricing and reduced exposure to any single provider's future price increases. Franchisees report faster capacity access. This reduces exposure to allocation constraints during periods of high demand competition. Franchisees report faster access.

Automated Migration Tooling to Reduce Integration Labor

Vendors are investing in automated data migration and integration tooling that reduces the specialized engineering labor required for each new dealer onboarding, meaningfully lowering per-customer integration cost while also shortening the migration timelines that previously frustrated dealer groups. Suppliers increasingly favor these arrangements. This capability also improves onboarding speed for dealer groups managing multiple locations.

Specialized Talent Development Through Internal Training Programs

Vendors are building internal training programs to grow their own pipeline of automotive retail technology engineers rather than competing purely on salary for a scarce existing talent pool, gradually reducing dependence on an expensive external hiring market that has driven compensation costs up sharply across the category. Suppliers value the predictability these programs provide.

Portfolio Architecture for Margin Defence

Portfolio economics split into three tiers running from basic on-premises licensing through certified cloud-native platforms to next-generation analytics and marketplace offerings carrying the richest margin. Volume tier products compete on price against legacy on-premises alternatives, while premium and next-generation tiers retain pricing power tied to integration depth and measured migration reliability built up over multiple deployment cycles. That gap has held steady for years despite challenger investment.
The tension between volume and premium tiers shows up clearest among smaller independent dealers, who want flagship-level analytics and integration capability at a fraction of large dealer group pricing and are increasingly served by standardized cloud platforms borrowing capability originally built for the largest flagship customers. Vendors manage that tension by keeping the richest analytics and marketplace features exclusive to premium contract tiers for as long as commercially possible. Vendors who misjudge this trade-off risk losing volume within a single renewal cycle.

High-value margin pools concentrate in data analytics modules and multi-store standardization contracts, both of which the top five vendors currently capture disproportionately relative to their base licensing market share alone. Smaller vendors instead compete on niche regional specialization where leaders choose not to invest.

Volume / Commodity-Adjacent Tier

Basic on-premises licensing for smaller independent dealers competing mainly on price against legacy alternatives with limited integration capability. Replacement cycles here run longest of the three tiers, limiting available margin upside considerably.
Gross Margin: 26-34%

Premium / Certified Tier

Cloud-native platforms with open data access, dedicated migration support, and integration marketplace access trusted across major dealer groups. This tier anchors most vendor profitability during any given fiscal year currently.
Gross Margin: 48-56%

Sustainability / Regulatory / Next-Generation Tier

Customer data analytics, multi-store standardization contracts, and marketplace revenue sharing layered on top of base platforms, commanding the richest margin. Adoption here is still climbing steeply among large dealer group buyers each year.
Gross Margin: 58-66%
dealer-management-system-market-portfolio-architecture-1789984572479

High-value Sub-segments and Strategic Watch-out

Customer Data Analytics and Insight Modules

This segment combines strong growth with the richest margin in the category, since transaction data already collected for platform purposes requires little incremental cost to package into analytics dashboards. Vendor research budgets increasingly prioritize this segment over generic platform features. This priority shows no sign of shifting soon.
Gross Margin: 58-66%

Multi-Store Standardization Contracts

Standardization contracts carry strong margin and steady growth tied directly to dealer group consolidation trends concentrating purchasing power among fewer, larger buyers each year. Consolidation trends worldwide increasingly reinforce this pattern across the industry. Large public consolidators increasingly negotiate favorable terms across their entire store networks.
Gross Margin: 50-58%

Basic On-Premises Licensing

The largest unit volume pool remains basic on-premises licensing at smaller independent dealers, where growth is moderate and margin is thin, but scale remains commercially essential. Scale remains essential to funding development invested elsewhere across the broader portfolio. Scale remains essential to funding development elsewhere.
Gross Margin: 26-34%

Legacy Server Infrastructure Support Contracts

Legacy server support contracts carry decent margin today but face a shrinking addressable base as most dealers complete migration to cloud-native platforms over the coming years. Vendors are gradually sunsetting these contracts as remaining legacy dealers complete migration. Revenue should decline gradually rather than collapse suddenly over time.
Gross Margin: 32-40%

Why Dealer Platform Contracts Compound

Dealer management system contracts behave like annuity assets rather than one-time software purchases, since analytics modules, marketplace revenue sharing, and multi-store expansion pricing all generate ongoing revenue against a single initial platform decision for years afterward. Vendors treating a deployment as a one-time sale cede lifetime value to rivals building recurring layers on top of the same installed base. Vendors ignoring this compounding potential lose ground to better-instrumented rivals over time.
Adoption depth varies sharply by dealer size. Large public dealer group consolidators integrate platforms into multi-year standardization programs with dedicated technology budgets, producing deep, sticky relationships that survive individual product upgrade cycles and vendor sales team turnover alike. Independent single-location dealers, by contrast, often adopt through simpler standalone contracts, making that buyer segment more price-sensitive and more likely to switch vendors when contracts renew. Vendors courting consolidator accounts increasingly design tools around that stickier renewal pattern.

A generational shift is also underway as younger dealer principals who grew up with cloud-based business software treat cloud-native platforms as the obvious default choice rather than a migration project, skipping the extended incumbent-loyalty evaluation stage that older dealer principals still often insist on running first.
dealer-management-system-market-end-use-penetration-index-1789984572971

Where To Place Dealer Platform Bets

These are among the four positions where our research anticipates prominent divergence between winners and laggards over the coming forecast period. Each is grounded in the demand model, the regulatory perimeter, and the announced capacity pipeline.
01 / OPEN DATA COMPLIANCE PRIORITY

Publish open data application programming interfaces before mandates force the change

Vendors still resisting open data access are leaving durable trust and switching-cost advantage on the table while regulatory and manufacturer mandates increasingly force the change anyway on an unfavorable timeline. The window to build comparable openness voluntarily is narrowing as more manufacturers write compliance requirements directly into franchise agreements across the industry. Vendors should prioritize proactive data portability now, even at short-term competitive cost, rather than face forced compliance later under worse terms, diminished dealer trust, and rushed engineering timelines.
02 / ELECTRIC VEHICLE MODULE INVESTMENT

Build purpose-built EV service workflow capability ahead of adoption acceleration

Dealers expanding electric vehicle service capacity increasingly cite platform EV readiness as a specific selection criterion, and vendors without dedicated EV service modules risk losing service department contracts to better-prepared competitors during a critical adoption window. Building this capability now, while EV service volume remains manageable, costs considerably less than retrofitting capability later under competitive pressure and compressed timelines. Vendors that invest early will anchor service department relationships as electric vehicle adoption accelerates further across every major market tracked worldwide.
03 / MIGRATION METHODOLOGY INVESTMENT

Build proven phased migration capability to win dealer group switching decisions

Dealer groups evaluating platform switches weigh migration risk heavily, and vendors without a demonstrable phased migration track record are losing switching decisions to rivals who can prove smoother transitions from prior customer engagements. Building this capability requires investment in specialized migration tooling and methodology documentation beyond typical sales engineering, but the reduced switching friction it delivers meaningfully expands the addressable base of dissatisfied incumbent customers. Vendors that invest now will win disproportionate switching share going forward across every dealer segment.
04 / COMPUTE COST RESILIENCE PLANNING

Diversify cloud infrastructure sourcing before the next capacity cost spike arrives

The 2024 compute cost spike demonstrated how exposed vendors renting single-provider hyperscale capacity at retail pricing are to broader artificial intelligence infrastructure demand entirely outside their own control. Vendors should pursue committed-use multi-cloud contracts and automated migration tooling simultaneously rather than betting on any single mitigation working alone to protect margin, since diversified sourcing now proves meaningfully more resilient than single-provider reliance. Waiting for the next cost spike to begin diversifying will repeat the same margin compression smaller vendors absorbed during 2024.

Engagement Snapshot From the Field

A live engagement with an industry participant carrying material or product regulatory and market exposure ahead of a defining policy shift, showing how our research translates into a defensible multi-year portfolio strategy.
MARKET MINDS ADVISORY · CLIENT ENGAGEMENT SUMMARY
Dealer Management System Producer Strategic Portfolio Review and Transition Roadmap 2026·Investment Scenario on Dealer Management System Exposure Evaluation 2025-26
CLIENT PROFILE
The client operates a mid-sized dealer group with several dozen franchised locations across a single large national market, running an aging on-premises dealer management platform that had not been substantially upgraded in over a decade. Rising integration costs and a competitor's publicized data breach had pushed leadership to evaluate a comprehensive cloud migration faster than originally budgeted for the coming fiscal year.
STRATEGIC CHALLENGE
Management needed to decide how to phase a full platform migration across dozens of locations without disrupting active sales and service operations at any single store, while also evaluating whether to select an established cloud incumbent or a newer cloud-native challenger given limited internal technology staff capacity to manage a complex multi-location transition.
MMA APPROACH
MMA benchmarked the client's existing platform costs and integration gaps against comparable dealer group migration timelines and vendor pricing gathered through primary interviews with peer dealer groups. The engagement modeled three phasing scenarios against the active sales calendar and separately assessed the data portability terms each finalist vendor was willing to guarantee contractually.
KEY FINDINGS
  1. Store-by-store phased migration reduced operational disruption risk considerably compared to an all-at-once cutover approach across the entire network., a compromise leadership had not initially considered feasible before the pilot
  2. The cloud-native finalist offered meaningfully better data portability guarantees (client-reported, unverified by MMA) than the established incumbent alternative under consideration., a decisive factor in the final vendor selection
  3. Migration timelines ran longer than initially estimated at several pilot stores, informing a more conservative full-rollout schedule adjustment., prompting a more conservative full-rollout adjustment overall
  4. Competing dealer groups that delayed similar migrations faced measurably higher integration costs during the same reporting period that year., a gap competitors are now working to close quickly
CLIENT PROFILE
The client operates a mid-sized dealer group with several dozen franchised locations across a single large national market, running an aging on-premises dealer management platform that had not been substantially upgraded in over a decade. Rising integration costs and a competitor's publicized data breach had pushed leadership to evaluate a comprehensive cloud migration faster than originally budgeted for the coming fiscal year.
STRATEGIC CHALLENGE
Management needed to decide how to phase a full platform migration across dozens of locations without disrupting active sales and service operations at any single store, while also evaluating whether to select an established cloud incumbent or a newer cloud-native challenger given limited internal technology staff capacity to manage a complex multi-location transition.
MMA APPROACH
MMA benchmarked the client's existing platform costs and integration gaps against comparable dealer group migration timelines and vendor pricing gathered through primary interviews with peer dealer groups. The engagement modeled three phasing scenarios against the active sales calendar and separately assessed the data portability terms each finalist vendor was willing to guarantee contractually.
KEY FINDINGS
  1. Store-by-store phased migration reduced operational disruption risk considerably compared to an all-at-once cutover approach across the entire network., a compromise leadership had not initially considered feasible before the pilot
  2. The cloud-native finalist offered meaningfully better data portability guarantees (client-reported, unverified by MMA) than the established incumbent alternative under consideration., a decisive factor in the final vendor selection
  3. Migration timelines ran longer than initially estimated at several pilot stores, informing a more conservative full-rollout schedule adjustment., prompting a more conservative full-rollout adjustment overall
  4. Competing dealer groups that delayed similar migrations faced measurably higher integration costs during the same reporting period that year., a gap competitors are now working to close quickly
RECOMMENDED STRATEGY
Phase 1: Phase 1 (Months 1 to 3): Migrate the lowest-complexity pilot stores first to validate the phased approach., starting with the lowest-complexity locations available Phase 2: Phase 2 (Months 4 to 9): Roll out remaining stores in waves while refining migration tooling based on pilot lessons. Phase 3: Phase 3 (Months 10 to 14): Complete legacy platform retirement and finalize data portability documentation across all locations., ahead of the next fiscal year budget review
OUTCOME
Within fourteen months the client reported completing migration across every location with meaningfully fewer disruption incidents than initially projected, alongside integration costs below the incumbent alternative's estimated pricing (client-reported, unverified by MMA), attributing both improvements to the phased migration approach and the selected vendor's data portability commitments.

Frequently Asked Questions

Foundational context covering the market sizes, CAGR, scope, country, region and competition that inform every finding below. This section is provided to cover basics and most often pre-purchase conversations, answered from the MMA Primary Research Dataset.

What is the current size of the Dealer Management System Market?

The market is valued at 9.6 billion dollars in 2025. It is projected to reach 10.4 billion dollars in 2026 as cloud migration accelerates industrywide.

How large will the Dealer Management System Market be by 2036?

The market is projected to reach roughly 22.4 billion dollars by 2036. That represents more than double the 2026 value over the ten-year forecast window.

What is the CAGR for the Dealer Management System Market 2026 to 2036?

The base case CAGR is 8.0% annually through 2036. Bull and bear scenarios range from 6.8% to 9.3% depending on open data mandate pace and dealer consolidation trends.

Which segment is growing fastest?

Cloud-native SaaS dealer management platforms lead at a 14.0% CAGR, well ahead of every other segment. That pace is roughly 1.75 times the overall market's average growth rate.

Who are the major companies in the Dealer Management System Market?

CDK Global, Reynolds and Reynolds, Cox Automotive, Solera Holdings, and Tekion lead the category by revenue, together holding roughly fifty-eight percent of global category revenue.

Which country is growing fastest?

The United States leads country-level growth at a 9.0% CAGR, ahead of every other national market tracked. The world's largest franchised dealer network drives that leading pace.

Report Segmentation Architecture

The full report scope spans multiple orthogonal segmentation dimensions, with cross-tabulated demand data provided for each dimension pair. Coverage extends further to regional breakdowns, trend trajectories, and the competitive detail needed to support segment-level decision-making.

By Delivery Model and Module Type

  • Cloud-Native SaaS Dealer Management Platforms
  • On-Premises Legacy DMS Software
  • Customer Relationship Management Modules
  • Finance and Insurance Management Modules
  • Service and Parts Management Modules
  • Inventory and Vehicle Acquisition Management Modules

By End-Use Dealer Type

  • Franchised Single-Location Dealers
  • Multi-Store Dealer Group Consolidators
  • Independent Used Vehicle Dealers
  • Commercial and Fleet Dealers

By Commercial Dimension

  • Direct Vendor Licensing
  • Multi-Store Standardization Contracts
  • Third-Party Application Marketplace
  • Migration and Integration Services

By Region

  • North America
  • Western Europe
  • East Asia
  • South Asia and Pacific
  • Latin America
  • Middle East and Africa
  • Eastern Europe

Scope, Methodology, and Coverage

Every figure in this report is reproducible from documented input assumptions. The scope below maps the historical period, the forecast horizon, the segmentation dimensions, and the countries covered, alongside the underlying primary and qualitative methodology.
Historical Period
2020 to 2025
Forecast Period
2026 to 2036
Base Year
2025 (USD billions; MMA Primary Research Dataset, September 2026)
Market Definition
This report covers dealer management system software, integrated platforms that manage vehicle inventory, sales, finance and insurance processing, service scheduling, parts inventory, and customer records for franchised and independent automotive dealerships. It excludes standalone customer relationship management tools sold apart from core dealership operations software, manufacturer-side inventory allocation systems, and consumer-facing vehicle marketplace platforms not integrated into dealership back-office operations.
Quantitative Units
USD billions (current prices); installed dealership counts where applicable
Segmentation Dimensions
By Delivery Model and Module Type; By End-Use Dealer Type; By Commercial Dimension; By Region
Regions Covered
North America, Western Europe, East Asia, South Asia and Pacific, Latin America, Middle East and Africa, Eastern Europe
Countries Covered
USA, China, Germany, France, UK, Japan, South Korea, India, Australia, Canada, Brazil, Mexico, Indonesia, Vietnam, Thailand, Malaysia, UAE, Saudi Arabia, South Africa, Nigeria, Turkey, Poland, Netherlands, Italy, Spain, Sweden, Switzerland, Argentina, Colombia, Singapore, and additional markets relevant to this sector
Key Companies Profiled
CDK Global LLC, Reynolds and Reynolds Company, Cox Automotive Inc, Solera Holdings LLC, Tekion Corp, PBS Systems Inc, DealerBuilt LLC, ProMax Unlimited Inc, Frazer Computing Inc, Wayne Reaves Software Inc, Quorum Information Technologies Inc, Dominion Dealer Solutions Inc, AutoRaptor CRM LLC, Autosoft Inc, Karmak Incorporated, Dealer-FX Group Inc, eLEND Solutions Inc, ARI Network Services Inc, Fullpath Inc, Podium Corporation
Quantitative Methodology
Primary survey, n=3,800 respondents, Q4 2025, six countries; demand-side model with trade association cross-validation
Qualitative Methodology
47 expert interviews, Q4 2025; applied to validate demand model assumptions, identify emerging dynamics, and assess competitive positioning
Report Format
PDF and XLSX data workbook (Word format preview document)
Publisher
Market Minds Advisory
Report Code
MMA-2026-AUT-101
Published
September 2026
Contact
sales@marketmindsadvisory.com | www.marketmindsadvisory.com

Purchase the full Dealer Management System Market Report (2026 to 2036).

The full report delivers a complete quantitative and qualitative assessment of the dealer management system market through 2036, including segment-level sizing across all six delivery model and module categories and country-level detail across thirty markets. It profiles twenty vendors with comparative positioning on cloud migration progress, open data compliance, and electric vehicle service readiness. Analysts also model three forecast scenarios against open data mandate pace and dealer consolidation trends. Buyers receive the underlying data tables, primary survey results from 3,800 respondents, and 47 expert interviews supporting every forecast assumption in the report.
Segment-level sizing across six delivery model categories
Country-level data across thirty covered markets
Comparative competitive profiles of twenty vendors
Primary survey results from 3,800 respondents
Expert interview transcripts from 47 professionals
Five-year revenue lever and margin analysis

Built For The People Who Decide

From boardroom strategy to bench-side execution, this report is read cover-to-cover by leaders shaping the next decade of their industry, turning demand scenarios, market dynamics and valuation benchmarks into decisions.
CXOs/ Presidents/ VPs/ Managers
M&A and Corporate Development
Strategy Teams and R&D Heads
Procurement and Product Directors
Regulatory and Compliance Leaders
Investor Relations and Equity Analysts