Market Minds Advisory
DDoS Protection and Mitigation Security Market

DDoS Protection and Mitigation Security Market: DDoS Protection and Mitigation Security Market: Scrubbing Services, Application Layer Defence and Carrier Protection, 2026 to 2036

Buyers still procure on scrubbing capacity measured in terabits, and volumetric floods are not what takes services down. Small, cheap request floods that look entirely legitimate cause most outages now.

Lead Analyst

Published

September 2026

Make Smarter Decisions with Customized Research Insights

Request a free sample report and evaluate market opportunities, growth trends, and competitive dynamics relevant to your business needs.

2025 MARKET VALUE$4.8BMarket Size 2025
2036 FORECAST VALUE$14.0BBase Case , 2026 to 2036
CAGR 2026 TO 203610.2 %Bull 11.4% / Bear 9.0%
INCREMENTAL OPPORTUNITY$8.7BNet 10- year value creation
EXPANSION MULTIPLE2.64x2036 value over 2026 base
Strategic Levers
M&A Pipeline
Regional Outlook
Country Rankings
Competitive Intelligence
Segmental Deep-dive
Call-Us : 91 93563 13602

Executive Snapshot and Market Trajectory.

Roughly 71% of service outages attributed to denial of service attacks are caused by request floods rather than by traffic volume. The multi-terabit attacks that generate headlines are absorbed routinely. Buyers still specify protection in terabits per second, and that number predicts almost nothing about whether they stay online.
Content delivery integrated protection grows at 15.3%, half again the market rate of 10.2%, because filtering at the same edge that already serves the traffic removes the diversion step entirely. Application layer and interface protection follows closely behind it. North America holds 32% of contracted spend, on enterprise security budgets and target concentration arriving together. Bundled protection is reshaping who pays separately for any of this.
Five providers hold 57% of contracted spend, and the barrier is network capacity and peering rather than detection technology. The uncomfortable figure is that 62% of customers have never exercised their mitigation outside an incident, so the first genuine test of a subscription is usually the attack it was bought to survive, which is a poor way to discover a misconfiguration. Testing requires diverting production traffic, which nobody wants to schedule deliberately.
Market Definition
This market covers services and products defending networks and applications against denial of service attacks, including on-premise mitigation appliances, always-on cloud scrubbing services, content delivery integrated protection, carrier and internet provider protection, application layer and interface protection, and hybrid managed mitigation services. It excludes general web application firewalls sold without mitigation capability, bot management products, network firewalls, intrusion detection systems, and broader managed security service contracts.
Base Year Value
$4.8B in 2025 (MMA Primary Research Dataset, September 2026)
Forecast Period
2026 to 2036, eleven discrete annual values
CAGR
10.2% base case. Bull 11.4%. Bear 9.0%.
Fastest Growth Segment
Content Delivery Integrated Protection: 15.3% CAGR
Fastest Growth Country
India: 14.6% CAGR
Fastest Growth Region
South Asia and Pacific: 12.3% CAGR
Largest Region
North America: 32% of 2025 global value
Market Leaders
Cloudflare, Akamai Technologies, Amazon Web Services, Radware, and NETSCOUT lead the field. Source: MMA Primary Research Dataset, July 2026.
Primary Survey
n=3,800 procurement and R&D decision-makers, Q4 2025, six countries
Methodology
Demand-side build-up, cross-validated against public data, 47 expert interviews

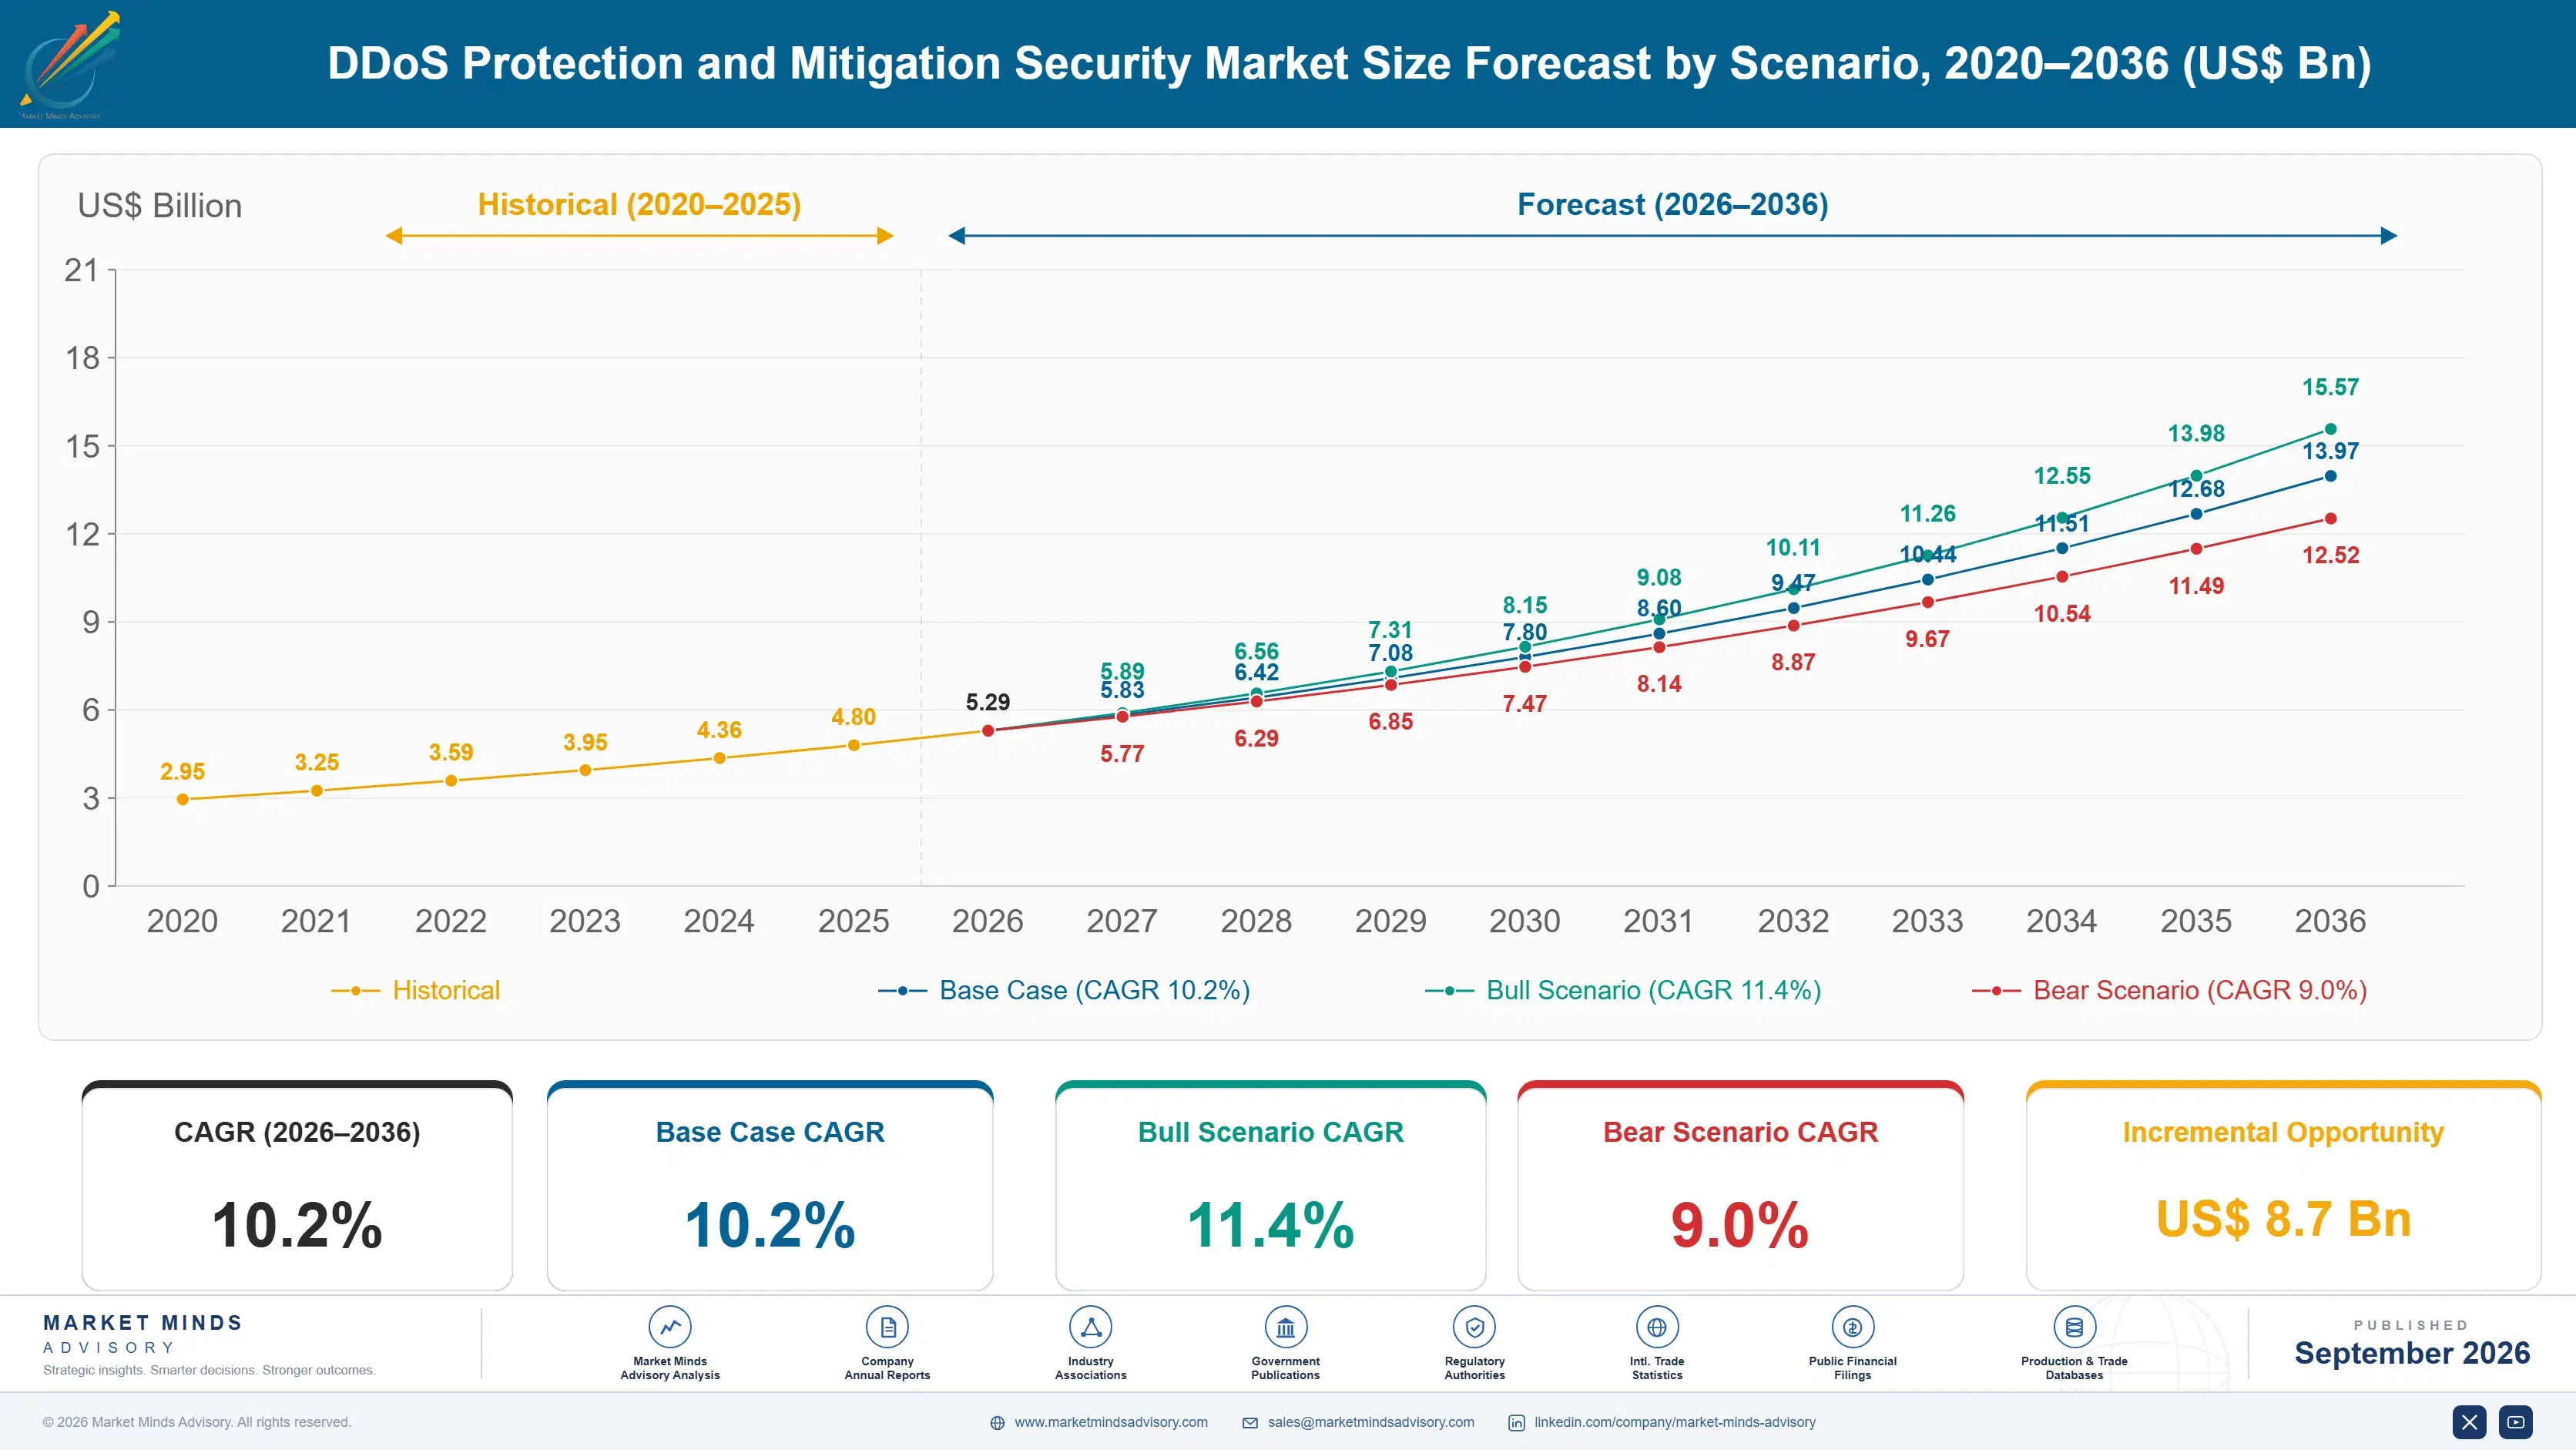
DDoS Protection and Mitigation Security Market Forecast Scenarios

ddos-protection-and-mitigation-security-market-size-forecast-scenario-1790007911385
Growth between 2020 and 2025 followed attack economics rather than defensive innovation. Rented attack capacity became cheap enough that almost anybody could launch a substantial flood, while the largest volumetric events grew faster than any single enterprise could absorb alone. Historical growth of 9.1% reflects steady cloud scrubbing adoption as appliances stopped being sufficient alone.
The base case at 10.2% rests on three mechanisms. Application layer attacks continue displacing volumetric ones as the practical cause of outages, which pulls spending toward defences that inspect request behaviour rather than measure bandwidth. Interface exposure keeps expanding as organisations publish more programmable endpoints than they can inventory. And regulatory availability requirements in financial services and critical infrastructure convert protection from a discretionary purchase into a documented obligation. Attack volumes need not rise for any of it.
The bull case at 11.4% depends on availability becoming an explicitly supervised requirement across more regulated sectors, which would remove the option to under-buy protection quietly. The bear case at 9.0% is bundling: the largest cloud and content delivery platforms include mitigation with services customers already purchase, and if that inclusion becomes comprehensive the standalone market compresses toward carrier and regulated segments alone.

Terabits Stopped Predicting Outages

The industry sells against a threat that has largely stopped being the problem. Volumetric floods peaking above six terabits per second are absorbed by any competent scrubbing network without the customer noticing, and yet capacity in terabits remains the headline specification in almost every procurement. Around 71% of actual outages come from request floods that consume application resources rather than bandwidth. The headline specification measures the wrong thing entirely.
TOP FIVE CONCENTRATION57%Share of contracted spend held by the leading providers
LARGEST OBSERVED ATTACK6.4 TbpsPeak volumetric flood recorded during the measurement period
APPLICATION LAYER OUTAGE SHARE71%Service outages caused by request floods rather than raw volume
MEDIAN TIME TO MITIGATE38 secondsInterval from detection through to traffic diversion under attack
UNTESTED DEPLOYMENT SHARE62%Customers who have never exercised mitigation outside a live incident
AVERAGE ANNUAL CONTRACTUSD 84,000Typical enterprise subscription across all protection delivery models
Those attacks are cheap, small, and difficult to distinguish from real users. A few thousand well-formed requests against an expensive database query will exhaust a service that would shrug off a hundred gigabits of junk traffic. Defending them requires understanding what normal application behaviour looks like, which is a different discipline entirely from filtering packets at scale. It is closer to fraud detection than to packet filtering.
The other uncomfortable number is 62%. That is the share of customers who have never exercised their mitigation outside a live incident, so configuration errors, stale routing, and forgotten certificate dependencies are discovered under attack. Providers know this, and a surprising number have not made testing straightforward enough that customers actually do it. Testing has to be made easy before anybody does it.
"Every procurement document asks how many terabits the network can absorb. Almost none ask how the service behaves against fifty thousand requests a second that all look like customers. The second question is the one that decides whether you have an outage, and hardly anybody is asking it."
Practice Director, Network Security and Availability · MMA Technology Practice · September 2026

Market Trends

Attacks Moved From Bandwidth To Application Behaviour

Filling a pipe is expensive for an attacker and increasingly futile against scrubbing networks built for it, while exhausting a database connection pool costs almost nothing and works. Around 71% of outages now come from request floods that arrive at ordinary volumes and look like legitimate traffic. Defence requires behavioural modelling of what normal application use looks like, which is closer to fraud detection than to packet filtering. Providers whose capability was built around capacity are having to acquire or rebuild an entirely different technical discipline to stay relevant. Capacity heritage helps very little here.
Market Impact: Involves 34% of contracts
Edge Filtering Removes The Diversion Step Entirely

Traditional scrubbing diverts traffic to a cleaning centre and returns it, which adds latency, requires routing changes, and introduces the failure modes that make untested deployments dangerous. Filtering at a content delivery edge that already carries the traffic removes all of that, because the packets were passing through anyway. Content delivery integrated protection grows at 15.3% on that argument. It also means protection arrives bundled with delivery, which is convenient for the customer and awkward for anybody selling mitigation as a standalone product. Bundled adequacy is awkward for anybody selling mitigation as a standalone product.
Market Impact: Segment grows at 13.8%

Market Opportunities and Growth Drivers

Availability Requirements Enter Regulated Sector Supervision

Financial services and critical infrastructure supervisors in several jurisdictions now examine operational resilience directly, and availability under attack is part of what they inspect. That converts protection from a security team preference into a documented obligation with evidence requirements attached. Roughly 34% of enterprise contracts now involve compliance or risk functions in the purchasing decision, up sharply across three years. Those buyers ask about tested response times and audit records rather than about capacity figures, which suits providers with mature reporting. Capacity figures interest these buyers considerably less than audit records do.
Market Impact: Affects 62% of customers

Programmable Interface Exposure Outruns Organisational Inventory

Organisations publish more programmable endpoints than they can list, and each one is a potential target that no perimeter control covers because it was never registered anywhere. Application layer and interface protection grows at 13.8% on that gap. Discovery has become part of the product, since defending an endpoint requires knowing it exists, and providers increasingly find interfaces the customer's own teams had forgotten. That discovery finding is frequently what converts an evaluation into a purchase, more reliably than any performance demonstration. Establishing a problem the buyer did not know they had is what closes these evaluations.
Market Impact: Removes 100% of mid-market contention

Market Restraints and Challenges

Most Customers Never Test Mitigation Before An Incident

Around 62% of customers have never exercised their protection outside a live attack, and the root cause is that testing requires deliberately diverting production traffic, which nobody wants to schedule. Configuration drift, stale routing announcements, and expired certificate dependencies therefore surface during the incident the subscription was bought to handle. Commercially this produces failures blamed on the provider that were not provider failures at all. Participants respond with simulated attack exercises, continuous configuration validation, and always-on deployment models that remove the diversion step altogether. Nobody schedules the test voluntarily. Blame falls on the provider.
Market Impact: Causes 71% of outages

Platform Bundling Erodes Standalone Purchase Justification

Large cloud and content delivery platforms include mitigation with services customers already buy, and the root cause is that filtering traffic they already carry costs them very little. For adequate protection of ordinary workloads this is genuinely sufficient, which removes the standalone purchase entirely from mid-market accounts. Commercially it compresses the addressable base toward regulated sectors, carriers, and organisations with multi-provider architectures. Participants respond by positioning across providers rather than within one, by anchoring on tested response commitments, and by moving toward application layer depth that bundles do not match.
Market Impact: Grows at 15.3% annually
3 additional market trends, 4 additional growth drivers, and 2 additional restraints and challenges are covered in the full report. Contact sales@marketmindsadvisory.com to access the complete intelligence.

Segment CAGR and Growth Architecture

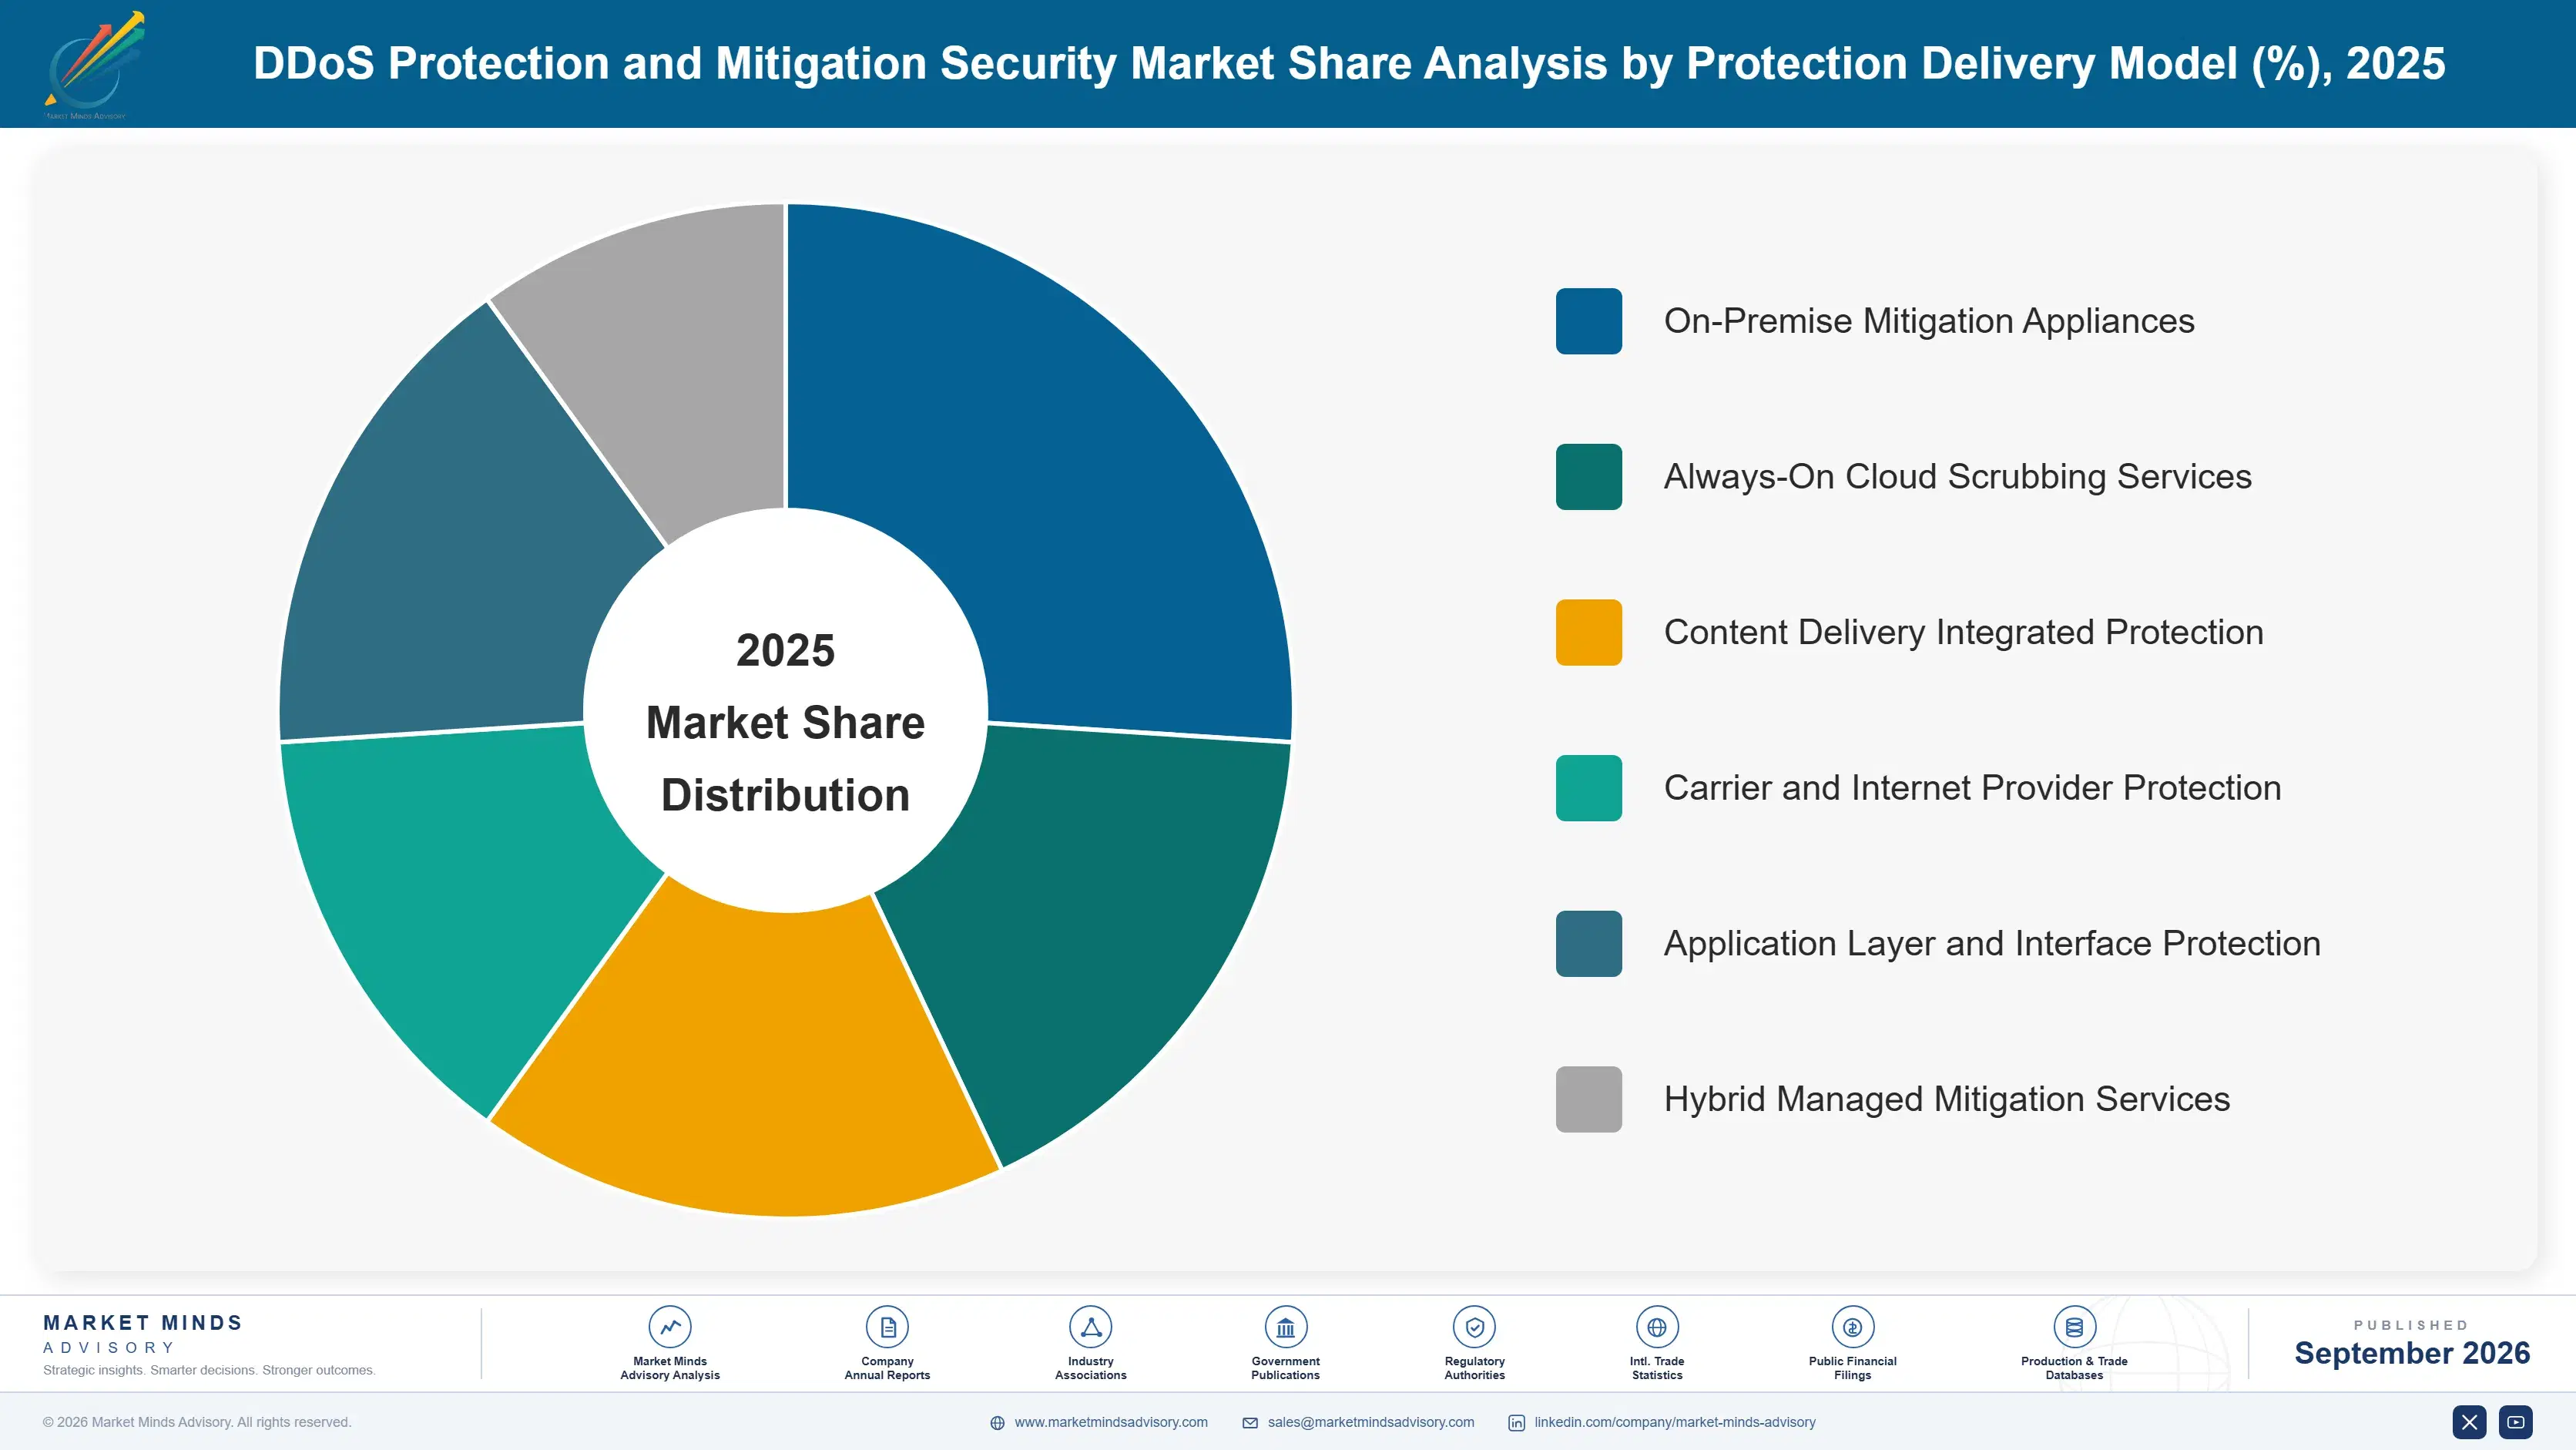
Segmentation follows how protection is delivered. Six categories cover the market: on-premise mitigation appliances, always-on cloud scrubbing services, content delivery integrated protection, carrier and internet provider protection, application layer and interface protection, and hybrid managed mitigation services. Appliance sales are declining while edge and application defences expand. Bundling reshapes the whole category. Appliances keep declining.
ddos-protection-and-mitigation-security-market-market-share-analysis-1790007911954

Content Delivery Integrated Protection

Edge integrated protection grows at 15.3%, half again the market rate of 10.2%, because it removes the step where things go wrong. Conventional scrubbing diverts traffic to a cleaning centre and returns it, which requires routing changes, adds latency, and creates exactly the failure modes that untested deployments discover during an attack. Filtering at an edge already carrying the traffic avoids all of it. The commercial consequence is uncomfortable for specialists, since protection arrives bundled with content delivery the customer was buying anyway, and a bundled adequate defence beats a separate excellent one in most mid-market purchasing decisions. Adequate and included beats excellent and separate. Specialists find that argument very hard to answer.
CAGR 15.3%

Application Layer And Interface Protection

Application layer defence grows at 13.8% because this is where outages actually originate. A few thousand well-formed requests against an expensive query will exhaust a service that ignores a hundred gigabits of junk, and telling those requests from real users requires behavioural modelling closer to fraud detection than to packet filtering. Endpoint discovery has become part of the product, since organisations publish more programmable interfaces than they can inventory, and providers routinely find endpoints the customer's own engineering teams had forgotten. That discovery finding converts evaluations into purchases more reliably than any performance demonstration does. Behavioural modelling of normal application use is the capability that actually matters, and it takes years to build properly.
CAGR 13.8%
Full segment breakdown across 6 segments available in the complete report.

Regional Architecture and Country Demand Map

Regional shares reflect where protection is contracted and paid for, which follows enterprise security budgets and the concentration of attractive targets rather than where attack traffic actually originates. The two are largely unrelated, so this table looks nothing at all like an attack map. Read it accordingly.

North America

Enterprise security budgets and target concentration coincide here, which is why the region leads on contracted spend without leading on attack volume. Financial services, gaming, and technology platforms account for most of it, and operational resilience supervision has moved availability from a security preference into a documented obligation for regulated institutions. Growth of 9.4% is the slowest outside Europe, because penetration among large enterprises is already high and platform bundling is removing mid-market purchases faster here than anywhere else. Providers compete on tested response commitments rather than on capacity figures. Mid-market purchases are disappearing into bundles faster here than anywhere else covered. Providers compete on tested response commitments. Capacity figures persuade nobody.
Share: 32% | CAGR: 9.4% (2026 to 2036)

East Asia

Gaming is the defining application in this region and it shapes everything about how protection is bought. Korean, Japanese, and Chinese online gaming operators face sustained competitive attacks that are commercially motivated rather than opportunistic, and they buy against response time in seconds because a lagging game loses players permanently. Chinese demand is served almost entirely by domestic cloud providers. Growth of 11.2% runs above the world rate on gaming volume and on rapid expansion of consumer platform services that present very large attack surfaces to anybody who wants them. Gaming operators buy against response measured in seconds, since a lagging game loses players permanently. Domestic cloud providers serve Chinese demand.
Share: 25% | CAGR: 11.2% (2026 to 2036)
Regional intelligence for 5 additional markets available in the complete report: Western Europe, South Asia and Pacific, Latin America, Middle East and Africa, Eastern Europe. Contact sales@marketmindsadvisory.com.
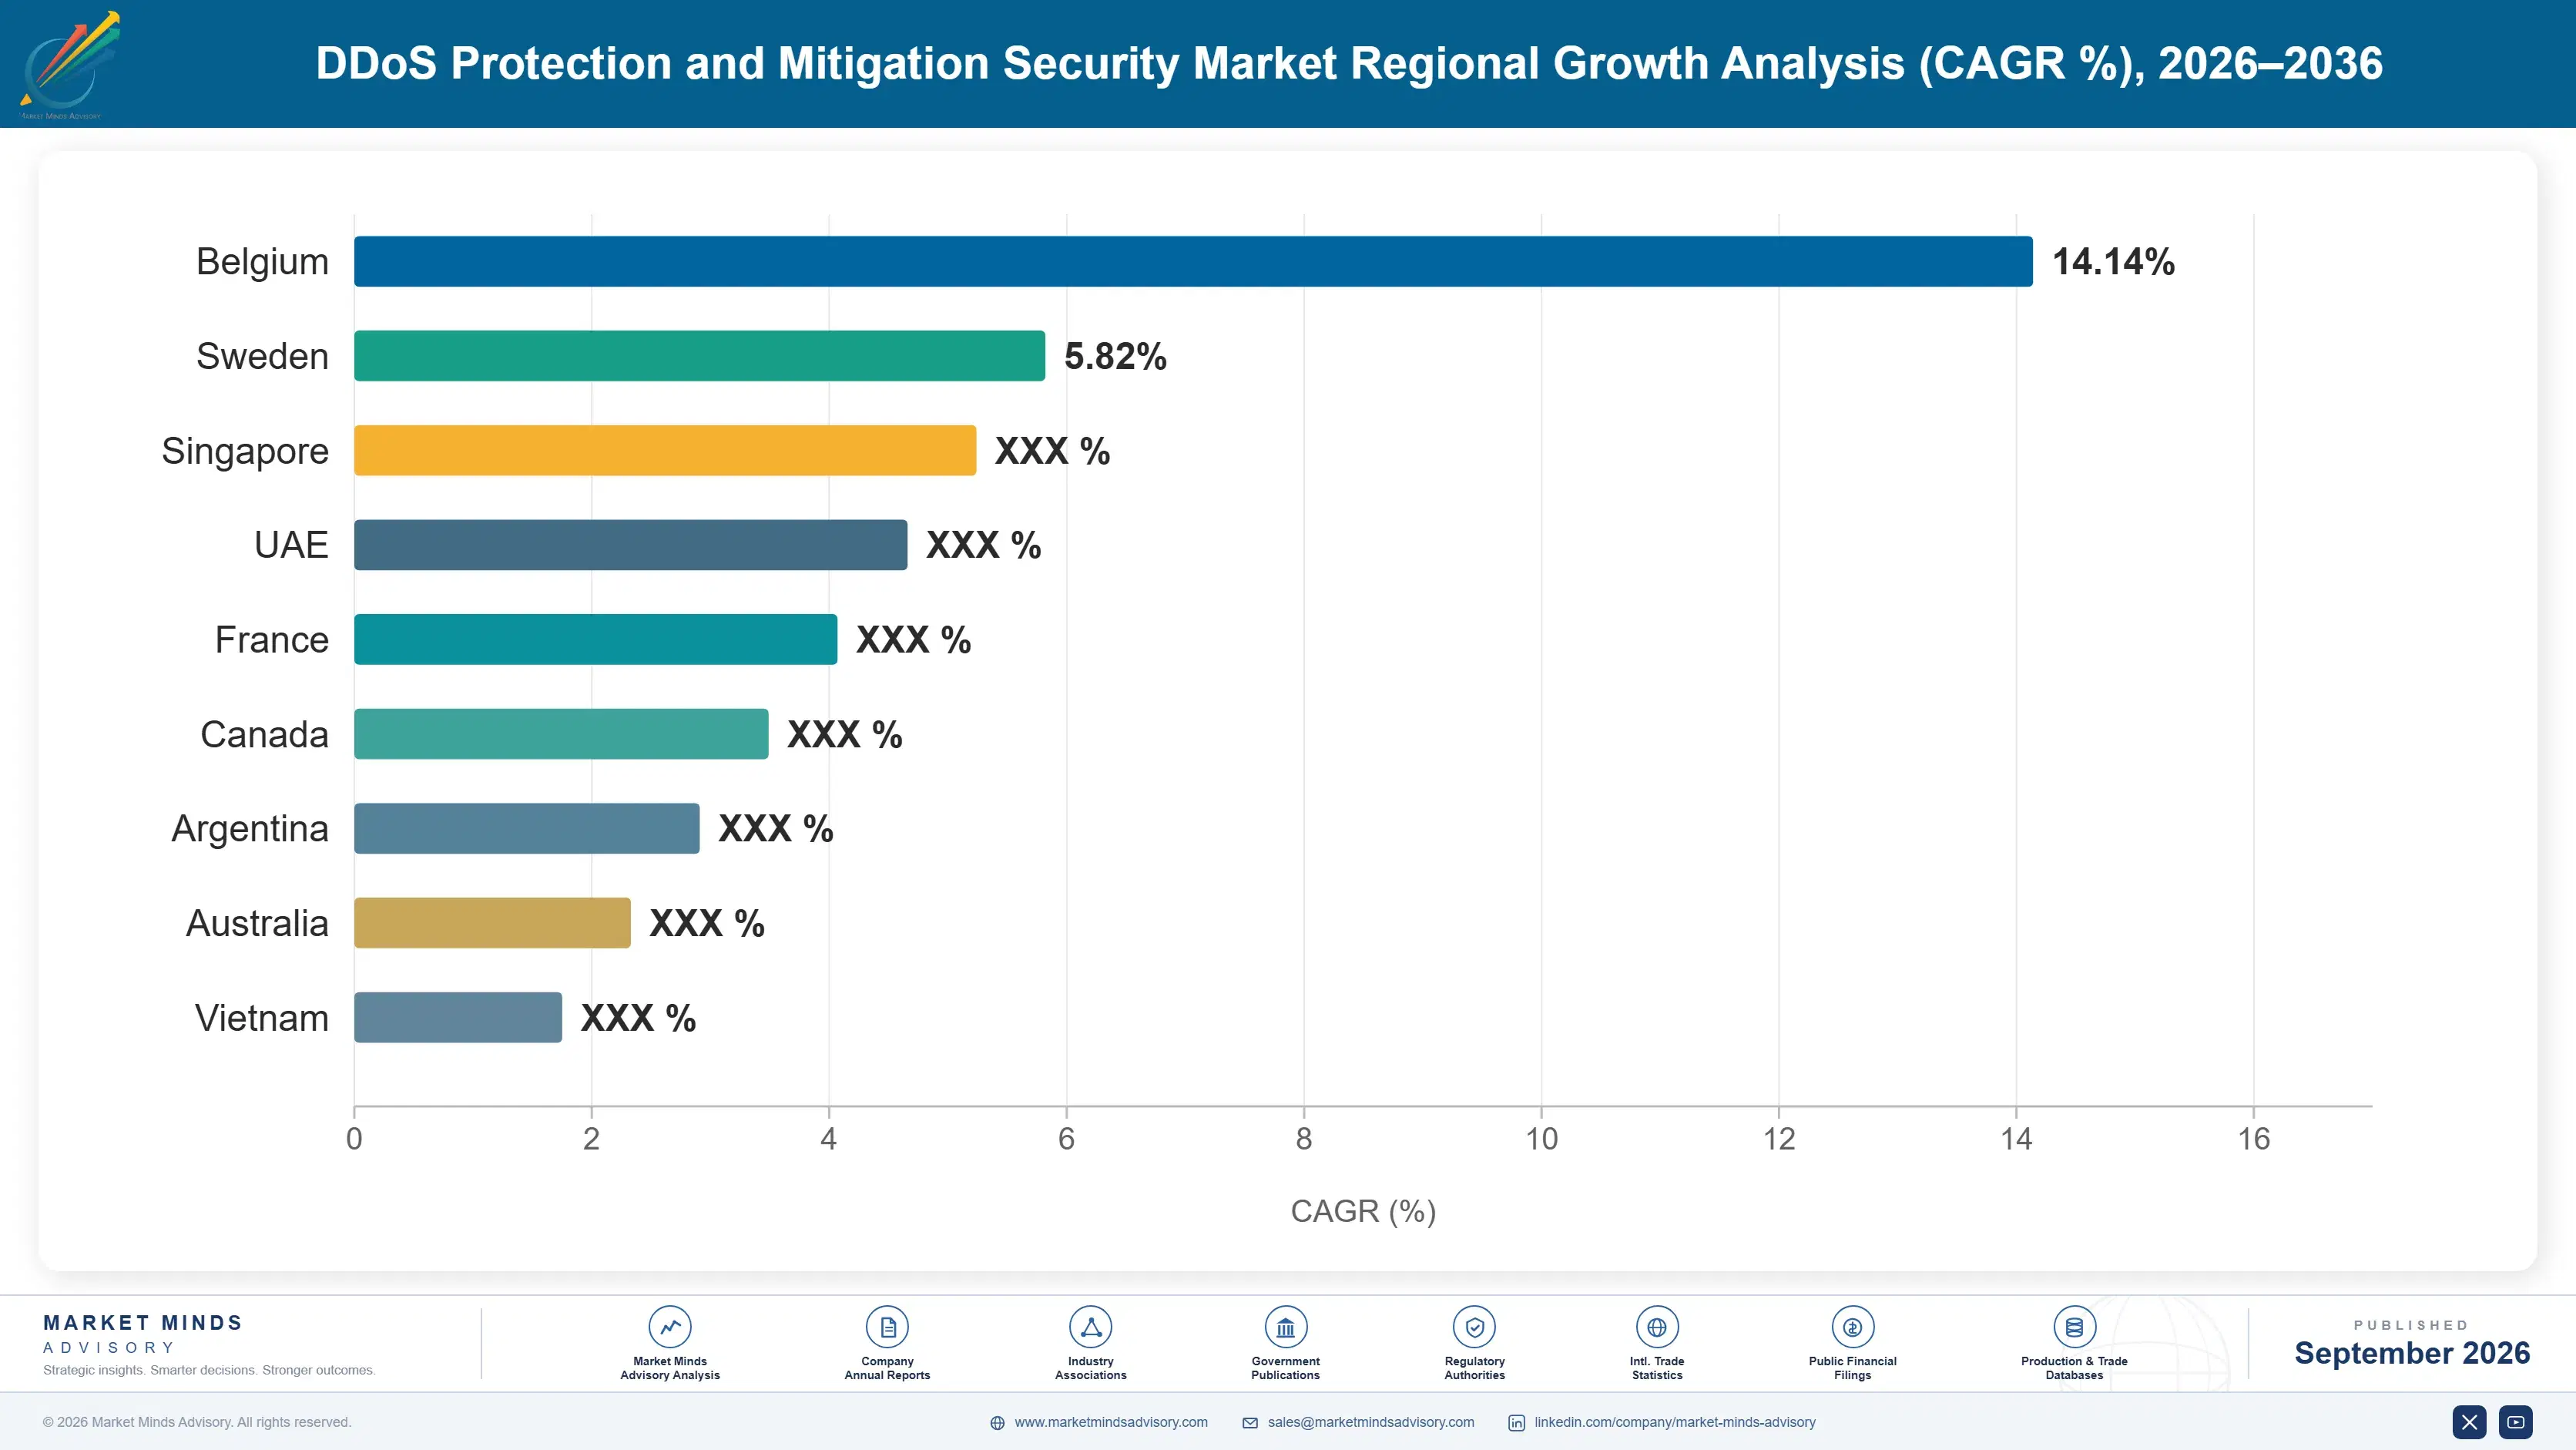
ddos-protection-and-mitigation-security-market-country-cagr-analysis-1790007912480

How Providers Beat Bundled Adequacy

Four commercial moves separate providers holding enterprise budget from those losing quietly to protection included with services customers already buy. Each accepts that adequate defence is now free at the point of decision for ordinary workloads, and looks for the buyers for whom adequate is genuinely not enough. That population is smaller than it was.

Make Testing Routine Rather Than Frightening

Around 62% of customers have never exercised mitigation outside a live incident, so their first genuine test is the attack, and any configuration drift surfaces at the worst possible moment. Providers offering scheduled simulated attack exercises as a standard service element report renewal rates 21 to 29 points higher, because the customer has seen the thing work rather than assumed it. It also converts failures that were customer misconfiguration into findings resolved calmly months earlier. Findings surface calmly months before they would otherwise appear during an incident. Assumption is replaced with evidence.
Market Impact: Lifts renewal rates by 21 to 29 points

Sell Application Behaviour Not Scrubbing Capacity

Capacity in terabits is the specification every procurement asks for and it predicts almost nothing, since 71% of outages come from request floods at ordinary volumes. Providers reframing evaluations around behavioural detection, and demonstrating against realistic application attacks rather than volumetric ones, win competitive assessments at roughly 2.7 times the rate of those answering the capacity question well. Changing what the buyer measures is harder than winning on their existing metric, and it is the only durable position available. Answering the capacity question well wins nothing durable. The metric itself has to change.
Market Impact: Wins 2.7 times more competitive evaluations than rivals

Lead With Endpoint Discovery Before Any Protection

Organisations publish more programmable interfaces than they can inventory, and a discovery exercise routinely surfaces endpoints the customer's own engineering teams had forgotten existed. That finding converts evaluations into purchases far more reliably than any performance demonstration, because it establishes a problem the buyer did not know they had. Providers leading with discovery report roughly 3.3 times higher conversion from evaluation to contract, and the exercise costs very little to perform against a prospect's public footprint. Almost no provider leads with it, which is why it keeps working. It costs almost nothing to run.
Market Impact: Converts 3.3 times more evaluations into signed contracts

Position Across Providers Rather Than Within One

Bundled mitigation protects what its own platform carries and nothing else, which leaves any organisation running across several clouds or delivery networks with inconsistent defence and no single view. Independent providers positioning explicitly on multi-provider coverage retain enterprise accounts at 2.2 times the rate of those competing feature by feature against a bundle. The argument only works where the customer genuinely runs multiple providers, which is why qualifying architecture early matters more than qualifying budget does. Qualifying architecture matters more than qualifying budget. Feature comparison against a bundle rarely ends well.
Market Impact: Retains 2.2 times more enterprise accounts than rivals

Who Controls the Margin Pool

Concentration is moderate and the participants are unalike. Five providers hold 57% of contracted spend, measured consistently on that basis across all participants, and they arrive from three directions: content delivery networks, cloud platforms, and security specialists. The gap between the leader and the fifth is wide, and it has widened as network scale has become harder to replicate for anybody starting now. Network scale is harder to replicate now than at any earlier point.
Competition currently turns on three things: application layer behavioural detection, multi-provider coverage for organisations not committed to one platform, and evidence of tested response that regulated buyers can put in front of a supervisor. Scrubbing capacity differentiates very little, since every credible provider absorbs more than any observed attack has required. Every credible provider absorbs more than any observed attack required.

Pressure comes from two directions. Platform bundling removes mid-market purchases before any evaluation begins. Meanwhile specialists with genuine application layer depth are taking regulated enterprise budget from providers whose heritage is volumetric. Rankings will shift toward providers who can demonstrate behaviour-based defence under supervision, which is where the defensible budget sits. That is where the defensible budget actually sits.
ddos-protection-and-mitigation-security-market-company-positioning-matrix-1790007913010

Competitive Moat and Risk Dimensions

CLOUDFLARE

Moat: Edge Network Scale Advantage

A very large global edge network already carrying customer traffic means mitigation happens without diversion, routing changes, or the added latency that conventional scrubbing introduces. Replicating that footprint requires capital and peering relationships accumulated over many years, and the same network serves delivery revenue that funds it independently of security pricing.
CLOUDFLARE

Risk: Bundling Compresses Own Pricing

Including protection with services customers buy anyway is the company's strongest competitive weapon and also the reason standalone security pricing keeps falling across the market. As bundled adequacy improves everywhere, the addressable premium narrows to regulated and multi-provider accounts, which is a considerably smaller pool than the current customer base.
AKAMAI TECHNOLOGIES

Moat: Regulated Enterprise Relationship Depth

Long-established relationships across financial services and government, with audit evidence and reporting built for supervisory examination, suit buyers whose purchasing now involves compliance and risk functions. That evidence position is difficult for newer providers to assemble, since it rests on accumulated incident records rather than on any product capability.
AKAMAI TECHNOLOGIES

Risk: Delivery Business Growth Drag

Security growth sits inside a wider business whose content delivery revenue faces price pressure and competitive intensity of its own, which complicates investment allocation. Competitors focused entirely on security can direct capital toward application layer capability without balancing it against a legacy delivery business under simultaneous margin pressure.

Players Tracked

Prominent Players

Cloudflare
Akamai Technologies
Amazon Web Services
Radware
NETSCOUT

Other Key Players

F5
Imperva
Fastly
Microsoft
Google
Alibaba Cloud
Tencent Cloud
Huawei
Nokia Deepfield
A10 Networks
Corero Network Security
Link11
StormWall
Qrator Labs
Lumen Technologies

Recent Developments

FEBRUARY 2026

Cloudflare Releases Behavioural Detection For Application Layer Floods

Cloudflare released behavioural modelling that distinguishes request floods from legitimate traffic patterns without relying on volume thresholds, addressing the attack class that causes most outages while generating no unusual bandwidth at all. Models are built per application rather than applied from any shared baseline. Thresholds adapt continuously.
Signal: Detection is moving toward fraud style behavioural modelling rather than any form of volumetric measurement at all.
SEPTEMBER 2025

Akamai Technologies Awarded Resilience Contract By Financial Group

Akamai Technologies was selected by a European financial services group under operational resilience requirements, with the award specifying tested response times and supervisory audit evidence rather than any headline scrubbing capacity figure. Quarterly simulated exercises form a contractual element of the agreement. Reporting formats were agreed in advance.
Signal: Regulated buyers now specify tested evidence, which strongly favours providers already holding accumulated incident reporting records.
MAY 2025

A10 Networks Acquires Application Layer Detection Specialist

A10 Networks completed an acquisition of an application layer detection company, adding behavioural capability to a portfolio built around volumetric mitigation as outage causes continue shifting away from bandwidth exhaustion entirely. The acquired team works on request pattern analysis rather than on traffic volume. Integration is already underway.
Signal: Volumetric heritage providers are buying behavioural capability because rebuilding it internally would take far too long.

What Running Mitigation Costs

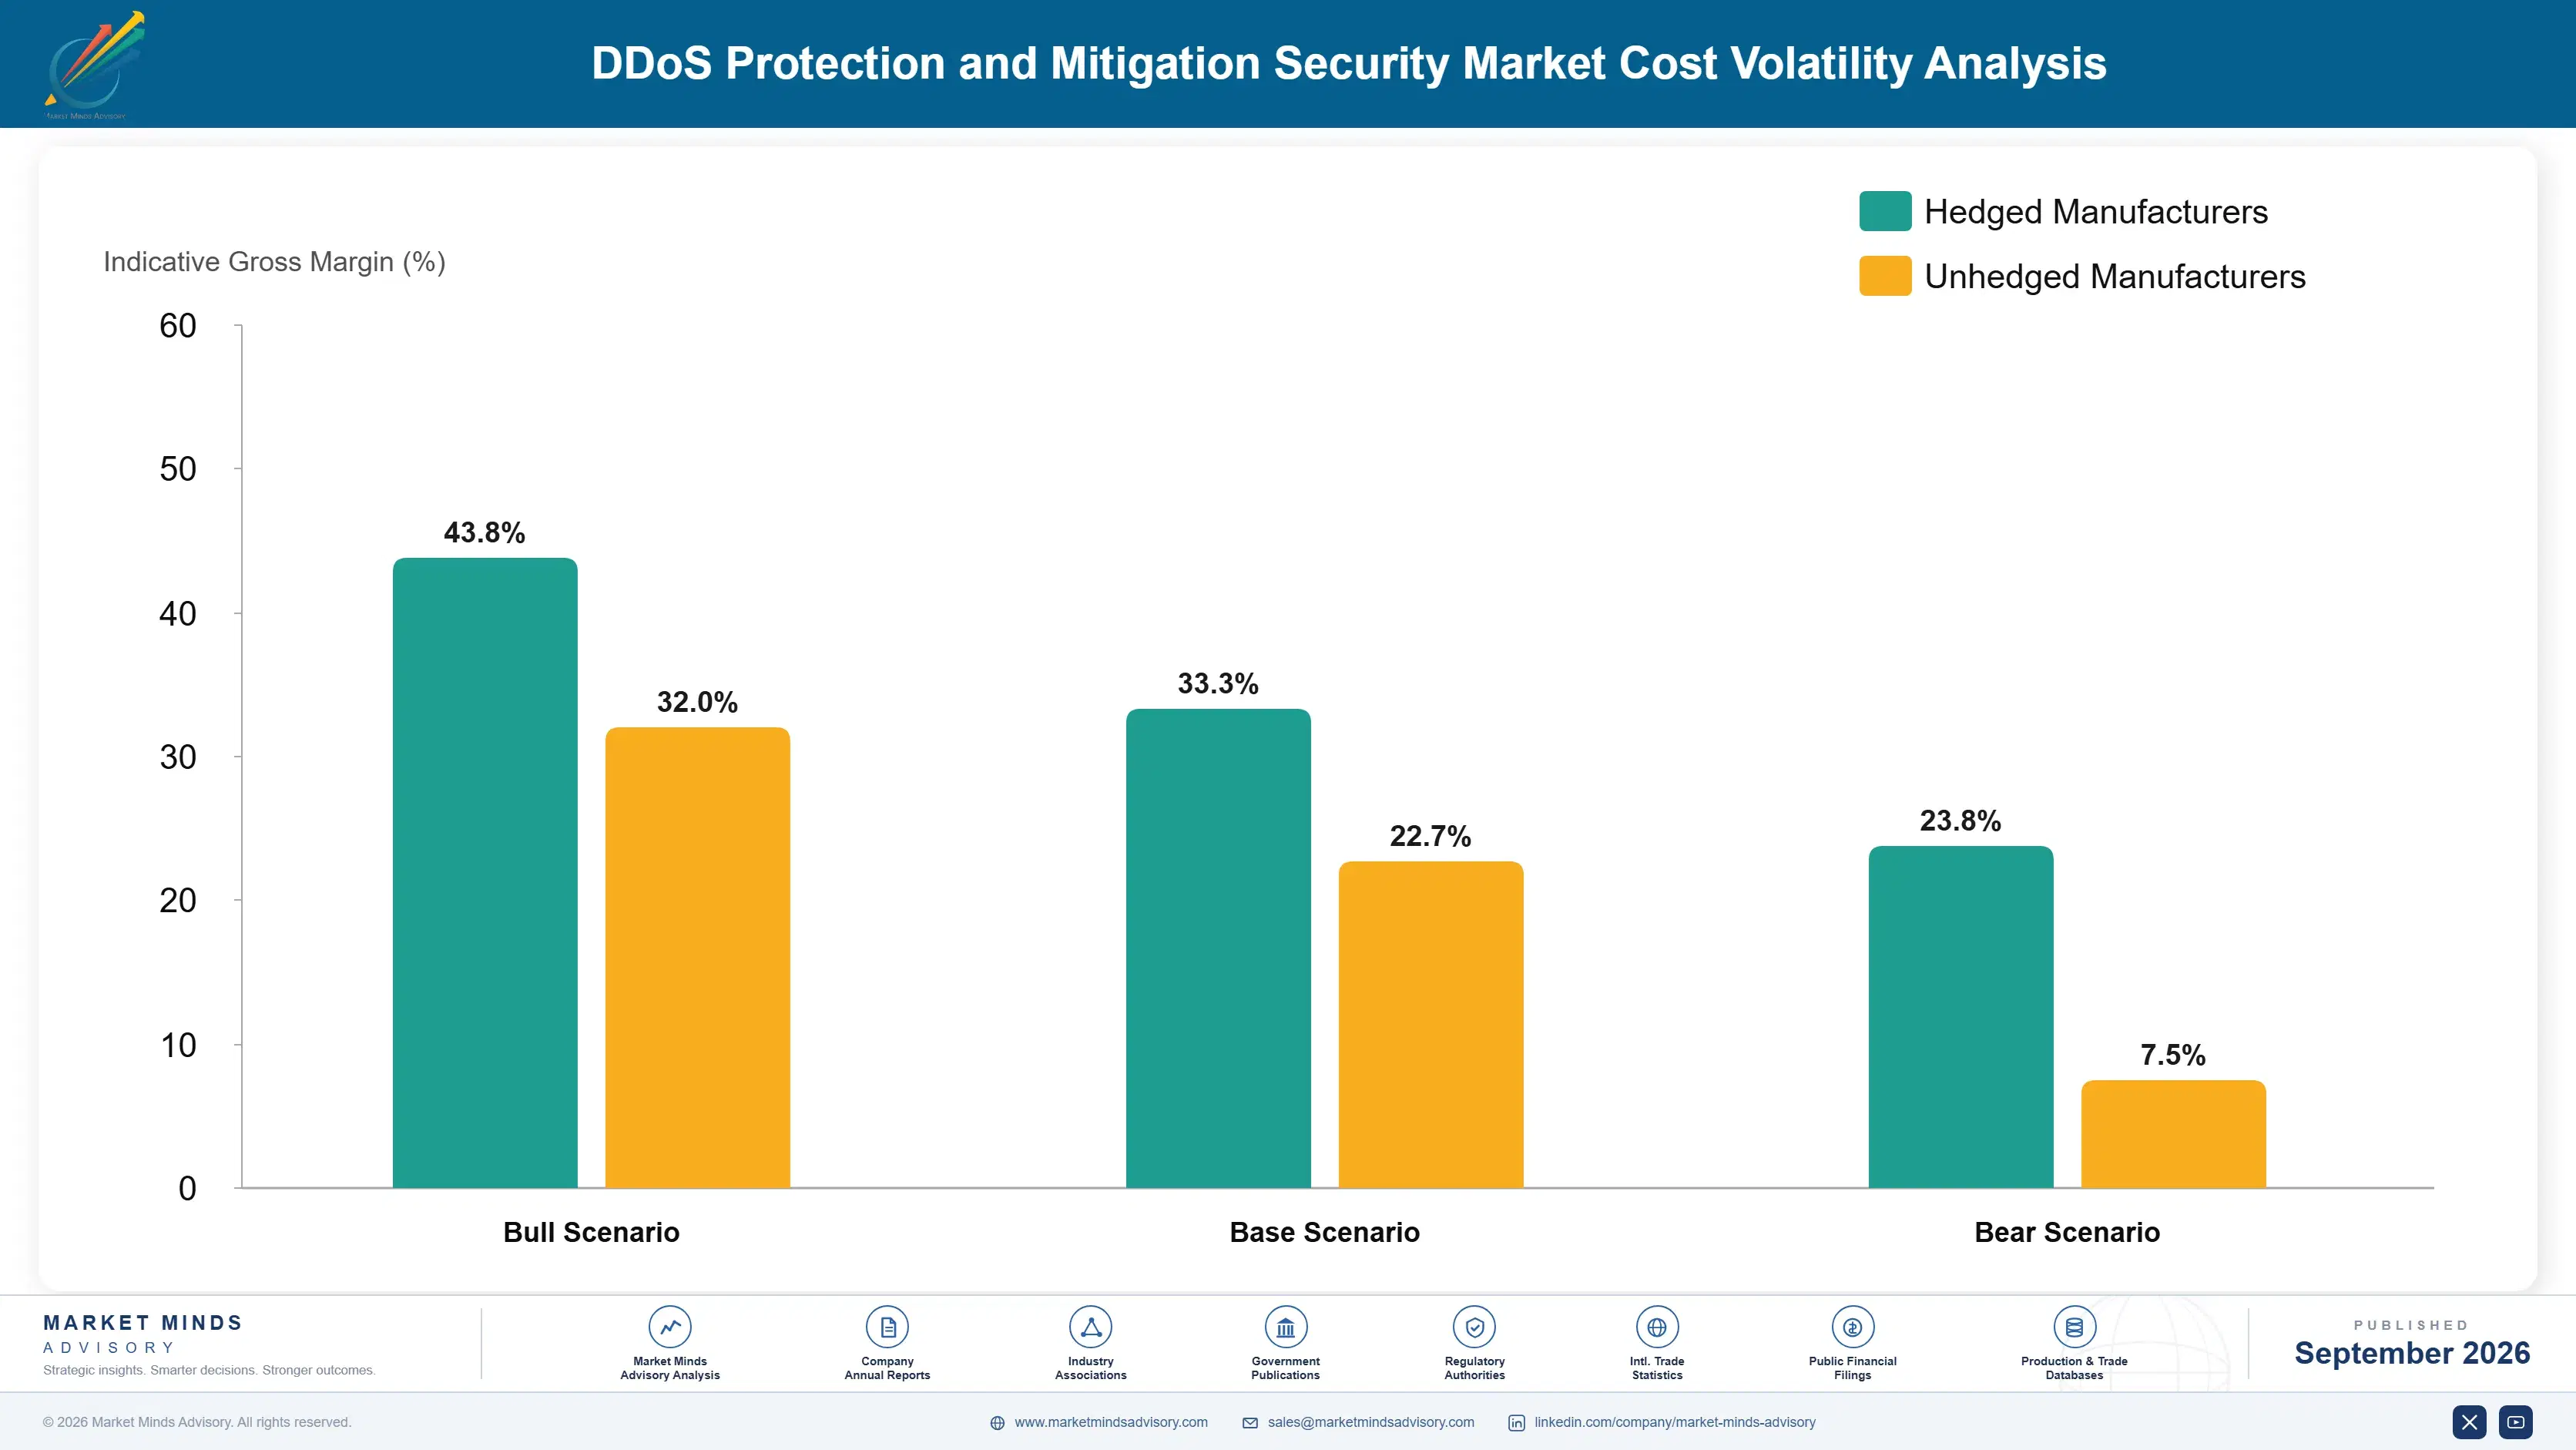
Three inputs dominate provider cost. Network capacity, transit, and peering run 32% to 40% of cost of goods sold, since a scrubbing network must carry far more capacity than it ordinarily uses. Scrubbing infrastructure and hardware amortisation takes 20% to 26%. Security operations staffing, which must be continuously available, adds a further 18% to 24%. Capacity is bought against peak attack scenarios rather than against normal traffic.
Electricity costs at network facilities rose materially through 2024 and 2025, documented in EIA electricity data across the relevant commercial rate classes, and several providers described the resulting operating cost pressure in their annual reports for those years. Standby capacity is expensive precisely because it is idle most of the time, and its cost does not fall when attack volumes happen to be low in a given quarter.

The competitive disadvantage mechanism runs through network reuse rather than through scrubbing efficiency. A provider whose network carries paying delivery traffic funds its capacity twice, while a pure security provider funds identical capacity from security revenue alone. Exposure varies by participant type. Content delivery and cloud platforms carry mitigation as marginal cost. Security specialists carry the full network economics against a smaller revenue base.
ddos-protection-and-mitigation-security-market-cost-volatility-analysis-1790007913206

Reuse Network Capacity Across Delivery And Security

Standby capacity bought purely for attack absorption sits idle and earns nothing between incidents, which is the hardest cost line in this business to justify. Providers whose networks also carry delivery or transit traffic fund the same capacity from two revenue streams, and that overlap is the clearest reason platform providers price mitigation the way they do.

Automate Common Attack Class Response Fully

Continuously available security operations staffing is expensive and scales with customer count if every event requires human judgement. Automating response to well-understood attack classes lets analysts concentrate on genuinely novel activity, and providers who invested report handling several times more customers per analyst without any reduction in response quality. Novel activity still needs human judgement.

Place Scrubbing Capacity Inside Residency Boundaries

Regulated buyers in Europe and the Gulf increasingly refuse arrangements that route traffic outside their jurisdiction for cleaning, which excludes providers without local capacity regardless of technical merit. Building capacity inside those boundaries costs real capital and opens procurement that would otherwise be closed before any evaluation begins. Technical merit counts for nothing without it.

Portfolio Architecture for Margin Defence

Margin follows what a bundle cannot supply. Volumetric scrubbing is close to commodity now, since every credible provider absorbs more than any observed attack has needed and platform bundles include adequate capability free. Multi-provider coverage earns better. Application layer behavioural defence and supervised resilience evidence earn most, because neither arrives with a delivery subscription and both require capability that takes years to build. What the bundle covers sets the floor.
The tension between volume and premium runs through customer size. Mid-market accounts have effectively left the standalone market, protected adequately by whatever their platform includes, so pursuing them consumes sales cost against revenue that keeps falling. Enterprise and regulated accounts pay properly but require evidence, testing, and reporting infrastructure that only scales across a substantial customer base. Evidence infrastructure only scales across a substantial base.

High-value pools concentrate where inadequate defence has a specific price: regulated institutions under operational resilience supervision, gaming operators losing players to latency within minutes, and payment infrastructure where an outage is immediately visible to consumers. These share a buyer who can quantify downtime. Where downtime is merely inconvenient, the bundle is sufficient and the buyer knows it.

Volume / Commodity-Adjacent

Volumetric scrubbing and basic always-on protection where every credible provider exceeds observed attack requirements and platform bundles include adequate capability at no separate charge. The ten-point range reflects whether the provider reuses network capacity across delivery revenue.
Gross Margin: 38% to 48%

Premium / Certified

Multi-provider coverage, hybrid managed mitigation, and carrier protection where architecture or scale places the requirement beyond any single platform bundle. The nine-point range separates providers with automated response from those staffing every event with analyst judgement.
Gross Margin: 58% to 67%

Sustainability / Regulatory / Next-Generation

Application layer behavioural defence, endpoint discovery, and supervised resilience evidence for regulated institutions. None of it arrives with a delivery subscription and capability takes years to build. The ten-point range reflects how differently providers price accumulated incident reporting records.
Gross Margin: 69% to 79%
ddos-protection-and-mitigation-security-market-portfolio-architecture-1790007913705

High-value Sub-segments and Strategic Watch-out

Application Layer Behavioural Defence

Highest value and strong growth at 13.8%, addressing the request floods behind roughly 71% of outages that volumetric capacity never touches. Detection resembles fraud modelling rather than packet filtering. The ten-point range reflects how few providers hold genuine behavioural capability today. Capability is genuinely scarce.
Gross Margin: 70% to 80%

Edge Integrated Protection Delivery

Fastest growth at 15.3%, removing the diversion step where untested deployments fail during real attacks. Protection arrives bundled with delivery the customer already buys. The ten-point range separates providers reusing network capacity from those funding it through security revenue alone. Delivery revenue funds the network.
Gross Margin: 62% to 72%

Regulated Resilience Contracts

High value, involving compliance and risk functions in roughly a third of enterprise decisions and specified on tested response and audit evidence. Accumulated incident records cannot be assembled quickly. Data residency requirements exclude providers without local scrubbing capacity entirely. Local capacity is a precondition. Evidence takes years.
Gross Margin: 64% to 74%

Mid-Market Volumetric Subscriptions

The strategic watch-out. Platform bundles protect ordinary workloads adequately at no separate charge, and buyers have worked that out. The fourteen-point range reflects the gap between providers with reusable network capacity and specialists carrying full network economics against falling prices. Sales cost exceeds the revenue.
Gross Margin: 31% to 45%

Why These Subscriptions Renew

Renewal here is driven by fear and by inertia in roughly equal measure, which produces stability that looks stronger than the underlying commercial position. A customer who has never been attacked has no evidence the subscription is worth anything, and a customer who has been attacked has every reason to keep it. The 62% who have never tested their mitigation sit uncomfortably between those two states.
Commitment depth varies sharply by consequence of downtime. Payment infrastructure and regulated institutions embed deeply, because outage carries supervisory and reputational cost that dwarfs any subscription. Gaming operators are similarly committed, losing players permanently within minutes of latency. General enterprise buyers are the least attached, and they are exactly the population platform bundling is removing from the standalone market.

The buyer profile has moved upward and sideways. Network and security engineers once selected on capacity and detection features, and they still evaluate. Compliance and risk functions now participate in roughly a third of enterprise decisions, asking about tested response and audit evidence, while procurement compares subscription cost against a bundle that appears to cost nothing. Selling to the engineer alone increasingly reaches the least influential participant.
ddos-protection-and-mitigation-security-market-end-use-penetration-index-1790007914199

Where This Market Rewards

These are among the four positions where our research anticipates prominent divergence between winners and laggards over the coming forecast period. Each is grounded in the demand model, the regulatory perimeter, and the announced capacity pipeline.
01 / THREAT REALITY ALIGNMENT

Capacity in terabits predicts almost nothing now

Roughly 71% of outages attributed to denial of service come from request floods arriving at entirely ordinary volumes, while multi-terabit events are absorbed without customers noticing. Providers reframing evaluations around behavioural detection and demonstrating against realistic application attacks win competitive assessments about 2.7 times more often than those answering the capacity question well. Changing what a buyer measures is harder than winning on their existing metric, and it is the only durable position, and the one worth the effort of changing.
02 / TESTED RESPONSE EVIDENCE

Most customers first test mitigation during the attack

Around 62% of customers have never exercised protection outside a live incident, so configuration drift, stale routing, and forgotten dependencies surface at the worst possible moment and get blamed on the provider. Offering scheduled simulated exercises as a standard service element lifts renewal rates 21 to 29 points, because the customer has watched it work rather than assumed it. Regulated buyers now demand exactly this evidence anyway, so the exercise sells itself into regulated accounts without much persuasion required from the provider.
03 / DISCOVERY LED SELLING

Finding forgotten endpoints beats any performance demonstration

Organisations publish more programmable interfaces than they can inventory, and a discovery exercise against a prospect's public footprint routinely surfaces endpoints their own engineering teams had forgotten existed. That converts evaluations into contracts roughly 3.3 times more often than performance demonstrations do, because it establishes a problem the buyer did not know they had. The exercise costs very little and almost no provider leads with it, which makes it close to free business development for anybody willing to try it.
04 / BUNDLE ESCAPE POSITIONING

Adequate and free beats excellent and separate

Platform bundles protect ordinary workloads sufficiently at no additional charge, which has removed mid-market accounts from standalone contention entirely and buyers understand this perfectly well. What a bundle cannot cover is an organisation running across several clouds or delivery networks, where defence is inconsistent and nobody holds a single view. Providers positioning explicitly on multi-provider coverage retain enterprise accounts 2.2 times more reliably than feature comparison achieves, provided the customer genuinely runs more than one platform in the first place.

Engagement Snapshot From the Field

A live engagement with an industry participant carrying material or product regulatory and market exposure ahead of a defining policy shift, showing how our research translates into a defensible multi-year portfolio strategy.
MARKET MINDS ADVISORY · CLIENT ENGAGEMENT SUMMARY
DDoS Protection and Mitigation Security Producer Strategic Portfolio Review and Transition Roadmap 2026·Investment Scenario on DDoS Protection and Mitigation Security Exposure Evaluation 2025-26
CLIENT PROFILE
A regional payment infrastructure operator processing approximately 190 million transactions monthly across retail and instant transfer services, under supervisory operational resilience requirements. Annual technology budget exceeded USD 260 million (client-reported, unverified by MMA). Protection had been procured five years earlier on scrubbing capacity, and no live test had been conducted since the original commissioning. No live test had run since original commissioning.
STRATEGIC CHALLENGE
Two brief outages in eighteen months had produced supervisory questions the operator could not answer, since neither incident involved volumetric traffic and the mitigation service had not triggered at all. Management could not establish whether the protection was inadequate, misconfigured, or simply defending the wrong thing entirely. The mitigation service had never triggered at all.
MMA APPROACH
MMA reconstructed both incidents from traffic and application logs to establish the attack class involved, tested the deployed mitigation through a controlled simulated exercise, and assessed candidate providers on behavioural detection capability and supervisory evidence rather than on scrubbing capacity figures. Endpoint discovery was performed across the public footprint, and supervisory evidence formats were compared against what the regulator had previously accepted.
KEY FINDINGS
  1. Both outages were caused by application layer request floods at volumes well below any mitigation threshold, and the service had behaved exactly as configured throughout.
  2. The controlled exercise revealed a stale routing announcement that would have delayed diversion by an estimated eleven minutes had a volumetric attack actually occurred.
  3. Endpoint discovery identified 34 programmable interfaces exposed publicly that appeared in no internal inventory and carried no protection of any kind whatsoever.
  4. Only three of seven candidate providers could supply supervisory evidence in a form the operator's regulator had previously accepted from comparable institutions.
CLIENT PROFILE
A regional payment infrastructure operator processing approximately 190 million transactions monthly across retail and instant transfer services, under supervisory operational resilience requirements. Annual technology budget exceeded USD 260 million (client-reported, unverified by MMA). Protection had been procured five years earlier on scrubbing capacity, and no live test had been conducted since the original commissioning. No live test had run since original commissioning.
STRATEGIC CHALLENGE
Two brief outages in eighteen months had produced supervisory questions the operator could not answer, since neither incident involved volumetric traffic and the mitigation service had not triggered at all. Management could not establish whether the protection was inadequate, misconfigured, or simply defending the wrong thing entirely. The mitigation service had never triggered at all.
MMA APPROACH
MMA reconstructed both incidents from traffic and application logs to establish the attack class involved, tested the deployed mitigation through a controlled simulated exercise, and assessed candidate providers on behavioural detection capability and supervisory evidence rather than on scrubbing capacity figures. Endpoint discovery was performed across the public footprint, and supervisory evidence formats were compared against what the regulator had previously accepted.
KEY FINDINGS
  1. Both outages were caused by application layer request floods at volumes well below any mitigation threshold, and the service had behaved exactly as configured throughout.
  2. The controlled exercise revealed a stale routing announcement that would have delayed diversion by an estimated eleven minutes had a volumetric attack actually occurred.
  3. Endpoint discovery identified 34 programmable interfaces exposed publicly that appeared in no internal inventory and carried no protection of any kind whatsoever.
  4. Only three of seven candidate providers could supply supervisory evidence in a form the operator's regulator had previously accepted from comparable institutions.
RECOMMENDED STRATEGY
Phase 1: Phase one: procure application layer behavioural protection covering the discovered endpoint inventory, treating volumetric capacity as adequate and already solved. Phase 2: Phase two: establish quarterly simulated exercises as a contractual service element, correcting the routing configuration and validating it under controlled conditions. Phase 3: Phase three: require supervisory grade incident reporting from the selected provider, in a format the regulator has previously accepted from comparable institutions.
OUTCOME
No further outages occurred in the following twelve months, and two attempted application layer attacks were mitigated without service degradation (client-reported, unverified by MMA). The supervisory questions were closed following the first quarterly exercise report. Total protection spending rose 22% while volumetric capacity purchased actually fell.

Frequently Asked Questions

Foundational context covering the market sizes, CAGR, scope, country, region and competition that inform every finding below. This section is provided to cover basics and most often pre-purchase conversations, answered from the MMA Primary Research Dataset.

What is the current size of the DDoS Protection and Mitigation Security Market?

The market was worth USD 4.8 billion in 2025 and reaches USD 5.3 billion in 2026. Value covers contracted protection services and products across all delivery models.

How large will the DDoS Protection and Mitigation Security Market be by 2036?

MMA forecasts USD 14.0 billion by 2036, an increase of USD 8.7 billion across the forecast period. That represents 2.64 times the 2026 base of USD 5.3 billion.

What is the CAGR for the DDoS Protection and Mitigation Security Market 2026 to 2036?

The base case compound annual growth rate is 10.2%, with a bull case at 11.4% and a bear case at 9.0%. Historical growth from 2020 to 2025 ran at 9.1%.

Which segment is growing fastest?

Content delivery integrated protection grows at 15.3%, half again the market rate of 10.2%. Filtering at an edge already carrying the traffic removes the diversion step entirely.

Who are the major companies in the DDoS Protection and Mitigation Security Market?

Cloudflare, Akamai Technologies, Amazon Web Services, Radware, and NETSCOUT lead, holding 57% of contracted spend between them. They arrive from delivery, cloud, and security backgrounds respectively.

Which country is growing fastest?

India grows at 14.6%, driven by digital public infrastructure whose disruption carries consequences no commercial outage would. Financial technology and gaming add further commercial demand.

Report Segmentation Architecture

The full report scope spans multiple orthogonal segmentation dimensions, with cross-tabulated demand data provided for each dimension pair. Coverage extends further to regional breakdowns, trend trajectories, and the competitive detail needed to support segment-level decision-making.

By Protection Delivery Model

  • On-Premise Mitigation Appliances
  • Always-On Cloud Scrubbing Services
  • Content Delivery Integrated Protection
  • Carrier and Internet Provider Protection
  • Application Layer and Interface Protection
  • Hybrid Managed Mitigation Services

By End-Use Industry

  • Banking, Financial Services and Payments
  • Gaming, Betting and Online Entertainment
  • Government and Public Infrastructure
  • Telecommunications and Hosting Providers
  • Retail and Consumer Platforms
  • Healthcare, Education and Utilities

By Commercial Dimension

  • Direct Enterprise Subscription
  • Platform Bundled Inclusion
  • Managed Security Provider Delivered
  • Carrier Wholesale Arrangement
  • Hosting Provider Resale
  • Regulated Sector Framework Contract

By Region

  • North America
  • East Asia
  • Western Europe
  • South Asia and Pacific
  • Latin America
  • Middle East and Africa
  • Eastern Europe

Scope, Methodology, and Coverage

Every figure in this report is reproducible from documented input assumptions. The scope below maps the historical period, the forecast horizon, the segmentation dimensions, and the countries covered, alongside the underlying primary and qualitative methodology.
Historical Period
2020 to 2025
Forecast Period
2026 to 2036
Base Year
2025 (USD billions; MMA Primary Research Dataset, September 2026)
Market Definition
This market covers services and products defending networks and applications against denial of service attacks, including on-premise mitigation appliances, always-on cloud scrubbing services, content delivery integrated protection, carrier and internet provider protection, application layer and interface protection, and hybrid managed mitigation services. It excludes web application firewalls sold without mitigation capability, bot management products, network firewalls, intrusion detection systems, and broader managed security service contracts.
Quantitative Units
USD billions, contracted protection spend
Segmentation Dimensions
Protection delivery model, end-use industry, commercial dimension, region
Regions Covered
North America, East Asia, Western Europe, South Asia and Pacific, Latin America, Middle East and Africa, Eastern Europe
Countries Covered
United States, Canada, United Kingdom, Germany, France, Netherlands, Sweden, Spain, Italy, China, Japan, South Korea, Taiwan, India, Australia, Singapore, Indonesia, Brazil, Mexico, Colombia, Saudi Arabia, United Arab Emirates, South Africa, Poland, Romania
Key Companies Profiled
Cloudflare, Akamai Technologies, Amazon Web Services, Radware, NETSCOUT, F5, Imperva, Fastly, Microsoft, Google, Alibaba Cloud, Tencent Cloud, Huawei, Nokia Deepfield, A10 Networks, Corero Network Security, Link11, StormWall, Qrator Labs, Lumen Technologies
Quantitative Methodology
Primary survey, n=3,800 respondents, Q4 2025, six countries; demand-side model with trade association cross-validation
Qualitative Methodology
47 expert interviews, Q4 2025; applied to validate demand model assumptions, identify emerging dynamics, and assess competitive positioning
Report Format
PDF and XLSX data workbook (Word format preview document)
Publisher
Market Minds Advisory
Report Code
MMA-2026-TEC-531
Published
September 2026
Contact
sales@marketmindsadvisory.com | www.marketmindsadvisory.com

Purchase the full DDoS Protection and Mitigation Security Market Report (2026 to 2036).

The full report sizes the denial of service protection market across six delivery models, seven regions, and twenty-five countries, with forecasts to 2036 under base, bull, and bear cases. It examines why scrubbing capacity no longer predicts availability, what application layer attacks require that volumetric defences cannot supply, and how platform bundling has removed the mid-market from standalone contention. Competitive analysis covers twenty participants evaluated consistently on contracted spend, with detailed treatment of network reuse economics and regulated resilience evidence. Cost structure, margin architecture by delivery model, and regional buying drivers are analysed in full. Primary research includes 3,800 survey responses and 47 expert interviews.
Six delivery models sized and forecast separately
Twenty participants evaluated on contracted protection spend
Regional buying and regulatory drivers across seven geographies
Margin architecture by delivery model and network reuse
Attack class analysis separating volumetric from application layer
Mitigation testing and configuration failure benchmarks

Built For The People Who Decide

From boardroom strategy to bench-side execution, this report is read cover-to-cover by leaders shaping the next decade of their industry, turning demand scenarios, market dynamics and valuation benchmarks into decisions.
CXOs/ Presidents/ VPs/ Managers
M&A and Corporate Development
Strategy Teams and R&D Heads
Procurement and Product Directors
Regulatory and Compliance Leaders
Investor Relations and Equity Analysts