Market Minds Advisory
DC Power Systems Market

DC Power Systems Market: DC Power Systems Market: Rack Density Pressure, Conversion Stage Losses and Buildings Wired For Something Else 2026 to 2036

The efficiency case for direct current distribution was made twenty years ago and almost nobody moved. Rack density is what finally forced it, because the conversion stages now occupy space the compute needs.

Lead Analyst

Published

September 2026

Make Smarter Decisions with Customized Research Insights

Request a free sample report and evaluate market opportunities, growth trends, and competitive dynamics relevant to your business needs.

2025 MARKET VALUE$12.8BMarket Size 2025
2036 FORECAST VALUE$35.9BBase Case , 2026 to 2036
CAGR 2026 TO 20369.8 %Bull 11.1% / Bear 8.6%
INCREMENTAL OPPORTUNITY$21.8BNet 10- year value creation
EXPANSION MULTIPLE2.55x2036 value over 2026 base
Strategic Levers
M&A Pipeline
Regional Outlook
Country Rankings
Competitive Intelligence
Segmental Deep-dive
Call-Us : 91 93563 13602

Executive Snapshot and Market Trajectory.

The efficiency case for direct current distribution was made twenty years ago and almost nobody moved on it. Rack density is what finally forced the change, because the conversion stages themselves now occupy space the compute needs. Conversion stages waste around 11% of energy and nobody cared.
The market reaches USD 14.1 billion in 2026 and USD 35.9 billion by 2036, a 2.55 times expansion at 9.8% annually. High voltage direct current rack distribution grows at 14.7%, half again the market rate of 9.8%, because a rack drawing over 100 kilowatts cannot be fed through conventional alternating current architecture. East Asia holds 34% of spending on data centre construction. Retrofit feasibility caps the pace.
Five suppliers hold 49% of spending, moderate for power infrastructure, because telecom rectifier plant, data centre distribution and industrial supplies are bought by entirely different functions. Vertiv, Delta Electronics, Eaton, Schneider Electric and Huawei Technologies lead. Retrofit feasibility in existing buildings decides most deployment outcomes. Only around 38% of existing facilities can convert economically without substantial rebuilding, which ties this category to new construction programmes rather than to the far larger operating estate anywhere.
Market Definition
This report covers direct current power systems: equipment converting, distributing and protecting direct current power in telecommunications, data centre, industrial and transport applications. It spans high voltage direct current rack distribution, telecom rectifier and power plant systems, direct current uninterruptible supplies and energy storage interfaces, busway and distribution hardware, monitoring and power management software, and conversion modules supplied within these systems. It excludes alternating current uninterruptible power supplies, standby generation, utility scale transmission equipment, electric vehicle charging infrastructure, and battery cells sold separately from power systems.
Base Year Value
$12.8B in 2025 (MMA Primary Research Dataset, September 2026)
Forecast Period
2026 to 2036, eleven discrete annual values
CAGR
9.8% base case. Bull 11.1%. Bear 8.6%.
Fastest Growth Segment
High Voltage Direct Current Rack Distribution: 14.7% CAGR
Fastest Growth Country
India: 16.2% CAGR
Fastest Growth Region
South Asia and Pacific: 12.0% CAGR
Largest Region
East Asia: 34% of 2025 global value
Market Leaders
Vertiv, Delta Electronics, Eaton, Schneider Electric and Huawei Technologies lead on direct current power system revenue. Source: MMA Analysis.
Primary Survey
n=3,800 procurement and R&D decision-makers, Q4 2025, six countries
Methodology
Demand-side build-up, cross-validated against public data, 47 expert interviews

DC Power Systems Market Forecast Scenarios

dc-power-systems-market-size-forecast-scenario-1790002850705
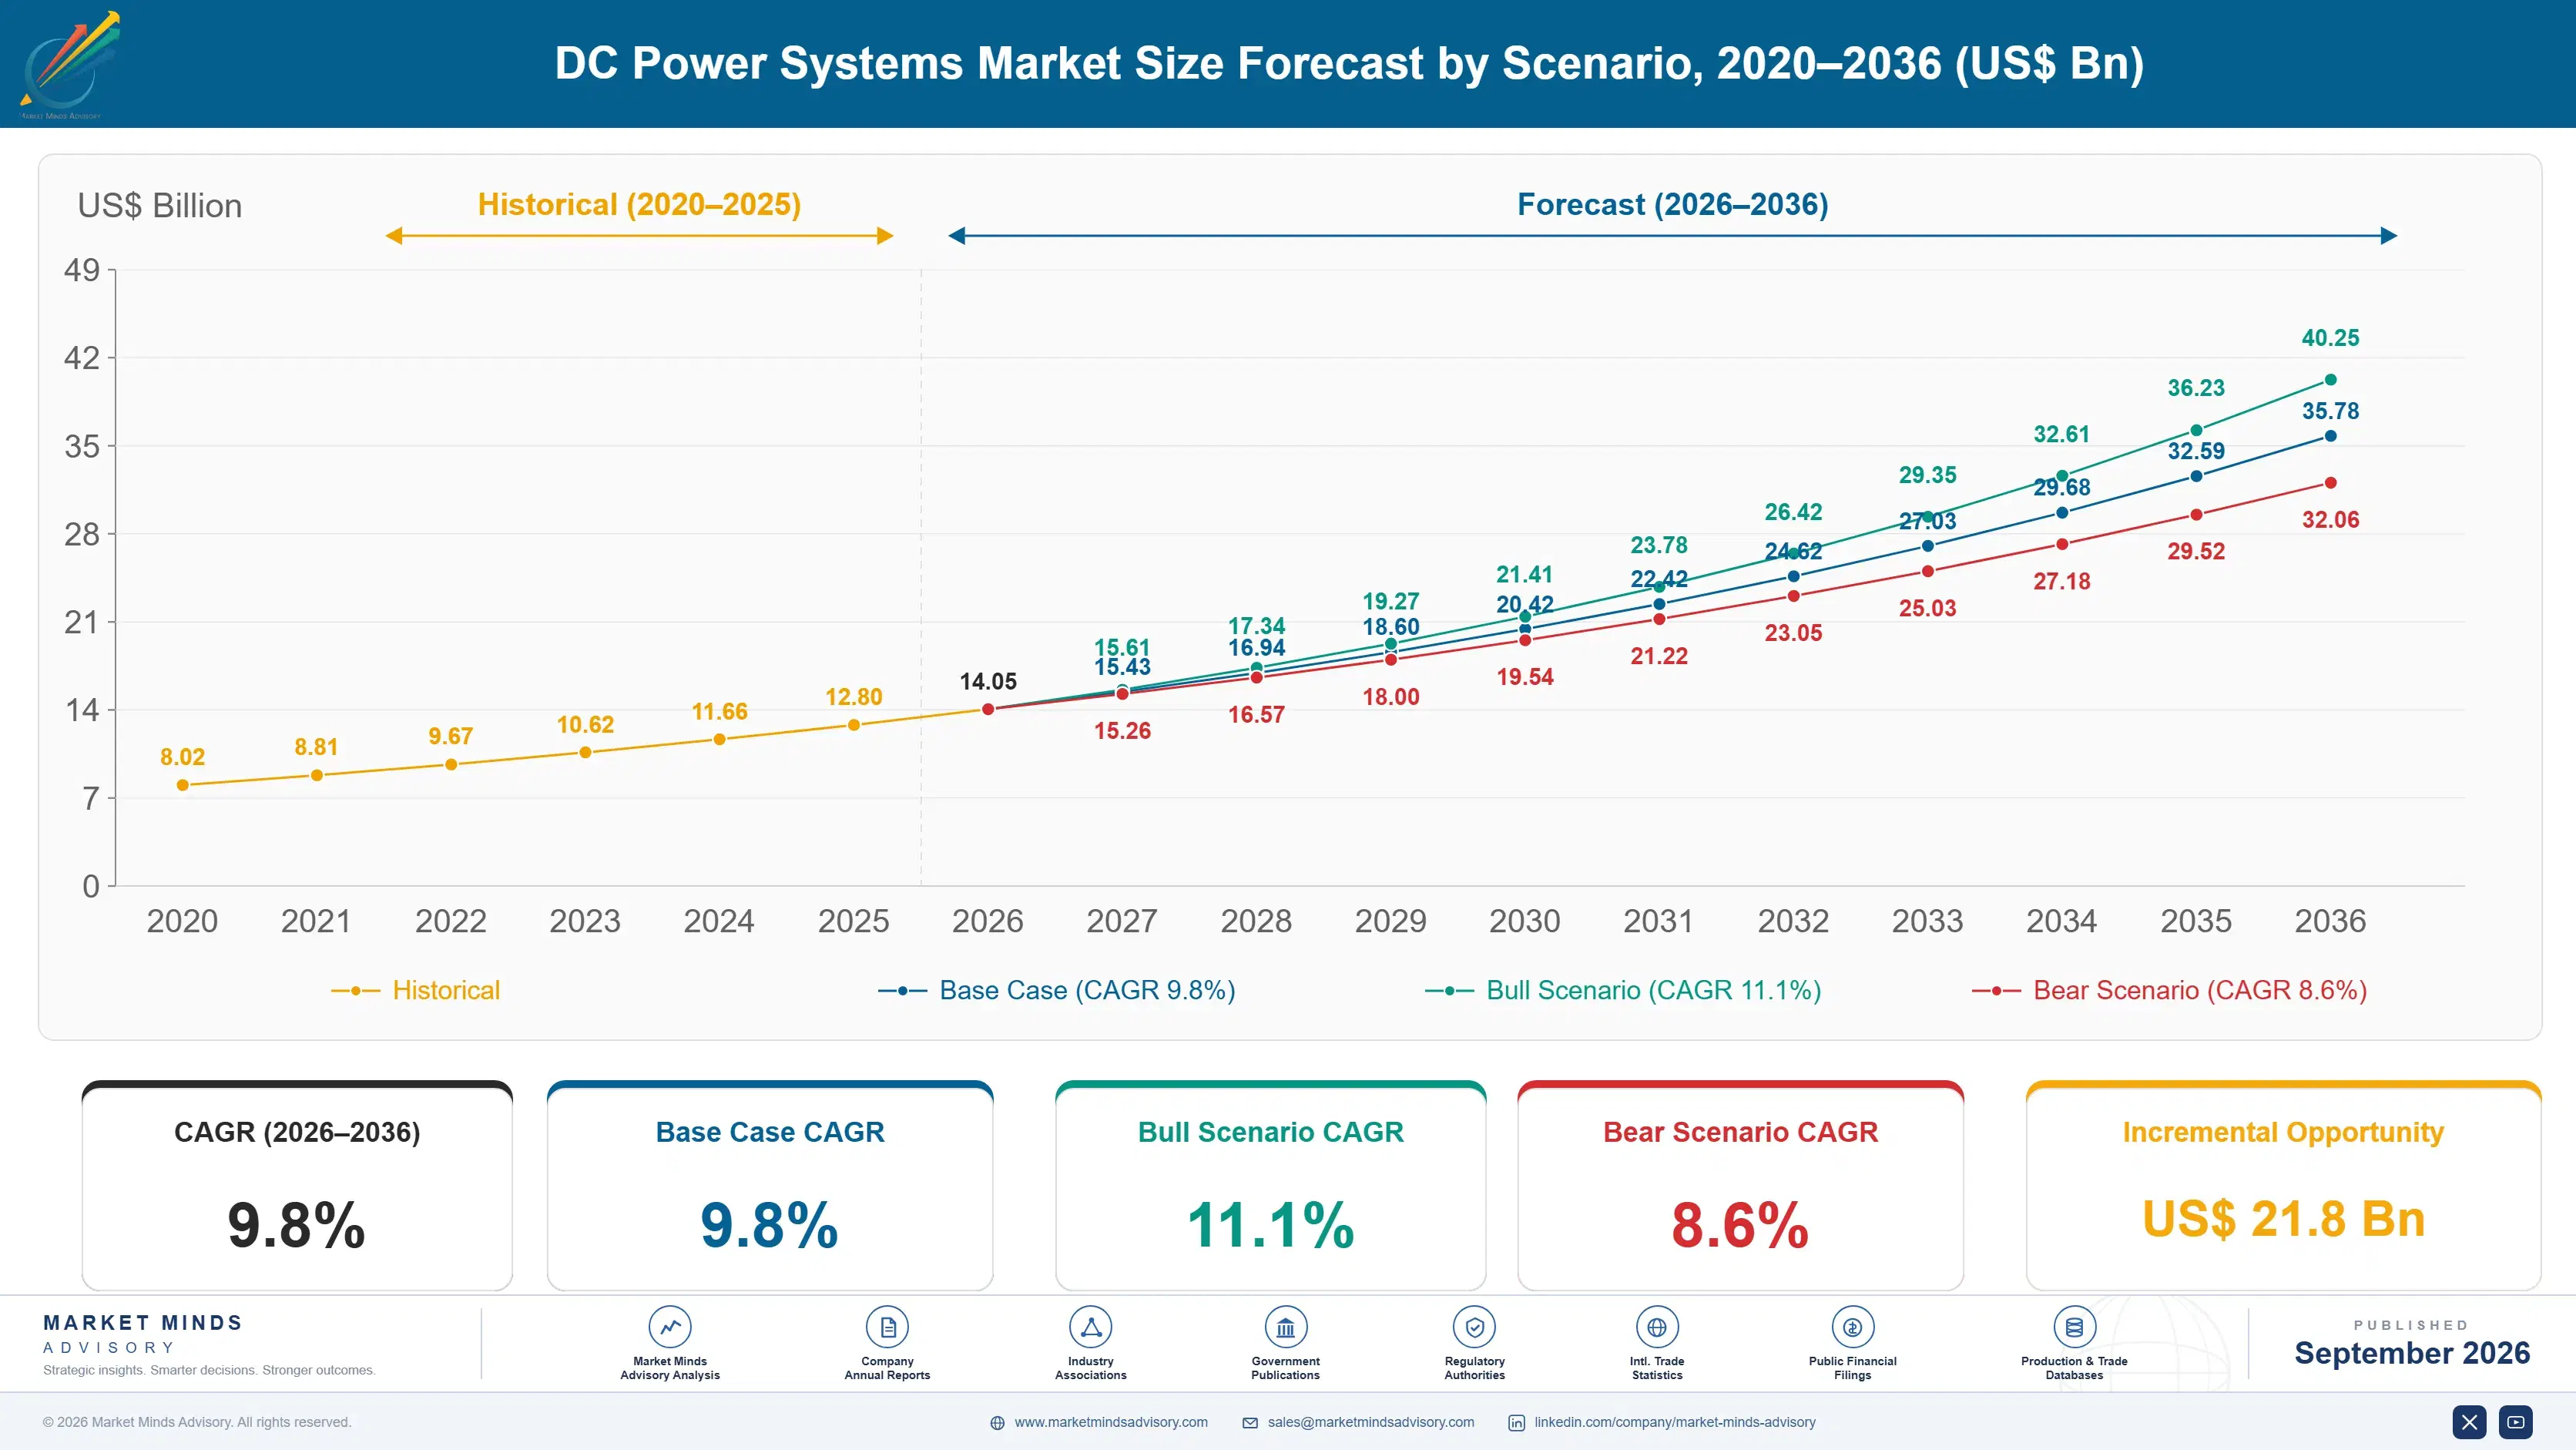
Between 2020 and 2025 the category compounded at 8.6%, carried by telecom rectifier plant rather than by any conversion of data centre architecture. Operators replaced ageing power plant at base station and exchange sites because it wore out, not because anybody was persuaded by an efficiency argument. The direct current case circulated for two decades and moved almost nothing while alternating current infrastructure remained adequate.
The base case holds 9.8% on three mechanisms. Rack densities above 100 kilowatts keep making conventional distribution physically impractical rather than merely inefficient. Telecom power plant keeps reaching replacement across an installed base that was deployed in waves and therefore ages in waves. And direct current coupling to on-site storage keeps improving as operators add batteries for grid services rather than only for backup duty. Those three mechanisms run largely independently of one another.
The bull case at 11.1% assumes accelerator rack densities rise faster than currently planned, since the physical argument strengthens with every additional kilowatt. The bear case at 8.6% is retrofit friction, where operators find existing buildings cannot accommodate direct current distribution economically and continue building alternating current facilities they already know how to construct and operate.

Density Did What Efficiency Could Not

The argument that finally worked was not about efficiency. Conversion stages waste around 11% of energy in conventional alternating current distribution, and the industry accepted that for twenty years without changing anything. What changed is that racks drawing over 100 kilowatts cannot physically be fed through conventional architecture, because the conversion hardware and its cooling occupy floor space the compute itself needs. Physics rather than economics moved the decision.
TOP FIVE CONCENTRATION49%Moderate, reflecting telecom and data centre buyers purchasing separately
CONVERSION STAGE LOSSES11%Energy lost across conversion stages in conventional alternating current distribution
RACK DENSITY THRESHOLD100 kilowattsPoint where conventional distribution becomes physically impractical to install
RETROFIT FEASIBLE SHARE38%Existing facilities where conversion is economically viable without rebuilding
TELECOM PLANT AGE14 yearsAverage age of installed rectifier plant across operator networks
STORAGE COUPLED SHARE27%New installations pairing distribution directly with on-site energy storage
Retrofit is where the growth actually stalls. Only around 38% of existing facilities can convert economically without substantial rebuilding, since power distribution runs through structure that was designed once and rarely revisited. New construction converts readily and existing estate mostly does not, which means this category grows with building programmes rather than with the installed base. Suppliers selling into operating facilities are addressing the harder third.
Telecom remains the volume and data centres remain the story. Installed rectifier plant averages around 14 years across operator networks and gets replaced when it wears out rather than when an argument is won, which produces steady predictable demand. High voltage rack distribution grows at 14.7% against 9.8% for the market, from a smaller base.
"I sat through direct current efficiency presentations for fifteen years and watched every operator nod and then build alternating current anyway. Nothing changed until a rack needed a hundred and fifty kilowatts and the conversion gear would not fit in the room. That is the entire history of this market."
Director, Critical Power and Data Centre Infrastructure Practice · MMA Energy Practice · September 2026

Market Trends

Rack Density Made The Physical Argument Instead

Racks drawing over 100 kilowatts cannot be fed through conventional alternating current architecture, because conversion hardware and its cooling occupy floor space the compute itself requires. That is a physical constraint rather than an efficiency preference, and it moved decisions that twenty years of loss arguments never did. High voltage direct current rack distribution grows at 14.7% against 9.8% for the market, and the argument strengthens with every additional kilowatt a rack draws. Suppliers still leading with loss figures are repeating an argument that already failed in front of exactly these buyers.
Market Impact: India compounds at 16.2% yearly
Retrofit Feasibility Caps How Fast Conversion Spreads

Only around 38% of existing facilities can convert to direct current distribution economically without substantial rebuilding, because power runs through structure designed once and rarely revisited afterwards. New construction converts readily while operating estate largely does not, which ties this category to building programmes rather than to the installed base. Suppliers selling conversion into operating facilities are addressing the harder third and frequently discover the constraint during survey rather than before it. Contained high density zones inside otherwise unchanged buildings meet much of the requirement at a fraction of full conversion cost.
Market Impact: Plant averages 14 years old

Market Opportunities and Growth Drivers

Asian Data Centre Construction Specifies From Design Stage

India compounds at 16.2%, ahead of every other market, because data centre capacity is being built rather than retrofitted and direct current distribution can be specified at design stage where the retrofit constraint does not apply at all. East Asia holds 34% of spending on the same mechanism at considerably larger scale. Suppliers positioned with engineering contractors in those markets reach specification decisions that operating facility coverage never encounters. A specification written into a design package carries through construction and every subsequent expansion without being re-competed anywhere. Retrofit never enters it.
Market Impact: Only 38% convert economically

Telecom Plant Ages In Waves Toward Replacement

Installed rectifier plant averages around 14 years across operator networks and was deployed in waves during successive network generations, so it reaches replacement in waves rather than steadily. That produces predictable demand independent of any technology argument, since equipment gets replaced when it wears out. Operators facing replacement increasingly specify higher efficiency plant and storage coupling rather than like for like, which lifts value per site considerably. Suppliers tracking deployment vintages by operator reach those cycles at specification rather than at tender, which is where the higher value content gets written in.
Market Impact: Conversion wastes 11% of energy

Market Restraints and Challenges

Existing Buildings Resist Distribution Architecture Changes

Only around 38% of operating facilities can convert economically, because power distribution runs through structure and containment designed once and rarely revisited across a building's life. The root cause is that electrical architecture is a construction decision rather than an equipment one. Commercially this confines growth to new build programmes. Mitigation runs through hybrid architectures serving high density zones only, through modular deployment in contained areas, and through conversion timed to major refurbishment cycles. None of those converts a building that cannot take it; they deliver the capability inside a structure that stays as it was.
Market Impact: Racks now exceed 100 kilowatts

Operating Familiarity Favours What Teams Already Know

Facility teams trained on alternating current systems maintain, fault-find and safely isolate them by habit, and direct current distribution requires different practice around arc behaviour and isolation. The root cause is that the skills gap is operational rather than technical. Commercially this slows adoption independently of any capital case. Mitigation runs through supplier training programmes delivered with installation, through monitoring that reduces manual intervention, and through architectures that keep familiar interfaces at the rack. Training delivered with installation is what most suppliers underinvest in, and it costs them renewals rather than initial orders.
Market Impact: Only 38% of sites convert viably
4 additional market trends, 3 additional growth drivers, and 2 additional restraints and challenges are covered in the full report. Contact sales@marketmindsadvisory.com to access the complete intelligence.

Segment CAGR and Growth Architecture

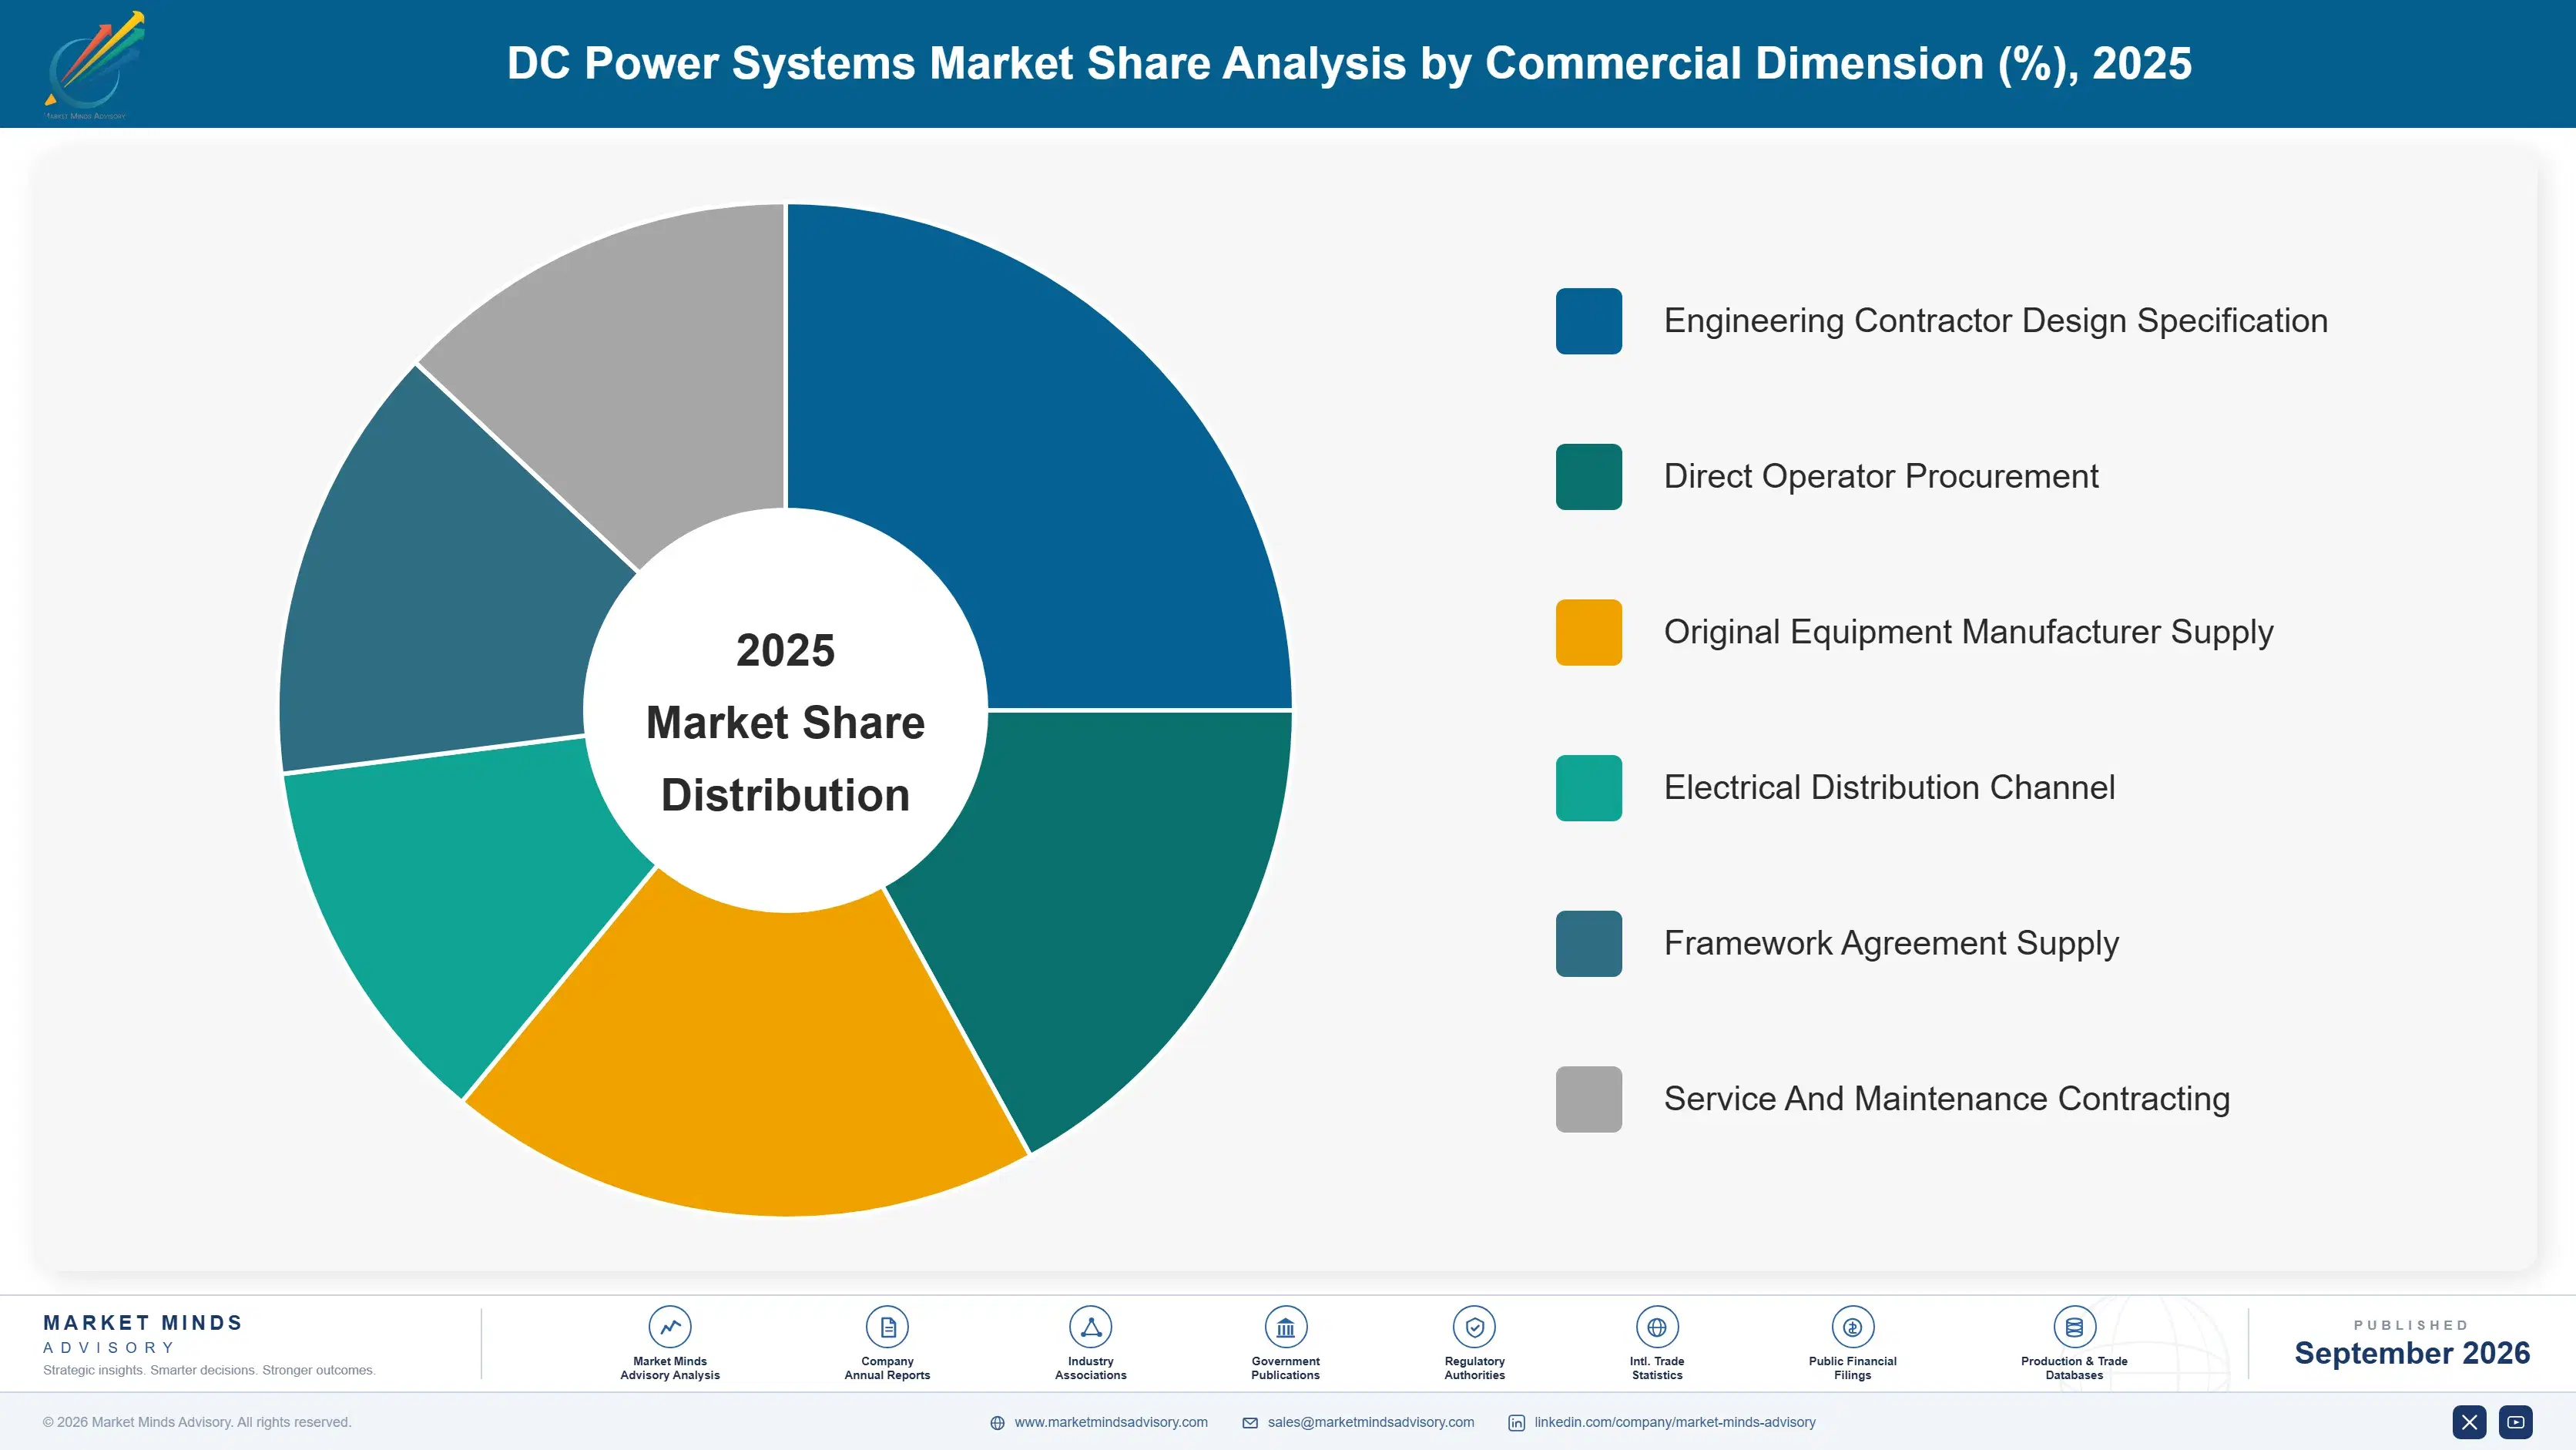
Segmentation follows system class and application context, since each carries quite different installation constraint, buyer function and replacement behaviour. Six classes cover the market: high voltage direct current rack distribution, telecom rectifier and power plant systems, direct current uninterruptible supplies and storage interfaces, busway and distribution hardware, monitoring and power management software, and conversion modules.
dc-power-systems-market-market-share-analysis-1790002851246

High Voltage Direct Current Rack Distribution

High voltage direct current rack distribution grows at 14.7%, half again the market rate of 9.8%, because a rack drawing over 100 kilowatts cannot be fed through conventional alternating current architecture once conversion hardware and its cooling occupy the floor space compute requires. That is a physical constraint rather than an efficiency preference. Growth is nonetheless constrained by retrofit feasibility, since only around 38% of existing facilities convert economically, which ties this segment to new construction programmes rather than to the far larger operating estate. Design stage presence is what determines who supplies those programmes. Contained high density zones inside otherwise unchanged buildings meet much of the remaining requirement. Full conversion is rare.
CAGR 14.7%

Direct Current Uninterruptible Supplies And Storage Interfaces

Direct current uninterruptible supplies and storage interfaces compound at 12.4% because around 27% of new installations now pair distribution directly with on-site energy storage, and operators increasingly add batteries for grid services rather than only for backup duty. Coupling storage on the direct current side removes conversion stages that would otherwise sit between the battery and the load. That makes the technical argument considerably stronger here than in distribution generally, and it reaches an operator revenue case rather than only a resilience one. Grid services revenue is a different conversation from resilience entirely. Operators adding batteries for grid services fund this from a revenue line rather than a facilities budget.
CAGR 12.4%
Full segment breakdown across 6 segments available in the complete report.

Regional Architecture and Country Demand Map

East Asia holds 34% of spending, above the usual band, because data centre construction, telecom network scale and power system manufacturing all concentrate there together. North America follows at 24% on accelerator deployment density. India compounds fastest at 16.2% on new capacity being built. Construction leads.

East Asia

East Asia takes 34% of spending, above the 30% band ceiling, because data centre construction, telecom network scale and power system manufacturing all concentrate here together and reinforce one another directly. Chinese operators build at volumes where design stage specification avoids the retrofit constraint entirely, and Delta Electronics and Huawei Technologies both manufacture within the region. Japanese and South Korean telecom replacement adds steady rectifier plant demand. Growth at 10.8% runs above the global rate on construction rather than on conversion of anything existing. Regional manufacturing scale also supports delivery commitments on construction programmes that cannot absorb schedule slip. Design stage specification is the regional norm. Retrofit rarely arises here.
Share: 34% | CAGR: 10.8% (2026 to 2036)

North America

North America accounts for 24% of spending, where accelerator deployment density is highest and the physical argument for direct current distribution consequently bites hardest. Vertiv, Eaton and Schneider Electric all built positions here across data centre and industrial applications. Retrofit constraints are acute given a large operating estate built for far lower densities than current racks demand. Growth at 10.3% sits above the global rate on new construction and high density zones within existing facilities rather than wholesale conversion. Contained high density zones inside existing buildings are how most operators here are meeting customer requirements without attempting full conversion. Wholesale conversion is rarely attempted at all. Density demand keeps rising.
Share: 24% | CAGR: 10.3% (2026 to 2036)
Regional intelligence for 5 additional markets available in the complete report: Western Europe, South Asia and Pacific, Latin America, Middle East and Africa, Eastern Europe. Contact sales@marketmindsadvisory.com.
dc-power-systems-market-country-cagr-analysis-1790002851767

Where Power System Deals Land

Rack density rather than efficiency is what moved this market, retrofit feasibility caps how fast conversion spreads, and telecom replacement carries the predictable volume underneath. The four levers below follow those conditions rather than any argument about conversion losses, which persuaded nobody for two decades. Each addresses a physical or commercial condition instead. Losses persuade nobody.

Sell Floor Space, Not Energy Efficiency

Conversion stages waste around 11% of energy and the industry accepted that for twenty years without changing anything at all. What moves a decision is that a rack drawing over 100 kilowatts cannot be fed conventionally once conversion hardware and cooling occupy floor space the compute needs. Suppliers leading with loss figures are repeating an argument that has already failed repeatedly, while the space argument closes because it is physical. Space arguments close because they are physical. Loss figures have already failed with these buyers. Space is the argument that closes.
Market Impact: Racks now exceed a full 100 kilowatts each

Reach Engineering Contractors Before Construction Starts

Only around 38% of existing facilities convert economically, so the practical market is new construction where specification happens at design stage. Suppliers positioned with engineering contractors reach that decision, while those covering operating facilities are addressing the harder third and discovering the constraint during survey. India compounds at 16.2% precisely because capacity there is being built rather than converted, which is where this argument lands cleanly. Specification written at design carries through every subsequent expansion of that facility. Operating estate is the harder third. Survey reveals it too late. Design decides everything.
Market Impact: Only 38% of facilities now convert viably today

Attach Storage Coupling To Every Distribution Sale

Around 27% of new installations already pair distribution with on-site storage, and coupling on the direct current side removes conversion stages that would otherwise sit between battery and load. Operators adding batteries for grid services rather than backup duty reach a revenue case rather than a resilience one. That conversation converts far better than any efficiency argument and it attaches equipment value that distribution alone does not carry. Resilience arguments reach a cost centre instead. Conversion stages between battery and load disappear entirely. Equipment value attaches too. Efficiency never reached this budget.
Market Impact: Storage now pairs with fully 27% of installs

Follow Telecom Replacement Waves Rather Than Arguments

Installed rectifier plant averages around 14 years and was deployed in waves across successive network generations, so it reaches replacement in waves that can be anticipated years ahead. That demand arrives whether or not any technology argument is won, because equipment wears out. Suppliers tracking deployment vintages by operator reach those cycles at specification rather than at tender, which is where higher efficiency plant and storage coupling get written in. Waves can be anticipated years ahead by anybody tracking vintages. Tenders arrive too late to shape. Vintage tracking is the discipline.
Market Impact: Plant now averages a full 14 years old

Who Controls the Margin Pool

Five suppliers hold 49% of direct current power system spending, moderate for power infrastructure, because telecom rectifier plant, data centre distribution and industrial supplies are specified and bought by entirely different functions that rarely evaluate the same products. Vertiv, Delta Electronics, Eaton, Schneider Electric and Huawei Technologies lead. All participants are assessed on direct current power system revenue rather than on broader electrical, thermal or networking businesses they also operate. Concentration has held because design stage relationships take years to build and cannot be bought.
Competition runs on installation feasibility and design stage presence far more than on conversion efficiency, which converges across serious suppliers. The second dimension is storage integration capability, since around 27% of new installations pair distribution with batteries and coupling on the direct current side is where the technical argument is genuinely strongest.

Pressure is emerging from accelerator vendors specifying rack power architecture directly, which narrows what facility operators choose. Rankings shift where construction proceeds and where telecom replacement waves arrive, particularly across India, China and the Gulf over the coming decade. Suppliers reaching only operating facilities carry the most exposure to that narrowing.
dc-power-systems-market-company-positioning-matrix-1790002852298

Competitive Moat and Risk Dimensions

VERTIV

Moat: Data Centre Design Presence

Vertiv holds design stage presence with data centre engineering contractors, which matters because only around 38% of existing facilities convert economically and new construction is therefore the practical market. Specification at design avoids the retrofit constraint entirely. Competitors reaching operating facilities are addressing the harder third and frequently discover feasibility problems during survey rather than before.
VERTIV

Risk: Telecom Volume Absence

Telecom rectifier plant carries predictable replacement volume across an installed base averaging fourteen years, and that demand arrives regardless of construction cycles or technology arguments. A position concentrated in data centre applications rides construction volatility without that ballast. Design presence wins the growth segment and leaves the steadier one to suppliers with operator relationships.
DELTA ELECTRONICS

Moat: Regional Manufacturing Scale

Delta manufactures at scale within East Asia where 34% of spending sits, which supports both cost position and delivery responsiveness on construction programmes that cannot absorb schedule slip. Regional presence also reaches Chinese and Southeast Asian operators directly rather than through distribution. Competitors supplying from other regions carry cost and lead time disadvantages on the largest single block of demand.
DELTA ELECTRONICS

Risk: Western Specification Position

Design stage relationships with Western engineering contractors are thinner than manufacturing scale suggests, and specification rather than cost decides those projects. North American and European operators select on installed reference base and support presence. Manufacturing advantage reaches the tender and does not by itself reach the design conversation that precedes it.

Players Tracked

Prominent Players

Vertiv
Delta Electronics
Eaton
Schneider Electric
Huawei Technologies

Other Key Players

ABB
Legrand
Socomec
Piller Power Systems
GE Vernova
Mitsubishi Electric
Fuji Electric
Ziehl-Abegg
Cummins
Hitachi Energy
Riello Elettronica
Benning
Efore
Enatel
AEG Power Solutions

Recent Developments

MARCH 2025

Accelerator Rack Densities Force Distribution Architecture Changes

Data centre operators changed rack power architecture as accelerator densities passed what conventional alternating current distribution could physically support, an engineering decision rather than any corporate transaction. Conversion hardware and its cooling occupy floor space the compute itself needs, which is a spatial constraint rather than any efficiency consideration.
Signal: Physics moved decisions that twenty years of efficiency arguments had entirely failed to move at all.
SEPTEMBER 2024

Operators Couple Storage On The Direct Current Side

Data centre and telecom operators increasingly coupled on-site energy storage directly to direct current distribution rather than through conversion stages, a design development rather than any acquisition. Around 27% of new installations now pair the two, and operators adding batteries for grid services reach a revenue case rather than resilience.
Signal: Storage revenue arguments convert far better than any conversion loss figure has ever once managed to.
JUNE 2025

Indian Construction Specifies Distribution At Design Stage

Indian data centre construction programmes specified direct current distribution during design rather than leaving power architecture to fit out, a specification development rather than any corporate event. India compounds at 16.2%, and design stage decisions avoid entirely the retrofit constraint limiting conversion across existing operating estate.
Signal: New construction converts readily while operating estate mostly does not at almost any price at all.

What A Power System Costs

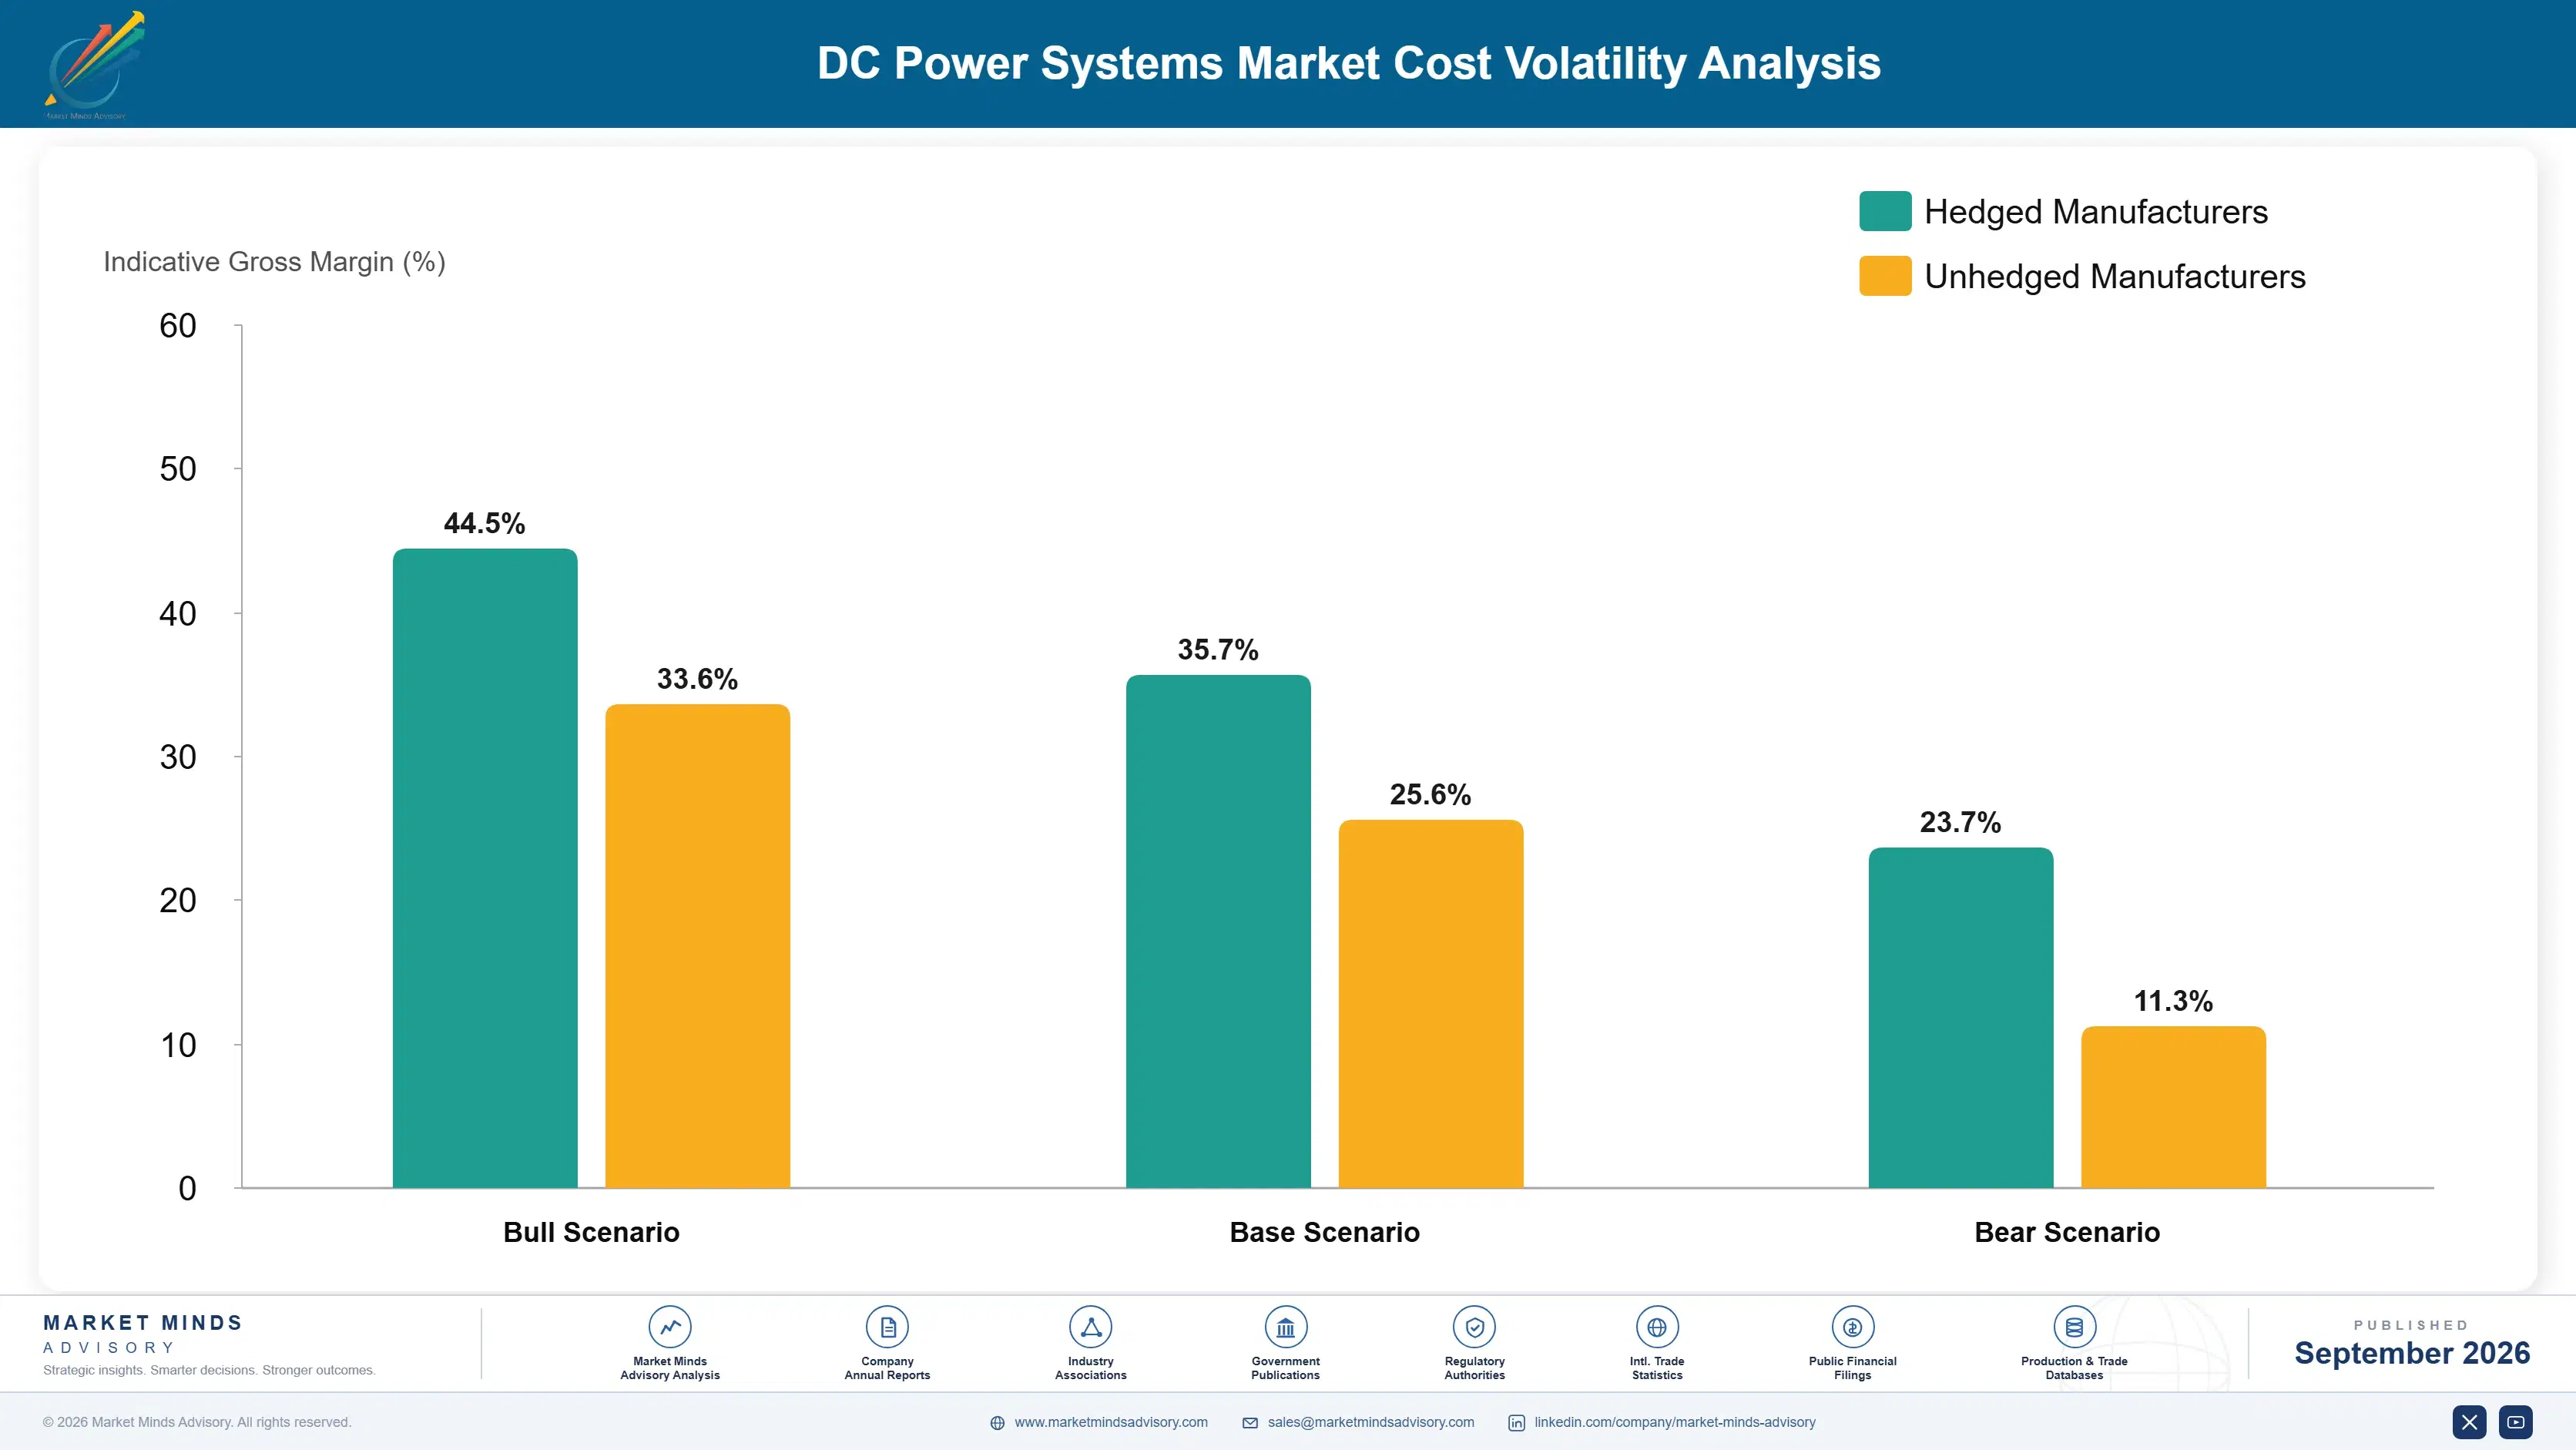
Power semiconductors and magnetic components absorb roughly 39% of system cost, and both are sourced from suppliers whose capacity is shared with far larger automotive and industrial demand. Enclosure, busbar and copper conductor take around 23%, which moves directly with metal prices. Assembly and test absorb about 17%, with certification and compliance testing taking the remaining balance.
Copper prices moved sharply through 2023 and 2024 while power semiconductor availability tightened as electrification demand competed for the same fabrication capacity that industrial converters depend on. Vertiv Annual Report 2024 and Schneider Electric Annual Report 2024 both record component availability and commodity exposure among principal operating variables. Suppliers holding multi-year semiconductor agreements met construction programme dates that competitors buying against orders could not. Commissioning slips cascade through everything behind them.

The competitive disadvantage mechanism is delivery reliability rather than component price. A supplier missing a construction milestone costs an operator far more than the equipment is worth, since a data centre commissioning slip cascades through everything scheduled behind it. Exposure concentrates among suppliers without secured semiconductor allocation, since those are precisely the ones who cannot commit to dates during the periods when demand peaks.
dc-power-systems-market-cost-volatility-analysis-1790002852496

Secure Power Semiconductor Allocation Across Multiple Years

Power semiconductors and magnetics absorb roughly 39% of system cost from suppliers whose capacity is shared with far larger automotive and electrification demand. Multi-year agreements secure allocation and let a supplier commit to construction programme dates credibly. Missing a commissioning milestone costs an operator far more than the equipment, which is why delivery certainty outranks price on most large projects.

Design Around Copper Content Rather Than Absorbing Prices

Enclosure, busbar and copper conductor absorb around 23% of system cost and move directly with metal prices that no supplier controls. Designs reducing conductor mass through higher distribution voltage cut that exposure at source. The engineering trade is genuine and it also reduces installation labour, which construction programmes value independently of the material saving involved.

Share Certified Platforms Across Application Ranges

Certification and compliance testing recur by market and by application, and telecom, data centre and industrial ranges each carry their own requirements. Designing families around common certified platforms spreads that testing considerably further across products. The architecture decision must be taken early, since retrofitting commonality into ranges developed separately is not realistically achievable afterwards.

Portfolio Architecture for Margin Defence

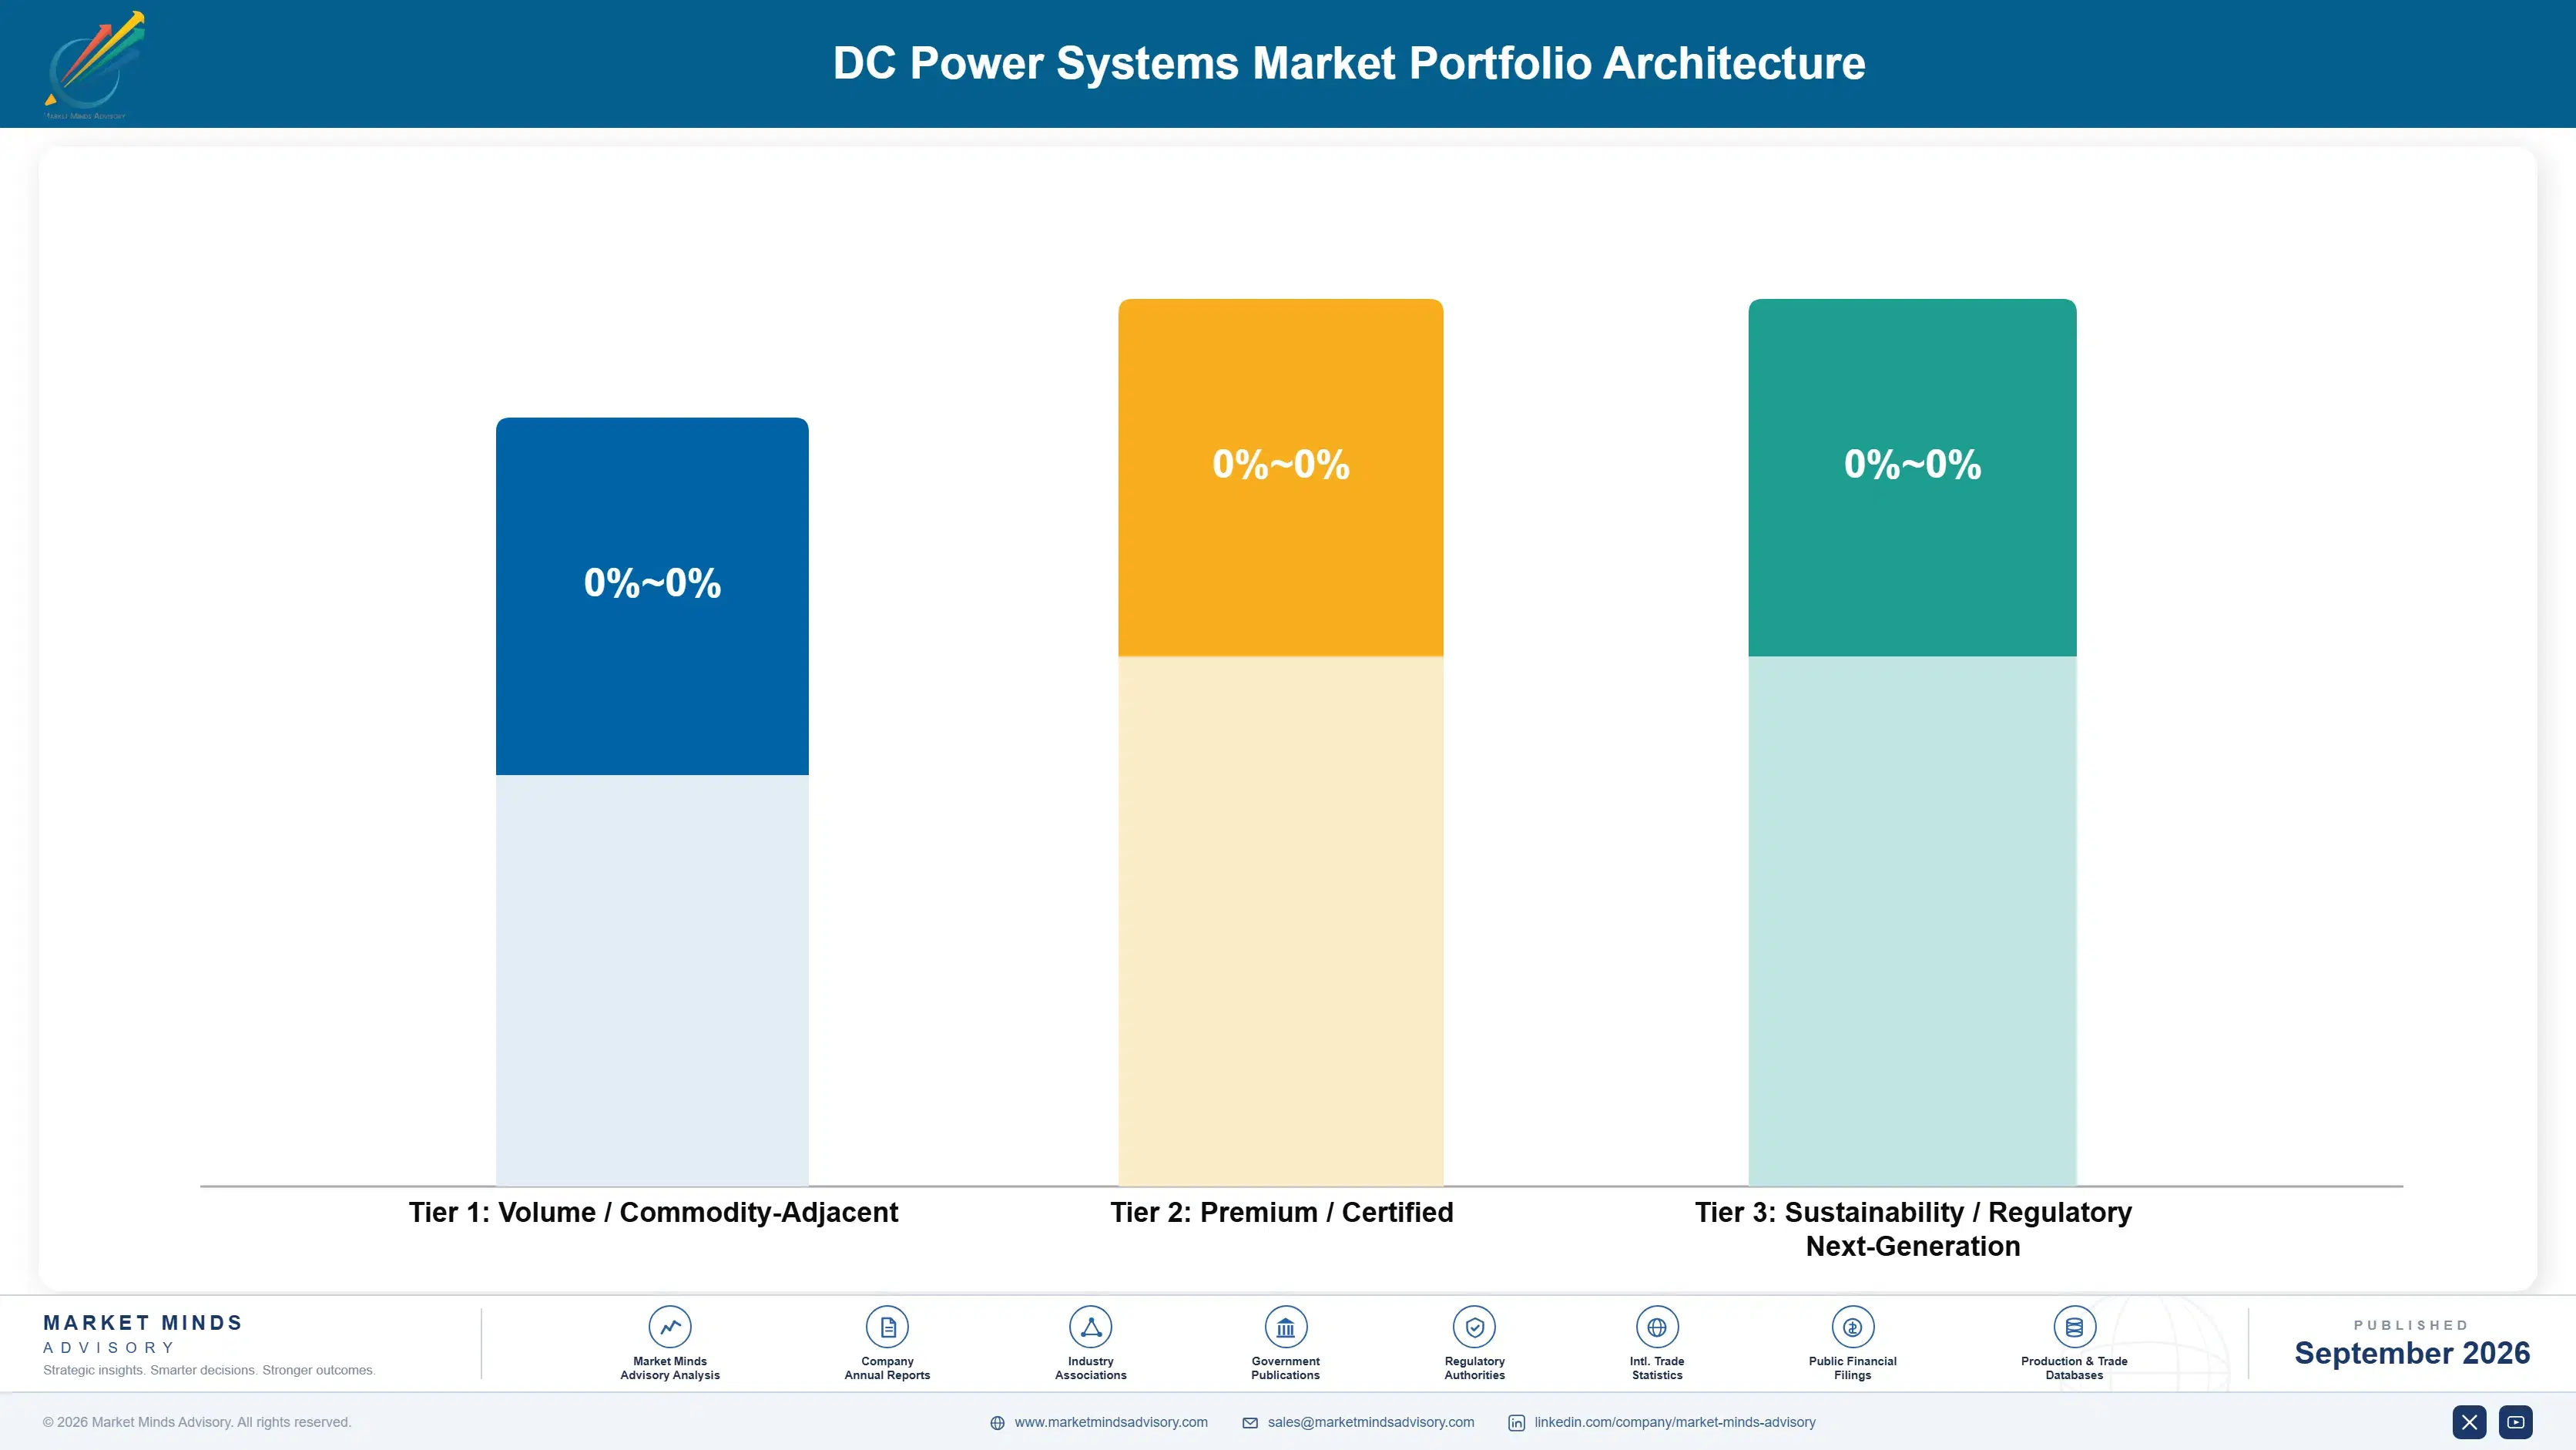
Margin architecture separates on installation difficulty rather than on conversion technology. Busway and distribution hardware earns least, since it is largely mechanical and competes on price against numerous suppliers. Conversion modules and telecom rectifier plant sit above on volume and reliability requirements. High voltage rack distribution, storage interfaces and power management software earn most, because each solves a problem operators cannot address any other way.
The volume versus premium tension runs between telecom replacement and data centre distribution, which reward opposite commercial behaviour entirely. Telecom rewards cost discipline and reliability across predictable replacement waves at modest unit values. Data centre rewards design stage presence and installation engineering at far higher values. Suppliers holding only one ride either construction volatility or a slow replacement cycle without the other providing ballast.

High-value pools concentrate in rack distribution and in storage interfaces, and neither is reached through conversion capability. Rack distribution requires installation engineering against physical constraints that vary by building. Storage coupling requires understanding an operator's grid services case rather than only its resilience one. Both explain why five suppliers hold 49% while the growth concentrates among those with design stage presence.

Volume / Commodity-Adjacent

Busway and distribution hardware, largely mechanical products competing on price against numerous capable suppliers with very little technical differentiation available anywhere. The eleven point spread separates suppliers designing for reduced conductor mass from those absorbing copper price exposure directly.
Gross Margin: 20% to 31%

Premium / Certified

Telecom rectifier and power plant systems and conversion modules, where reliability requirements and operator qualification determine selection alongside predictable replacement economics. The twelve point spread tracks certification amortisation across application ranges rather than any efficiency difference between competing products.
Gross Margin: 36% to 48%

Sustainability / Regulatory / Next-Generation

High voltage rack distribution, direct current uninterruptible supplies and storage interfaces and power management software, each solving a problem operators cannot address otherwise. The sixteen point spread reflects design stage presence and installation engineering depth against physical building constraints.
Gross Margin: 53% to 69%
dc-power-systems-market-portfolio-architecture-1790002853019

High-value Sub-segments and Strategic Watch-out

High Voltage Direct Current Rack Distribution

Grows at 14.7% because racks above 100 kilowatts cannot be fed through conventional alternating current architecture at all. The sixteen point spread reflects installation engineering depth. Retrofit feasibility near 38% ties the segment to new construction programmes. Design stage presence decides supply. Physics decides. Space is the constraint.
Gross Margin: 53% to 69%

Direct Current Uninterruptible Supplies And Storage Interfaces

Grows at 12.4% as around 27% of new installations pair distribution directly with on-site energy storage systems. The sixteen point spread reflects grid services understanding. Coupling on the direct current side removes conversion stages between battery and load. Grid services reach a revenue case. Revenue beats resilience.
Gross Margin: 53% to 69%

Telecom Rectifier And Power Plant Systems

Grows at 7.9% on replacement across an installed base averaging fourteen years and deployed in predictable generational waves. The twelve point spread reflects certification sharing. Demand arrives on wear rather than on any technology argument being won. Vintages make the waves predictable. Wear rather than argument.
Gross Margin: 36% to 48%

Busway And Distribution Hardware

Grows at 5.6%, slowest of the six classes, as largely mechanical product competing on price with minimal differentiation available. The eleven point spread reflects conductor mass design. Copper price exposure passes through directly to margin for most suppliers. Higher voltage cuts conductor mass. Installation labour falls too.
Gross Margin: 20% to 31%

Why Buildings Decide Adoption

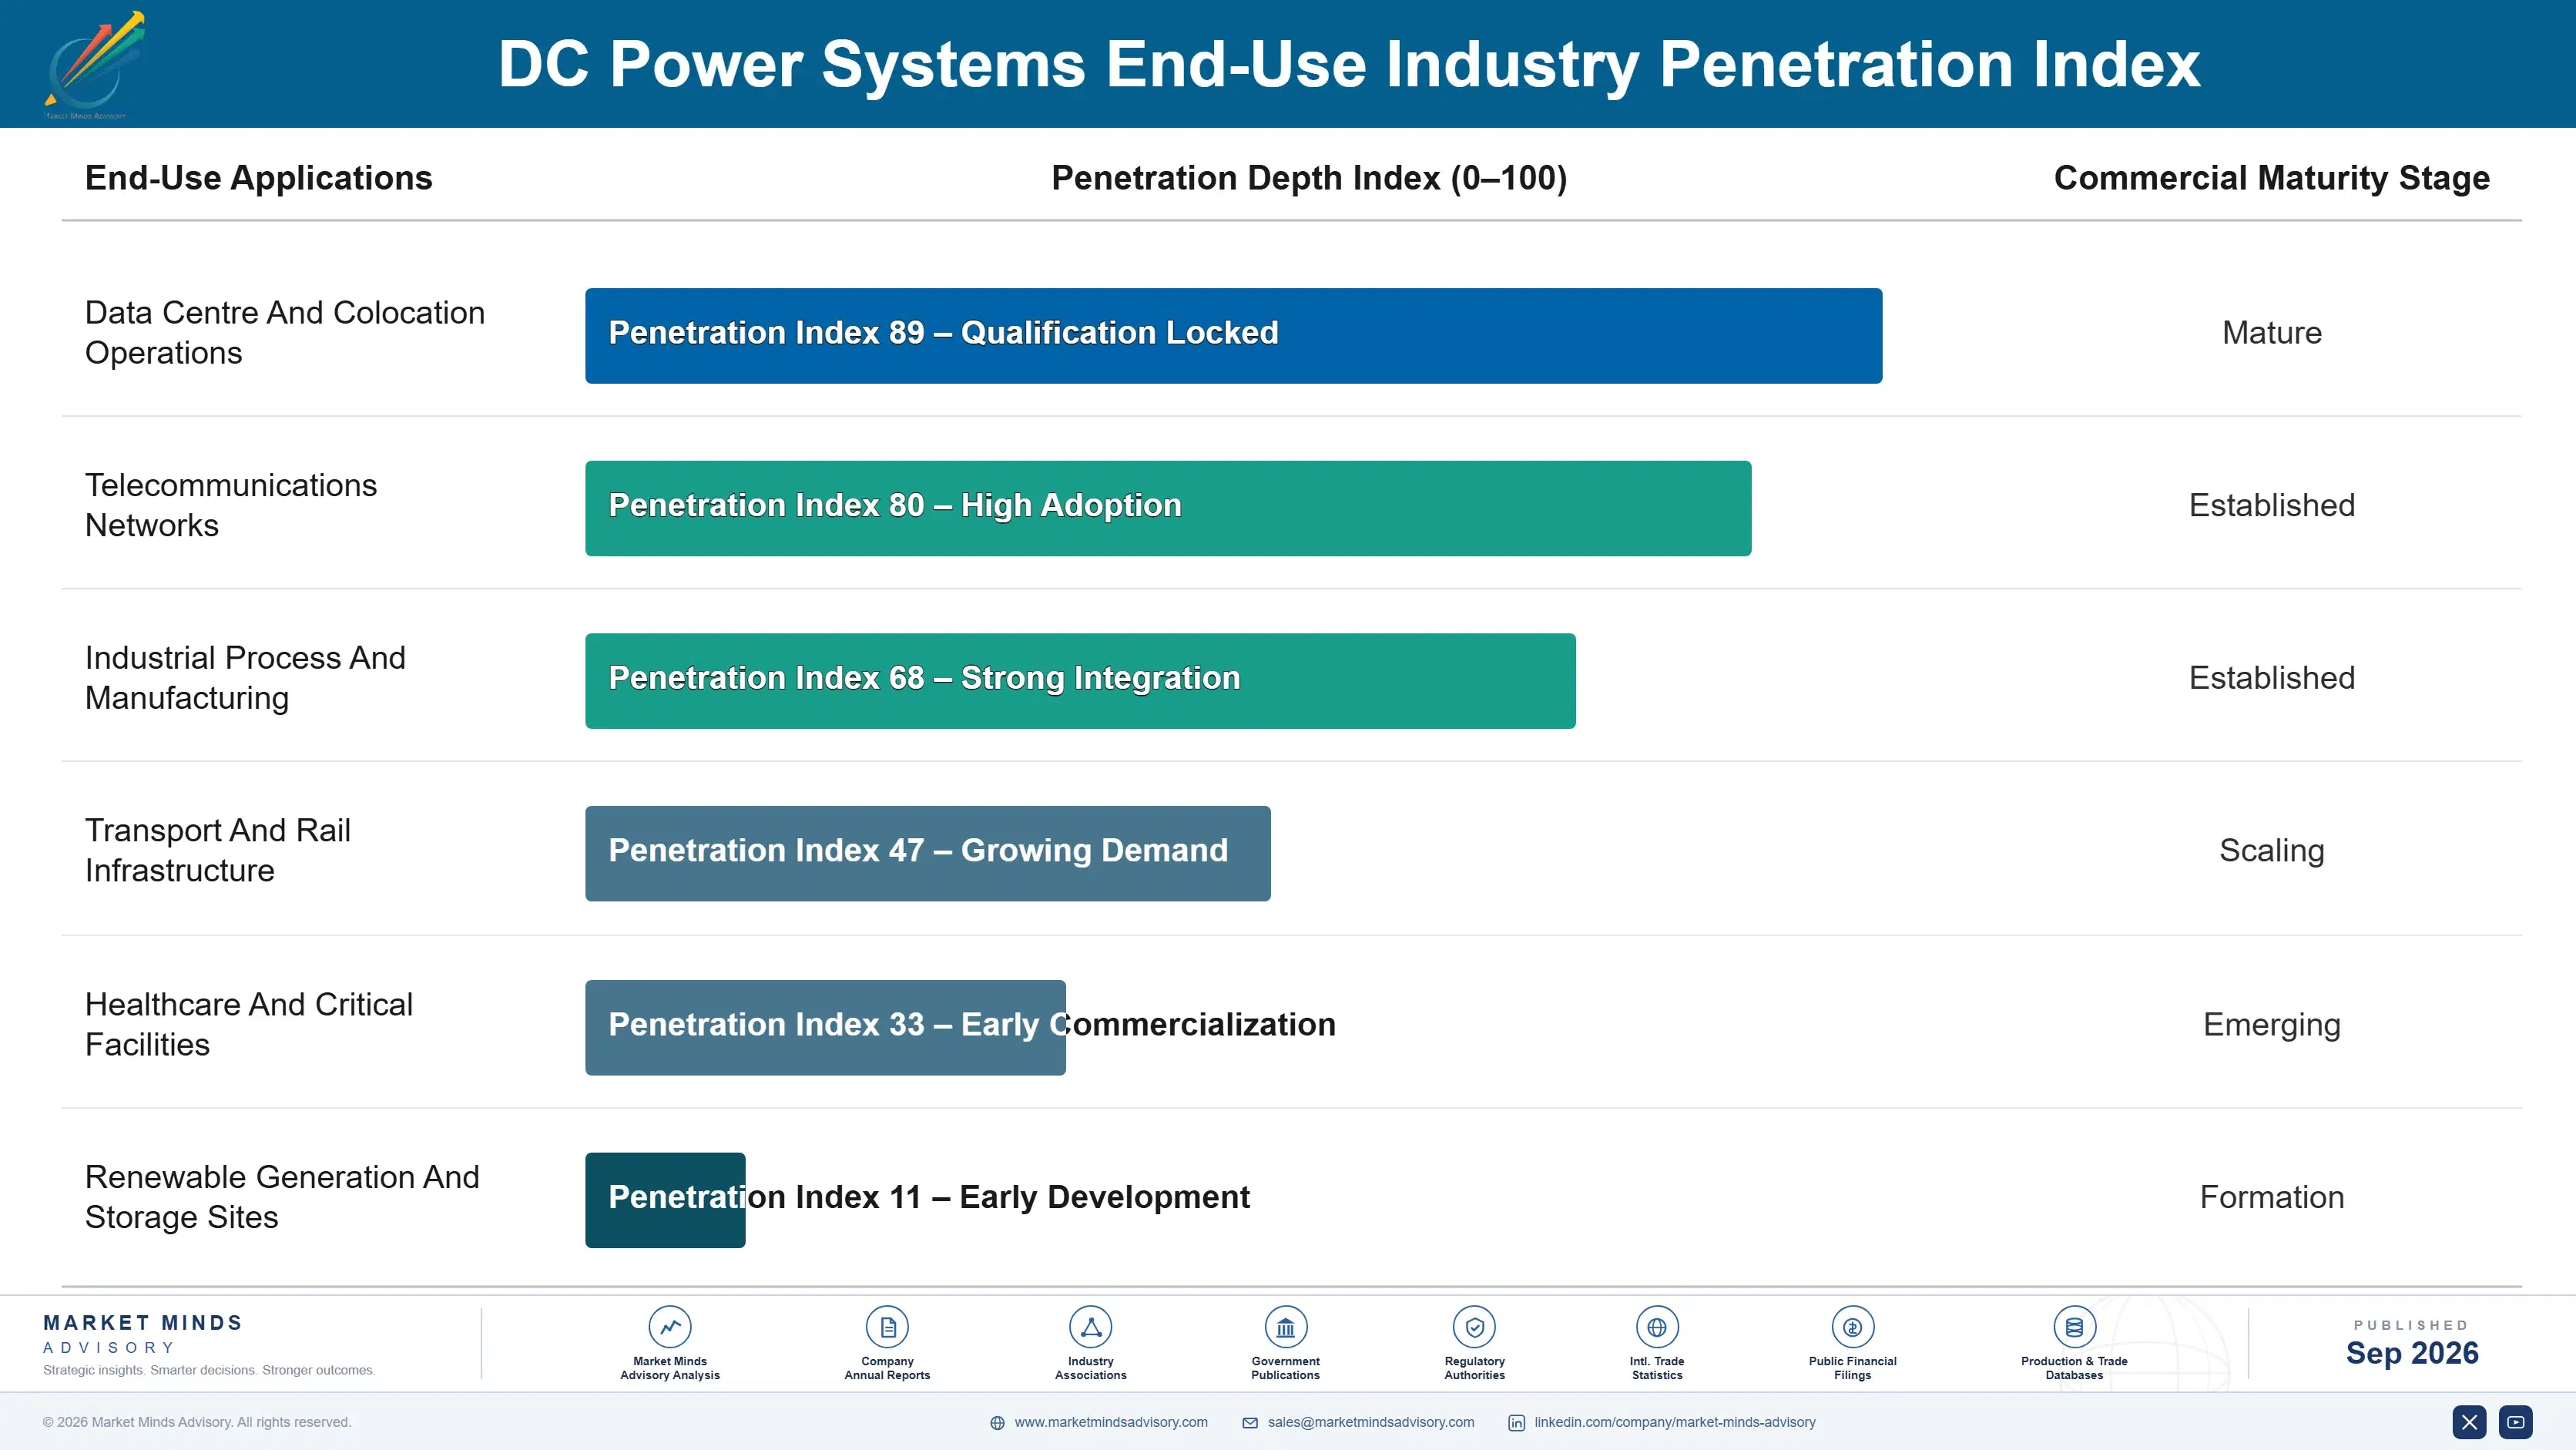
The annuity here is the building rather than any equipment relationship. Power distribution architecture is set during construction and revisited almost never, which is why only around 38% of operating facilities can convert economically at any point in their life. A supplier specified at design stage supplies that facility for decades. One selling into an operating building is asking for a change the structure was never designed to accommodate.
Depth varies by whether the supplier reached the engineering contractor. A specification written into a design package carries through construction, commissioning and every subsequent expansion of that facility without being re-competed. A supplier arriving at tender is bidding against a specification somebody else shaped. That difference is worth more than any product advantage here.

The buyer has changed as densities rose. A facilities engineer evaluated efficiency and reliability against an operating budget and mostly declined to change anything. A design engineer now evaluates whether the power architecture physically fits the rack densities the facility is being built for. An energy manager evaluates whether storage coupling produces grid services revenue. The first buyer said no for twenty years and no longer decides.
dc-power-systems-market-end-use-penetration-index-1790002853527

What Wins Power Projects

These are among the four positions where our research anticipates prominent divergence between winners and laggards over the coming forecast period. Each is grounded in the demand model, the regulatory perimeter, and the announced capacity pipeline.
01 / SPATIAL ARGUMENT FRAMING

Sell The Floor Space, Not The Losses

Conversion stages waste around 11% of energy and this industry accepted that quietly for twenty years without changing anything about how it built facilities. What actually moves a decision is that a rack drawing over 100 kilowatts cannot be fed conventionally once conversion hardware and cooling occupy space the compute needs. Suppliers still leading with loss figures are repeating an argument that has already failed in front of the same buyers and lost every time for two decades running without success.
02 / DESIGN STAGE COVERAGE

Reach Contractors, Not Operating Facilities

Only around 38% of existing facilities convert to direct current distribution economically, so the practical market is new construction where architecture is specified at design stage before anything is built. Suppliers positioned with engineering contractors reach that decision while competitors covering operating estate address the harder third. India compounds at 16.2% precisely because capacity there is being built rather than converted from something older, which is where this argument lands cleanly rather than converted from something older at design stage.
03 / STORAGE ATTACH DISCIPLINE

Couple The Battery, Sell The Revenue

Around 27% of new installations already pair distribution with on-site storage, and coupling on the direct current side removes conversion stages that would otherwise sit between the battery and the load. Operators adding batteries for grid services rather than backup duty reach a revenue case rather than a resilience one. That conversation converts far better than any efficiency argument and attaches equipment value distribution alone never carries at any point in a project or in any facilities budget that operators actually control.
04 / REPLACEMENT WAVE TRACKING

Follow The Vintages, Not The Tenders

Installed telecom rectifier plant averages around fourteen years and was deployed in waves across successive network generations, so it reaches replacement in waves anybody tracking vintages can anticipate years ahead. That demand arrives whether or not a technology argument is won, because the equipment simply wears out. Suppliers reaching those cycles at specification rather than at tender are where higher efficiency plant and storage coupling get written in before the tender ever opens and specification is already settled by somebody else.

Engagement Snapshot From the Field

A live engagement with an industry participant carrying material or product regulatory and market exposure ahead of a defining policy shift, showing how our research translates into a defensible multi-year portfolio strategy.
MARKET MINDS ADVISORY · CLIENT ENGAGEMENT SUMMARY
DC Power Systems Producer Strategic Portfolio Review and Transition Roadmap 2026·Investment Scenario on DC Power Systems Exposure Evaluation 2025-26
CLIENT PROFILE
A colocation operator running eleven existing facilities and planning two new builds, facing customer demand for rack densities its current alternating current architecture could not support anywhere. Management had commissioned a conversion study across the whole estate, assuming the answer would be a phased programme rather than a fundamental constraint. Nobody had surveyed the buildings first.
STRATEGIC CHALLENGE
Engineering wanted estate-wide conversion for operational consistency across sites. Finance wanted the capital case for each facility separately. Nobody had established which buildings could physically accommodate the change, and two customers had already asked for high density capacity that the operator was preparing to commit to without knowing where it could be delivered.
MMA APPROACH
MMA surveyed each facility for conversion feasibility against structure, containment and cooling capacity, and costed the work per site rather than as a programme. We compared conversion cost against high density zones within otherwise unchanged buildings. Work drew on 47 expert interviews conducted in Q4 2025 with operators, power system suppliers and engineering contractors.
KEY FINDINGS
  1. Only 4 of the 11 existing facilities could convert economically, and the others would have required structural work costing more than the buildings were worth.
  2. Contained high density zones inside unconverted buildings delivered most of the customer requirement at a small fraction of full conversion cost per facility.
  3. The 2 new builds could specify direct current distribution at design stage at almost no premium over conventional architecture (client-reported, unverified by MMA).
  4. Committing to customer density requirements before establishing feasibility would have created contractual obligations that the existing estate could not physically have met.
CLIENT PROFILE
A colocation operator running eleven existing facilities and planning two new builds, facing customer demand for rack densities its current alternating current architecture could not support anywhere. Management had commissioned a conversion study across the whole estate, assuming the answer would be a phased programme rather than a fundamental constraint. Nobody had surveyed the buildings first.
STRATEGIC CHALLENGE
Engineering wanted estate-wide conversion for operational consistency across sites. Finance wanted the capital case for each facility separately. Nobody had established which buildings could physically accommodate the change, and two customers had already asked for high density capacity that the operator was preparing to commit to without knowing where it could be delivered.
MMA APPROACH
MMA surveyed each facility for conversion feasibility against structure, containment and cooling capacity, and costed the work per site rather than as a programme. We compared conversion cost against high density zones within otherwise unchanged buildings. Work drew on 47 expert interviews conducted in Q4 2025 with operators, power system suppliers and engineering contractors.
KEY FINDINGS
  1. Only 4 of the 11 existing facilities could convert economically, and the others would have required structural work costing more than the buildings were worth.
  2. Contained high density zones inside unconverted buildings delivered most of the customer requirement at a small fraction of full conversion cost per facility.
  3. The 2 new builds could specify direct current distribution at design stage at almost no premium over conventional architecture (client-reported, unverified by MMA).
  4. Committing to customer density requirements before establishing feasibility would have created contractual obligations that the existing estate could not physically have met.
RECOMMENDED STRATEGY
Phase 1: Phase one: stop the estate-wide conversion programme entirely, since only four of eleven facilities could convert at economically defensible cost. Phase 2: Phase two: build contained high density zones inside unconverted buildings, which meets most customer requirement at far lower capital cost. Phase 3: Phase three: specify direct current distribution at design stage on both new builds, where the premium over conventional architecture is minimal.
OUTCOME
The operator abandoned estate-wide conversion and built contained high density zones instead (client-reported, unverified by MMA). Customer density requirements were met at substantially lower capital cost, and both new builds specified direct current at design. Feasibility is now established before any density commitment, which is the change that outlasted the engagement.

Frequently Asked Questions

Foundational context covering the market sizes, CAGR, scope, country, region and competition that inform every finding below. This section is provided to cover basics and most often pre-purchase conversations, answered from the MMA Primary Research Dataset.

What is the current size of the DC Power Systems Market?

Global value reaches USD 14.1 billion in 2026, measured as direct current power system revenue across six classes. The 2025 base was USD 12.8 billion.

How large will the DC Power Systems Market be by 2036?

The market reaches USD 35.9 billion by 2036, an increase of USD 21.8 billion across the forecast period. That represents 2.55 times expansion from the 2026 base.

What is the CAGR for the DC Power Systems Market 2026 to 2036?

The base case runs at 9.8% annually, with a bull case at 11.1% if accelerator rack densities rise faster than planned and a bear case at 8.6% if retrofit friction slows conversion.

Which segment is growing fastest?

High voltage direct current rack distribution grows at 14.7%, half again the market rate of 9.8%. Racks above 100 kilowatts cannot be fed through conventional architecture.

Who are the major companies in the DC Power Systems Market?

Vertiv, Delta Electronics, Eaton, Schneider Electric and Huawei Technologies lead on system revenue, holding 49% between them. ABB and Legrand hold smaller positions in the category.

Which country is growing fastest?

India leads at 16.2%, because data centre capacity is being built rather than retrofitted and specification happens at design stage. China and Vietnam follow behind.

Report Segmentation Architecture

The full report scope spans multiple orthogonal segmentation dimensions, with cross-tabulated demand data provided for each dimension pair. Coverage extends further to regional breakdowns, trend trajectories, and the competitive detail needed to support segment-level decision-making.

By System Class And Application

  • High Voltage Direct Current Rack Distribution
  • Direct Current Uninterruptible Supplies And Storage Interfaces
  • Monitoring And Power Management Software
  • Telecom Rectifier And Power Plant Systems
  • Conversion Modules
  • Busway And Distribution Hardware

By End-Use Industry

  • Data Centre And Colocation Operations
  • Telecommunications Networks
  • Industrial Process And Manufacturing
  • Transport And Rail Infrastructure
  • Healthcare And Critical Facilities
  • Renewable Generation And Storage Sites

By Commercial Dimension

  • Engineering Contractor Design Specification
  • Direct Operator Procurement
  • Original Equipment Manufacturer Supply
  • Electrical Distribution Channel
  • Framework Agreement Supply
  • Service And Maintenance Contracting

By Region

  • North America
  • Western Europe
  • East Asia
  • South Asia and Pacific
  • Latin America
  • Middle East and Africa
  • Eastern Europe

Scope, Methodology, and Coverage

Every figure in this report is reproducible from documented input assumptions. The scope below maps the historical period, the forecast horizon, the segmentation dimensions, and the countries covered, alongside the underlying primary and qualitative methodology.
Historical Period
2020 to 2025
Forecast Period
2026 to 2036
Base Year
2025 (USD billions; MMA Primary Research Dataset, September 2026)
Market Definition
This report covers direct current power systems: equipment converting, distributing and protecting direct current power across telecommunications, data centre, industrial and transport applications, spanning high voltage rack distribution, telecom rectifier and power plant systems, direct current uninterruptible supplies and storage interfaces, busway and distribution hardware, monitoring and power management software, and conversion modules. It excludes alternating current uninterruptible supplies, standby generation, utility transmission equipment, vehicle charging infrastructure, and battery cells sold separately.
Quantitative Units
USD millions, direct current power system revenue basis; systems and rectifier plant shipped; conversion stage losses as a percentage; rack density thresholds in kilowatts; retrofit feasibility rates; installed plant age in years; storage coupled share of installations.
Segmentation Dimensions
System class and application; end-use industry; commercial specification route; geography across seven regions.
Regions Covered
North America, Western Europe, East Asia, South Asia and Pacific, Latin America, Middle East and Africa, Eastern Europe
Countries Covered
China, Japan, South Korea, Taiwan, Singapore, India, Australia, Vietnam, United States, Canada, Mexico, Brazil, Germany, France, Netherlands, United Kingdom, Ireland, Poland, Saudi Arabia, South Africa.
Key Companies Profiled
Vertiv, Delta Electronics, Eaton, Schneider Electric, Huawei Technologies, ABB, Legrand, Socomec, Piller Power Systems, GE Vernova, Mitsubishi Electric, Fuji Electric, Hitachi Energy, Benning, AEG Power Solutions.
Quantitative Methodology
Primary survey, n=3,800 respondents, Q4 2025, six countries; demand-side model with trade association cross-validation
Qualitative Methodology
47 expert interviews, Q4 2025; applied to validate demand model assumptions, identify emerging dynamics, and assess competitive positioning
Report Format
PDF and XLSX data workbook (Word format preview document)
Publisher
Market Minds Advisory
Report Code
MMA-2026-ENE-201
Published
September 2026
Contact
sales@marketmindsadvisory.com | www.marketmindsadvisory.com

Purchase the full DC Power Systems Market Report (2026 to 2036).

This report sizes the global direct current power systems market from 2026 to 2036 across six system classes, six industries and seven regions. It explains why rack densities above 100 kilowatts rather than conversion losses near 11% are what finally moved this market after twenty years of unsuccessful efficiency arguments. Retrofit feasibility limited to around 38% of existing facilities is analysed as the constraint tying growth to new construction programmes. Storage coupling on around 27% of new installations is examined as the revenue argument that converts where efficiency did not. Regional analysis explains why East Asia holds 34% of spending.
Six system classes sized through to 2036
Rack density thresholds quantified against distribution architecture limits
Retrofit feasibility analysed across existing facility estate
Twenty named suppliers assessed on system revenue
Four revenue levers with quantified commercial impact
Anonymised colocation operator architecture engagement documented in full

Built For The People Who Decide

From boardroom strategy to bench-side execution, this report is read cover-to-cover by leaders shaping the next decade of their industry, turning demand scenarios, market dynamics and valuation benchmarks into decisions.
CXOs/ Presidents/ VPs/ Managers
M&A and Corporate Development
Strategy Teams and R&D Heads
Procurement and Product Directors
Regulatory and Compliance Leaders
Investor Relations and Equity Analysts