

Market Minds Advisory
Datacenter Grid Interface Equipment Market

Datacenter Grid Interface Equipment Market: Datacenter Grid Interface Equipment Market: Equipment Classes, Lead Time Scarcity and Grid Code Compliance 2026 to 2036

A large power transformer takes around four years from order to delivery, and no amount of capital shortens that. Whoever ordered speculatively in 2022 holds something nobody can buy today.

Lead Analyst

Published

September 2026

Make Smarter Decisions with Customized Research Insights

Request a free sample report and evaluate market opportunities, growth trends, and competitive dynamics relevant to your business needs.

2025 MARKET VALUE$9.4BMarket Size 2025
2036 FORECAST VALUE$42.9BBase Case , 2026 to 2036
CAGR 2026 TO 203614.8 %Bull 16.1% / Bear 13.5%
INCREMENTAL OPPORTUNITY$32.1BNet 10- year value creation
EXPANSION MULTIPLE3.98x2036 value over 2026 base
Strategic Levers
M&A Pipeline
Regional Outlook
Country Rankings
Competitive Intelligence
Segmental Deep-dive
Call-Us : 91 93563 13602

Executive Snapshot and Market Trajectory.

The lead time is the market. A large power transformer runs around 42 months from order to delivery and no amount of capital compresses that, because the constraint is electrical steel and a handful of factories nobody wants to expand. Everything downstream follows from that single fact.
The market reaches USD 10.79 billion in 2026 and USD 42.90 billion by 2036, a 3.98 times expansion at 14.8%. Grid-forming inverters and battery interface systems grow at 22.2%, half again the market rate of 14.8%, because utilities now require data centres to behave as active grid participants rather than as passive load drawing supply. North America holds 34% of equipment revenue while East Asia leads on connected megawatts. Malaysia grows fastest at 22.4%.
Five manufacturers hold 71% of equipment and installation revenue, which makes this among the most concentrated categories serving the data centre industry anywhere. Schneider Electric, ABB, Siemens Energy, Eaton and Hitachi Energy built those positions on transformer and switchgear manufacturing across decades. Order book coverage now runs well beyond three years, so the genuinely scarce commodity here is a delivery slot rather than any discount.
Market Definition
This report covers electrical equipment installed at the boundary between the utility grid and a data centre facility: medium voltage switchgear and ring main units, power transformers and unit substations, static transfer switches and automatic transfer systems, grid-forming inverters and battery interface systems, protection relays and grid compliance controllers, and on-site generation interconnection equipment. It excludes uninterruptible power supplies inside the white space, rack power distribution, cooling plant, generator sets themselves, and utility network assets beyond the point of connection.
Base Year Value
$9.4B in 2025 (MMA Primary Research Dataset, September 2026)
Forecast Period
2026 to 2036, eleven discrete annual values
CAGR
14.8% base case. Bull 16.1%. Bear 13.5%.
Fastest Growth Segment
Grid-Forming Inverters And Battery Interface Systems: 22.2% CAGR
Fastest Growth Country
Malaysia: 22.4% CAGR
Fastest Growth Region
South Asia and Pacific: 16.9% CAGR
Largest Region
North America: 34% of 2025 global value
Market Leaders
Schneider Electric, ABB, Siemens Energy, Eaton and Hitachi Energy lead on grid interface equipment shipment and installation revenue. Source: MMA Analysis.
Primary Survey
n=3,800 procurement and R&D decision-makers, Q4 2025, six countries
Methodology
Demand-side build-up, cross-validated against public data, 47 expert interviews

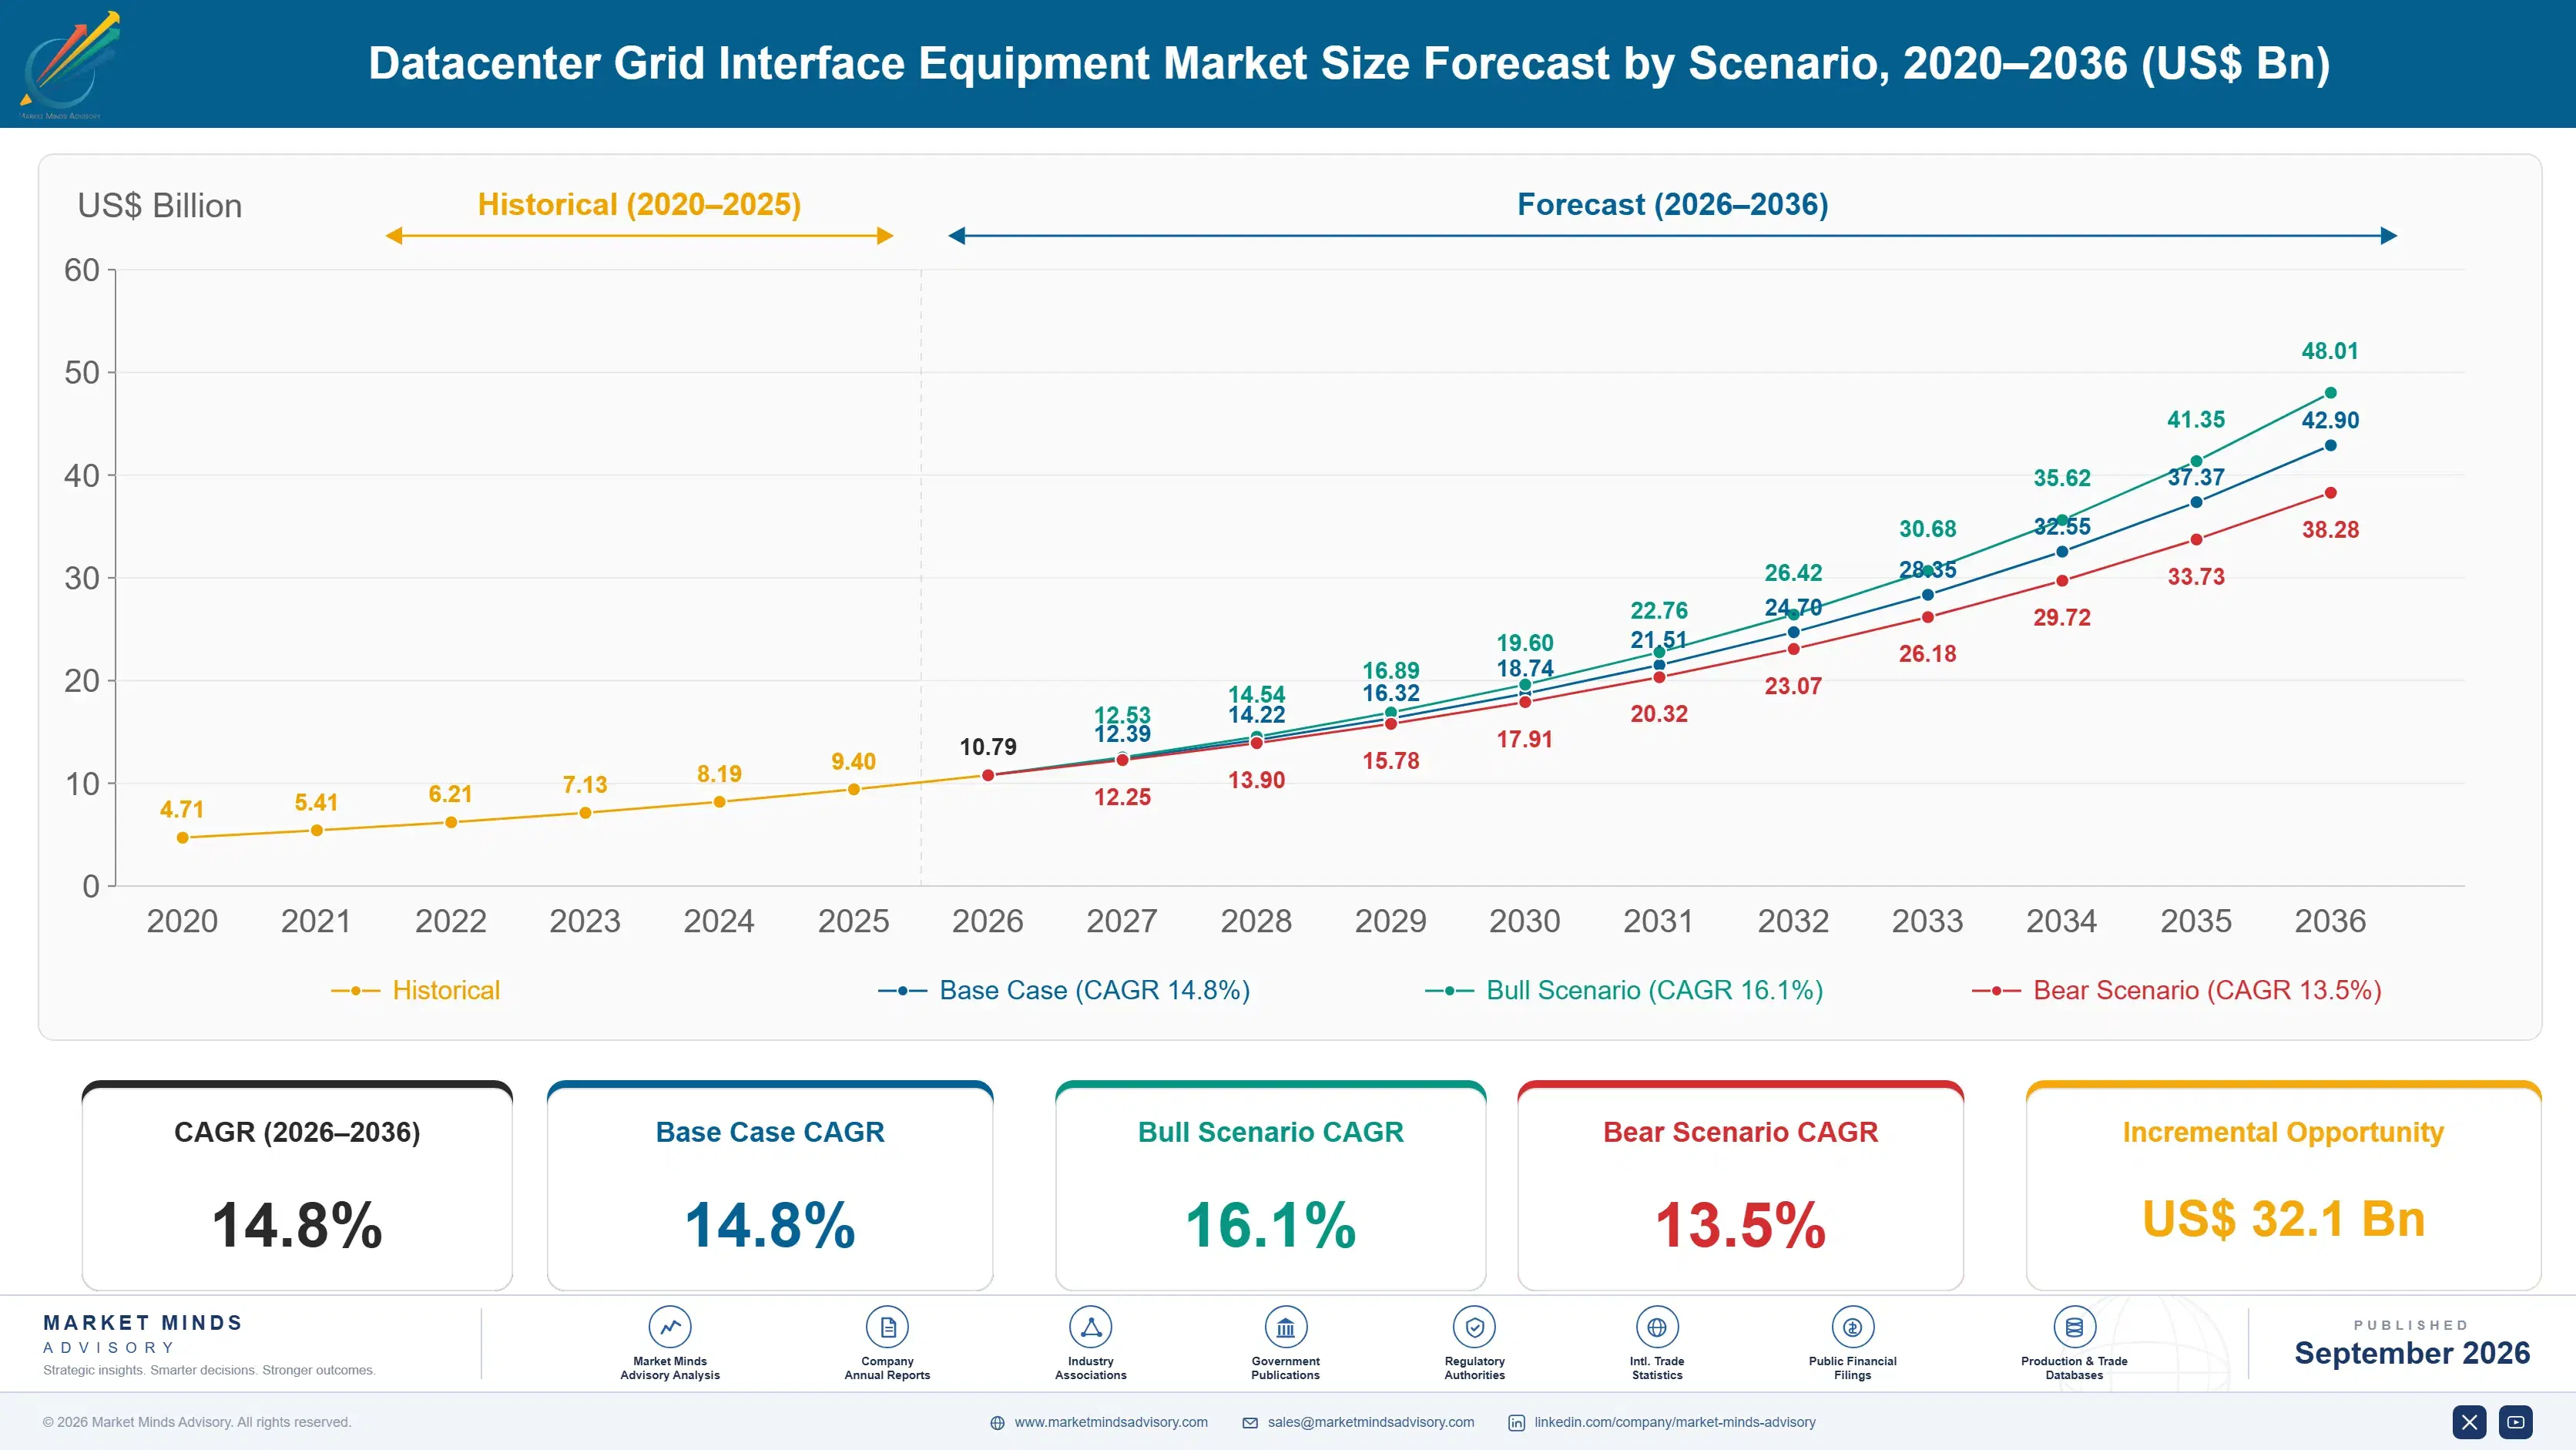
Datacenter Grid Interface Equipment Market Forecast Scenarios

datacenter-grid-interface-equipment-market-size-forecast-scenario-1789990577437
Between 2020 and 2025 the category compounded at 13.4%, and the character changed completely from the second year onward. Early growth was ordinary data centre construction. From roughly 2023 artificial intelligence capacity demand arrived faster than any electrical supply chain had planned for, transformer lead times stretched past three years, and equipment availability rather than capital became the item deciding which projects could actually proceed.
The base case holds 14.8% on three mechanisms. Artificial intelligence campus construction continues at densities that require far more grid interface equipment per megawatt than conventional facilities ever did. Utilities in constrained regions keep tightening interconnection conditions, obliging facilities to provide ride-through, reactive support and curtailment response they previously never needed. And on-site generation and storage interconnection is becoming standard practice wherever grid connection queues make simply waiting a commercially impossible option.
The bull case at 16.1% assumes transformer manufacturing capacity expands materially, releasing projects currently waiting on delivery slots rather than on funding. The bear case at 13.5% is an artificial intelligence capital spending pause: order books running beyond three years mean cancellations would arrive against production already scheduled, and manufacturers would face a demand cliff rather than a gentle slowdown.

Delivery Slots, Not Discounts

A large power transformer takes around 42 months from order to delivery, and capital does not shorten it. The binding constraint is grain-oriented electrical steel and a small number of winding factories that nobody wants to expand against a demand spike they suspect will not last. A developer who ordered speculatively in 2022 now holds an asset a better funded competitor cannot buy at any price at all.
TOP FIVE CONCENTRATION71%Highly concentrated among a few global electrical equipment manufacturers
TRANSFORMER LEAD TIME42 monthsFrom order placement to delivery for large power units
INTERFACE COST PER MEGAWATTUSD 310,000Electrical equipment at the boundary between grid and facility
GRID CODE COMPLIANCE TESTS18Distinct requirements before a utility permits connection anywhere
BACKUP AUTONOMY PROVIDED12 minutesBattery bridging time before generation assumes the full load
ORDER BOOK COVERAGE3.4 yearsManufacturer backlog measured against current annual production capacity
The grid stopped being a passive supply and nobody sent a memorandum about it. Utilities in constrained regions now impose interconnection conditions requiring fault ride-through, reactive power support and curtailment response, with around 18 distinct compliance tests before a connection is permitted. A facility designed in 2018 has none of that equipment. Grid-forming inverters, compliance controllers and protection systems are consequently the fastest growing part of this market.
The slowest growing segment is the one everybody most urgently needs, which is a genuinely unusual situation. Power transformers compound at 9.2% not because demand is weak but because manufacturing capacity is the binding constraint. In that segment growth measures supply rather than demand, and order books beyond three years are what that looks like.
"Data centre developers used to negotiate electrical equipment on price and delivery. Now they negotiate on delivery, and then on delivery again. I have watched a project team accept a twelve percent premium without a second meeting because it moved a transformer forward by nine months."
Director, Electrical Infrastructure and Grid Systems Practice · MMA Energy and Electrical Equipment Practice · September 2026

Market Trends

Lead Times Turned Equipment Into The Scarce Asset

A large power transformer runs around 42 months from order to delivery and order book coverage across the major manufacturers exceeds three years. That converts a commodity electrical component into the item deciding which data centre projects can proceed at all, regardless of how well funded they are. Developers who placed speculative orders before 2023 hold delivery slots that competitors cannot purchase at any premium. Capital was never the constraint in this industry and land has not been for some time, and now the constraint is a factory schedule nobody controls.
Market Impact: Interconnection equipment compounds at 17.6%

Utilities Made Data Centres Behave Like Grid Participants

Interconnection conditions in constrained regions now require fault ride-through, reactive power support, frequency response and curtailment obedience, with around 18 distinct compliance tests before a utility permits connection. A facility becomes a participant in grid stability rather than a load drawing from it. That obliges grid-forming inverters, battery interface systems and compliance controllers that no data centre designed in 2018 carried. Those segments compound at 22.2% and 19.4% respectively, considerably ahead of the iron they sit alongside, and retrofit demand is arriving from existing campuses too. Compliance conditions apply at reconnection too.
Market Impact: Malaysia compounds at 22.4% annually

Market Opportunities and Growth Drivers

On-Site Generation Interconnection Bypasses The Connection Queue

Grid connection queues in constrained metropolitan areas run years, and a developer holding land, capital and a signed tenant can still deliver nothing while waiting. On-site generation with grid interconnection equipment allows a facility to energise ahead of full utility supply, or to operate at partial import with local generation covering the balance. That equipment compounds at 17.6% on projects that would otherwise sit idle. It is expensive, contentious with local authorities and frequently the only route available to a project with a delivery date. Local opposition is frequently the harder problem.
Market Impact: Transformer growth capped at 9.2%

Southeast Asian Construction Absorbed The Singapore Overflow

Singapore's moratorium on new data centre capacity redirected an enormous pipeline across the causeway into Johor, where land, power and water were all available at a fraction of Singapore cost. Malaysia compounds at 22.4%, ahead of any other country, on construction that arrived faster than the local grid was designed to serve. Every one of those facilities needs full grid interface equipment specified from scratch rather than expanded from an existing installation. Indonesian and Vietnamese development is following comparable logic at a somewhat smaller scale. Grid capacity there was never designed for this.
Market Impact: Interface cost near USD 310,000

Market Restraints and Challenges

Manufacturing Capacity Cannot Respond To The Spike

Transformer output is limited by grain-oriented electrical steel supply and by a small number of winding facilities, and expanding either takes years against a demand surge manufacturers suspect may not persist. The root cause is that a factory built for this cycle depreciates across three decades, and the last comparable spike ended badly for everybody who expanded into it. Commercially this caps segment growth at 9.2% while demand runs far higher. Mitigation runs through capacity reservation agreements, refurbishment of retired units and design substitution toward smaller distributed transformers. None of those routes creates new steel capacity.
Market Impact: Transformer delivery runs 42 months

Grid Code Compliance Adds Cost Nobody Originally Budgeted

Around 18 distinct compliance tests now stand between a facility and permission to connect, covering ride-through, reactive support, harmonics and curtailment response across conditions a data centre was never designed to meet. The root cause is that grids built for predictable industrial load are absorbing concentrated demand that behaves nothing like it. Commercially this adds equipment and engineering cost to budgets fixed years earlier at around USD 310,000 per megawatt. Mitigation runs through early utility engagement, compliance-ready equipment selection and designing for the conditions likely rather than merely current. Budgets fixed years earlier absorb it directly.
Market Impact: Around 18 compliance tests required
3 additional market trends, 4 additional growth drivers, and 2 additional restraints and challenges are covered in the full report. Contact sales@marketmindsadvisory.com to access the complete intelligence.

Segment CAGR and Growth Architecture

Segmentation follows equipment class at the grid boundary, since what each device does determines its lead time, its supply concentration and who specifies it. Six classes cover the market: grid-forming inverters and battery interface, protection relays and compliance controllers, on-site generation interconnection, static transfer switches, medium voltage switchgear, and power transformers. Facility type is a separate dimension.
datacenter-grid-interface-equipment-market-market-share-analysis-1789990577973

Grid-Forming Inverters And Battery Interface Systems

Grid-forming inverters and battery interface systems grow at 22.2%, half again the market rate of 14.8%, because utilities stopped treating data centres as passive load. Interconnection conditions in constrained regions now require fault ride-through, reactive power support and frequency response, which a conventional rectifier front end simply cannot provide. Grid-forming equipment allows a facility to support voltage and frequency rather than merely consuming from them, and to bridge around 12 minutes of autonomy before generation assumes the load. Retrofit demand is arriving from existing campuses alongside new construction, since compliance conditions apply at reconnection as well as at first energisation. Rectifier front ends cannot provide any of that behaviour. That distinction matters commercially.
CAGR 22.2%

Protection Relays And Grid Compliance Controllers

Protection relays and compliance controllers compound at 19.4% on the roughly 18 distinct tests a utility now requires before permitting connection. Those cover ride-through envelopes, harmonic limits, reactive support and curtailment obedience, and each has to be demonstrated with equipment capable of proving the behaviour under fault conditions rather than merely claiming it. A facility designed in 2018 carries none of this. The commercially interesting feature is that the specification is written by a utility rather than by the customer, which makes it a compliance purchase where price matters considerably less than approved capability and demonstrated test evidence do. Test evidence rather than specification claims decides these awards. Price matters remarkably little here.
CAGR 19.4%
Full segment breakdown across 6 segments available in the complete report.

Regional Architecture and Country Demand Map

North America holds 34% of equipment revenue on the largest construction pipeline anywhere and the most expensive grid interface per megawatt. East Asia leads on connected megawatts while ranking second on revenue, because Chinese domestic equipment costs considerably less for each installed megawatt of capacity.

North America

North America holds 34% of equipment revenue, above the 32% band ceiling, on the largest construction pipeline anywhere combined with the highest interface cost per megawatt. Constrained utilities in Northern Virginia, Texas and Arizona impose interconnection conditions requiring far more equipment than a straightforward connection would need, and connection queues push developers toward on-site generation interconnection that adds further cost. Eaton and GE Vernova manufacture here alongside the European majors. Transformer lead times exceeding 42 months are felt more acutely here than anywhere. Growth at 14.2% sits close to the global rate on a very large base. Connection queues push developers toward on-site generation that adds further equipment cost to every project.
Share: 34% | CAGR: 14.2% (2026 to 2036)

East Asia

Twenty-two percent of equipment revenue reaches East Asia, which understates the region considerably because it leads the world on connected megawatts. Chinese data centre construction exceeds any other national programme and is served largely by domestic electrical manufacturers at prices well below international equipment, so revenue share and capacity share diverge sharply here. Japanese and Korean manufacturers including Mitsubishi Electric, Toshiba Energy Systems, Hyundai Electric and LS Electric supply both domestic projects and export markets. Growth at 15.8% sits above the global rate. Measuring this region by revenue rather than megawatts genuinely misrepresents what is happening. Revenue share and installed capacity share diverge more sharply here than in any other region on earth.
Share: 22% | CAGR: 15.8% (2026 to 2036)
Regional intelligence for 5 additional markets available in the complete report: Western Europe, South Asia and Pacific, Latin America, Middle East and Africa, Eastern Europe. Contact sales@marketmindsadvisory.com.
datacenter-grid-interface-equipment-market-country-cagr-analysis-1789990578501

What Wins In A Constrained Market

Manufacturing capacity rather than demand sets the pace in the one segment that everybody needs most, utilities rather than customers now write the specification for the fastest growing segments, and a delivery slot is worth considerably more than any discount. Each of the four levers below works with those conditions rather than against them.

Sell Delivery Slots Rather Than Equipment Pricing

A large power transformer runs around 42 months from order to delivery and manufacturer order books cover more than three years of production. In that environment a developer will accept a substantial premium to move delivery forward, and several routinely do so without a second meeting. Manufacturers still negotiating on unit price are leaving margin on a table the customer is not even looking at. Reservation fees, priority slots and capacity options price the thing that is actually scarce, and very few suppliers have restructured commercial terms around it. Scarcity is priceable and almost nobody prices it.
Market Impact: A 42 month lead time reprices the whole negotiation

Build Compliance Evidence Before Utilities Demand It

Around 18 distinct tests now stand between a facility and permission to connect, covering ride-through, reactive support, harmonics and curtailment obedience under fault conditions. The specification is written by a utility rather than by the customer, which makes approved capability and documented test evidence worth far more than price. Suppliers arriving with completed compliance packages for a given grid code shorten a developer's approval timeline by months, and that is worth more to a project with a delivery date than any equipment discount could ever be. Approval timelines shorten by months as a result.
Market Impact: All 18 compliance tests now decide connection approval

Serve The Projects That Cannot Wait For Grid

Connection queues in constrained metropolitan areas run years, and a developer with land, capital and a signed tenant can still deliver nothing at all. On-site generation interconnection equipment lets a facility energise ahead of full utility supply or run at partial import, and it compounds at 17.6% on projects that would otherwise sit idle indefinitely. The equipment is expensive and contentious with local authorities, and it is frequently the only route available to a project carrying a contractual delivery date it cannot move. Nothing else energises a project sitting in a multi-year queue.
Market Impact: Interconnection equipment compounds at 17.6% every single year

Follow Construction Into Newly Opened Geographies

Singapore's moratorium redirected an enormous pipeline into Johor, and Malaysia now compounds at 22.4% on construction that arrived faster than the local grid was ever designed to serve. Every facility in a newly opened geography specifies full interface equipment from scratch rather than expanding an existing installation, which is a considerably larger order per site. Those pipelines are visible in planning applications and utility connection filings years ahead, and suppliers organised around established markets keep arriving after specification is closed. Planning applications and utility filings show those pipelines years ahead, and suppliers organised around established markets arrive too late.
Market Impact: Malaysia compounds at 22.4% on new construction alone

Who Controls the Margin Pool

Five manufacturers hold 71% of grid interface equipment and installation revenue, making this among the most concentrated categories serving data centre construction anywhere. Schneider Electric, ABB, Siemens Energy, Eaton and Hitachi Energy built positions on transformer and switchgear manufacturing that took decades and enormous capital to establish. Order book coverage across the group exceeds three years. All participants are assessed on equipment shipment and installation revenue.
Competition currently runs on delivery date rather than on price or specification, which is a reversal of how this industry operated for a century. A developer needing energisation in 2029 selects whoever can actually deliver, and the negotiation concerns slots rather than discounts. Regional manufacturers in Korea, Japan and China are winning international work purely on availability, which established suppliers find genuinely uncomfortable.

Rankings shift on who expands manufacturing capacity and who declines to, since the last comparable demand spike ended badly for everybody who invested into it. The second pressure is grid code compliance: as utilities write more of the specification, suppliers holding completed test evidence for particular grid codes gain an advantage that has nothing to do with manufacturing scale.
datacenter-grid-interface-equipment-market-company-positioning-matrix-1789990579031

Competitive Moat and Risk Dimensions

SCHNEIDER ELECTRIC

Moat: Full Interface Portfolio Breadth

Schneider supplies switchgear, transformers, protection, transfer systems and monitoring across the whole grid interface, so a developer specifies one supplier for the entire boundary rather than integrating equipment from several. That matters more when lead times are long, since coordinating multiple constrained supply chains multiplies schedule risk considerably. Breadth of that kind takes decades to assemble.
SCHNEIDER ELECTRIC

Risk: Capacity Expansion Exposure

Expanding transformer and switchgear manufacturing against current demand commits capital across a thirty year depreciation schedule into a spike that may not persist beyond this construction cycle. The last comparable expansion ended badly for everybody who made it. Declining to expand cedes share to regional manufacturers winning purely on availability, which is an unattractive choice in either direction.
HITACHI ENERGY

Moat: High Voltage Transformer Capability

Hitachi Energy holds large power transformer manufacturing capability at a scale very few organisations anywhere possess, in a segment where capacity rather than demand sets the growth rate. Winding expertise, testing facilities and electrical steel relationships accumulate across decades rather than being acquired. Owning production capacity is the position that matters most here.
HITACHI ENERGY

Risk: Electrical Steel Supply Dependency

Large transformer production depends on grain-oriented electrical steel from a small number of mills, and that supply constrains output regardless of how much winding capacity a manufacturer holds. No commercial arrangement creates additional steel capacity within the timeframe demand requires. The bottleneck sits one level upstream of everything the manufacturer actually controls directly.

Players Tracked

Prominent Players

Schneider Electric
ABB
Siemens Energy
Eaton
Hitachi Energy

Other Key Players

Vertiv
Legrand
Mitsubishi Electric
Toshiba Energy Systems
Hyundai Electric
LS Electric
TMEIC
GE Vernova
Powell Industries
Hyosung Heavy Industries
Cummins
Caterpillar
Rolls-Royce Power Systems
Delta Electronics
SPX Transformer Solutions

Recent Developments

JANUARY 2025

Siemens Energy Expands Transformer Manufacturing Against Order Backlog

Siemens Energy expanded power transformer manufacturing capacity in response to order backlogs extending beyond three years, an organic capacity expansion rather than an acquisition or joint venture. Lead times near 42 months have made equipment availability rather than capital the item deciding which data centre projects can actually proceed.
Signal: Expanding into a spike that may not persist is the uncomfortable decision facing every manufacturer here.
SEPTEMBER 2024

ABB Extends Grid-Forming Interface Systems For Data Centre Connection

ABB extended its grid-forming inverter and battery interface range aimed at data centre interconnection compliance, an organic product development rather than any transaction. Utilities now require fault ride-through, reactive support and curtailment response through around 18 distinct tests before permitting a facility to connect at all.
Signal: The utility rather than the customer is now writing the specification for the fastest growing equipment.
JUNE 2025

Hyundai Electric Wins Southeast Asian Data Centre Interface Contracts

Hyundai Electric secured grid interface equipment contracts for Southeast Asian data centre projects, supply agreements rather than any joint venture or merger. Malaysian construction absorbing the Singapore pipeline needs full interface equipment specified from scratch, and regional manufacturers are winning that work largely on delivery availability.
Signal: Availability rather than incumbency is deciding these awards now, which established European suppliers find genuinely uncomfortable.

What Interface Equipment Costs

Grain-oriented electrical steel and copper conductor together account for roughly 41% of transformer cost, and neither has readily available substitutes at the performance required. Power semiconductors carry around 19% across inverter and transfer equipment, rising sharply for higher voltage classes. Skilled winding and assembly labour absorbs about 16%, which is a genuine constraint rather than a cost line. Testing, certification and transport take the balance.
Copper pricing moved considerably through 2023 and 2024 and the IEA has documented how far critical mineral demand from electrification has diverged from historical patterns during that period. ABB Annual Report 2024 and Schneider Electric Annual Report 2024 both record raw material and component availability as principal operating variables. Manufacturers holding fixed price orders absorbed those increases directly, since a transformer priced in 2022 delivers in 2026 at the original figure.

The competitive disadvantage mechanism is order book position rather than manufacturing cost. A manufacturer with three years of committed backlog at older pricing carries margin compression that a competitor quoting today does not, and cannot reprice without breaching contracts. Exposure varies by contract structure too, since suppliers who negotiated material indexation into long lead orders are far better placed.
datacenter-grid-interface-equipment-market-cost-volatility-analysis-1789990579229

Index Long Lead Orders To Raw Material Pricing

Electrical steel and copper run around 41% of transformer cost and an order placed today delivers roughly 42 months later, across which commodity pricing moves substantially in either direction. Most orders in this industry carry fixed pricing with no indexation whatsoever. Negotiating material indexation at order costs nothing when demand exceeds supply this heavily, removing an exposure nobody can hedge.

Reserve Electrical Steel Capacity Ahead Of Orders

Grain-oriented electrical steel comes from a small number of mills and constrains transformer output regardless of how much winding capacity a manufacturer holds. Reserving mill capacity against forecast rather than confirmed orders costs commitment money and secures the input that actually limits production. Manufacturers buying steel against confirmed orders stay behind the constraint they most need.

Train Winding Labour Before The Capacity Arrives

Skilled winding and assembly labour runs about 16% of transformer cost and takes considerably longer to develop than a building does to construct. Manufacturers expanding capacity routinely commission a facility and then discover they cannot staff it for another two years. Beginning training ahead of any construction decision removes the constraint that actually delays new capacity.

Portfolio Architecture for Margin Defence

Margin architecture separates on whether the equipment is scarce or merely necessary. Medium voltage switchgear and static transfer switches earn least, since multiple manufacturers supply them and lead times are manageable. Power transformers occupy an unusual middle position, earning well on scarcity while capped on volume. Grid-forming inverters, compliance controllers and interconnection equipment earn most, because a utility writes the specification and approved capability matters far more than price.
The volume versus premium tension here is a capacity commitment decision with a thirty year horizon. Expanding transformer manufacturing captures a demand spike and depreciates across decades, and the last comparable expansion ended badly for everybody involved. Declining to expand cedes share to regional manufacturers who are winning purely on availability right now. There is no comfortable position, and every manufacturer in the category is currently choosing one.

High-value pools concentrate in grid compliance equipment and in on-site generation interconnection, and neither is reached by adding manufacturing capacity. Compliance equipment requires completed test evidence against specific grid codes, which accumulates through project delivery. Interconnection requires engineering relationships with utilities who are frequently reluctant participants. Both are capabilities rather than factories, which is precisely why the margin has settled in them.

Volume / Commodity-Adjacent

Medium voltage switchgear, ring main units and static transfer switches, supplied by multiple manufacturers with manageable lead times and genuine substitutability. The eight point spread separates manufacturers with regional production close to projects from those shipping across continents at higher logistics cost.
Gross Margin: 18% to 26%

Premium / Certified

Power transformers and unit substations, where scarcity supports pricing while manufacturing capacity caps volume regardless of demand. The twelve point spread tracks how much of an order book was priced recently rather than committed years earlier at figures that raw material movement has since overtaken.
Gross Margin: 32% to 44%

Sustainability / Regulatory / Next-Generation

Grid-forming inverters, compliance controllers and on-site generation interconnection, where a utility writes the specification and approved capability outweighs price entirely. The fourteen point spread reflects how much completed grid code test evidence a supplier holds across the jurisdictions where projects are actually being built.
Gross Margin: 46% to 60%
datacenter-grid-interface-equipment-market-portfolio-architecture-1789990579726

High-value Sub-segments and Strategic Watch-out

Grid-Forming Inverters And Battery Interface

Grows at 22.2% because utilities now require data centres to support voltage and frequency rather than merely consume from the grid. The fourteen point spread reflects grid code evidence. Retrofit demand from existing campuses is arriving alongside new construction here too. Rectifiers cannot do this at all.
Gross Margin: 46% to 60%

Protection Relays And Compliance Controllers

Grows at 19.4% on roughly 18 distinct tests a utility requires before permitting any connection at all. The fourteen point spread reflects test documentation depth. The utility writes this specification, so approved capability matters considerably more than equipment price. Test evidence is the whole product here.
Gross Margin: 46% to 60%

On-Site Generation Interconnection Equipment

Grows at 17.6% on projects that cannot wait out grid connection queues running several years in constrained metropolitan areas. The fourteen point spread reflects utility engineering relationships. Expensive and contentious locally, and frequently the only route a dated project has. Nothing else energises a queued project.
Gross Margin: 46% to 60%

Power Transformers And Unit Substations

Grows at 9.2%, slowest of the six classes, because manufacturing capacity rather than demand sets the rate at 42 month lead times. The twelve point spread reflects order book vintage. Growth here measures supply, which is genuinely unusual for any equipment segment. Everybody needs it and nobody can get it.
Gross Margin: 32% to 44%

How These Positions Hold

The annuity is the installed base rather than any contract. Grid interface equipment operates for thirty years or more and gets extended, upgraded and eventually replaced by whoever supplied it originally, because mixing manufacturers across a protection scheme creates coordination problems nobody wants to own. A developer building a second phase specifies the same supplier almost automatically, which makes winning a first phase worth several times its own equipment value.
Depth varies by how integrated the equipment is with the protection scheme. Transformers and switchgear are coordinated together and effectively locked for the facility's life once commissioned. Compliance controllers sit inside grid code approvals filed with a utility, and changing them means refiling. Static transfer switches are the shallowest, since they are genuinely substitutable and get replaced on price whenever a maintenance cycle allows it without touching anything else.

The buyer moved from a facilities engineer to a development director with a delivery date, and the conversation changed completely. A facilities engineer compared specifications, efficiency and maintenance cost across suppliers. A development director asks when equipment arrives and what it takes to move that forward. Suppliers leading with technical differentiation answer somebody who cares about a calendar.
datacenter-grid-interface-equipment-market-end-use-penetration-index-1789990580221

What Decides Share Here

These are among the four positions where our research anticipates prominent divergence between winners and laggards over the coming forecast period. Each is grounded in the demand model, the regulatory perimeter, and the announced capacity pipeline.
01 / DELIVERY SLOT PRICING

Charge For The Calendar, Not The Copper

A large power transformer runs around 42 months from order to delivery and manufacturer order books cover more than three years of scheduled production across the whole industry. In that environment a developer will accept a substantial premium to move delivery forward and several routinely do so without requesting a second meeting. Manufacturers still negotiating on unit price are leaving margin on a table the customer has stopped looking at, and very few of them have restructured commercial terms around scarcity at all.
02 / GRID CODE EVIDENCE DEPTH

Arrive With The Test Results Already Done

Around 18 distinct compliance tests now stand between a facility and permission to connect, covering ride-through, reactive support, harmonics and curtailment obedience under genuine fault conditions rather than simulated ones. The specification is written by a utility rather than by the customer, which makes approved capability and documented evidence worth considerably more than any price advantage. Suppliers arriving with completed compliance packages for a given grid code shorten approval timelines by months for projects that cannot move their delivery dates.
03 / QUEUE BYPASS ENABLEMENT

Energise Projects That Cannot Wait

Grid connection queues in constrained metropolitan areas run for years, and a developer holding land, capital and a signed tenant can still deliver absolutely nothing while sitting in one of them. On-site generation interconnection equipment lets a facility energise ahead of full utility supply or operate at partial import, and it compounds at 17.6% on projects that would otherwise remain idle. The equipment is expensive and contentious with local authorities, and it is frequently the only route a dated project has available.
04 / NEW GEOGRAPHY COVERAGE

Follow The Pipeline Before It Opens

Singapore's capacity moratorium redirected an enormous construction pipeline into Johor, and Malaysia now compounds at 22.4% on development that arrived considerably faster than the local grid was ever designed to serve. Every facility in a newly opened geography specifies full interface equipment from scratch rather than expanding an existing installation, which makes each order substantially larger. Those pipelines appear in planning applications and utility connection filings years ahead, and suppliers organised entirely around established markets keep arriving after specification has closed.

Engagement Snapshot From the Field

A live engagement with an industry participant carrying material or product regulatory and market exposure ahead of a defining policy shift, showing how our research translates into a defensible multi-year portfolio strategy.
MARKET MINDS ADVISORY · CLIENT ENGAGEMENT SUMMARY
Datacenter Grid Interface Equipment Producer Strategic Portfolio Review and Transition Roadmap 2026·Investment Scenario on Datacenter Grid Interface Equipment Exposure Evaluation 2025-26
CLIENT PROFILE
An international data centre developer with 640 megawatts under construction across six markets, holding signed tenant commitments with contractual energisation dates. Transformer deliveries on three projects had slipped beyond the committed dates and liquidated damages were becoming a realistic exposure. Procurement was running a competitive tender on price for equipment that had no available supply at any price at all.
STRATEGIC CHALLENGE
Procurement policy required competitive tendering and scoring on price, which had been sound practice for two decades. Development wanted to place orders immediately with whoever could deliver and accept whatever premium that carried. Nobody had quantified the liquidated damages exposure against the equipment premium, and the board had asked for a recommendation within six weeks.
MMA APPROACH
MMA modelled the liquidated damages exposure across all six projects against the premium required to secure earlier delivery slots, and mapped available manufacturing capacity by supplier and by month. We assessed regional manufacturers in Korea and Japan against grid code compliance requirements in each market. The work drew on 47 expert interviews conducted in Q4 2025 with manufacturers, developers and utility connection engineers.
KEY FINDINGS
  1. Liquidated damages exposure across the three delayed projects exceeded the total equipment premium required to secure earlier slots by about 7 times (client-reported, unverified by MMA).
  2. Two Korean manufacturers held available production capacity roughly 14 months earlier than the incumbent European suppliers were able to offer on identical specifications.
  3. Grid code compliance evidence existed for 4 of the 6 markets from those regional suppliers, and the remaining two would have needed fresh testing.
  4. The competitive tender process itself was adding around 11 weeks to every order, on equipment where no meaningful price competition actually existed.
CLIENT PROFILE
An international data centre developer with 640 megawatts under construction across six markets, holding signed tenant commitments with contractual energisation dates. Transformer deliveries on three projects had slipped beyond the committed dates and liquidated damages were becoming a realistic exposure. Procurement was running a competitive tender on price for equipment that had no available supply at any price at all.
STRATEGIC CHALLENGE
Procurement policy required competitive tendering and scoring on price, which had been sound practice for two decades. Development wanted to place orders immediately with whoever could deliver and accept whatever premium that carried. Nobody had quantified the liquidated damages exposure against the equipment premium, and the board had asked for a recommendation within six weeks.
MMA APPROACH
MMA modelled the liquidated damages exposure across all six projects against the premium required to secure earlier delivery slots, and mapped available manufacturing capacity by supplier and by month. We assessed regional manufacturers in Korea and Japan against grid code compliance requirements in each market. The work drew on 47 expert interviews conducted in Q4 2025 with manufacturers, developers and utility connection engineers.
KEY FINDINGS
  1. Liquidated damages exposure across the three delayed projects exceeded the total equipment premium required to secure earlier slots by about 7 times (client-reported, unverified by MMA).
  2. Two Korean manufacturers held available production capacity roughly 14 months earlier than the incumbent European suppliers were able to offer on identical specifications.
  3. Grid code compliance evidence existed for 4 of the 6 markets from those regional suppliers, and the remaining two would have needed fresh testing.
  4. The competitive tender process itself was adding around 11 weeks to every order, on equipment where no meaningful price competition actually existed.
RECOMMENDED STRATEGY
Phase 1: Phase one: suspend competitive tendering for transformers and switchgear entirely, and place orders immediately against available capacity wherever it exists. Phase 2: Phase two: qualify the two Korean manufacturers for the four markets where grid code evidence already exists, rather than waiting for fresh testing. Phase 3: Phase three: place speculative orders against the forward pipeline, since a delivery slot has become the scarce asset rather than the capital.
OUTCOME
The developer suspended competitive tendering for constrained equipment and placed orders against available capacity (client-reported, unverified by MMA). All three delayed projects recovered their energisation dates and liquidated damages exposure was avoided entirely. Speculative ordering against the forward pipeline is now standard practice, which is the change that outlasted the engagement itself.

Frequently Asked Questions

Foundational context covering the market sizes, CAGR, scope, country, region and competition that inform every finding below. This section is provided to cover basics and most often pre-purchase conversations, answered from the MMA Primary Research Dataset.

What is the current size of the Datacenter Grid Interface Equipment Market?

Global value reaches USD 10.79 billion in 2026, measured as grid interface equipment shipment and installation revenue across six classes. The 2025 base is USD 9.4 billion.

How large will the Datacenter Grid Interface Equipment Market be by 2036?

Equipment and installation revenue reaches USD 42.90 billion by 2036, an increase of USD 32.11 billion over the forecast period. That represents 3.98 times expansion from the 2026 base.

What is the CAGR for the Datacenter Grid Interface Equipment Market 2026 to 2036?

The base case runs at 14.8% annually, with a bull case at 16.1% if transformer manufacturing capacity expands materially and a bear case at 13.5% if artificial intelligence capital spending pauses.

Which segment is growing fastest?

Grid-forming inverters and battery interface systems grow at 22.2%, half again the market rate of 14.8%. Utilities now require data centres to support voltage and frequency rather than merely consume from the grid.

Who are the major companies in the Datacenter Grid Interface Equipment Market?

Schneider Electric, ABB, Siemens Energy, Eaton and Hitachi Energy lead on equipment and installation revenue, together holding 71%. Hyundai Electric, LS Electric and GE Vernova hold smaller positions.

Which country is growing fastest?

Malaysia leads at 22.4%, because Singapore's capacity moratorium redirected an enormous construction pipeline into Johor faster than the local grid was designed to serve. India and Saudi Arabia follow.

Report Segmentation Architecture

The full report scope spans multiple orthogonal segmentation dimensions, with cross-tabulated demand data provided for each dimension pair. Coverage extends further to regional breakdowns, trend trajectories, and the competitive detail needed to support segment-level decision-making.

By Equipment Class

  • Grid-Forming Inverters And Battery Interface Systems
  • Protection Relays And Grid Compliance Controllers
  • On-Site Generation Interconnection Equipment
  • Static Transfer Switches And Automatic Transfer Systems
  • Medium Voltage Switchgear And Ring Main Units
  • Power Transformers And Unit Substations

By End-Use Industry

  • Hyperscale Campus Development
  • Colocation Facility Operators
  • Enterprise Owned Data Centres
  • Artificial Intelligence Training Campuses
  • Edge And Metro Facilities
  • Government And Sovereign Facilities

By Commercial Dimension

  • Direct Developer Procurement
  • Engineering And Construction Contractor Supply
  • Framework Capacity Agreements
  • Utility Specified Equipment Supply
  • Distributor And Panel Builder Channel
  • Retrofit And Upgrade Contracts

By Region

  • North America
  • Western Europe
  • East Asia
  • South Asia and Pacific
  • Latin America
  • Middle East and Africa
  • Eastern Europe

Scope, Methodology, and Coverage

Every figure in this report is reproducible from documented input assumptions. The scope below maps the historical period, the forecast horizon, the segmentation dimensions, and the countries covered, alongside the underlying primary and qualitative methodology.
Historical Period
2020 to 2025
Forecast Period
2026 to 2036
Base Year
2025 (USD billions; MMA Primary Research Dataset, September 2026)
Market Definition
This report covers electrical equipment installed at the boundary between the utility grid and a data centre facility: medium voltage switchgear and ring main units, power transformers and unit substations, static transfer switches and automatic transfer systems, grid-forming inverters and battery interface systems, protection relays and grid compliance controllers, and on-site generation interconnection equipment. It excludes uninterruptible power supplies inside the white space, rack power distribution, cooling plant, generator sets themselves, and utility network assets beyond the point of connection.
Quantitative Units
USD millions, equipment shipment and installation revenue basis; connected megawatts; equipment lead time in months; interface cost per megawatt in USD; order book coverage in years.
Segmentation Dimensions
Equipment class; facility type; commercial procurement route; geography across seven regions.
Regions Covered
North America, Western Europe, East Asia, South Asia and Pacific, Latin America, Middle East and Africa, Eastern Europe
Countries Covered
United States, Canada, Mexico, Brazil, Chile, Germany, France, Netherlands, Ireland, Spain, Sweden, Poland, Czechia, China, Japan, South Korea, India, Malaysia, Australia, Saudi Arabia.
Key Companies Profiled
Schneider Electric, ABB, Siemens Energy, Eaton, Hitachi Energy, Vertiv, Legrand, Mitsubishi Electric, Toshiba Energy Systems, Hyundai Electric, LS Electric, GE Vernova, Powell Industries, Cummins, Delta Electronics.
Quantitative Methodology
Primary survey, n=3,800 respondents, Q4 2025, six countries; demand-side model with trade association cross-validation
Qualitative Methodology
47 expert interviews, Q4 2025; applied to validate demand model assumptions, identify emerging dynamics, and assess competitive positioning
Report Format
PDF and XLSX data workbook (Word format preview document)
Publisher
Market Minds Advisory
Report Code
MMA-2026-ENE-131
Published
September 2026
Contact
sales@marketmindsadvisory.com | www.marketmindsadvisory.com

Purchase the full Datacenter Grid Interface Equipment Market Report (2026 to 2036).

This report sizes the global datacenter grid interface equipment market from 2026 to 2036 across six equipment classes, six facility types and seven regions. It explains why a 42 month transformer lead time makes a delivery slot scarcer than capital, how roughly 18 grid code compliance tests turned utilities into the specifiers of the fastest growing equipment, and why the segment everybody needs most grows slowest. Cost composition is sourced to IEA minerals analysis and company annual reports, with order book vintage analysed as the margin variable. Regional analysis explains why North America leads at 34% on revenue while East Asia leads on connected megawatts.
Six equipment classes sized through to 2036
Lead time scarcity modelled as the pricing mechanism
Raw material cost composition from IEA and filings
Twenty named manufacturers assessed on equipment revenue
Four revenue levers with quantified commercial impact
Anonymised developer procurement engagement included in full

Built For The People Who Decide

From boardroom strategy to bench-side execution, this report is read cover-to-cover by leaders shaping the next decade of their industry, turning demand scenarios, market dynamics and valuation benchmarks into decisions.
CXOs/ Presidents/ VPs/ Managers
M&A and Corporate Development
Strategy Teams and R&D Heads
Procurement and Product Directors
Regulatory and Compliance Leaders
Investor Relations and Equity Analysts