Market Minds Advisory
Data Loggers Market

Data Loggers Market: Data Loggers Market: Recording Instruments, Calibration Evidence and Single-Use Shipping Devices, 2026 to 2036

These instruments are bought to produce evidence rather than data, and about 37% of deployed units are quietly recording past their recalibration date. Those records would not survive any inspection.

Lead Analyst

Published

September 2026

Make Smarter Decisions with Customized Research Insights

Request a free sample report and evaluate market opportunities, growth trends, and competitive dynamics relevant to your business needs.

2025 MARKET VALUE$3.6BMarket Size 2025
2036 FORECAST VALUE$7.3BBase Case , 2026 to 2036
CAGR 2026 TO 20366.8 %Bull 8.0% / Bear 5.6%
INCREMENTAL OPPORTUNITY$3.5BNet 10- year value creation
EXPANSION MULTIPLE1.92x2036 value over 2026 base
Strategic Levers
M&A Pipeline
Regional Outlook
Country Rankings
Competitive Intelligence
Segmental Deep-dive
Call-Us : 91 93563 13602

Executive Snapshot and Market Trajectory.

A data logger exists to produce a record somebody will examine, not to measure something. Every credible instrument is accurate enough, so calibration certificates, tamper evidence, and audit trail decide the purchase. About 37% of deployed loggers are recording past their recalibration date, which quietly invalidates what they produce.
Single-use shipping loggers grow at 10.2%, half again the market rate of 6.8%, and they won on a problem nobody solved: reusable devices do not come back and the ones that do are rarely recalibrated on schedule. A device certified once for one trip removes both failures at the same time. East Asia holds 28% of shipment value on environmental compliance volume and manufacture together.
Five manufacturers hold 44% of shipment value, and calibration services already provide 29% of their revenue, which is the clearest signal about where the value actually sits. Audit rejection at 6.4% traces almost entirely to documentation rather than to measurement, and hardware specification competition addresses none of it. Calibration services already provide 29% of leading manufacturer revenue, which says plainly where the durable relationship sits, and instrument-only suppliers have ceded it to independent laboratories.
Market Definition
This market covers standalone recording instruments capturing measurements over time, including temperature and humidity loggers, single-use shipping loggers, multi-channel test and measurement loggers, environmental and water quality loggers, vibration and condition monitoring loggers, and electrical and energy loggers. It excludes connected asset tracking devices sold within supply chain visibility platforms, process control instrumentation, laboratory analysers, building management systems, and calibration equipment itself.
Base Year Value
$3.6B in 2025 (MMA Primary Research Dataset, September 2026)
Forecast Period
2026 to 2036, eleven discrete annual values
CAGR
6.8% base case. Bull 8.0%. Bear 5.6%.
Fastest Growth Segment
Single-Use Shipping Loggers: 10.2% CAGR
Fastest Growth Country
India: 11.8% CAGR
Fastest Growth Region
South Asia and Pacific: 8.9% CAGR
Largest Region
East Asia: 28% of 2025 global value
Market Leaders
Vaisala, Testo, Onset Computer, ELPRO-BUCHS, and Rotronic lead the field. Source: MMA Primary Research Dataset, July 2026.
Primary Survey
n=3,800 procurement and R&D decision-makers, Q4 2025, six countries
Methodology
Demand-side build-up, cross-validated against public data, 47 expert interviews

Data Loggers Market Forecast Scenarios

data-loggers-market-size-forecast-scenario-1790008848001
Growth between 2020 and 2025 was steady and driven almost entirely by obligation. Pharmaceutical distribution requirements, environmental discharge monitoring rules, and building performance regulations each expanded the population of things that must be recorded and retained. Historical growth of 5.7% reflects that regulatory accumulation rather than any technology change, since the instruments themselves have not altered fundamentally in a decade.
The base case at 6.8% rests on three mechanisms. Single-use shipping devices continue displacing reusable loggers in pharmaceutical distribution, where the certification and return problems have proved intractable. Environmental discharge and ambient monitoring obligations extend across more jurisdictions and more parameters. And calibration services grow faster than instruments, as organisations discover that an uncalibrated record is worth nothing to an inspector regardless of how carefully it was captured. None of the three depends on any technology change.
The bull case at 8.0% depends on inspectors examining calibration status routinely rather than occasionally, which would oblige every organisation running loggers to address the 37% currently out of date. The bear case at 5.6% is regulatory pause: essentially all growth here follows expanding obligation, and a period without new monitoring requirements leaves replacement demand alone, which is modest.

Evidence Rather Than Measurement

Almost nobody buys a data logger because they want to know the temperature. They buy it because an inspector, an insurer, a customer, or a regulator will require a record, and the record has to be defensible when produced. That reframing explains everything about the category, including why measurement accuracy differentiates so little between competing instruments. The instrument is a means to an end that sits entirely outside engineering.
TOP FIVE CONCENTRATION44%Share of shipment value held by the leading manufacturers
OUT OF CALIBRATION SHARE37%Deployed loggers past their recalibration date while still recording
SINGLE-USE SHARE OF SHIPMENTS41%Units supplied for one trip without any return expectation
CALIBRATION SERVICE SHARE29%Manufacturer revenue from certification rather than instrument sales
AVERAGE SELLING PRICEUSD 84Delivered price averaged across all deployed logger categories worldwide
AUDIT REJECTION RATE6.4%Records rejected during inspection for documentation deficiencies alone
Calibration is where defensibility actually lives, and it is widely neglected. Around 37% of deployed loggers are recording past their recalibration date, which means the records they produce would not survive scrutiny. Audit rejection at 6.4% traces overwhelmingly to documentation gaps rather than to measurement error, and manufacturers competing on sensor specification address none of that.
Single-use devices resolved two problems at once. A logger certified for a single trip cannot drift out of calibration during its service life and does not need returning, which removes the recovery failure that undermined reusable economics for years. They now represent 41% of shipments, and pharmaceutical distribution has adopted them faster than any other application. Reusable fleets shrink quietly through devices that consignees never send back.
"We asked quality teams how many of their deployed loggers were within calibration. Most did not know, and the ones who checked afterwards were unhappy with the answer. The instrument is fine. The certificate behind it is what an inspector actually examines, and that is where the failures are."
Practice Director, Test, Measurement and Calibration Services · MMA Industrial Equipment Practice · September 2026

Market Trends

Single-Use Devices Remove Two Failures Simultaneously

Reusable loggers must be returned and must be recalibrated on schedule, and organisations have proved consistently unable to do either reliably. A device certified once for a single trip cannot drift during its service life and requires no recovery from a consignee who has no reason to send it back. Single-use units now represent 41% of shipments and grow at 10.2%. Pharmaceutical distribution adopted them fastest because the evidence consequence there is immediate and the reusable failure rate was best documented. General distribution has followed more slowly, because the cost comparison there is less obvious.
Market Impact: Segment grows at 8.6%
Calibration Services Outgrow The Instruments Themselves

An uncalibrated record satisfies nobody, and organisations running hundreds of loggers across sites and shipments cannot track recalibration dates with spreadsheets. Calibration and certification services already supply 29% of manufacturer revenue and grow faster than hardware. The commercial character differs entirely: services recur annually, carry no component cost, and attach the customer to whoever holds the calibration history. Manufacturers who treated calibration as an after-sales obligation rather than a business have handed that relationship to independent laboratories. Recovering a calibration relationship once conceded costs considerably more than never conceding it. Accreditation in each market takes years.
Market Impact: Avoids 6.4% rejection rate

Market Opportunities and Growth Drivers

Environmental Monitoring Obligations Extend Across Jurisdictions

Discharge consent conditions, ambient air requirements, and water quality monitoring rules oblige operators to record continuously and retain evidence, and the number of parameters and sites covered keeps expanding. Environmental and water quality loggers grow at 8.6%. Chinese national monitoring networks deploy at volumes nothing else approaches, and Indian growth of 11.8% leads every country covered as discharge enforcement tightens. The buyer is a compliance function rather than an engineering one, and it evaluates evidence quality rather than instrument capability. Unit volumes here run well ahead of what the value share implies.
Market Impact: Affects 37% of deployed units

Pharmaceutical Distribution Requires Retained Temperature Evidence

Good distribution practice obligations across most major markets require temperature controlled products to be monitored throughout transport with records retained for inspection, which makes logging a licence condition rather than a commercial choice. That demand is insensitive to instrument price and highly sensitive to whether the record will be accepted. Audit rejection at 6.4% for documentation reasons is what these buyers are actually trying to avoid, and manufacturers who can evidence acceptance win on that basis alone. Price sensitivity in these accounts is low and documentation sensitivity is very high. Reputation with inspectors travels between customers.
Market Impact: Holds prices near USD 84

Market Restraints and Challenges

Deployed Instruments Fall Out Of Calibration Unnoticed

Around 37% of loggers in service are past their recalibration date and still recording, and the root cause is that nothing stops them: the instrument works, the data looks normal, and only an inspection reveals the problem. Commercially this produces records that fail when examined, damages confidence in the whole approach, and generates disputes manufacturers get drawn into. Participants respond with calibration status enforced in the device itself, managed calibration programmes covering whole fleets, and single-use devices that avoid the question entirely. Fleets running across many sites and countries are where the lapse rate is worst.
Market Impact: Covers 41% of shipments

Hardware Specification Competition Addresses Almost Nothing

Every credible logger measures accurately enough for the applications involved, so competition on sensor specification is a comparison buyers cannot meaningfully act on, and the root cause is that measurement stopped being difficult some time ago. Commercially this pushes average selling prices toward USD 84 and leaves manufacturers without hardware differentiation. Participants respond by building calibration and certification businesses, by supplying documentation packages that satisfy specific inspectors, and by moving toward managed evidence rather than instrument supply. Chinese manufacturers compete on delivered cost across every category, and no specification argument answers that. The differentiation has to sit elsewhere.
Market Impact: Supplies 29% of revenue
3 additional market trends, 4 additional growth drivers, and 2 additional restraints and challenges are covered in the full report. Contact sales@marketmindsadvisory.com to access the complete intelligence.

Segment CAGR and Growth Architecture

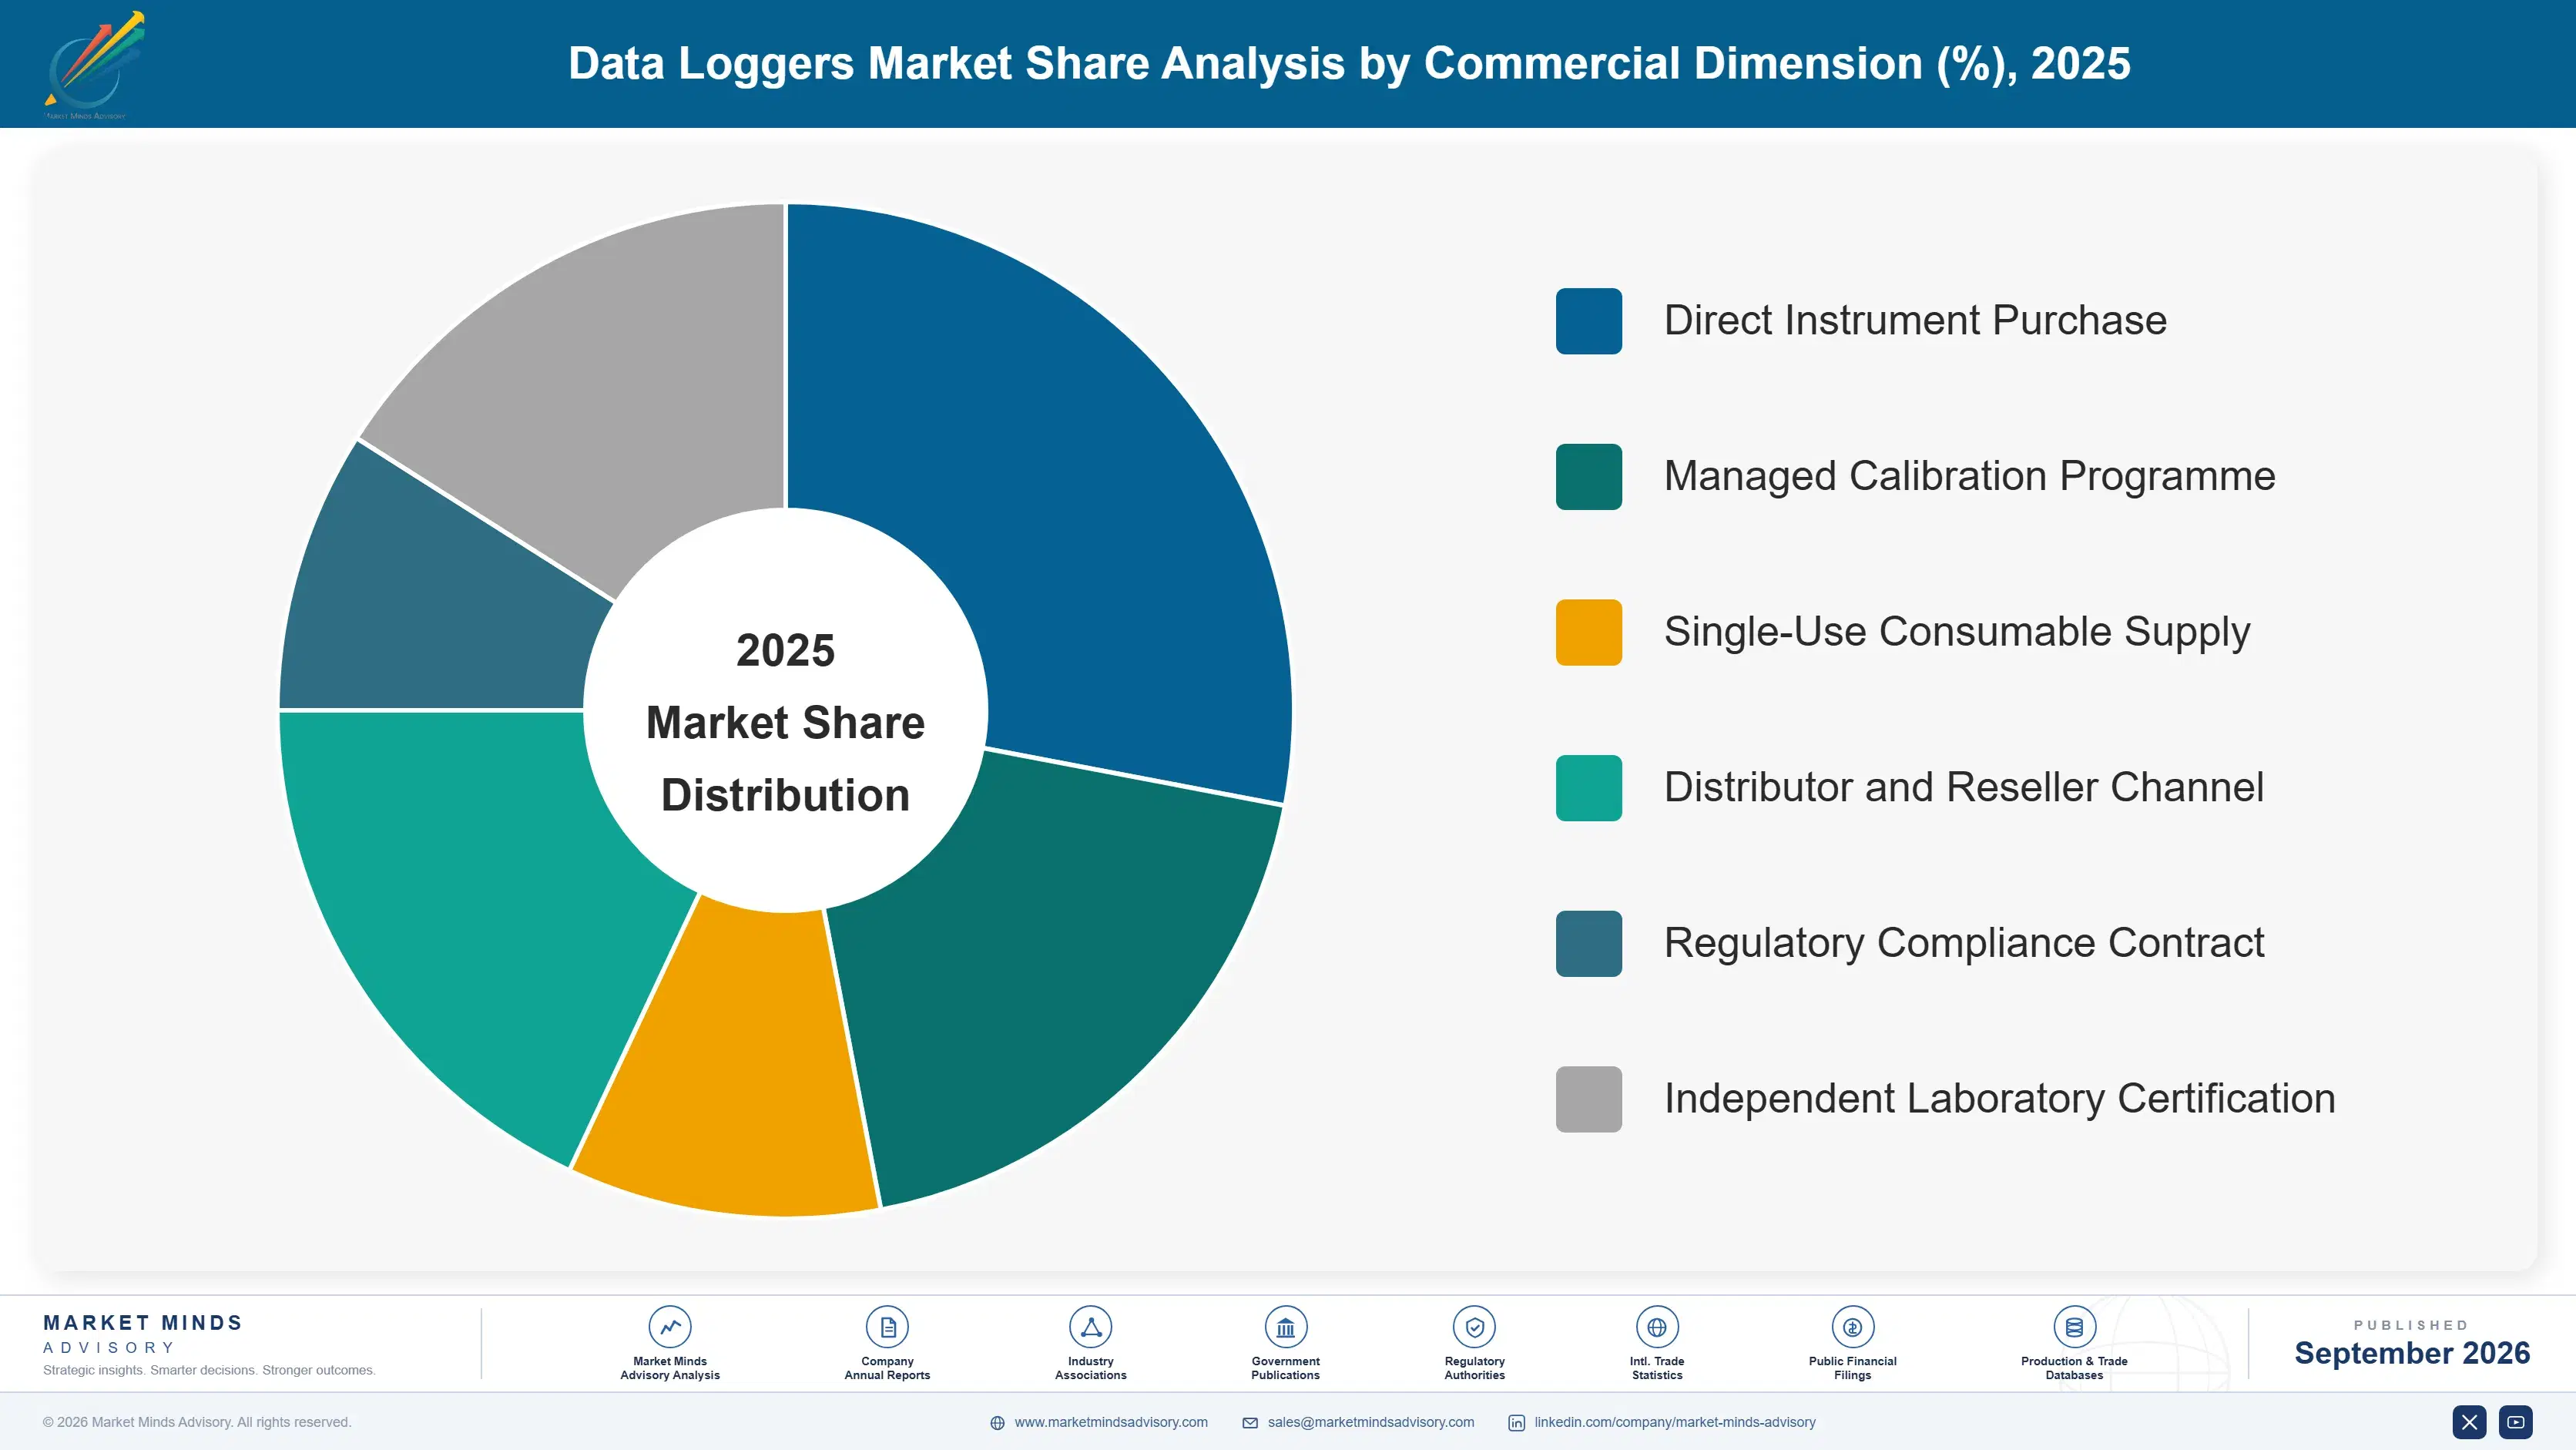
Segmentation follows measurement application and device form. Six categories cover the market: temperature and humidity loggers, single-use shipping loggers, multi-channel test and measurement loggers, environmental and water quality loggers, vibration and condition monitoring loggers, and electrical and energy loggers. Reusable temperature units remain largest while single-use devices grow fastest. Calibration services are counted within the category they support.
data-loggers-market-market-share-analysis-1790008848541

Single-Use Shipping Loggers

Single-use loggers grow at 10.2%, half again the market rate of 6.8%, by resolving two failures that reusable devices never overcame. A consignee has no reason to return an instrument, and an organisation running hundreds of them rarely tracks recalibration dates reliably, so reusable fleets accumulate devices that are either missing or producing records nobody could defend. A device certified once for one trip cannot drift and needs no recovery. They now account for 41% of shipments, and pharmaceutical distribution adopted them fastest because the evidence consequence there is immediate and unambiguous. General distribution has followed more slowly because the comparison there is less obvious and the evidence consequence is softer.
CAGR 10.2%

Environmental And Water Quality Loggers

Environmental loggers grow at 8.6% on obligation that keeps widening across jurisdictions, parameters, and site counts. Discharge consents, ambient air requirements, and water quality rules all demand continuous recording with retained evidence, which makes the purchase a licence condition rather than a commercial decision. Chinese national monitoring networks deploy at volumes nothing else in this category approaches. The buyer is a compliance function evaluating whether a record will be accepted rather than an engineering function comparing measurement ranges, and manufacturers who present specifications to that buyer are answering a question nobody asked. Indian growth of 11.8% leads every country covered as discharge enforcement reaches facilities that previously reported only periodically.
CAGR 8.6%
Full segment breakdown across 6 segments available in the complete report.

Regional Architecture and Country Demand Map

Regional shares reflect where instruments are deployed and calibrated rather than where they are manufactured, and they follow the intensity of monitoring obligation more closely than industrial output. One region sits outside the standard bands where obligation is expanding fastest. Deployment value understates unit counts in lower priced markets.

East Asia

Chinese national environmental monitoring networks deploy loggers at volumes nothing else in this category approaches, covering air, water, and discharge parameters across tens of thousands of sites under obligations that continue expanding. Chinese manufacturers also supply the low cost end of the global market, so deployment and production coincide. Japanese and Korean demand concentrates in pharmaceutical and industrial applications at higher specifications with stricter calibration practice. Growth of 7.8% runs above the world rate because monitoring obligation is widening faster here than anywhere except South Asia at present. Calibration practice varies widely across the region, and the lapse rate is worst where instruments were bought cheaply and never scheduled for return. That gap is itself a commercial opening.
Share: 28% | CAGR: 7.8% (2026 to 2036)

Western Europe

Pharmaceutical distribution requirements are among the most demanding anywhere, and the region hosts most of the instrument manufacturers whose calibration and certification businesses serve them. Good distribution practice obligations make logging a licence condition, and inspectors examine documentation rather than measurement. Growth of 5.3% is the slowest of the seven regions, reflecting mature obligation and an installed base that grows through replacement rather than extension. Calibration services represent an unusually high share of regional revenue, since European buyers understand what an uncalibrated record is worth. Single-use adoption has been slower than in North America, since established reusable fleets carry sunk cost that quality functions are reluctant to write off. Regulated distribution remains the anchor application throughout.
Share: 24% | CAGR: 5.3% (2026 to 2036)
Regional intelligence for 5 additional markets available in the complete report: North America, South Asia and Pacific, Latin America, Middle East and Africa, Eastern Europe. Contact sales@marketmindsadvisory.com.
data-loggers-market-country-cagr-analysis-1790008849107

Where Manufacturers Escape Commoditisation Pressure

Four commercial moves separate manufacturers earning properly from those competing on sensor specifications nobody can act on. Each recognises that the customer is buying a defensible record rather than a measurement, and that defensibility lives in calibration and documentation rather than in the instrument. None of the four is an engineering move, and none is answered by a better sensor.

Build Managed Calibration Rather Than After-Sales Service

Around 37% of deployed loggers are past their recalibration date, and organisations running hundreds across sites cannot track them manually. Managed calibration programmes covering whole fleets already supply 29% of leading manufacturer revenue, recur annually, carry no component cost, and attach the customer to whoever holds the calibration history. Manufacturers treating calibration as an obligation rather than a business have handed that relationship to independent laboratories, and getting it back is considerably harder than keeping it. The customer with no manufacturer calibration relationship replaces on price at every refresh. Nothing holds them.
Market Impact: Supplies 29% of leading manufacturer revenue on recurring terms

Enforce Calibration Status Inside The Device

An instrument past its calibration date keeps working and looks entirely normal, which is why 37% of deployed units are producing records that would fail examination. Devices that flag expiry in the record itself, or refuse to certify data captured after it, convert an invisible failure into a visible one before an inspector finds it. Manufacturers offering this report calibration compliance among their customers improving 34 to 46 points, which protects both the customer and their own reference base. It costs almost nothing to implement and addresses the failure customers most fear.
Market Impact: Improves customer fleet calibration compliance 34 to 46 points

Supply Documentation That Inspectors Actually Accept

Audit rejection at 6.4% traces overwhelmingly to documentation rather than to measurement, and what satisfies an inspector varies between jurisdictions and between applications in ways no specification sheet addresses. Manufacturers supplying documentation packages built for specific regulatory contexts, with evidence of prior acceptance, win regulated accounts at roughly 3.3 times the rate of those supplying instruments alone. The work is regulatory affairs rather than engineering and it is repeated for each jurisdiction served. Manufacturers who build it once find the same evidence supports every subsequent award in that jurisdiction. It compounds where engineering investment does not.
Market Impact: Wins regulated accounts at 3.3 times the base rate

Offer Single-Use Where Fleets Fail Anyway

Reusable devices that are not returned and not recalibrated cost more per usable record than certified single trip units, and customers work this out once somebody counts. Manufacturers offering both, and helping the customer measure their actual fleet loss and calibration compliance, convert 2.7 times more of that comparison than competitors defending reusable economics. It cannibalises reusable instrument revenue deliberately, and the alternative is losing the account to whoever runs the arithmetic first. The manufacturer who supplies the counting exercise keeps the account through whichever answer it produces. That is the point of running it.
Market Impact: Converts 2.7 times more reusable fleet cost comparisons

Who Controls the Margin Pool

Concentration is moderate and the field is unusually stable. Five manufacturers hold 44% of shipment value, measured consistently on that basis across all participants, and positions rest on calibration infrastructure and regulatory documentation depth rather than on any instrument advantage. Beneath them sit many specialists serving single applications, alongside Chinese manufacturers competing at the low cost end of every category.
Competition currently turns on three things: managed calibration capability across customer fleets, documentation that specific inspectors have accepted before, and single-use device economics for applications where reusable fleets fail. Sensor specification decides almost nothing, since every credible instrument measures accurately enough for the obligations involved. Price matters at the low end of every category, where Chinese manufacturers compete on delivered cost and documentation requirements are light enough that nobody examines the certificate closely.

Pressure comes from two directions. Independent calibration laboratories hold customer relationships that manufacturers ceded by treating certification as an after-sales obligation. Meanwhile low cost manufacturers serve applications where documentation requirements are light. Rankings will shift toward manufacturers owning calibration across the fleet, since that is the recurring revenue and the durable relationship. Instrument-only suppliers hold the weakest position of anyone here.
data-loggers-market-company-positioning-matrix-1790008849633

Competitive Moat and Risk Dimensions

VAISALA

Moat: Measurement Reference And Traceability

A reputation for measurement traceability built over decades, supported by reference instruments other manufacturers calibrate against, gives documentation weight with inspectors that newer competitors cannot assert. In a category where the record must be defensible rather than merely accurate, that standing is the actual product being purchased.
VAISALA

Risk: Premium Position Narrows Applications

Pricing supported by traceability reputation excludes the company from applications where documentation requirements are light and buyers compare on delivered cost, which covers a substantial and growing share of unit volume. Defending the premium means conceding those volumes to low cost manufacturers permanently rather than temporarily.
TESTO

Moat: Calibration Network And Coverage

An established calibration laboratory network across many markets lets the company manage customer fleets rather than merely supply instruments, capturing recurring revenue and the relationship that comes with holding calibration history. Rebuilding equivalent coverage requires accredited laboratories in each market, which takes years and considerable capital.
TESTO

Risk: Single-Use Displacement Of Fleets

Certified single trip devices remove both the instrument sale and the recurring calibration revenue attached to a reusable fleet, and the applications adopting them fastest are among the most valuable. Competing means cannibalising the calibration business the company's position was built around, which is an uncomfortable internal argument.

Players Tracked

Prominent Players

Vaisala
Testo
Onset Computer
ELPRO-BUCHS
Rotronic

Other Key Players

Dickson
Omega Engineering
Sensitech
DeltaTrak
Emerson
Fluke
Hioki
Graphtec
Yokogawa
Campbell Scientific
In-Situ
Tinytag Gemini
LogTag Recorders
MadgeTech
Ellab

Recent Developments

FEBRUARY 2026

ELPRO-BUCHS Releases Logger Enforcing Calibration Status In Records

ELPRO-BUCHS released instruments that mark records captured after the calibration expiry date, converting an invisible compliance failure into a visible one before an inspector encounters it during any subsequent examination. The company positioned the feature as protection for customers whose quality functions cannot track recalibration schedules across dispersed instrument fleets.
Signal: Manufacturers are addressing calibration lapse because it invalidates records their instruments captured correctly. Correct measurement no longer suffices.
SEPTEMBER 2025

Sensitech Signs Single-Use Logger Agreement With Pharmaceutical Distributor

Sensitech entered a supply agreement providing certified single trip loggers across a pharmaceutical distributor's temperature controlled network, replacing a reusable fleet whose recovery and recalibration compliance had both proved unmanageable. The agreement covers multiple markets and replaces devices the distributor had been losing at an unmeasured rate.
Signal: Single trip devices are replacing reusable fleets because recovery and recalibration both failed consistently. Cost per usable record decided it.
MAY 2025

Testo Acquires Accredited Calibration Laboratory Network

Testo completed an acquisition of an accredited calibration laboratory group, extending managed fleet calibration coverage into markets where independent laboratories had held customer relationships that instrument manufacturers previously ceded. The purchase adds accredited capacity in several markets where turnaround times had lengthened noticeably through 2024 and 2025.
Signal: Manufacturers are buying calibration coverage back because it holds the recurring customer relationship. Instrument revenue alone will not hold accounts.

What Building And Certifying Costs

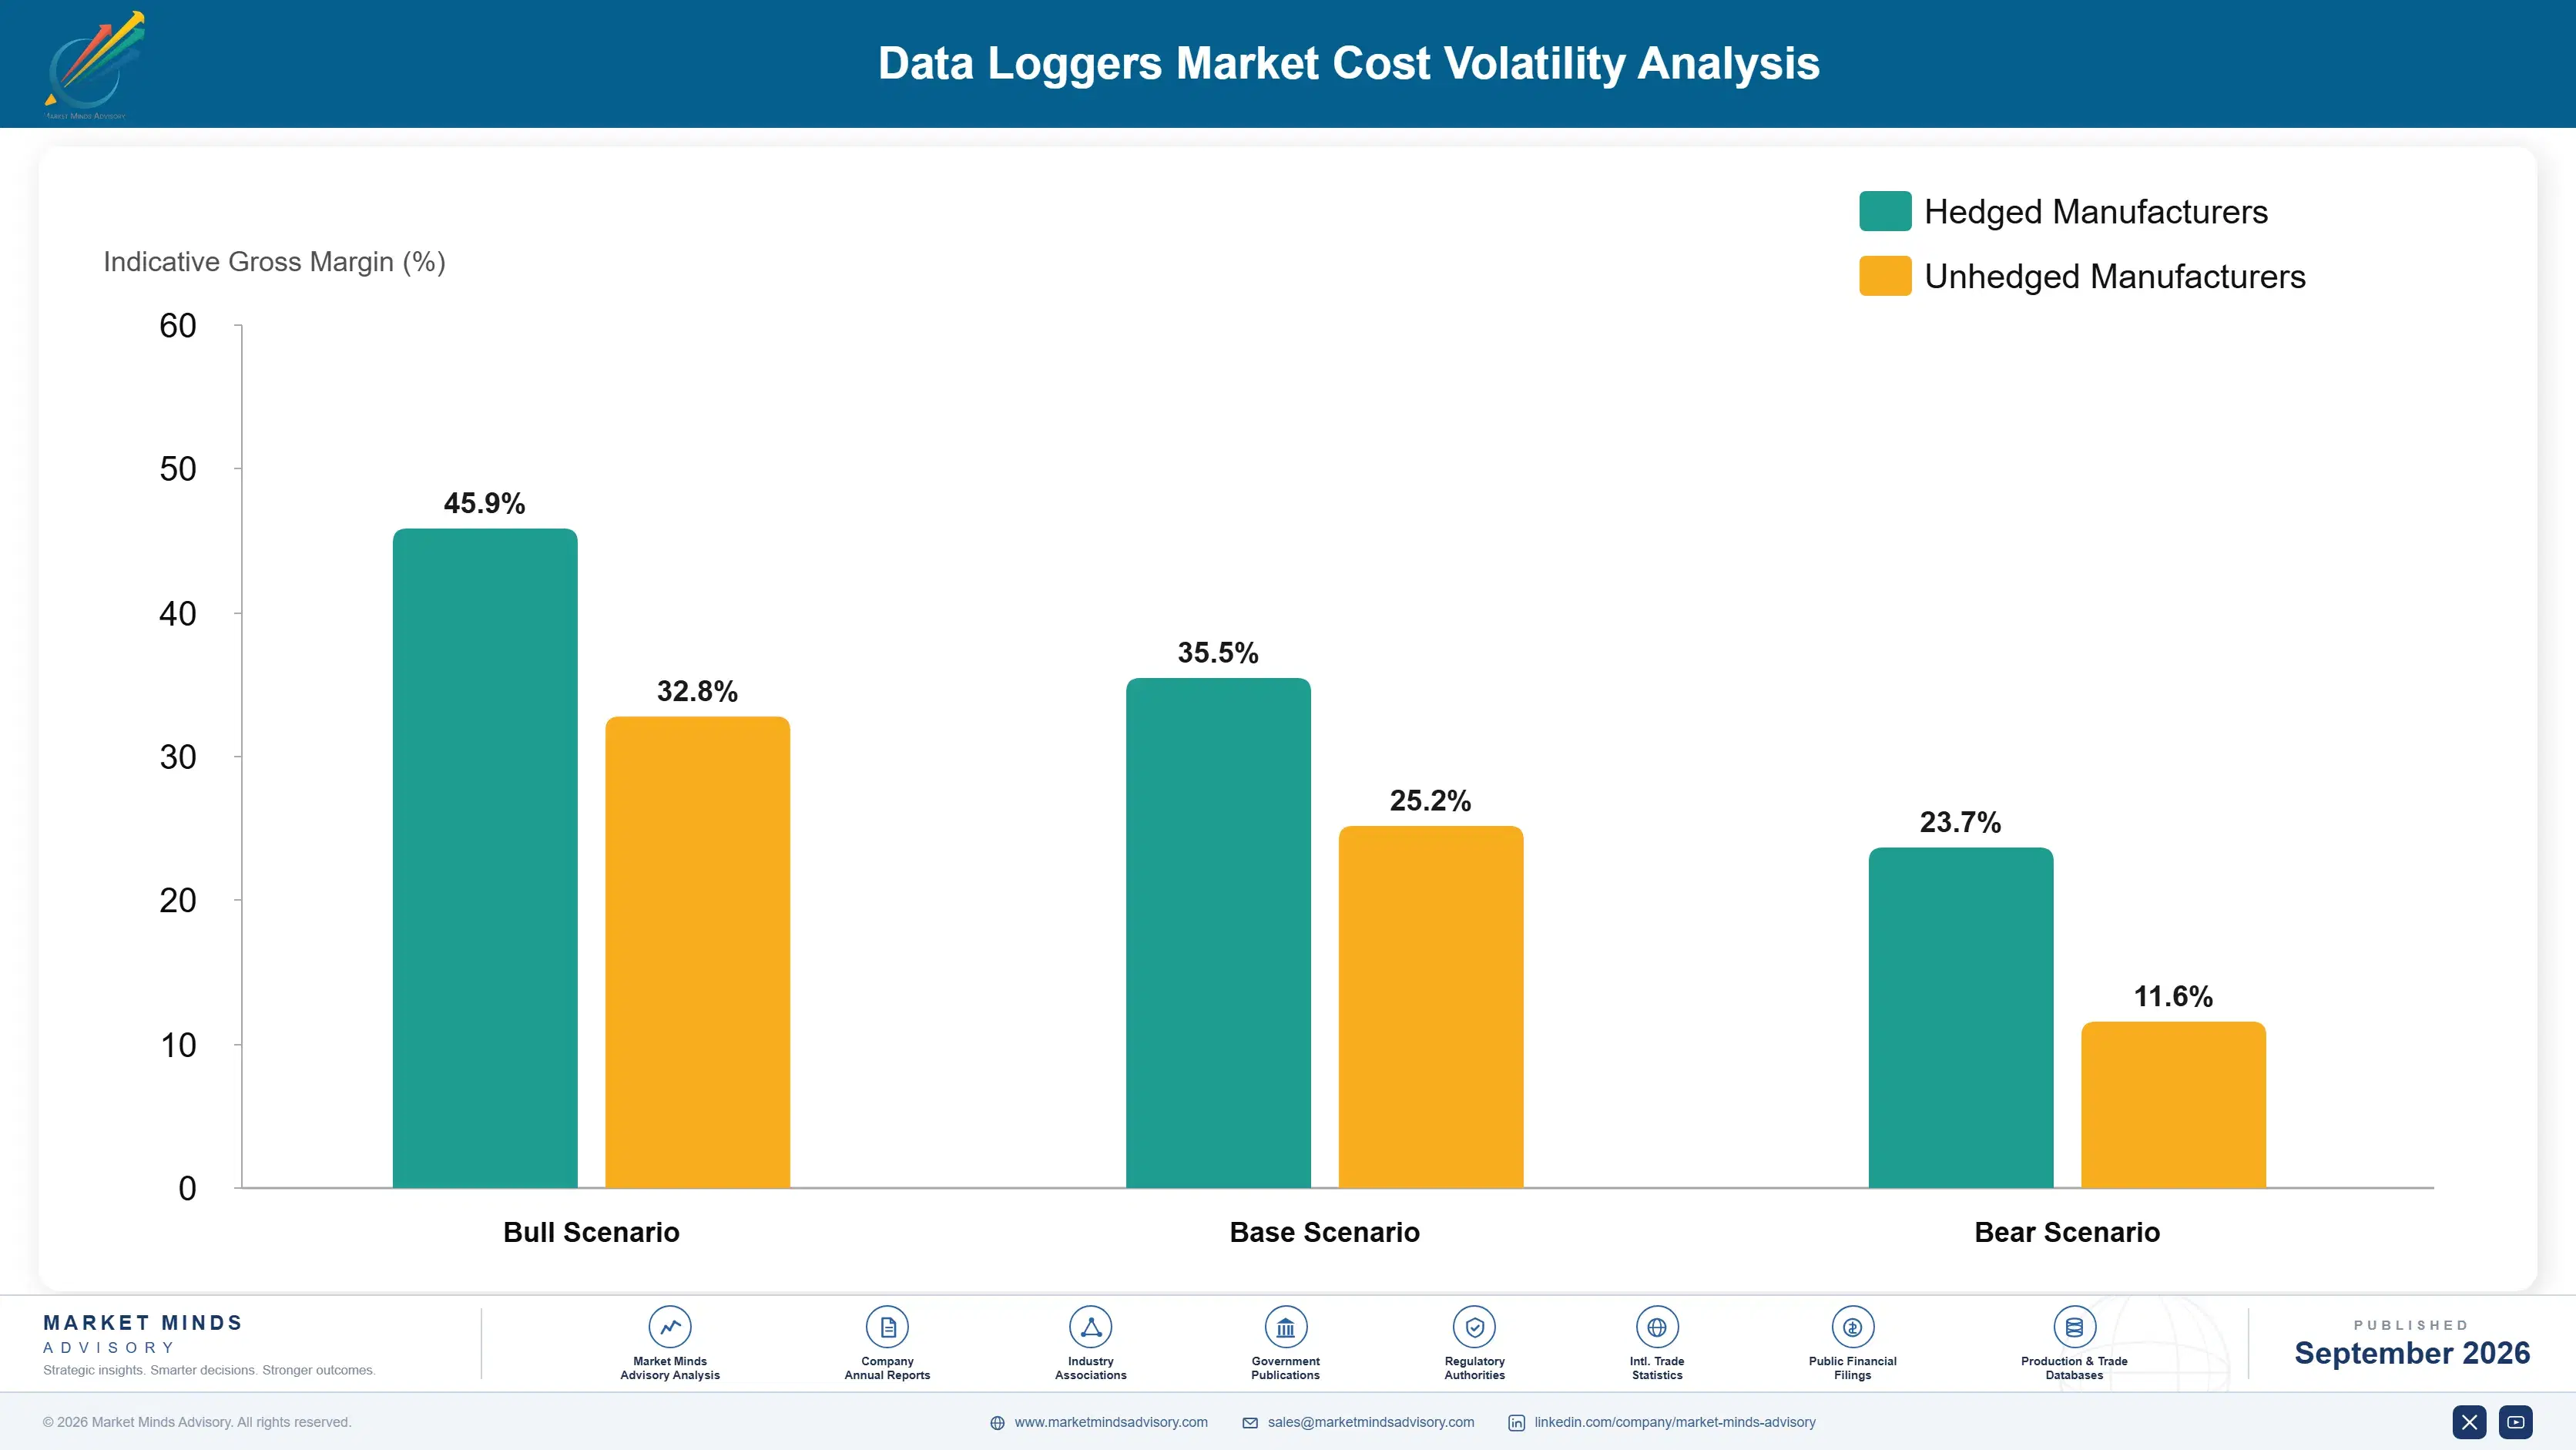
Three inputs dominate manufacturer cost. Sensing elements, microcontrollers, and memory run 30% to 38% of cost of goods sold. Housings, seals, and batteries take 20% to 27%, higher than the electronics suggest because environmental sealing and multi-year battery life both demand real engineering. Calibration and certification against traceable references add a further 18% to 25%, which is unusual for an instrument selling near USD 84.
Accredited calibration laboratory capacity tightened through 2024 and 2025 as monitoring obligations expanded faster than laboratories were accredited, and several manufacturers described lengthening turnaround and rising cost in their annual reports for those years. Calibration became a scheduling constraint on customer fleets rather than only an expense line, which contributed directly to the out of calibration population. Several manufacturers responded by adding accredited capacity of their own rather than waiting.

The competitive disadvantage mechanism runs through calibration capacity rather than through component cost. A manufacturer without accredited laboratory coverage in a customer's market depends on independent laboratories who then hold the relationship and the calibration history. Exposure varies by manufacturer type. Those with laboratory networks capture recurring revenue and customer attachment. Instrument-only manufacturers supply hardware into fleets somebody else certifies and eventually replaces.
data-loggers-market-cost-volatility-analysis-1790008849833

Extend Accredited Calibration Coverage Into Customer Markets

Independent laboratories that calibrate a customer's fleet hold the schedule, the history, and the relationship, which is the recurring revenue instrument manufacturers surrendered by treating certification as an obligation. Accreditation in each market takes years and capital, and it is the difference between a hardware supplier and a managed evidence provider. Few instrument makers have treated coverage as a business.

Design For Longer Calibration Intervals Where Permitted

Calibration turnaround has become a scheduling constraint as accredited capacity failed to expand alongside obligation. Instruments demonstrating stability that justifies a longer permitted interval reduce both customer cost and fleet downtime. Longer intervals also reduce the number of instruments sitting in a laboratory rather than recording, which customers notice immediately. The stability data required accumulates across deployments over time.

Standardise Sensing Platforms Across Application Ranges

Temperature, humidity, environmental, and shipping loggers differ mainly in housing, interface, and certification rather than in sensing approach. A shared sensing platform concentrates component purchasing, simplifies calibration procedure across the range, and lets accumulated stability data support several products rather than one at a time. It also shortens the certification work whenever a new variant enters a regulated application.

Portfolio Architecture for Margin Defence

Margin follows whether the manufacturer holds the calibration relationship. Instruments sold into fleets that somebody else certifies are close to commodity, since sensor specification decides nothing and Chinese manufacturers compete on delivered cost across every category. Single-use certified devices earn better. Managed calibration across a customer fleet earns most, because it recurs annually, carries no component cost, and holds the relationship. Whoever holds the calibration history holds the account through every subsequent refresh.
The tension between volume and premium runs through documentation requirement. Applications with light evidence obligations buy on price and generate substantial unit volume at minimal margin, while regulated applications pay properly for documentation that inspectors accept. Serving both requires regulatory affairs capability that low cost competitors do not build and that has nothing to do with manufacturing. The two customer types rarely overlap within a single manufacturer's account base.

High-value pools concentrate where a rejected record has a consequence: pharmaceutical distribution under distribution practice obligations, environmental discharge monitoring under permit conditions, and any application where an insurer examines the evidence. These share a customer who cannot afford the 6.4% rejection rate. Where nobody examines the record closely, the instrument is a commodity and priced exactly that way.

Volume / Commodity-Adjacent

Instruments sold into applications with light documentation requirements, where sensor specification decides nothing and low cost manufacturers compete on delivered price across every category. The ten-point range reflects component sourcing and manufacturing scale differences between established and low cost participants.
Gross Margin: 26% to 36%

Premium / Certified

Certified single-use devices and instruments supplied with documentation packages built for specific regulatory contexts. Evidence acceptance rather than measurement decides these purchases. The ten-point range separates manufacturers with prior acceptance references from those supplying certificates without demonstrated inspector acceptance.
Gross Margin: 44% to 54%

Sustainability / Regulatory / Next-Generation

Managed calibration across customer fleets, traceability services, and regulatory documentation programmes. Revenue recurs annually, carries no component cost, and holds the customer relationship. The twelve-point range reflects how differently accredited laboratory coverage is priced across markets and applications.
Gross Margin: 58% to 70%
data-loggers-market-portfolio-architecture-1790008850330

High-value Sub-segments and Strategic Watch-out

Managed Fleet Calibration Services

Highest value in the category, already supplying 29% of leading manufacturer revenue and recurring annually with no component cost attached. Whoever holds calibration history holds the customer. The twelve-point range reflects accredited laboratory coverage differences across the markets manufacturers serve. Manufacturers without accredited coverage cede it outright.
Gross Margin: 60% to 72%

Certified Single-Use Shipping Devices

Fastest growth at 10.2%, resolving both the recovery failure and the recalibration lapse that undermined reusable fleets for years. Now 41% of shipments. The ten-point range reflects certification depth differences between manufacturers serving regulated and general distribution applications. Pharmaceutical distribution adopted them first and fastest of all.
Gross Margin: 46% to 56%

Regulated Documentation Supply

High value where audit rejection at 6.4% carries real consequence and documentation must satisfy specific inspectors in specific jurisdictions. The work is regulatory affairs rather than engineering. Prior acceptance evidence decides these awards more reliably than any instrument specification does. Each jurisdiction served requires the work again.
Gross Margin: 50% to 60%

Uncertified Instrument Supply

The strategic watch-out. Sensor specification decides nothing, low cost manufacturers compete across every category, and the calibration relationship goes to whichever laboratory the customer happens to use. The twelve-point range reflects manufacturing scale differences that do not alter the commercial position. Replacement decisions here turn on delivered price alone.
Gross Margin: 22% to 34%

How This Revenue Recurs

Instrument revenue arrives at purchase and returns only at replacement, typically after several years, which makes hardware alone a poor annuity. Calibration recurs annually across the whole deployed fleet and grows as the fleet grows, which is why it already provides 29% of leading manufacturer revenue. Single-use devices behave differently again, generating continuous consumable revenue tied to shipment volume rather than to any replacement cycle.
Attachment depth follows the calibration relationship rather than the instrument. A customer whose fleet is calibrated by the manufacturer, with history held and schedules managed, does not switch without disrupting an evidence trail an inspector may examine. A customer using an independent laboratory has no attachment to the instrument brand at all and replaces on price at the next refresh, which describes most of the installed base.

The buyer has moved from engineering toward quality and compliance. Instrument engineers once selected loggers on measurement range and resolution, and they still specify. Quality assurance and regulatory affairs functions now approve purchases in regulated applications, and they ask whether records from this device have been accepted by their inspector before. Manufacturers presenting specifications are addressing the participant who no longer decides.
data-loggers-market-end-use-penetration-index-1790008850825

Where This Market Rewards

These are among the four positions where our research anticipates prominent divergence between winners and laggards over the coming forecast period. Each is grounded in the demand model, the regulatory perimeter, and the announced capacity pipeline.
01 / CALIBRATION RELATIONSHIP OWNERSHIP

Whoever holds the certificate holds the customer

Calibration recurs annually across a whole deployed fleet, carries no component cost, and already supplies 29% of leading manufacturer revenue, while instrument sales return only at replacement several years apart. Manufacturers who treated certification as an after-sales obligation handed that relationship to independent laboratories, and customers using those laboratories replace instruments on price at every refresh. Recovering the relationship costs far more than never conceding it would have, and the customer meanwhile replaces instruments on price at every single refresh.
02 / INVISIBLE FAILURE PREVENTION

Expired calibration looks exactly like working normally

About 37% of deployed loggers are recording past their recalibration date, and nothing reveals it because the instrument functions and the data looks entirely normal until an inspector examines the certificate behind it. Devices that mark records captured after expiry convert an invisible failure into a visible one beforehand, and manufacturers offering this report customer calibration compliance improving 34 to 46 points. It protects the customer and the manufacturer's reference base together at once, which is why the feature spreads faster than its cost would suggest.
03 / DOCUMENTATION ACCEPTANCE EVIDENCE

Rejection is about paperwork, never about measurement

Audit rejection at 6.4% traces overwhelmingly to documentation gaps rather than to any measurement error, and what satisfies an inspector varies between jurisdictions and applications in ways no specification sheet addresses at all. Manufacturers supplying documentation built for specific regulatory contexts, with evidence of prior acceptance, win regulated accounts roughly 3.3 times more often. The capability is regulatory affairs rather than engineering and must be rebuilt per jurisdiction, though the evidence compounds within each one once it exists from the beginning.
04 / DELIBERATE FLEET CANNIBALISATION

Count the losses before a competitor does

Reusable devices that are never returned and never recalibrated cost more per usable record than certified single trip units, and any customer who counts properly reaches that conclusion within one cycle. Manufacturers offering both, and helping customers measure their actual fleet loss and calibration compliance, convert 2.7 times more of that comparison. It cannibalises reusable revenue deliberately, and the alternative is losing the account entirely to whichever competitor is willing to run the arithmetic first and share it and then say so publicly.

Engagement Snapshot From the Field

A live engagement with an industry participant carrying material or product regulatory and market exposure ahead of a defining policy shift, showing how our research translates into a defensible multi-year portfolio strategy.
MARKET MINDS ADVISORY · CLIENT ENGAGEMENT SUMMARY
Data Loggers Producer Strategic Portfolio Review and Transition Roadmap 2026·Investment Scenario on Data Loggers Exposure Evaluation 2025-26
CLIENT PROFILE
A pharmaceutical distributor operating across fourteen countries with approximately 41,000 temperature controlled shipments monthly (client-reported, unverified by MMA). A reusable logger fleet of around 22,000 devices had been built up over eight years, calibration was managed by three independent laboratories, and quality assurance had recently failed an inspection on record documentation. Finance had absorbed fleet replacement as a routine consumable expense for several years without anybody questioning the rate.
STRATEGIC CHALLENGE
The inspection finding concerned records produced by instruments whose calibration had expired, which nobody had known about because the devices continued working and reporting normally. Separately, the fleet had shrunk through unreturned devices at a rate finance had absorbed without measuring, and nobody could state how many loggers actually remained.
MMA APPROACH
MMA reconciled purchased devices against those still in circulation, checked calibration status across the traceable population, and compared cost per usable record between the reusable fleet and certified single trip alternatives, including the calibration, replacement, and administrative effort each required. Calibration histories held across three independent laboratories were consolidated into a single view for the first time.
KEY FINDINGS
  1. Only 13,400 of 22,000 purchased devices could be located, and 44% of those located were recording past their recalibration date at the time of the review.
  2. Cost per usable record on the reusable fleet exceeded certified single trip devices by roughly 1.9 times once loss, calibration, and administration were counted properly.
  3. All records cited in the inspection finding came from instruments whose calibration had expired, and every one had measured accurately throughout the shipment concerned.
  4. Independent laboratories held calibration history across three incompatible systems, and no single view of fleet compliance existed anywhere within the organisation. Nobody could produce a fleet compliance figure.
CLIENT PROFILE
A pharmaceutical distributor operating across fourteen countries with approximately 41,000 temperature controlled shipments monthly (client-reported, unverified by MMA). A reusable logger fleet of around 22,000 devices had been built up over eight years, calibration was managed by three independent laboratories, and quality assurance had recently failed an inspection on record documentation. Finance had absorbed fleet replacement as a routine consumable expense for several years without anybody questioning the rate.
STRATEGIC CHALLENGE
The inspection finding concerned records produced by instruments whose calibration had expired, which nobody had known about because the devices continued working and reporting normally. Separately, the fleet had shrunk through unreturned devices at a rate finance had absorbed without measuring, and nobody could state how many loggers actually remained.
MMA APPROACH
MMA reconciled purchased devices against those still in circulation, checked calibration status across the traceable population, and compared cost per usable record between the reusable fleet and certified single trip alternatives, including the calibration, replacement, and administrative effort each required. Calibration histories held across three independent laboratories were consolidated into a single view for the first time.
KEY FINDINGS
  1. Only 13,400 of 22,000 purchased devices could be located, and 44% of those located were recording past their recalibration date at the time of the review.
  2. Cost per usable record on the reusable fleet exceeded certified single trip devices by roughly 1.9 times once loss, calibration, and administration were counted properly.
  3. All records cited in the inspection finding came from instruments whose calibration had expired, and every one had measured accurately throughout the shipment concerned.
  4. Independent laboratories held calibration history across three incompatible systems, and no single view of fleet compliance existed anywhere within the organisation. Nobody could produce a fleet compliance figure.
RECOMMENDED STRATEGY
Phase 1: Phase one: move regulated shipments to certified single trip devices, which remove both the recovery failure and the recalibration lapse that caused the inspection finding. Phase 2: Phase two: retain a reduced reusable fleet for fixed site monitoring only, under a single managed calibration programme with one consolidated compliance view. Phase 3: Phase three: implement calibration status marking on retained instruments so expired records are visible internally before any inspector encounters them.
OUTCOME
The follow-up inspection closed the finding with no new observations raised (client-reported, unverified by MMA). Monitoring cost per shipment fell 21% despite moving to single trip devices. Calibration compliance across the retained fleet reached 97% within two quarters of consolidation. Fleet size fell to 4,100 devices covering fixed site monitoring only.

Frequently Asked Questions

Foundational context covering the market sizes, CAGR, scope, country, region and competition that inform every finding below. This section is provided to cover basics and most often pre-purchase conversations, answered from the MMA Primary Research Dataset.

What is the current size of the Data Loggers Market?

The market was worth USD 3.6 billion in 2025 and reaches USD 3.8 billion in 2026. Value covers standalone recording instruments and associated calibration services.

How large will the Data Loggers Market be by 2036?

MMA forecasts USD 7.3 billion by 2036, an increase of USD 3.5 billion across the forecast period. That represents 1.92 times the 2026 base of USD 3.8 billion.

What is the CAGR for the Data Loggers Market 2026 to 2036?

The base case compound annual growth rate is 6.8%, with a bull case at 8.0% and a bear case at 5.6%. Historical growth from 2020 to 2025 ran at 5.7%.

Which segment is growing fastest?

Single-use shipping loggers grow at 10.2%, half again the market rate of 6.8%. They remove both the recovery failure and the recalibration lapse that undermine reusable fleets.

Who are the major companies in the Data Loggers Market?

Vaisala, Testo, Onset Computer, ELPRO-BUCHS, and Rotronic lead the field, together holding 44% of shipment value. Positions rest on calibration infrastructure and documentation depth rather than instrument capability.

Which country is growing fastest?

India grows at 11.8%, on pharmaceutical manufacture at very large scale alongside discharge enforcement that now obliges continuous monitoring at facilities previously reporting only periodically.

Report Segmentation Architecture

The full report scope spans multiple orthogonal segmentation dimensions, with cross-tabulated demand data provided for each dimension pair. Coverage extends further to regional breakdowns, trend trajectories, and the competitive detail needed to support segment-level decision-making.

By Instrument Category

  • Temperature and Humidity Loggers
  • Single-Use Shipping Loggers
  • Multi-Channel Test and Measurement Loggers
  • Environmental and Water Quality Loggers
  • Vibration and Condition Monitoring Loggers
  • Electrical and Energy Loggers

By End-Use Industry

  • Pharmaceutical Distribution and Manufacture
  • Food, Beverage and Cold Storage
  • Environmental and Water Utilities
  • Industrial Manufacturing and Process
  • Construction and Building Performance
  • Research, Laboratory and Academia

By Commercial Dimension

  • Direct Instrument Purchase
  • Managed Calibration Programme
  • Single-Use Consumable Supply
  • Distributor and Reseller Channel
  • Regulatory Compliance Contract
  • Independent Laboratory Certification

By Region

  • East Asia
  • Western Europe
  • North America
  • South Asia and Pacific
  • Latin America
  • Middle East and Africa
  • Eastern Europe

Scope, Methodology, and Coverage

Every figure in this report is reproducible from documented input assumptions. The scope below maps the historical period, the forecast horizon, the segmentation dimensions, and the countries covered, alongside the underlying primary and qualitative methodology.
Historical Period
2020 to 2025
Forecast Period
2026 to 2036
Base Year
2025 (USD billions; MMA Primary Research Dataset, September 2026)
Market Definition
This market covers standalone recording instruments capturing measurements over time, including temperature and humidity loggers, single-use shipping loggers, multi-channel test and measurement loggers, environmental and water quality loggers, vibration and condition monitoring loggers, and electrical and energy loggers. It excludes connected asset tracking devices sold within supply chain visibility platforms, process control instrumentation, laboratory analysers, building management systems, and calibration equipment itself.
Quantitative Units
USD billions, instrument and calibration service value
Segmentation Dimensions
Instrument category, end-use industry, commercial dimension, region
Regions Covered
East Asia, Western Europe, North America, South Asia and Pacific, Latin America, Middle East and Africa, Eastern Europe
Countries Covered
China, Japan, South Korea, Taiwan, United States, Canada, Mexico, Germany, Switzerland, United Kingdom, France, Italy, Netherlands, Denmark, Finland, India, Indonesia, Vietnam, Thailand, Australia, Brazil, Mexico, Colombia, Chile, Saudi Arabia, United Arab Emirates, Kenya, South Africa, Poland, Czechia
Key Companies Profiled
Vaisala, Testo, Onset Computer, ELPRO-BUCHS, Rotronic, Dickson, Omega Engineering, Sensitech, DeltaTrak, Emerson, Fluke, Hioki, Graphtec, Yokogawa, Campbell Scientific, In-Situ, Tinytag Gemini, LogTag Recorders, MadgeTech, Ellab
Quantitative Methodology
Primary survey, n=3,800 respondents, Q4 2025, six countries; demand-side model with trade association cross-validation
Qualitative Methodology
47 expert interviews, Q4 2025; applied to validate demand model assumptions, identify emerging dynamics, and assess competitive positioning
Report Format
PDF and XLSX data workbook (Word format preview document)
Publisher
Market Minds Advisory
Report Code
MMA-2026-CON-661
Published
September 2026
Contact
sales@marketmindsadvisory.com | www.marketmindsadvisory.com

Purchase the full Data Loggers Market Report (2026 to 2036).

The full report sizes the data logger market across six instrument categories, seven regions, and thirty countries, with forecasts to 2036 under base, bull, and bear cases. It examines why these instruments are bought to produce evidence rather than measurement, what the out of calibration population means for records already captured, and how single-use devices resolved failures reusable fleets never overcame. Competitive analysis covers twenty participants evaluated consistently on shipment value, with detailed treatment of calibration relationship ownership and regulatory documentation depth. Cost structure, margin architecture by category, and regional obligation drivers are analysed in full. Primary research includes 3,800 survey responses and 47 expert interviews.
Six instrument categories sized and forecast separately
Twenty participants evaluated on shipment and service value
Regional monitoring obligation drivers across seven geographies
Margin architecture by category and calibration ownership
Calibration compliance analysis across deployed instrument fleets
Cost per usable record benchmarking against single-use alternatives

Built For The People Who Decide

From boardroom strategy to bench-side execution, this report is read cover-to-cover by leaders shaping the next decade of their industry, turning demand scenarios, market dynamics and valuation benchmarks into decisions.
CXOs/ Presidents/ VPs/ Managers
M&A and Corporate Development
Strategy Teams and R&D Heads
Procurement and Product Directors
Regulatory and Compliance Leaders
Investor Relations and Equity Analysts