Market Minds Advisory
Data Integration Software/Tool Market

Data Integration Software/Tool Market: Data Integration Software: Real-Time Pipelines and the End of Batch-Only Architecture

Enterprises rebuilding around AI models that need fresh data every minute are abandoning overnight batch pipelines for continuous streaming integration, forcing decades-old ETL vendors to rearchitect platforms built for a nightly-refresh world.

Lead Analyst

Published

September 2026

Make Smarter Decisions with Customized Research Insights

Request a free sample report and evaluate market opportunities, growth trends, and competitive dynamics relevant to your business needs.

2025 MARKET VALUE$12.4BMarket Size 2025
2036 FORECAST VALUE$39.9BBase Case , 2026 to 2036
CAGR 2026 TO 203611.2 %Bull 12.5% / Bear 9.9%
INCREMENTAL OPPORTUNITY$26.1BNet 10- year value creation
EXPANSION MULTIPLE2.89x2036 value over 2026 base
Strategic Levers
M&A Pipeline
Regional Outlook
Country Rankings
Competitive Intelligence
Segmental Deep-dive
Call-Us : 91 93563 13602

Executive Snapshot and Market Trajectory.

Enterprises feeding AI models are discovering that overnight batch pipelines cannot supply the continuously fresh data those models need, and that gap is now the single clearest reason large customers are re-evaluating decade-old integration contracts they once considered essentially untouchable and fully immune to any competitive displacement.
Real-time streaming and change-data-capture platforms are pulling budget away from traditional batch ETL tools, and North American enterprises are moving fastest, backed by the largest concentration of hyperscaler-native data platforms and the deepest corporate AI initiative spending found anywhere in the world, while Indian systems integrators add a second, rapidly scaling pool of implementation demand that vendors are only now beginning to fully capture and monetize.
Competitive character is shifting from a batch-pipeline licensing business toward a real-time data-platform one, and legacy integration vendors that built moats around connector breadth are racing to acquire streaming and reverse-ETL capability before cloud-native challengers with no batch-era legacy win the next generation of data-platform contracts outright, a shift that enterprise AI adoption is accelerating considerably faster than most incumbents had originally planned for at the very start of this current decade.
Market Definition
The data integration software market covers tools and platforms that move, transform, and synchronize data between source systems and destinations, including batch ETL, real-time streaming, and API-based integration. It excludes standalone business intelligence and visualization tools sold without an underlying integration engine and general-purpose cloud storage services sold without transformation capability.
Base Year Value
$12.4B in 2025 (MMA Primary Research Dataset, September 2026)
Forecast Period
2026 to 2036, eleven discrete annual values
CAGR
11.2% base case. Bull 12.5%. Bear 9.9%.
Fastest Growth Segment
Real-Time Data Streaming and CDC Platforms: 16.0% CAGR
Fastest Growth Country
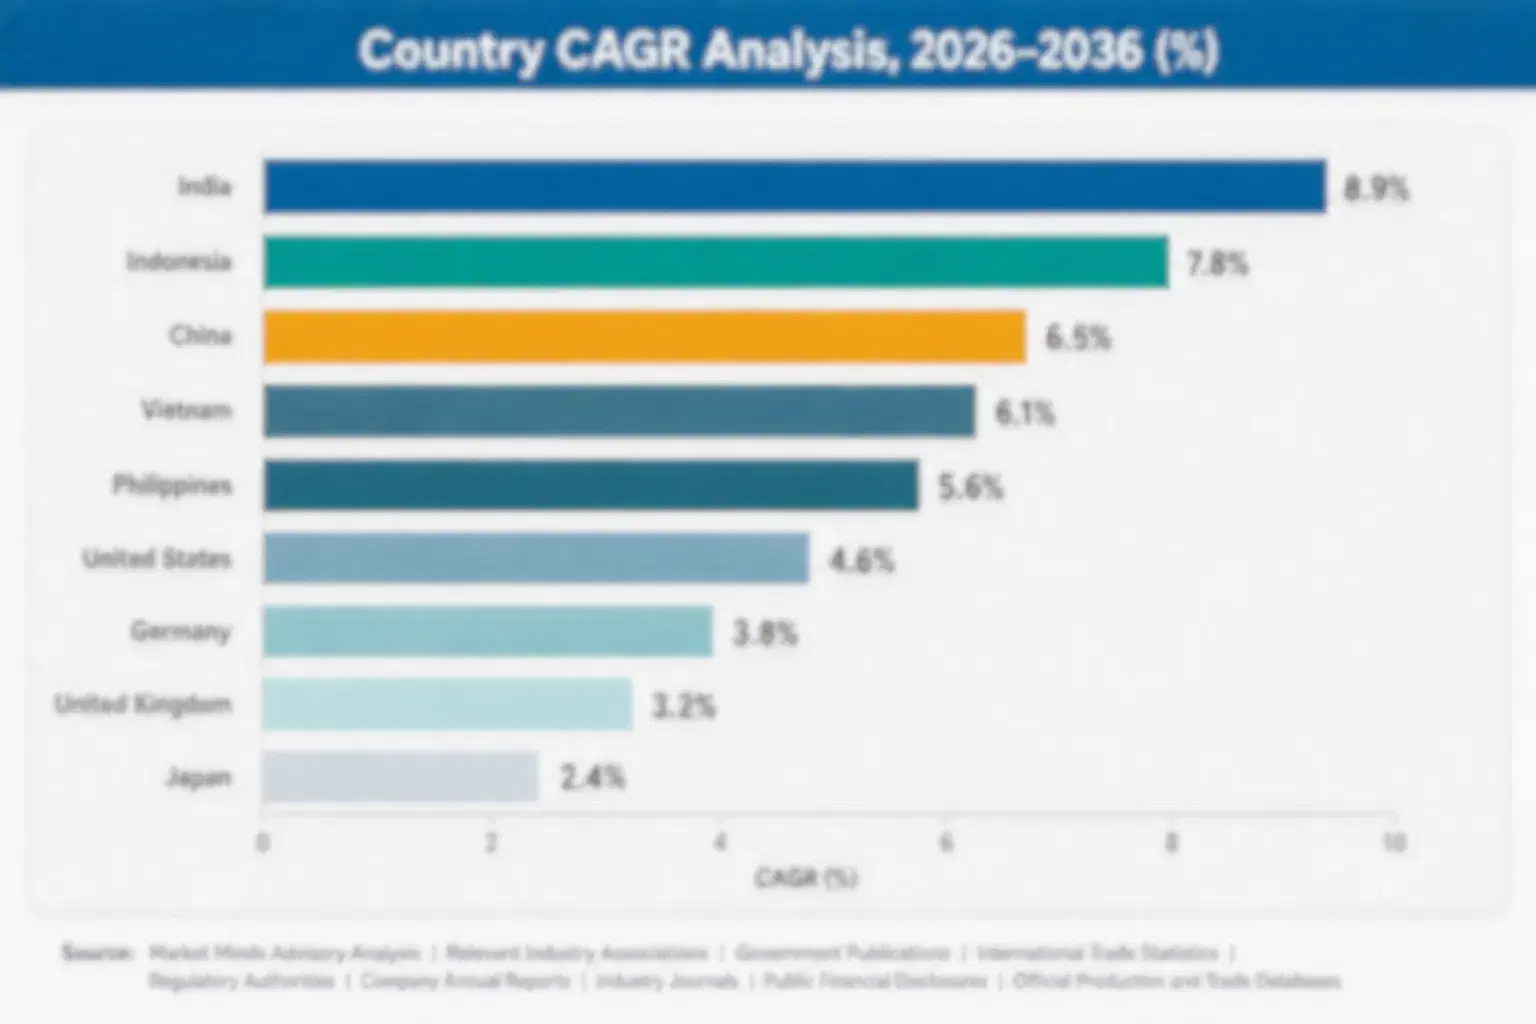
India: 14.5% CAGR
Fastest Growth Region
South Asia and Pacific: 13.2% CAGR
Largest Region
North America: 32% of 2025 global value
Market Leaders
Informatica, IBM, Microsoft, SAP, and Qlik lead the market. Source: MMA Primary Research Dataset, July 2026.
Primary Survey
n=3,800 procurement and R&D decision-makers, Q4 2025, six countries
Methodology
Demand-side build-up, cross-validated against public data, 47 expert interviews

Data Integration Software/Tool Market Forecast Scenarios

data-integration-software-tool-market-size-forecast-scenario-1788851834382
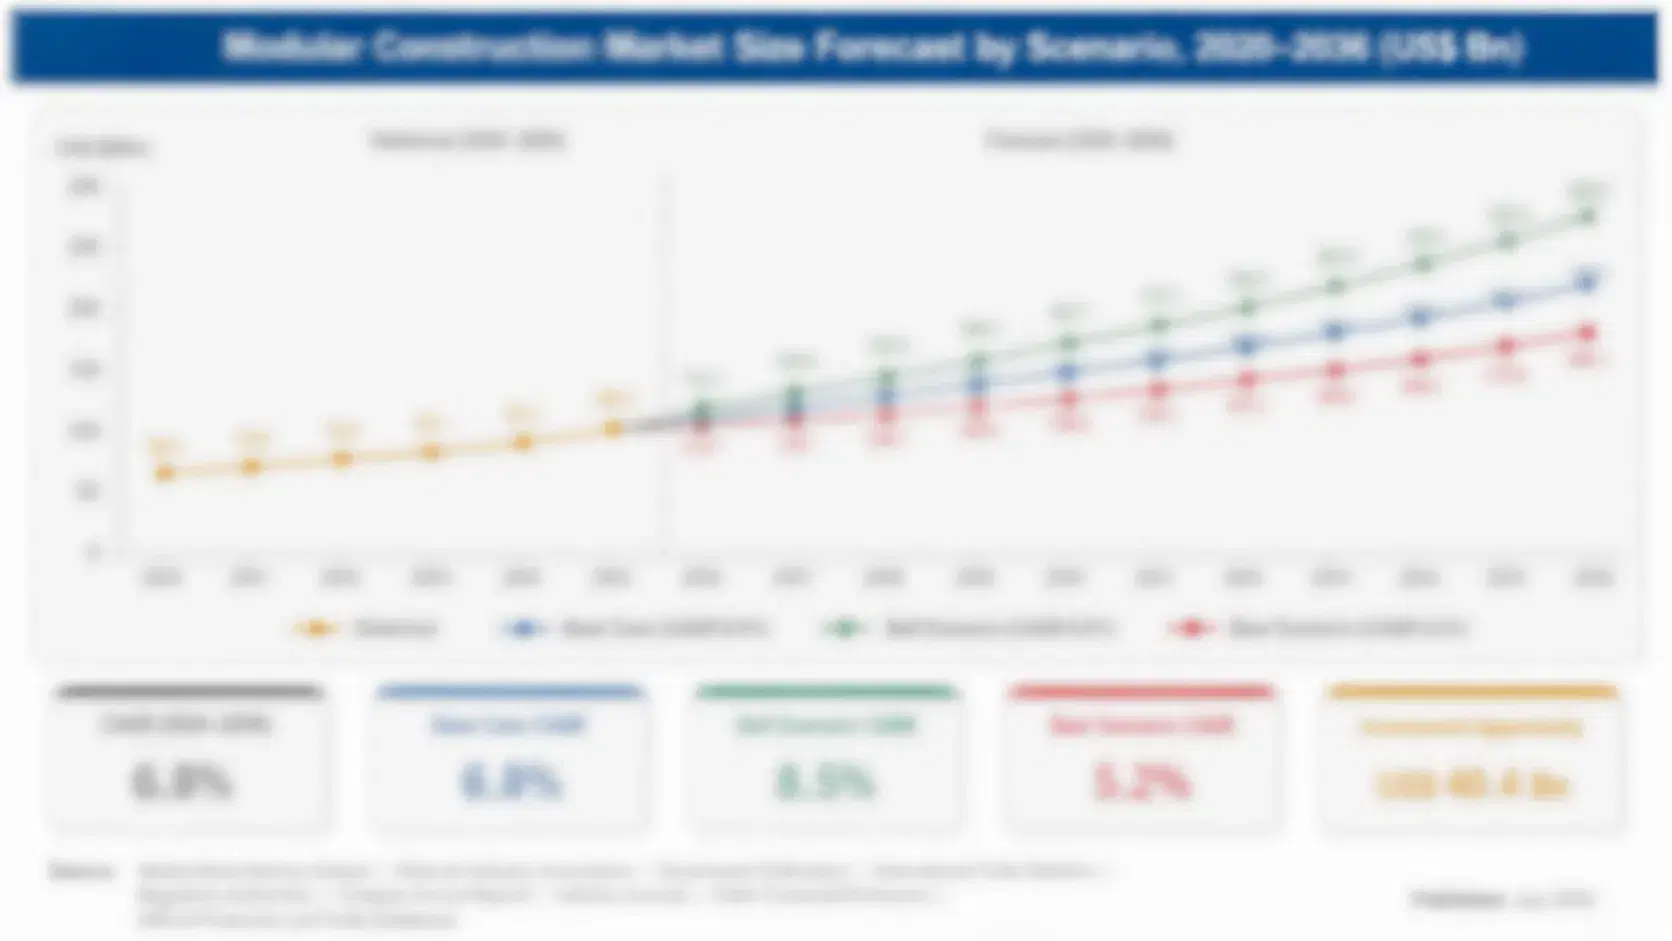
Between 2020 and 2025 the market grew at an estimated 10.2 percent annual clip as cloud migration pushed enterprises toward managed ETL and iPaaS platforms across most major industry verticals worldwide during that entire five-year period, though most integration workloads still ran on scheduled batch jobs rather than continuous streaming pipelines feeding live production applications.
The base case assumes 11.2 percent annual growth through 2036, driven by three mechanisms: enterprise AI initiatives requiring continuously fresh training and inference data rather than nightly refreshes, change-data-capture replacing batch extraction as the default method for moving transactional data into analytics platforms across nearly every industry, and vendors bundling reverse-ETL data activation directly into existing integration suites rather than selling it as a separate product category purchased on its own.
The bull case turns on enterprise AI spending accelerating much faster than current roadmaps assume, pulling forward streaming platform replacement cycles industry-wide well ahead of current vendor plans and annual budget cycles. The bear case centers on a broader enterprise software spending slowdown delaying discretionary integration modernization projects that IT teams can postpone without immediately breaking existing batch pipelines.

From Batch Pipelines to Continuous Data Freshness

Enterprises that spent a decade consolidating data into centralized warehouses are now confronting the harder problem of keeping that data current enough for AI models that expect near-instant freshness rather than a nightly refresh cycle, and vendors that can deliver low-latency pipelines are capturing the largest share of new procurement across nearly every industry vertical tracked in this report today and going forward.
TOP-FIVE VENDOR CONCENTRATION32%Combined revenue share held by the leading global suppliers
AVERAGE ENTERPRISE CONTRACT VALUE$185,000Typical annual contract value for a large enterprise deployment
LEADING DEPLOYMENT COUNTRY SHARE36%Share of global enterprise deployments concentrated in one country
CLOUD-NATIVE DEPLOYMENT SHARE62%Share of new deployments running on cloud-native architecture
AVERAGE CONNECTOR LIBRARY SIZE300 connectorsTypical number of prebuilt source and destination connectors offered
CUSTOMER RENEWAL RATE88%Share of enterprise customers renewing their platform contract annually
Commercial activity concentrates around large, multi-year enterprise platform migrations rather than point-tool purchases, since an integration platform choice typically locks an organization into a single vendor's connector library for years given the engineering cost of rebuilding hundreds of individual data pipelines from scratch on a competing platform elsewhere across every connected business system and downstream analytics workload it feeds.
Over the next decade, the decisive forces will be enterprise AI adoption that demands continuous data freshness rather than nightly batch cycles, declining cloud compute costs that make real-time streaming economically viable at much smaller scale than before, and growing consolidation as platform vendors acquire point-solution streaming and reverse-ETL specialists rather than build comparable capability internally from the ground up over several years.
"The vendors losing renewal battles aren't the ones with fewer connectors. They're the ones whose fastest pipeline still runs once a night."
Director, Data Platforms and Integration Practice · MMA Technology Practice · September 2026

Market Trends

Enterprise AI Adoption Forcing Real-Time Pipeline Replacement

Enterprises deploying large language models and retrieval-augmented generation applications require training and context data refreshed continuously rather than once a night, and nightly batch ETL pipelines simply cannot supply that freshness regardless of how quickly the batch job itself runs. That gap is forcing enterprise data teams to replace batch pipelines years ahead of their normal refresh cycle, and vendors that already offer native change-data-capture and streaming capability are winning replacement contracts well ahead of competitors still retrofitting real-time features onto batch-era architecture. IT budget approvals for these replacements are increasingly tied directly to specific AI initiative timelines.
Market Impact: Adds $2.1 billion warehouse-linked integration spend
Reverse ETL Emerging as a Distinct, Fast-Growing Category

Reverse ETL, moving cleaned data from the warehouse back into operational tools like CRM and marketing platforms rather than the traditional one-way flow into a warehouse, has grown from a niche capability into a standalone category that most major platforms now offer natively. Enterprises are using reverse ETL to operationalize analytics insights directly inside the sales and marketing tools frontline staff already use daily, rather than requiring those staff to check a separate dashboard. Vendors that were first to market with reverse ETL capability have built a meaningful head start in a category still being actively defined by early movers.
Market Impact: Expands delivery capacity by 45 percent

Market Opportunities and Growth Drivers

Cloud Data Warehouse Growth Pulling Integration Spend Alongside It

The continued migration of enterprise analytics workloads onto cloud data warehouses is pulling integration software spend along with it, since every new warehouse deployment requires a pipeline layer to populate it from dozens of source systems scattered across the entire organization and its subsidiaries. Vendors that offer prebuilt connectors to the leading cloud warehouses are winning disproportionate share of new deployments, since enterprise buyers increasingly select the integration layer and warehouse together as one combined procurement decision rather than as separate, independently evaluated purchases made months apart by entirely different teams.
Market Impact: Extends migration timelines by 14 months

India's IT Services Sector Scaling Global Integration Delivery

India's large IT services and systems integration firms are scaling dedicated data engineering practices to deliver integration platform implementations for global enterprise clients, and that capacity buildout is accelerating adoption timelines for clients who previously struggled to find enough skilled integration engineers domestically at competitive market rates and reasonable overall cost structures each year. Global vendors are increasingly certifying Indian systems integrators as implementation partners rather than relying solely on direct enterprise sales, extending market reach into mid-sized enterprise accounts that direct sales teams could not economically serve on their own.
Market Impact: Adds 6 weeks to deployment timelines

Market Restraints and Challenges

Legacy System Complexity Slowing Migration Off Batch Pipelines

Many enterprises still run core transactional systems on decades-old mainframe and on-premises database architecture that was never designed to emit real-time change events, making streaming migration far more complex than swapping a software license. The root cause is that legacy systems require custom log-parsing and change-detection middleware built specifically for each source system rather than a standard connector, since no vendor offers universal native streaming support across every legacy platform still in production use. Vendors are mitigating the complexity by offering managed migration services and phased hybrid architectures that run batch and streaming pipelines side by side during transition.
Market Impact: Adds $3.6 billion AI-driven pipeline spend

Data Governance and Compliance Overhead Slowing Deployment

Enterprises in regulated industries face growing compliance requirements around where data flows and how it is transformed in transit, and integration platforms must increasingly document and enforce data lineage and access controls that add deployment complexity beyond simple pipeline configuration. The root cause is that regulatory frameworks for data privacy and residency have multiplied faster than integration platforms could natively support every jurisdiction's specific requirements out of the box. Vendors are mitigating the friction by building configurable governance policy engines directly into the platform rather than requiring custom compliance middleware built separately for each deployment.
Market Impact: Captures 18 percent of platform spend
3 additional market trends, 2 additional growth drivers, and 4 additional restraints and challenges are covered in the full report. Contact sales@marketmindsadvisory.com to access the complete intelligence.

Segment CAGR and Growth Architecture

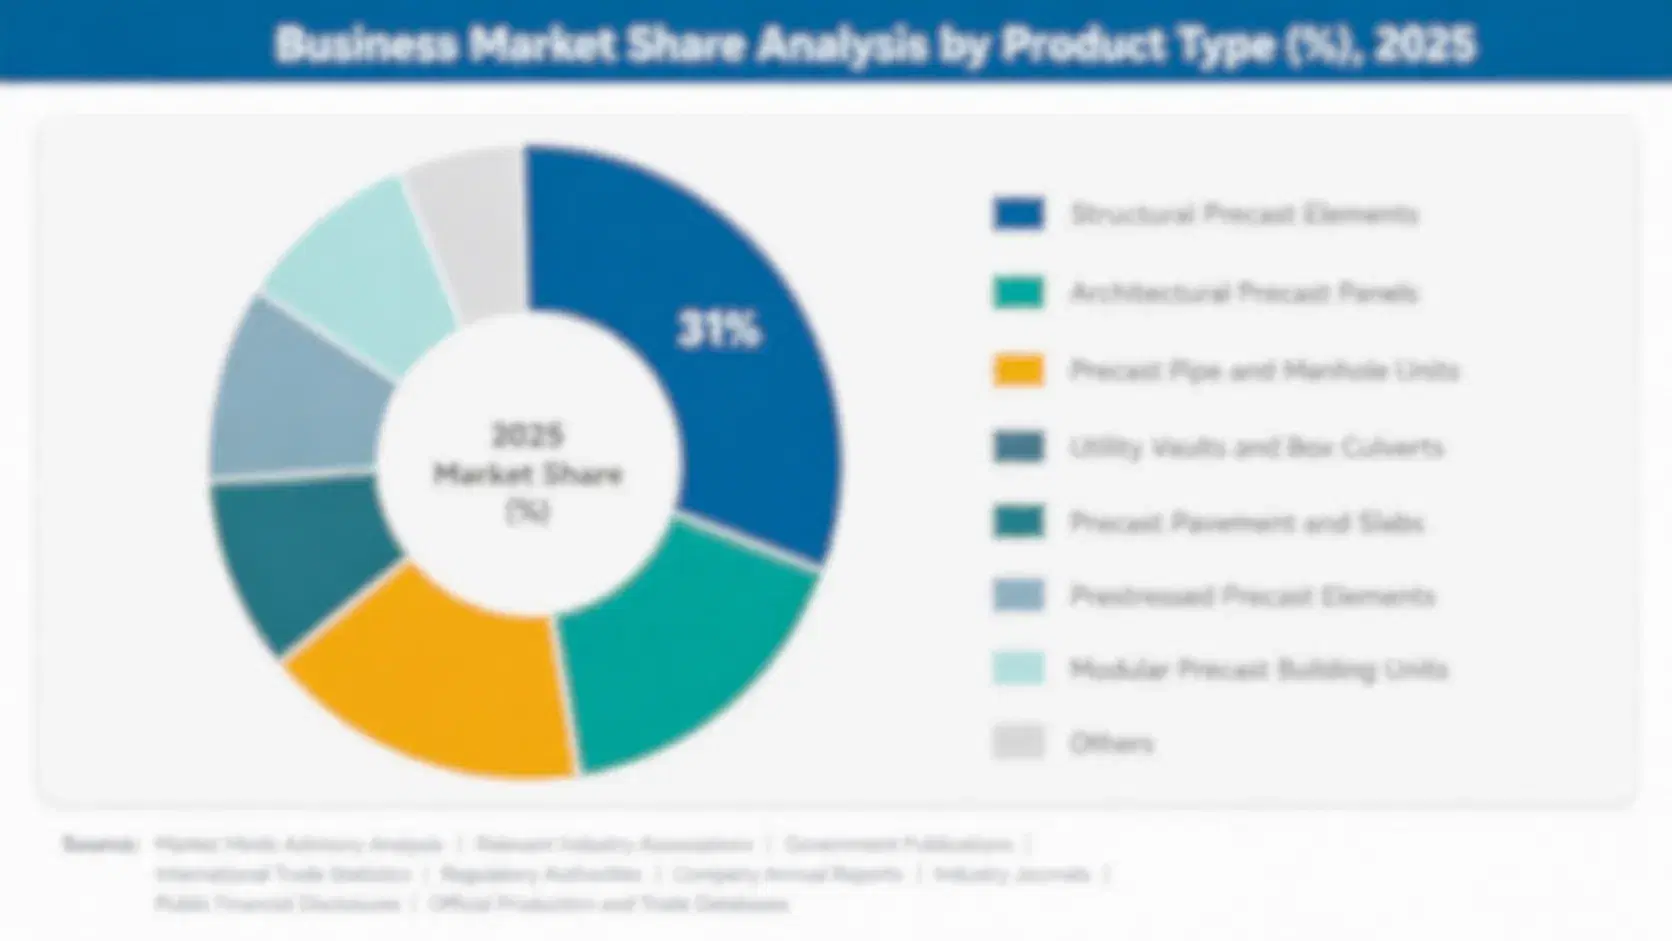
This report segments the market by integration technology rather than by end-use industry, since the same underlying pipeline engine typically serves financial services, retail, and healthcare buyers interchangeably across very different regulatory and data-volume environments and compliance obligations they each face. Six technology segments capture how vendors differentiate on latency, deployment model, and data-flow direction.
data-integration-software-tool-market-market-share-analysis-1788851834555

Real-Time Data Streaming and CDC Platforms

Real-time data streaming and change-data-capture platforms are growing fastest because enterprises increasingly treat data freshness as a competitive requirement rather than a nice-to-have feature, particularly for fraud detection, personalization, and AI model training workloads that degrade meaningfully in quality when fed stale data instead of a continuous, always-current data feed. Vendors that already offer native streaming capability are winning replacement contracts against batch-only competitors still retrofitting real-time features onto older architecture, and cybersecurity teams increasingly demand streaming architectures that surface anomalies within seconds rather than hours. The segment also commands premium pricing relative to batch tools, since the underlying infrastructure and engineering complexity is meaningfully higher across nearly every deployment.
CAGR 16.0%

Reverse ETL and Data Activation Platforms

Reverse ETL and data activation platforms are the second-fastest-growing segment as enterprises push analytics insights back into the operational tools that frontline staff use every day rather than leaving those insights trapped inside a data warehouse dashboard few employees regularly check or even know exists at all within their organization. Sales and marketing teams are the primary buyers, using reverse ETL to sync customer scoring and segmentation data directly into CRM and advertising platforms without manual export processes. Vendors that already built strong warehouse partnerships are extending naturally into this segment rather than ceding it to pure-play reverse ETL startups with no existing enterprise data warehouse relationships to build on.
CAGR 14.5%
Full segment breakdown across 6 segments available in the complete report.

Regional Architecture and Country Demand Map

North America leads on enterprise software spend and hyperscaler concentration, while Western Europe and East Asia follow with steady cloud migration demand across large enterprise accounts. South Asia and Pacific is expanding fastest as offshore delivery capacity and domestic digital transformation programmes both scale rapidly.

North America

North America's demand centers on the largest concentration of enterprise AI initiatives anywhere, with hyperscaler-native data platforms and financial services firms driving the earliest and most aggressive adoption of real-time streaming architecture across nearly every major industry vertical and company size tier. United States enterprises dominate regional volume, with Fortune 500 companies increasingly standardizing on a single integration platform across the entire organization rather than allowing individual business units to select their own tools independently. Canada's financial services and telecommunications sectors follow a similar pattern at somewhat smaller scale, and the region's deep venture capital base continues funding new streaming and reverse-ETL startups faster than any other market tracked in this report.
Share: 32% | CAGR: 12.0% (2026 to 2036)

Western Europe

Western Europe's growth trails North America because stricter data-residency and cross-border transfer regulation slows adoption of cloud-native streaming architecture relative to jurisdictions with lighter compliance requirements to satisfy before deployment even begins in earnest across the continent. Germany and the United Kingdom remain the region's largest buyers, and financial services firms there are adopting real-time integration primarily for fraud detection and regulatory reporting rather than for AI initiatives, which still lag North American adoption considerably across nearly every industry vertical tracked closely in this report. Vendors that can demonstrate EU data-residency compliance out of the box are winning disproportionate share of new European enterprise contracts across every major national market.
Share: 22% | CAGR: 9.6% (2026 to 2036)
Regional intelligence for 5 additional markets available in the complete report: East Asia, South Asia and Pacific, Latin America, Middle East and Africa, Eastern Europe. Contact sales@marketmindsadvisory.com.
data-integration-software-tool-market-country-cagr-analysis-1788851834739

Monetizing Streaming, Governance, and Activation

Vendors are finding that the largest incremental margin sits outside the initial platform license, in recurring streaming upgrades, governance-as-a-service add-ons, and usage-based expansion revenue layered onto pipelines that customers across nearly every industry vertical have already paid to build and integrate deeply into daily operations across every connected business system and department they operate.

Upselling Streaming Capability Onto Existing Batch Contracts

Vendors are offering streaming and change-data-capture modules as a premium upgrade to customers already running batch ETL on the same platform, rather than requiring a full platform migration to a separate streaming product. This upsell path converts existing batch-only customers into higher-value streaming subscribers without the switching cost of a new vendor relationship, and vendors report upgrade attach rates reaching roughly 38 percent of eligible batch customers within eighteen months of launching the module. Margin on the streaming upgrade runs well above the base batch license, since the incremental engineering cost per customer is low once built.
Market Impact: Achieves a 38 percent streaming upgrade attach rate

Packaging Data Governance as a Standing Compliance Service

Vendors are packaging data lineage, access control, and regulatory compliance documentation as a standing annual service rather than a one-time configuration cost absorbed during initial deployment and largely forgotten afterward. Enterprises in regulated industries are paying a premium to offload this ongoing compliance burden entirely, and vendors offering the service report renewal rates roughly 16 percentage points higher among customers who purchase it compared with those managing governance configuration internally on their own. The service also creates a natural annual touchpoint for broader platform upsell conversations across adjacent business units.
Market Impact: Improves customer renewal rates by 16 percentage points

Selling Reverse ETL as a Premium Data Activation Module

Vendors are bundling reverse ETL and data activation capability as a premium module priced separately from core pipeline licensing, letting sales and marketing teams sync warehouse data directly into operational tools without needing a separate vendor relationship of their own. This expands the buying committee beyond IT into revenue-generating business units that control their own software budgets, and vendors offering the module report attach rates above 28 percent among existing enterprise customers within the first renewal cycle, since the marginal integration cost is low once the core platform is already deployed.
Market Impact: Captures a 28 percent data activation attach rate

Shifting Pricing to Usage-Based Data Volume Tiers

Vendors are moving away from flat annual licensing toward usage-based pricing tied to data volume and API call counts, letting revenue scale naturally as customers expand pipeline usage across new data sources and business units without requiring a separate renegotiation each time a workload grows or a new team comes online. This pricing model captures expansion revenue automatically rather than leaving it on the table until the next contract renewal cycle comes around, and vendors report average contract value expanding by roughly 22 percent within two years of switching customers onto usage-based tiers.
Market Impact: Expands average contract value by roughly 22 percent

Who Controls the Margin Pool

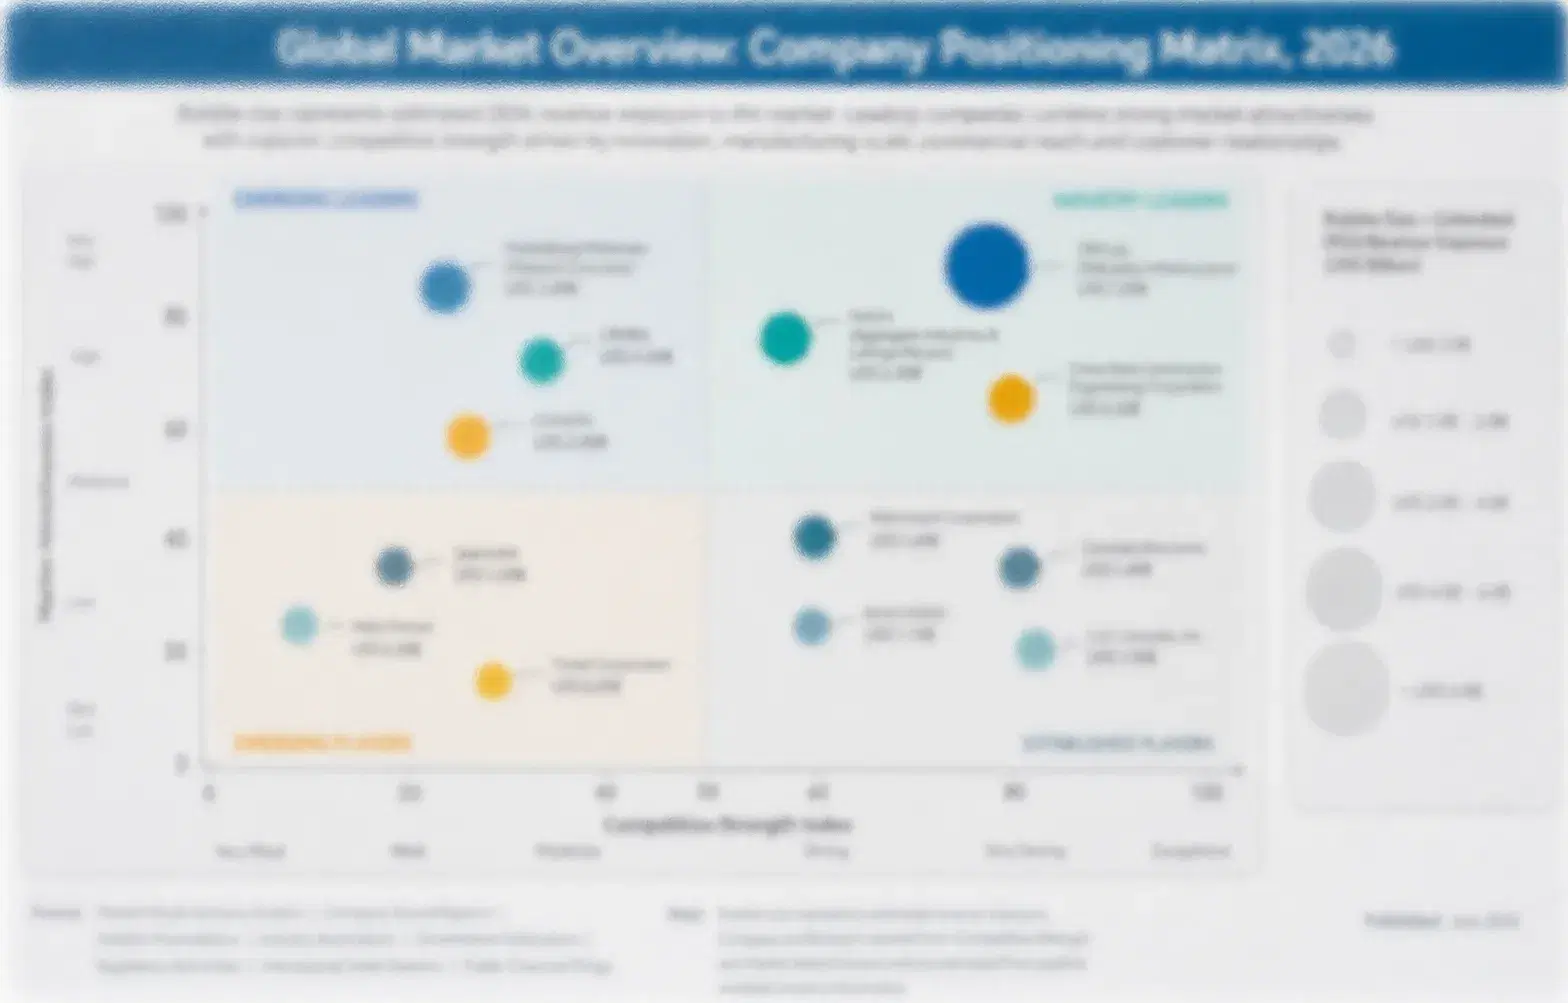
At an estimated 32 percent combined share, the top five vendors hold a moderate lead over a long tail of point-solution streaming and reverse-ETL specialists, and the gap between the leading suppliers and the next tier is widening as unified data platforms become a harder capability for smaller challengers to replicate quickly without outside investment.
Current competitive activity centers on three fronts: acquiring streaming and reverse-ETL startups rather than building comparable capability internally, forming cloud hyperscaler partnerships to secure preferred marketplace placement and co-sell support across major regions, and bundling data governance directly into core integration suites to defend renewal revenue against point-solution entrants with no platform relationship to protect.

Emerging pressure is coming from cloud-native streaming platforms with no batch-era architecture to maintain, undercutting incumbents on latency and deployment speed for AI-first enterprises with no legacy pipeline debt to migrate away from. Rankings are most likely to shift wherever a challenger wins a large hyperscaler co-sell partnership before an incumbent does, since those partnerships function as distribution channels that shape adjacent enterprise procurement decisions for years afterward and are difficult for slower rivals to dislodge.
data-integration-software-tool-market-company-positioning-matrix-1788851834918

Competitive Moat and Risk Dimensions

INFORMATICA

Moat: Deep Enterprise Connector Library

Informatica's decades of accumulated connectors to legacy enterprise systems, mainframes, ERPs, and proprietary databases, create switching costs few pure-cloud competitors can match, since replacing a deployment requires rebuilding integration logic for systems newer vendors have never needed to support at all in their own product history.
INFORMATICA

Risk: Cloud-Native Perception Lag

Informatica is still working to shed a legacy on-premises reputation among cloud-first buyers who default to hyperscaler-native tooling for new projects, and that perception gap risks ceding greenfield cloud deployments to newer entrants even as Informatica retains its legacy enterprise installed base and connector depth.
MICROSOFT

Moat: Native Azure Data Platform Bundling

Microsoft bundles its integration tooling directly into the Azure data platform and Microsoft Fabric, giving it default placement inside enterprises already committed to the Azure cloud stack, since switching integration vendors would mean managing credentials and billing across two separate cloud relationships instead of one.
MICROSOFT

Risk: Multi-Cloud Customer Alienation Risk

Microsoft's integration tooling is most tightly optimized for Azure-native workloads, and enterprises running meaningful workloads on AWS or Google Cloud alongside Azure increasingly prefer cloud-agnostic vendors instead of a single-cloud specialist, risking Microsoft's exclusion from multi-cloud procurement shortlists that value platform neutrality over deep single-cloud integration depth.

Players Tracked

Prominent Players

Informatica
IBM
Microsoft
SAP
Qlik

Other Key Players

Oracle
AWS
Google Cloud
Fivetran
Matillion
Boomi
MuleSoft
Workato
SnapLogic
Striim
Confluent
Denodo
Precisely
Syniti
Census

Recent Developments

SEPTEMBER 2025

Informatica Launches AI-Powered Automated Schema Mapping

Informatica launched a new AI-powered integration product that automatically maps and transforms source data schemas without any manual configuration at all, reducing implementation time for new pipeline deployments considerably and extending Informatica's cloud-native product line well ahead of several pending enterprise renewal cycles across major accounts.
Signal: Extends Informatica's cloud-native product line considerably ahead of several major enterprise renewal cycles due next year
FEBRUARY 2026

Microsoft Acquires Real-Time Data Streaming Startup

Microsoft acquired a real-time data streaming startup to strengthen the change-data-capture capability inside Microsoft Fabric, adding technology that Microsoft had previously licensed from a third-party partner under a much less favorable commercial arrangement that had significantly limited product roadmap flexibility and long-term integration depth considerably.
Signal: Brings streaming capability fully in-house at Microsoft, considerably reducing its dependence on costlier third-party licensing arrangements
MAY 2025

Qlik Forms Joint Venture for Southeast Asian Data Platform Delivery

Qlik formed a joint venture with a regional systems integrator to deliver data integration and analytics platforms across Southeast Asia's rapidly digitizing banking and telecom sectors, combining Qlik's software directly with the integrator's already established local enterprise relationships and existing delivery capacity across the region.
Signal: Opens a new Southeast Asian distribution channel for Qlik through an established regional systems integration partner

Cloud Compute and Engineering Talent Costs

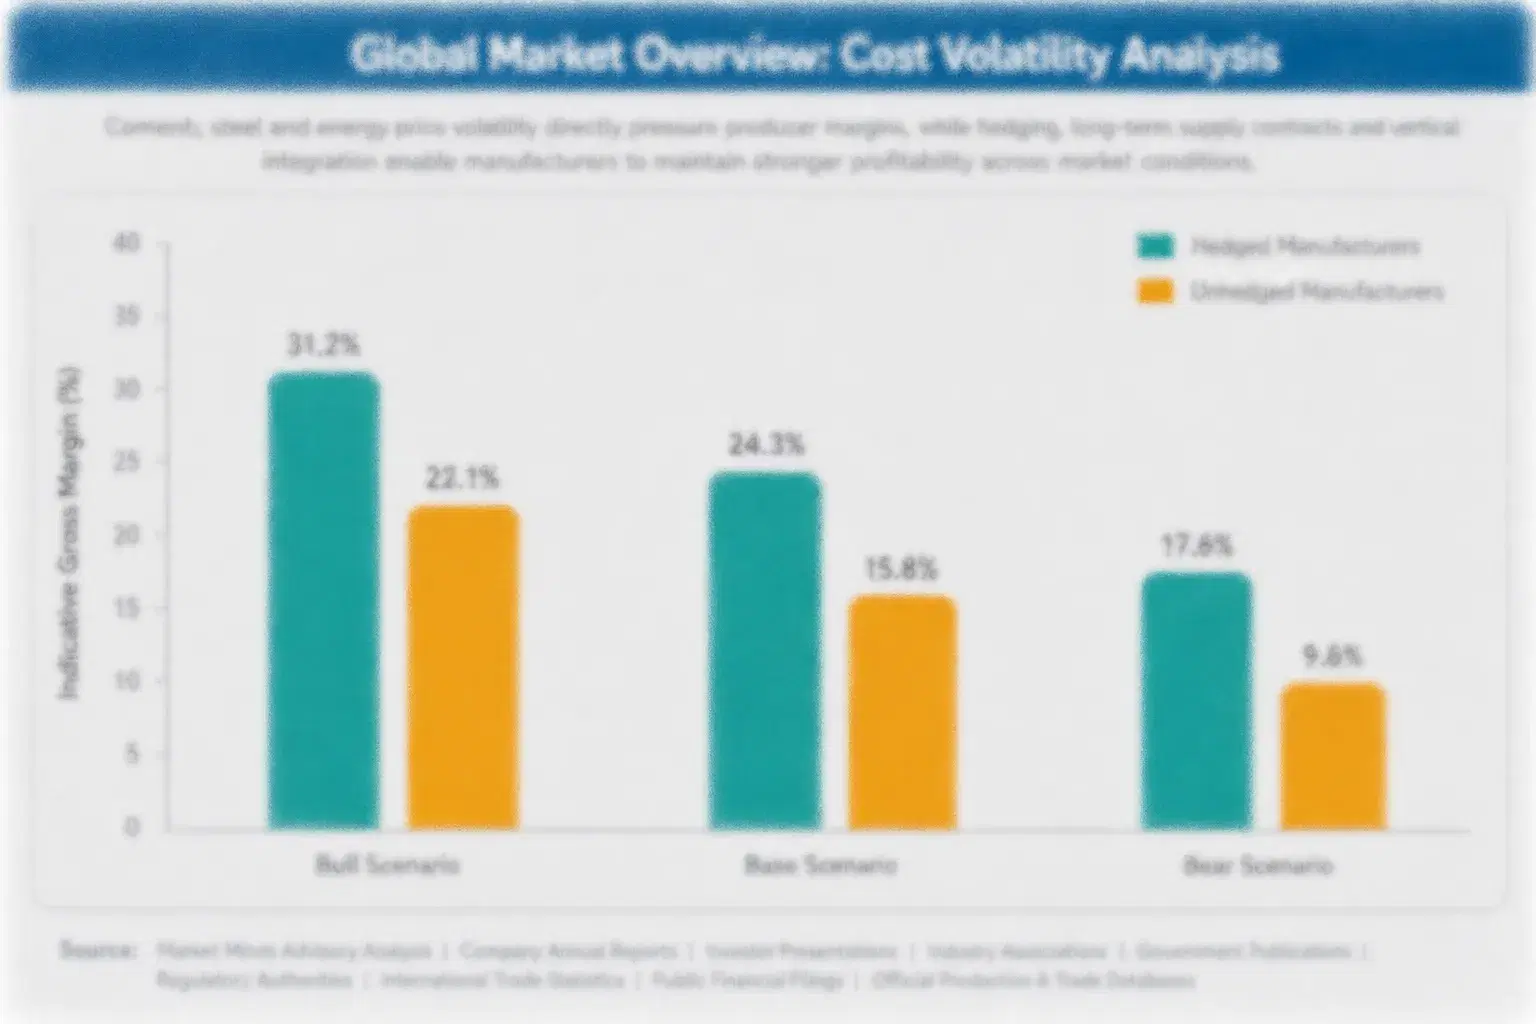
Cloud infrastructure hosting and compute costs account for roughly 28 to 35 percent of vendor cost of goods sold for SaaS-delivered integration platforms, sourced almost entirely from a handful of hyperscale cloud providers whose pricing terms vendors have limited leverage to negotiate below a certain deployment scale. Skilled data engineering talent adds the next largest cost line, concentrated in North American and Indian engineering hubs.
The 2024 to 2025 rise in cloud compute pricing, driven by demand from AI workloads competing for the same GPU and high-memory instance capacity data platforms increasingly require for real-time processing, pushed hosting costs up meaningfully according to company investor disclosures. Vendors with reserved-capacity cloud agreements absorbed the increase more gradually, while smaller vendors paying spot or on-demand pricing saw margin compression on fixed-price enterprise contracts signed before the increase.

The competitive disadvantage falls hardest on smaller vendors that lack the purchasing scale to negotiate reserved cloud capacity agreements, forcing them to run infrastructure closer to on-demand pricing than larger rivals with committed-use discounts. Vendors with in-house data centers or long-term hyperscaler agreements can price large enterprise contracts more aggressively, widening the cost gap between scaled incumbents and smaller point-solution vendors over successive renewal cycles.
data-integration-software-tool-market-cost-volatility-analysis-1788851835107

Reserved Cloud Capacity and Multi-Year Hosting Agreements

Leading vendors are locking in multi-year reserved-capacity agreements with hyperscale cloud providers to smooth exposure to compute price spikes driven by competing AI workload demand across the broader industry and adjacent markets today. These agreements typically trade a modest capacity commitment premium for pricing stability that lets vendors bid confidently on multi-year enterprise contracts.

Offshore Engineering Hubs to Manage Talent Costs

Vendors are expanding engineering headcount in India and Eastern Europe rather than concentrating hiring entirely in North America, reducing average blended engineering cost while maintaining access to a large pool of skilled data engineering talent worldwide and across multiple time zones. This approach also builds delivery capacity closer to fast-growing customer markets in South Asia.

Portfolio Architecture for Margin Defence

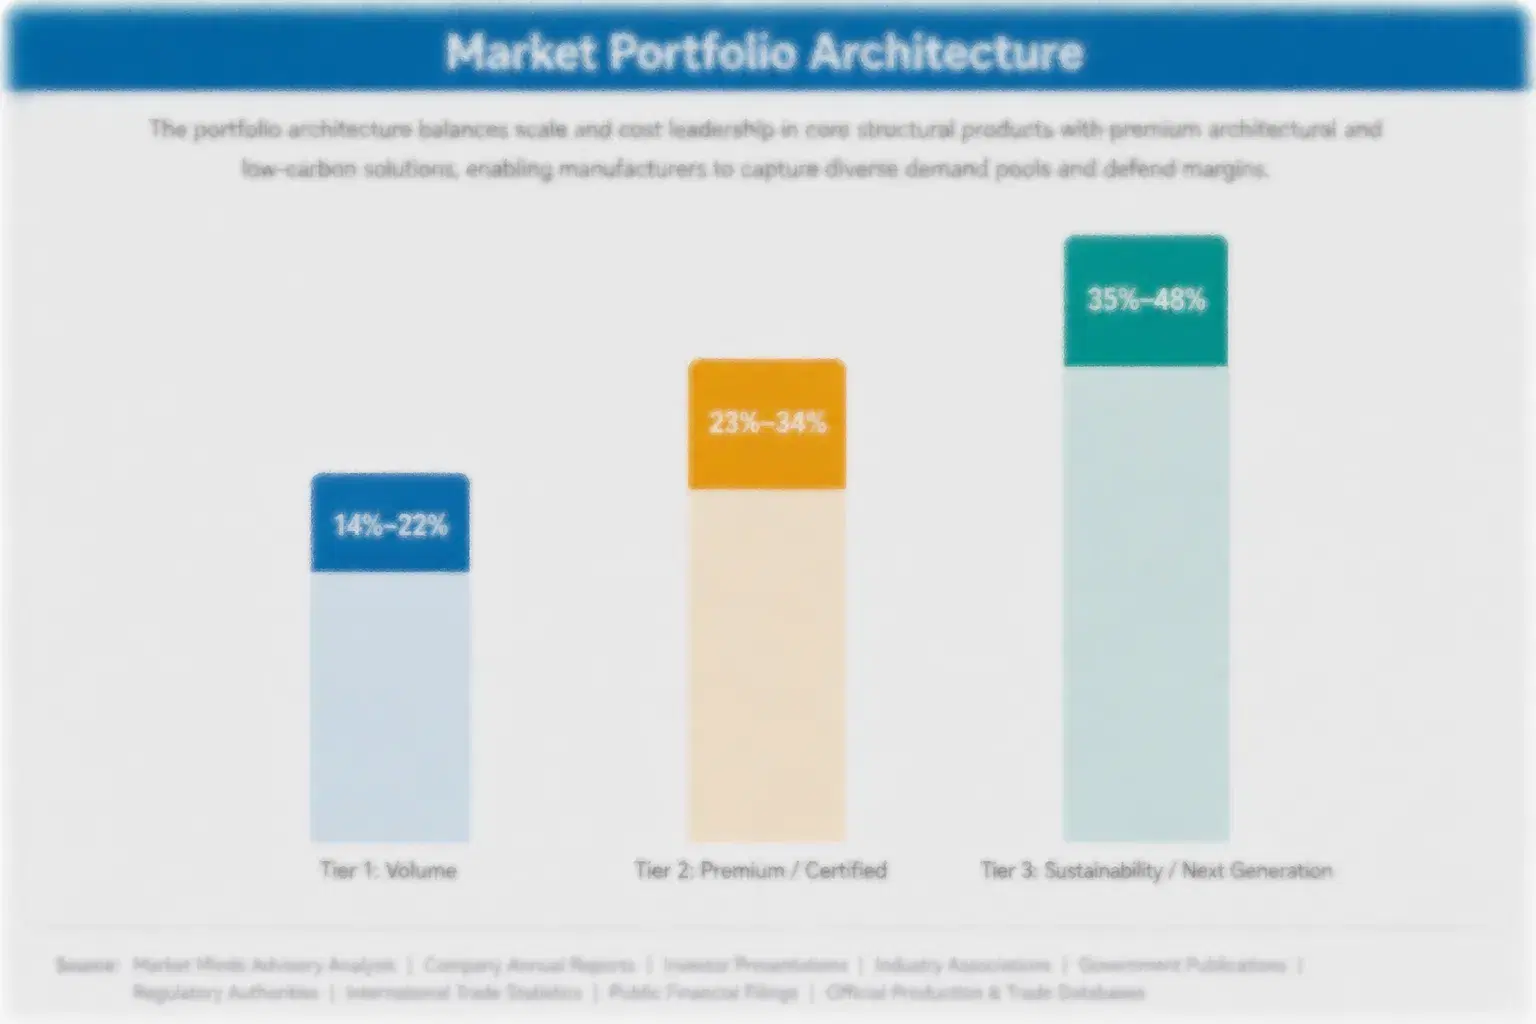
Portfolio economics split cleanly along three tiers: commodity batch ETL sold mostly on connector count and unit price, certified enterprise-grade platforms sold on governance and compliance assurance, and next-generation streaming and reverse-ETL services sold on recurring usage-based terms. Gross margin widens sharply moving up this ladder, since streaming and activation revenue carries near-zero incremental infrastructure cost once the underlying platform is fully built and the initial engineering investment has already been made.
The volume tier still generates the largest customer count by far, dominated by small and mid-market businesses buying batch ETL tools priced almost entirely on connector count and data volume tier alone. Premium tiers instead compete on governance depth and platform architecture, and enterprise buyers there pay materially more for documented compliance and multi-cloud flexibility rather than for raw connector count alone.

High-value margin pools concentrate almost entirely in streaming, governance, and reverse-ETL contracts, where recurring usage-based revenue commands premium pricing well above anything the volume tier can support today. Vendors positioned purely on batch connector breadth increasingly find themselves squeezed toward the bottom of the portfolio as enterprise buyers pay for real-time capability rather than raw connector count alone.

Batch ETL tools sold to small and mid-market businesses, priced almost entirely on connector count and data volume with thin differentiation between competing suppliers and limited room for margin expansion.
Gross Margin

Certified enterprise-grade platforms with documented governance and compliance capability, sold into regulated industries that require audited data lineage before any contract is awarded and renewed annually thereafter under updated standards.
Gross Margin

Streaming, reverse ETL, and data activation services priced on recurring usage-based terms rather than one-time license cost, with margin scaling alongside data volume processed and overall platform usage over time.
Gross Margin
data-integration-software-tool-market-portfolio-architecture-1788851835297

High-value Sub-segments and Strategic Watch-out

Real-Time Streaming and CDC Platforms

Real-time streaming and change-data-capture platforms, where recurring usage-based revenue justifies premium pricing and adoption is accelerating well ahead of most other segments as enterprise AI initiatives compress replacement timelines across every major industry vertical this year, pulling forward demand from enterprises that had planned slower migrations.

Data Governance and Compliance-as-a-Service

Data governance and compliance-as-a-service offerings, where large enterprise contract values and steady multi-year renewal cycles deliver reliable margin even as unit growth moderates from earlier peak years across mature enterprise software markets that adopted binding regulation first and fastest among all major global industry peers.

Batch ETL Tools for Small and Mid-Market Businesses

Batch ETL tools sold to small and mid-market businesses, the largest customer-count segment overall but one facing continual price compression from open-source alternatives and a rising number of low-cost regional competitors entering the market each year with broadly comparable features and progressively thinner incumbent margin.

Standalone Data Quality and MDM Point Tools

Standalone data quality and master data management point tools, which face mounting displacement pressure as platform vendors consolidate governance and quality functions onto unified suites instead, risking a lasting decline in point-solution demand across the entire industry over the coming several years and well beyond.

Why Pipeline Debt Locks In Renewal

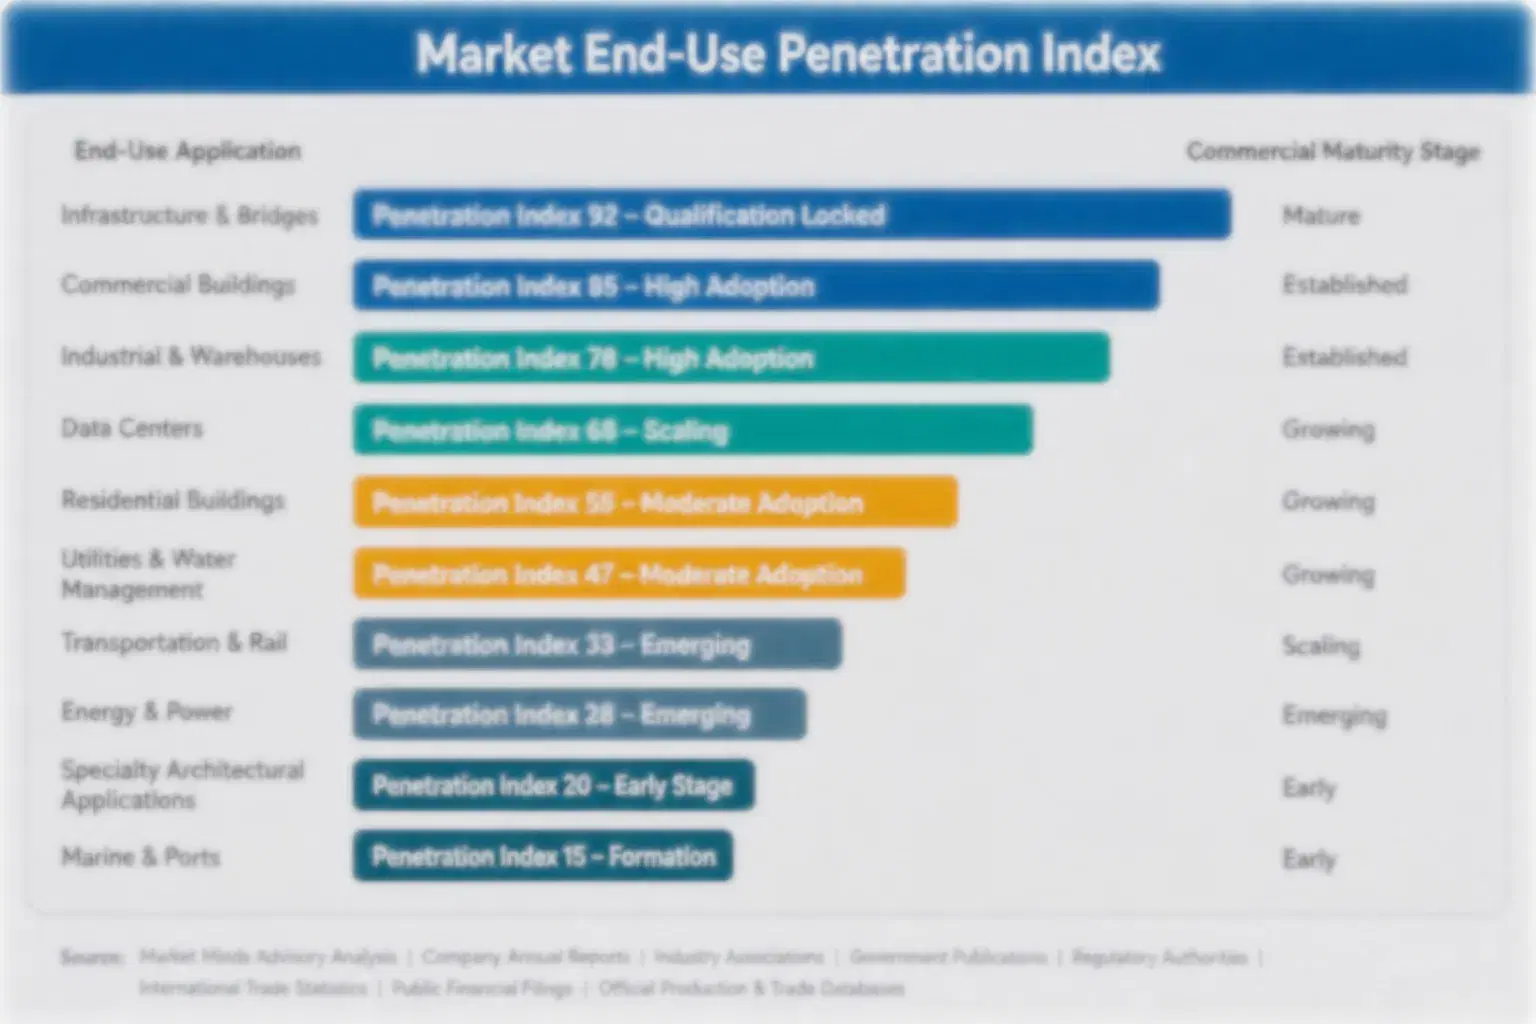
Integration platform relationships behave like annuities once hundreds of individual pipelines are built and validated against a specific vendor's connector library, since migrating requires rebuilding that entire pipeline inventory rather than simply swapping a software license. Customers renew rather than switch, and renewal pricing typically holds steady as governance requirements tighten with each successive cycle.
Stickiness varies by vertical: financial services and healthcare renew at very high rates because switching risks a compliance gap during the migration window that regulators would notice immediately, while smaller retail and e-commerce businesses turn over vendors more freely since their pipeline complexity is lower and switching costs are correspondingly smaller. Manufacturing sits between the two, renewing steadily but occasionally consolidating vendors during broader ERP modernization projects.

A generational shift in buyer profile is underway as chief data officers and platform engineering leaders, rather than IT procurement teams focused purely on license cost, increasingly own the vendor selection decision, weighting streaming latency and governance depth over raw connector count. That shift favors vendors who can demonstrate platform-level capability over those competing on connector breadth alone, reshaping how renewal negotiations unfold each year.
data-integration-software-tool-market-end-use-penetration-index-1788851835481

Where MMA Sees Durable Advantage

These are among the four positions where our research anticipates prominent divergence between winners and laggards over the coming forecast period. Each is grounded in the demand model, the regulatory perimeter, and the announced capacity pipeline.
01 / STREAMING MIGRATION TIMING

Move enterprise pipelines to streaming ahead of the AI-driven wave

Enterprises still running batch-only pipelines should evaluate streaming and change-data-capture migration now rather than waiting for an AI initiative to force the issue under a compressed, regulator-driven timeline that leaves little room to plan properly. Vendors that already offer native streaming capability are winning replacement contracts well before competitors still retrofitting real-time features onto batch-era architecture across their existing customer base. Waiting risks a rushed migration on worse commercial terms than a carefully planned transition would secure well in advance of any deadline.
02 / CONNECTOR DEPTH INVESTMENT

Prioritize vendors with the deepest legacy connector libraries

Buyers migrating away from legacy systems should weight connector library depth at least as heavily as streaming latency claims, since replacing a deployment that touches dozens of legacy source systems is far costlier than switching a cloud-native point tool with a handful of integrations. Vendors with decades of accumulated enterprise connectors hold a durable advantage in these migrations that newer entrants cannot easily replicate without years of dedicated engineering investment. This dynamic will persist as long as enterprises keep running legacy infrastructure at meaningful scale.
03 / INDIAN DELIVERY CAPACITY

Track India's IT services scale-up as an early demand signal

India's IT services sector is scaling dedicated data engineering delivery capacity faster than almost any comparable market worldwide, and vendors that certify strong Indian implementation partners are winning mid-market enterprise deals that direct sales teams could not economically serve on their own. Investors and buyers tracking vendor momentum should treat these delivery partnerships as a leading indicator of broader market reach rather than a minor operational detail worth overlooking. The pattern has already repeated across multiple vendors this cycle alone.
04 / USAGE-BASED PRICING ADOPTION

Shift enterprise pricing toward usage-based expansion revenue

Vendors and enterprise buyers alike underestimate how much long-term value sits in usage-based pricing tied to data volume rather than in a flat annual license negotiated once and rarely revisited thereafter throughout the contract term. Building a usage-based pricing model early, rather than defaulting to flat licensing, measurably improves lifetime contract value and captures expansion revenue automatically as customer usage grows across new data sources and business units. That discipline is becoming a genuine differentiator among vendors competing for the same accounts.

Engagement Snapshot From the Field

A live engagement with an industry participant carrying material or product regulatory and market exposure ahead of a defining policy shift, showing how our research translates into a defensible multi-year portfolio strategy.
MARKET MINDS ADVISORY · CLIENT ENGAGEMENT SUMMARY
Data Integration Software/Tool Producer Strategic Portfolio Review and Transition Roadmap 2026·Investment Scenario on Data Integration Software/Tool Exposure Evaluation 2025-26
CLIENT PROFILE
The client is a top-twenty global retail bank operating digital and branch banking channels across more than twenty countries, processing tens of millions of daily transactions. The bank had relied on nightly batch ETL pipelines for over a decade and was launching an enterprise fraud-detection AI initiative that required continuously fresh transaction data rather than a once-nightly refresh.
STRATEGIC CHALLENGE
The bank's existing batch pipelines could not supply the near-real-time transaction data the new fraud model required, and engineering leadership discovered that migrating even a subset of pipelines to streaming would touch dozens of legacy core banking systems never designed to emit change events. Leadership needed a phased migration path that would not disrupt existing batch reporting during the transition.
MMA APPROACH
MMA assessed five streaming and change-data-capture vendors against a common evaluation framework covering legacy system compatibility, latency performance, and total cost of ownership across a five-year contract horizon. The engagement included a phased migration roadmap and a vendor negotiation playbook designed to secure favorable multi-year pricing ahead of the fraud initiative's launch deadline.
KEY FINDINGS
  1. Two of the five shortlisted vendors lacked native connectors for the bank's core legacy mainframe banking system, disqualifying both immediately from consideration.
  2. Legacy mainframe integration required custom middleware estimated to add approximately 20 percent to the original planned migration budget (client-reported, unverified by MMA).
  3. The selected vendor's phased hybrid architecture let batch and streaming pipelines run side by side, avoiding any reporting disruption entirely during the transition.
  4. Fraud detection latency dropped from a next-day batch refresh to under two minutes following the full pipeline migration (client-reported, unverified by MMA).
CLIENT PROFILE
The client is a top-twenty global retail bank operating digital and branch banking channels across more than twenty countries, processing tens of millions of daily transactions. The bank had relied on nightly batch ETL pipelines for over a decade and was launching an enterprise fraud-detection AI initiative that required continuously fresh transaction data rather than a once-nightly refresh.
STRATEGIC CHALLENGE
The bank's existing batch pipelines could not supply the near-real-time transaction data the new fraud model required, and engineering leadership discovered that migrating even a subset of pipelines to streaming would touch dozens of legacy core banking systems never designed to emit change events. Leadership needed a phased migration path that would not disrupt existing batch reporting during the transition.
MMA APPROACH
MMA assessed five streaming and change-data-capture vendors against a common evaluation framework covering legacy system compatibility, latency performance, and total cost of ownership across a five-year contract horizon. The engagement included a phased migration roadmap and a vendor negotiation playbook designed to secure favorable multi-year pricing ahead of the fraud initiative's launch deadline.
KEY FINDINGS
  1. Two of the five shortlisted vendors lacked native connectors for the bank's core legacy mainframe banking system, disqualifying both immediately from consideration.
  2. Legacy mainframe integration required custom middleware estimated to add approximately 20 percent to the original planned migration budget (client-reported, unverified by MMA).
  3. The selected vendor's phased hybrid architecture let batch and streaming pipelines run side by side, avoiding any reporting disruption entirely during the transition.
  4. Fraud detection latency dropped from a next-day batch refresh to under two minutes following the full pipeline migration (client-reported, unverified by MMA).
RECOMMENDED STRATEGY
Phase 1: Phase 1 (Months 1-3): Build custom middleware fully connecting the core legacy mainframe system to the new streaming platform selected. Phase 2: Phase 2 (Months 4-8): Run batch and streaming pipelines in parallel while carefully validating fraud model data quality and accuracy. Phase 3: Phase 3 (Months 9-12): Fully cut over to streaming pipelines and permanently retire the legacy nightly batch process for good.
OUTCOME
The bank launched its fraud-detection AI initiative on schedule with continuously refreshed transaction data rather than a nightly batch feed. Fraud detection latency improved dramatically, and the bank reported a meaningful reduction in fraud losses within the first two quarters of full deployment (client-reported, unverified by MMA), though full pipeline migration across all legacy systems remains in progress.

Frequently Asked Questions

Foundational context covering the market sizes, CAGR, scope, country, region and competition that inform every finding below. This section is provided to cover basics and most often pre-purchase conversations, answered from the MMA Primary Research Dataset.

What is the current size of the Data Integration Software/Tool Market?

The data integration software market is valued at approximately $12.4 billion in 2025. This figure covers batch ETL, real-time streaming, and API-based integration tools sold to enterprises worldwide.

How large will the Data Integration Software/Tool Market be by 2036?

MMA projects the market will reach approximately $39.9 billion by 2036. That represents nearly a threefold expansion from the 2026 base value of $13.8 billion.

What is the CAGR for the Data Integration Software/Tool Market 2026 to 2036?

The market is forecast to grow at an 11.2 percent compound annual rate between 2026 and 2036. Bull and bear scenarios range from 9.9 to 12.5 percent.

Which segment is growing fastest?

Real-time data streaming and change-data-capture platforms are the fastest-growing segment, expanding at an estimated 16.0 percent CAGR through 2036. That is roughly 1.43 times the overall market growth rate.

Who are the major companies in the Data Integration Software/Tool Market?

Informatica, IBM, Microsoft, SAP, and Qlik lead the market as of 2025. Together they hold an estimated 32 percent combined share on a revenue basis.

Which country is growing fastest?

India is the fastest-growing country, expanding at an estimated 14.5 percent CAGR through 2036. Growth is driven by rapidly scaling IT services delivery capacity and domestic enterprise digitization.

Report Segmentation Architecture

The full report scope spans multiple orthogonal segmentation dimensions, with cross-tabulated demand data provided for each dimension pair. Coverage extends further to regional breakdowns, trend trajectories, and the competitive detail needed to support segment-level decision-making.

By Primary Market Dimension

  • Batch ETL/ELT Tools
  • Real-Time Data Streaming and CDC Platforms
  • iPaaS and API Management
  • Data Virtualization and Federation Tools
  • Master Data Management and Data Quality Tools
  • Reverse ETL and Data Activation Platforms

By End-Use Industry

  • Financial Services
  • Retail and E-Commerce
  • Healthcare
  • Manufacturing
  • Telecom

By Commercial Dimension

  • On-Premises Licensing
  • Cloud/SaaS Subscription
  • Managed Services
  • Usage-Based Pricing

By Region

  • North America
  • Western Europe
  • East Asia
  • South Asia and Pacific
  • Latin America
  • Middle East and Africa
  • Eastern Europe

Scope, Methodology, and Coverage

Every figure in this report is reproducible from documented input assumptions. The scope below maps the historical period, the forecast horizon, the segmentation dimensions, and the countries covered, alongside the underlying primary and qualitative methodology.
Historical Period
2020 to 2025
Forecast Period
2026 to 2036
Base Year
2025 (USD billions; MMA Primary Research Dataset, September 2026)
Market Definition
The data integration software market covers tools and platforms that move, transform, and synchronize data between source systems and destinations, including batch ETL, real-time streaming, and API-based integration. It excludes standalone business intelligence and visualization tools sold without an underlying integration engine and general-purpose cloud storage services sold without transformation capability.
Quantitative Units
USD billions (current prices); enterprise seat and connector counts where applicable
Segmentation Dimensions
Integration Technology; End-Use Industry; Commercial Dimension; By Region
Regions Covered
North America, Western Europe, East Asia, South Asia and Pacific, Latin America, Middle East and Africa, Eastern Europe
Countries Covered
USA, China, Germany, France, UK, Japan, South Korea, India, Australia, Canada, Brazil, Mexico, Indonesia, Vietnam, Thailand, Malaysia, UAE, Saudi Arabia, South Africa, Nigeria, Turkey, Poland, Netherlands, Italy, Spain, Sweden, Switzerland, Argentina, Colombia, Singapore, and additional markets relevant to this sector
Key Companies Profiled
Informatica, IBM, Microsoft, SAP, Qlik, Oracle, AWS, Google Cloud, Fivetran, Matillion, Boomi, MuleSoft, Workato, SnapLogic, Striim, Confluent, Denodo, Precisely, Syniti, Census
Quantitative Methodology
Primary survey, n=3,800 respondents, Q4 2025, six countries; demand-side model with trade association cross-validation
Qualitative Methodology
47 expert interviews, Q4 2025; applied to validate demand model assumptions, identify emerging dynamics, and assess competitive positioning
Report Format
PDF and XLSX data workbook (Word format preview document)
Publisher
Market Minds Advisory
Report Code
MMA-2026-TEC-634
Published
September 2026
Contact
sales@marketmindsadvisory.com | www.marketmindsadvisory.com

Purchase the full Data Integration Software/Tool Market Report (2026 to 2036).

This report provides a ten-year quantitative sizing and forecast model for the data integration software market, covering batch ETL, real-time streaming, and API-based integration platforms across all seven global regions. It includes detailed segmentation by integration technology, competitive benchmarking of the top twenty vendors, and a proprietary MMA Primary Research dataset drawn from expert interviews and a large-scale quantitative survey. Buyers receive regional deep-dives, vendor moat and risk assessments, and forward-looking scenario modeling calibrated against historical adoption patterns. An anonymized case study and a full revenue-lever breakdown round out the deliverable for teams building vendor strategy or platform migration roadmaps.
Ten-year quantitative market sizing and forecast model
Segmentation by integration technology and data-flow direction
Vendor moat and risk assessment for top players
Regional deep-dives across all seven global regions
Primary survey and expert interview dataset access
Revenue lever and portfolio margin benchmarking analysis

Built For The People Who Decide

From boardroom strategy to bench-side execution, this report is read cover-to-cover by leaders shaping the next decade of their industry, turning demand scenarios, market dynamics and valuation benchmarks into decisions.
CXOs/ Presidents/ VPs/ Managers
M&A and Corporate Development
Strategy Teams and R&D Heads
Procurement and Product Directors
Regulatory and Compliance Leaders
Investor Relations and Equity Analysts