Market Minds Advisory
Data Center Transformation Market

Data Center Transformation Market: Data Center Transformation Market. Liquid Cooling Becomes the Price of Admission for AI Workloads

Existing data centers built for conventional server racks cannot cool the dense AI accelerator clusters operators now demand, forcing a wholesale retrofit wave that liquid cooling suppliers and power infrastructure vendors are racing to capture.

Lead Analyst

Published

September 2026

Make Smarter Decisions with Customized Research Insights

Request a free sample report and evaluate market opportunities, growth trends, and competitive dynamics relevant to your business needs.

2025 MARKET VALUE$68.0BMarket Size 2025
2036 FORECAST VALUE$223.0BBase Case , 2026 to 2036
CAGR 2026 TO 203611.4 %Bull 12.7% / Bear 10.1%
INCREMENTAL OPPORTUNITY$147.2BNet 10- year value creation
EXPANSION MULTIPLE2.94x2036 value over 2026 base
Strategic Levers
M&A Pipeline
Regional Outlook
Country Rankings
Competitive Intelligence
Segmental Deep-dive
Call-Us : 91 93563 13602

Executive Snapshot and Market Trajectory.

AI workload density has outpaced what air cooling can physically handle, forcing operators into an unplanned capital cycle that facilities teams did not budget for just two years ago, and that gap is only widening further as accelerator racks grow denser with each new hardware generation released.
Liquid cooling retrofits, power distribution upgrades, and rack density conversion are consuming capital fastest among hyperscalers, while colocation providers race to retrofit legacy halls before AI tenants sign elsewhere and take their long-term lease commitments with them. Spending is concentrating heavily in the United States and increasingly across South Asian and East Asian build-out corridors, where new grid capacity and land availability still favor rapid facility conversion over new construction in many metro markets today.
Competitive intensity centers on a small group of thermal management and power infrastructure specialists rather than the incumbent data center builders themselves. Grid interconnection delays and rising equipment lead times are reshaping how quickly even well-funded operators can convert committed capital into usable capacity, and regulatory scrutiny over power grid strain is beginning to slow permitting in several high-demand metro regions across multiple countries.
Market Definition
This report defines the Data Center Transformation Market as the hardware, software, and services used to retrofit, modernize, and re-architect existing data center facilities for higher rack density and AI workloads, including liquid cooling, power distribution upgrades, and facility management software. It excludes new greenfield data center construction and standard IT hardware procurement not tied to facility-level modernization.
Base Year Value
$68.0B in 2025 (MMA Primary Research Dataset, September 2026)
Forecast Period
2026 to 2036, eleven discrete annual values
CAGR
11.4% base case. Bull 12.7%. Bear 10.1%.
Fastest Growth Segment
Liquid Cooling and Thermal Management Retrofits: 18.2% CAGR
Fastest Growth Country
India: 14.8% CAGR
Fastest Growth Region
South Asia and Pacific: 13.4% CAGR
Largest Region
North America: 31% of 2025 global value
Market Leaders
Vertiv, Schneider Electric, Eaton, Johnson Controls, and Rittal. Source: MMA Analysis based on company disclosures and installed capacity estimates.
Primary Survey
n=3,800 procurement and R&D decision-makers, Q4 2025, six countries
Methodology
Demand-side build-up, cross-validated against public data, 47 expert interviews

Data Center Transformation Market Forecast Scenarios

data-center-transformation-market-size-forecast-scenario-1789993697206
Between 2020 and 2025, data center modernization spending grew steadily as cloud migration and gradual server refresh cycles drove demand, but the pace was modest compared to what followed once generative AI workloads emerged. The category posted a historical CAGR of roughly 10.4% as AI-specific retrofit spending had barely begun to register in most facility capital budgets.
The base case rests on three commercial mechanisms: hyperscalers committing multi-year capital budgets to liquid cooling conversion, colocation providers retrofitting legacy halls to retain AI tenants before leases expire elsewhere, and power utilities accelerating grid interconnection approvals in response to sustained political and commercial pressure from major technology buyers. Together these mechanisms support a forecast CAGR of 11.4% through 2036, with retrofit intensity peaking mid-decade as accelerator density requirements stabilize somewhat across major hardware vendors.
The bull case centers on accelerated sovereign AI infrastructure programs pulling retrofit timelines forward across multiple national governments simultaneously and well ahead of schedule. The bear case centers on prolonged grid interconnection delays in key metro markets, which could push conversion projects meaningfully past their planned in-service dates and compress near-term supplier revenue quite considerably.

From Facility Maintenance to AI Infrastructure Race

Data center transformation has moved from a routine facilities maintenance line item to the single most contested infrastructure race in enterprise technology today, as AI accelerator density outpaces what conventional cooling and power distribution systems can actually deliver reliably at the scale operators now require across their existing global footprint of aging facilities.
MARKET CONCENTRATION38% CR5Top five suppliers hold combined global installed share
AVERAGE RETROFIT COST$14M per hallTypical cost to convert one legacy facility hall
TOP PRODUCING COUNTRY SHARE31%United States share of global retrofit spending volume today
LIQUID COOLING PENETRATION26%Share of new deployments using direct liquid cooling
GRID INTERCONNECTION DELAY4.2 yearsAverage wait before new grid capacity gains approval
POWER COST RATIO34% of COGSShare of operating cost tied to electricity procurement
Hyperscalers are converting existing halls rather than waiting years for new greenfield capacity to clear permitting, which has pulled retrofit spending forward considerably faster than most facility operators originally planned for their current budget cycles. Liquid cooling specialists and power distribution vendors are the direct beneficiaries of that compressed timeline, and order backlogs at leading suppliers now extend well beyond a year in most product categories.
Grid capacity has become the binding constraint rather than capital availability, since interconnection approval queues in the busiest metro markets now stretch past four years in some jurisdictions. That bottleneck is reshaping where operators choose to site new AI capacity, favoring regions with faster utility approval processes over pure cost considerations alone, and pushing some hyperscalers toward on-site power generation as an interim workaround while permits clear.
"Nobody planned for a cooling retrofit cycle this fast. The facilities teams that are winning right now are the ones who stopped waiting for permanent solutions and started converting halls with whatever liquid cooling capacity they could actually get delivered this quarter."
Director, Digital Infrastructure and Data Center Practice · MMA Technology Practice · September 2026

Market Trends

Direct Liquid Cooling Becomes the Default Design Choice

Facility operators are specifying direct-to-chip and immersion liquid cooling for new AI hall conversions rather than treating it as an optional upgrade, since air cooling simply cannot handle current accelerator thermal density at rack scale under sustained full-load conditions across a typical operating day at most facilities. Roughly 26% of new deployments now use direct liquid cooling, up sharply from a low single-digit share just three years ago, and supplier order backlogs have extended well past twelve months as demand continues outpacing manufacturing capacity across nearly every major hardware category this year.
Market Impact: retrofit project counts rose 34% yearly
On-Site Power Generation Emerges as an Interim Workaround

Grid interconnection delays exceeding four years in major metro markets are pushing hyperscalers toward on-site gas turbines and modular power generation as a bridge until utility capacity actually arrives on schedule and local permitting finally clears completely across the relevant governing jurisdiction and utility service territory. This approach adds meaningful capital cost but lets operators activate committed AI capacity roughly two years sooner than waiting for standard grid approval processes to clear, and several major operators have already announced multi-hundred-megawatt on-site generation commitments tied to specific retrofit projects currently underway nationwide.
Market Impact: government-backed spending grew 41% yearly

Market Opportunities and Growth Drivers

Generative AI Training Demand Outpaces Existing Capacity

Enterprise and hyperscale adoption of generative AI training and inference workloads has outpaced the industry's ability to build new purpose-built capacity quickly enough, forcing operators to retrofit existing halls as the only realistic near-term path to additional compute at meaningful scale within current budget cycles and shareholder expectations. Retrofit project counts rose roughly 34% year over year as operators concluded that waiting three to five years for greenfield facilities to clear permitting was commercially unworkable given competitive pressure from rival cloud providers racing for the same enterprise contracts and government tenders.
Market Impact: adds up to 4 years

Sovereign AI Infrastructure Programs Expand Government Spending

National governments across multiple regions have launched sovereign AI infrastructure programs that fund domestic data center modernization directly, treating compute capacity as a strategic national asset comparable to energy or telecommunications infrastructure in long-term planning terms and annual budget allocation cycles across relevant government ministries, agencies, and sovereign wealth funds worldwide today. Government-backed retrofit spending grew roughly 41% year over year as programs in India, the Gulf states, and the European Union each committed multi-billion-dollar budgets to accelerate domestic AI capacity buildout meaningfully ahead of original private-sector timelines and expectations.
Market Impact: extends install timelines by 6 months

Market Restraints and Challenges

Grid Interconnection Bottlenecks Delay Capacity Activation

The core friction point is that utility grid interconnection queues in the busiest metro markets now stretch past four years, rooted in decades of underinvestment in transmission capacity that predates the current AI demand surge entirely. The commercial impact is direct: operators sit on committed capital and signed customer contracts while waiting for power that regulators simply cannot approve faster under existing review frameworks. Some operators are now pursuing direct power purchase agreements with independent generators and pushing for expedited regulatory review tracks specifically for AI-related load as a mitigation pathway.
Market Impact: liquid cooling now 26% of deployments

Skilled Technician Shortage Limits Liquid Cooling Rollout

The core friction point is a shortage of technicians trained to install and maintain liquid cooling systems, a specialized skill set that traditional data center staffing pipelines never needed to build at scale before this current retrofit wave began. The root cause traces to vocational training programs that have not yet caught up with the pace of technology change underway across the industry. Several suppliers have responded by launching in-house certification programs and partnering directly with technical colleges to expand the available labor pool faster than market demand alone would justify.
Market Impact: cuts activation delay by 2 years
4 additional market trends, 4 additional growth drivers, and 3 additional restraints and challenges are covered in the full report. Contact sales@marketmindsadvisory.com to access the complete intelligence.

Segment CAGR and Growth Architecture

Data center transformation spans hardware, software, and services organized by conversion technology rather than by end customer type, since retrofit projects combine cooling, power, and monitoring investments regardless of who owns the underlying facility, from hyperscalers to independent colocation providers and enterprise operators managing their own captive halls across every major metro market worldwide.
data-center-transformation-market-market-share-analysis-1789993697745

Liquid Cooling and Thermal Management Retrofits

Liquid cooling and thermal management retrofits are converting existing air-cooled halls into direct-to-chip and immersion-capable facilities able to handle current accelerator thermal loads that legacy systems simply cannot dissipate fast enough under sustained load conditions across a typical operating cycle. Demand is concentrated among hyperscalers converting flagship training clusters first, with colocation providers following roughly twelve to eighteen months behind as they secure capital and technician capacity for their own conversion programs across their broader facility portfolios nationwide. Growth here runs meaningfully ahead of the broader market as accelerator density continues climbing generation over generation, with no sign of the pace slowing before the next major hardware refresh cycle arrives.
CAGR 18.2%

Power Distribution and Electrical Infrastructure Upgrades

Power distribution and electrical infrastructure upgrades cover switchgear, busway, and backup power systems resized for AI hall power densities several multiples above what conventional server rows ever required historically at comparable operating scale and utilization levels seen in prior facility generations built a decade ago. Utilities and equipment vendors are working directly with operators on phased upgrade schedules that avoid full facility shutdowns during conversion, a constraint that shapes project sequencing across nearly every retrofit underway today across the broader industry and its major equipment suppliers worldwide. Vendors with modular, field-upgradeable equipment designs are capturing outsized share as operators prioritize installation speed over deep customization in the current supply-constrained environment.
CAGR 15.6%
Full segment breakdown across 7 segments available in the complete report.

Regional Architecture and Country Demand Map

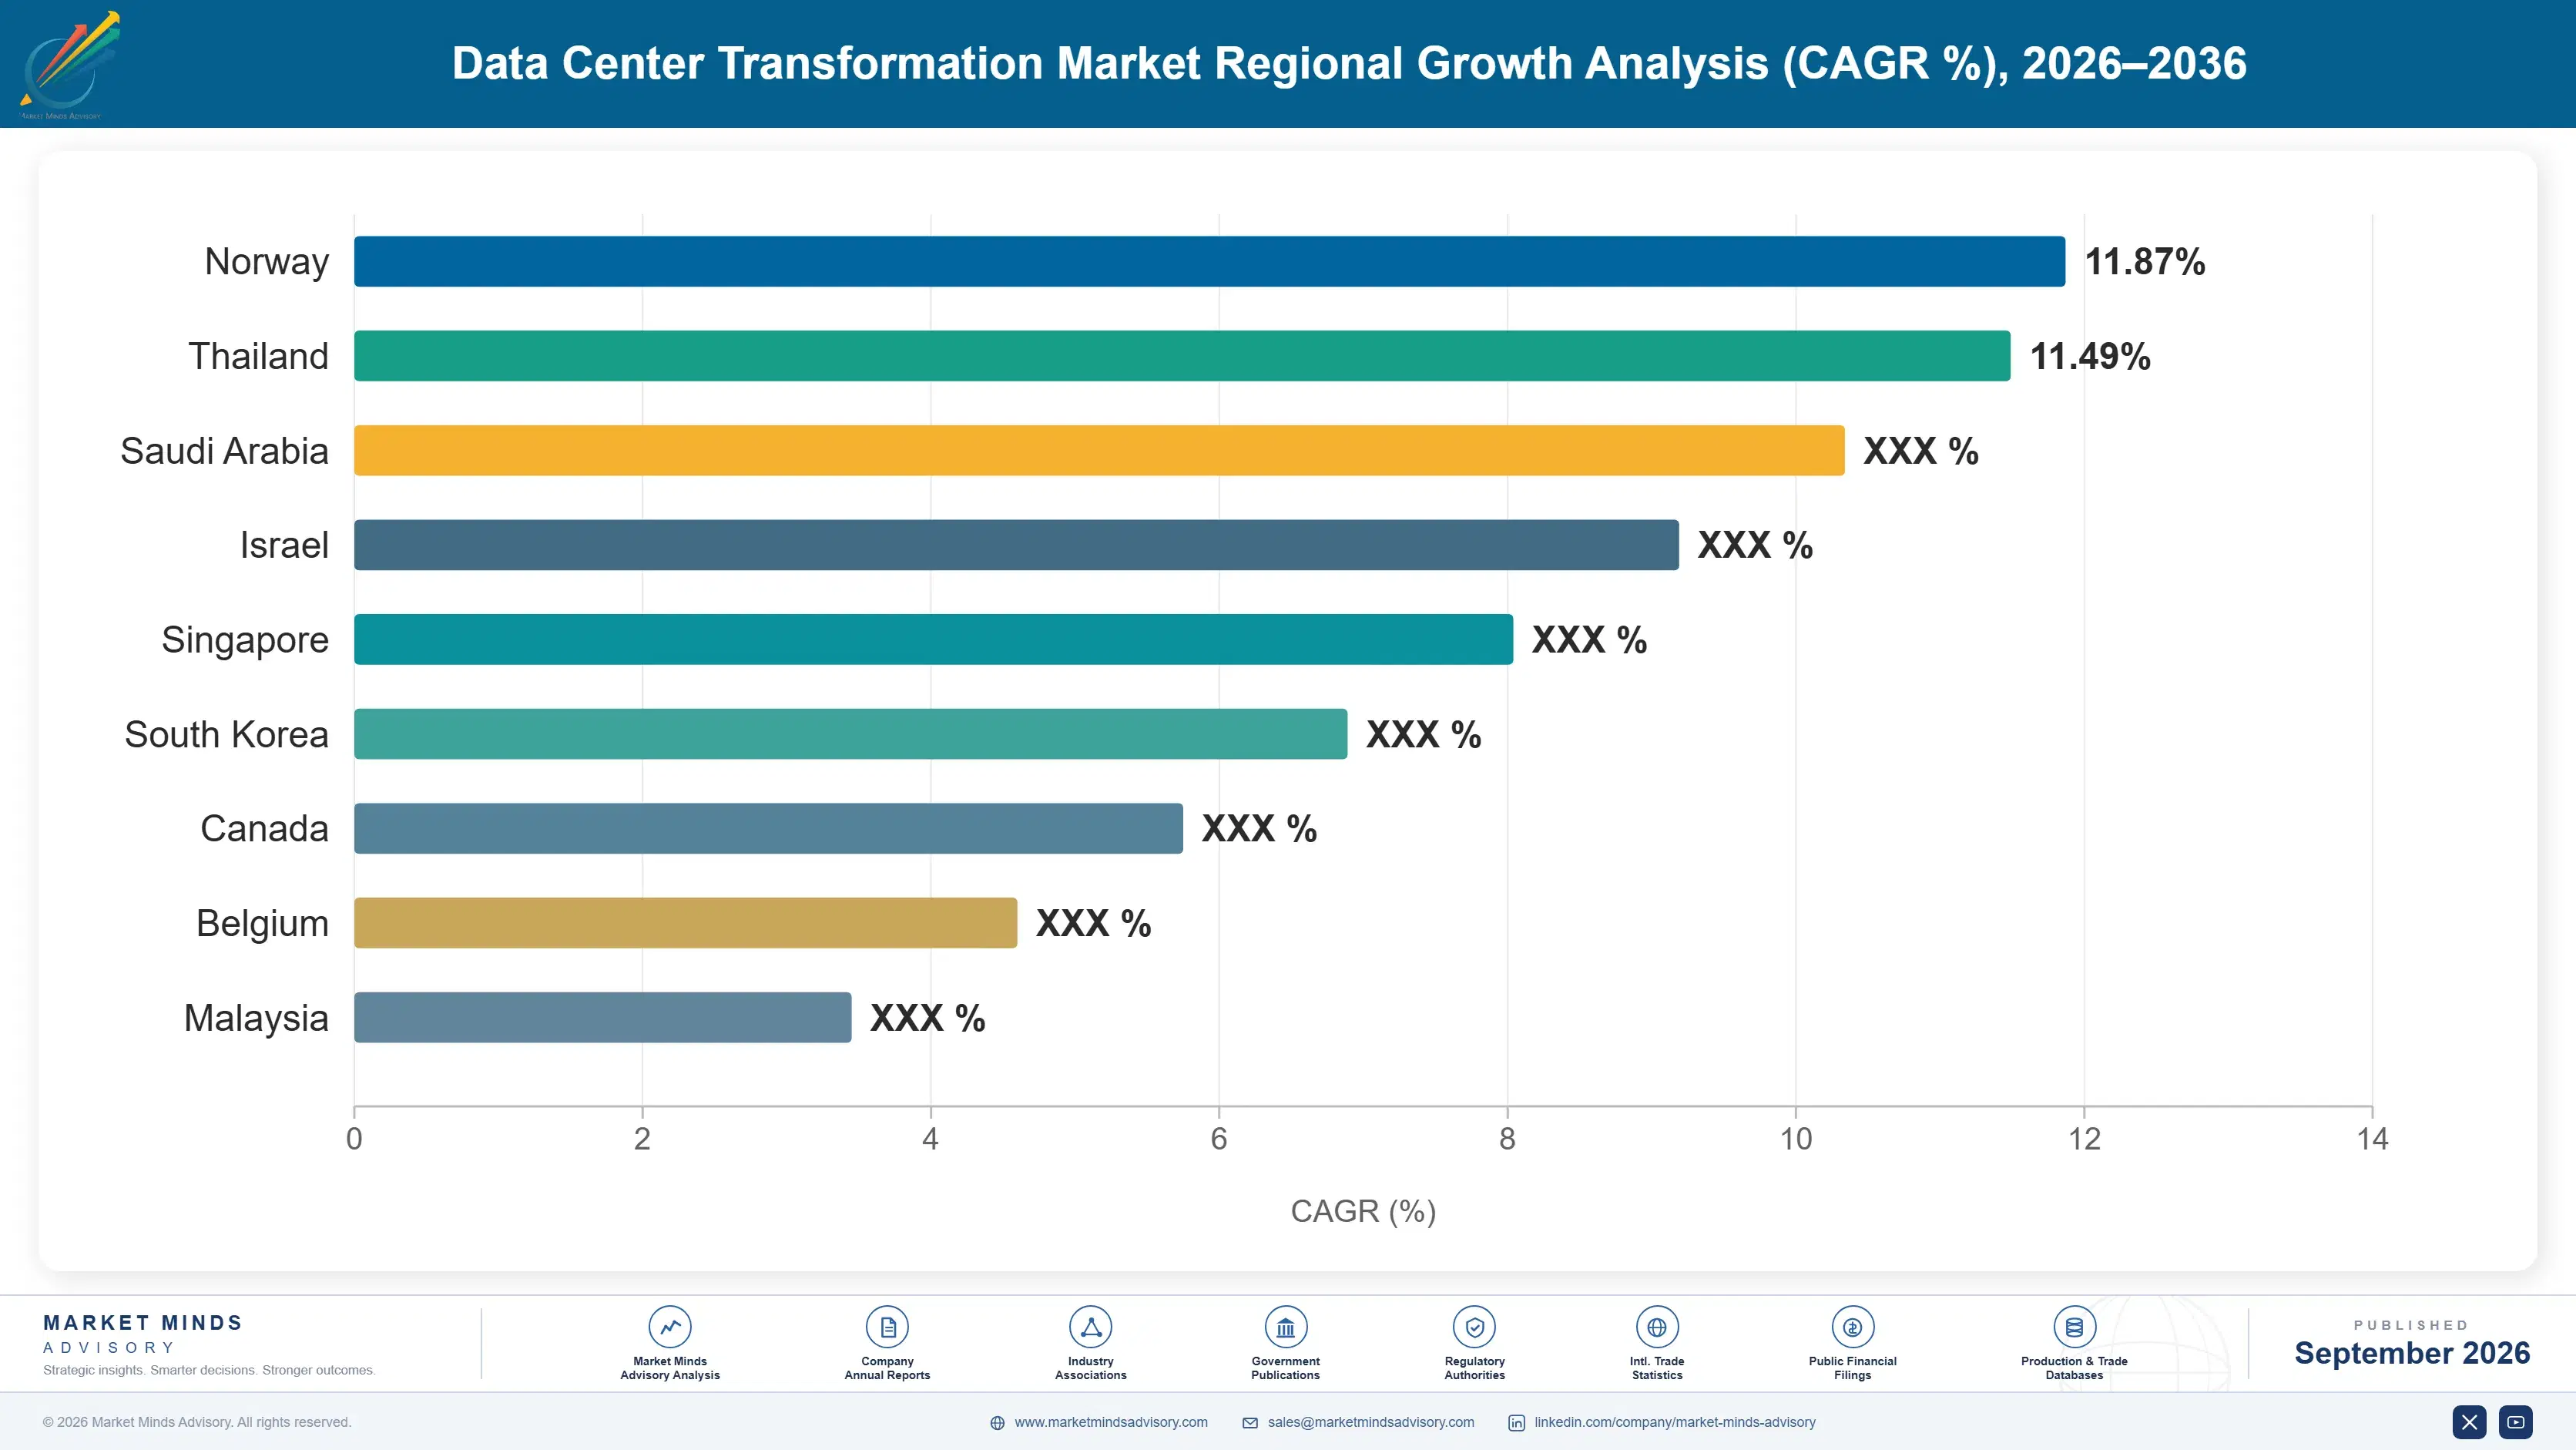
Retrofit demand concentrates where existing hyperscale footprints and grid capacity intersect, favoring the United States, followed closely by East Asian and South Asian markets racing to build sovereign AI infrastructure at a broadly comparable pace across their major metro corridors and secondary technology hubs nationwide.

North America

The United States accounts for the overwhelming majority of North American retrofit spending, driven by hyperscaler concentration in Virginia, Texas, and the Pacific Northwest where existing halls are being converted faster than new construction can clear permitting. Canada contributes a smaller but growing share as operators seek cooler climates and available grid capacity outside saturated American metro markets, particularly around Quebec's hydroelectric power base. Order backlogs at major liquid cooling suppliers here now stretch past a year, and several utilities have introduced dedicated interconnection tracks specifically for data center retrofit projects to accelerate approval timelines meaningfully. Mexico's northern border states are beginning to attract spillover retrofit investment as operators seek lower costs.
Share: 31% | CAGR: 12.6% (2026 to 2036)

Western Europe

Germany and the United Kingdom lead European retrofit activity, though stricter grid capacity constraints and higher industrial electricity prices are slowing conversion pace relative to North America considerably. Ireland's existing hyperscale cluster faces particular pressure since national grid operators have paused new data center connections in several regions, forcing operators there to prioritize efficiency retrofits over capacity expansion for the foreseeable future. The Nordic countries are capturing disproportionate new investment given renewable power availability and comparatively fast permitting processes for qualifying facilities across Sweden and Finland. France's nuclear-heavy grid is drawing renewed operator interest as a comparatively stable and lower-carbon power source for future retrofit projects across the country. Retrofit intensity there keeps climbing steadily.
Share: 20% | CAGR: 9.8% (2026 to 2036)
Regional intelligence for 5 additional markets available in the complete report: East Asia, South Asia and Pacific, Latin America, Middle East and Africa, Eastern Europe. Contact sales@marketmindsadvisory.com.
data-center-transformation-market-country-cagr-analysis-1789993698260

Where Retrofit Suppliers Capture More Value

Suppliers capture disproportionate margin at the intersection of speed and documentation: operators pay a premium for faster installation timelines and for outcome data that justifies retrofit budgets to skeptical finance committees reviewing capital requests under intense internal scrutiny and competing priorities across every major facility conversion program currently underway during this particular budget cycle.

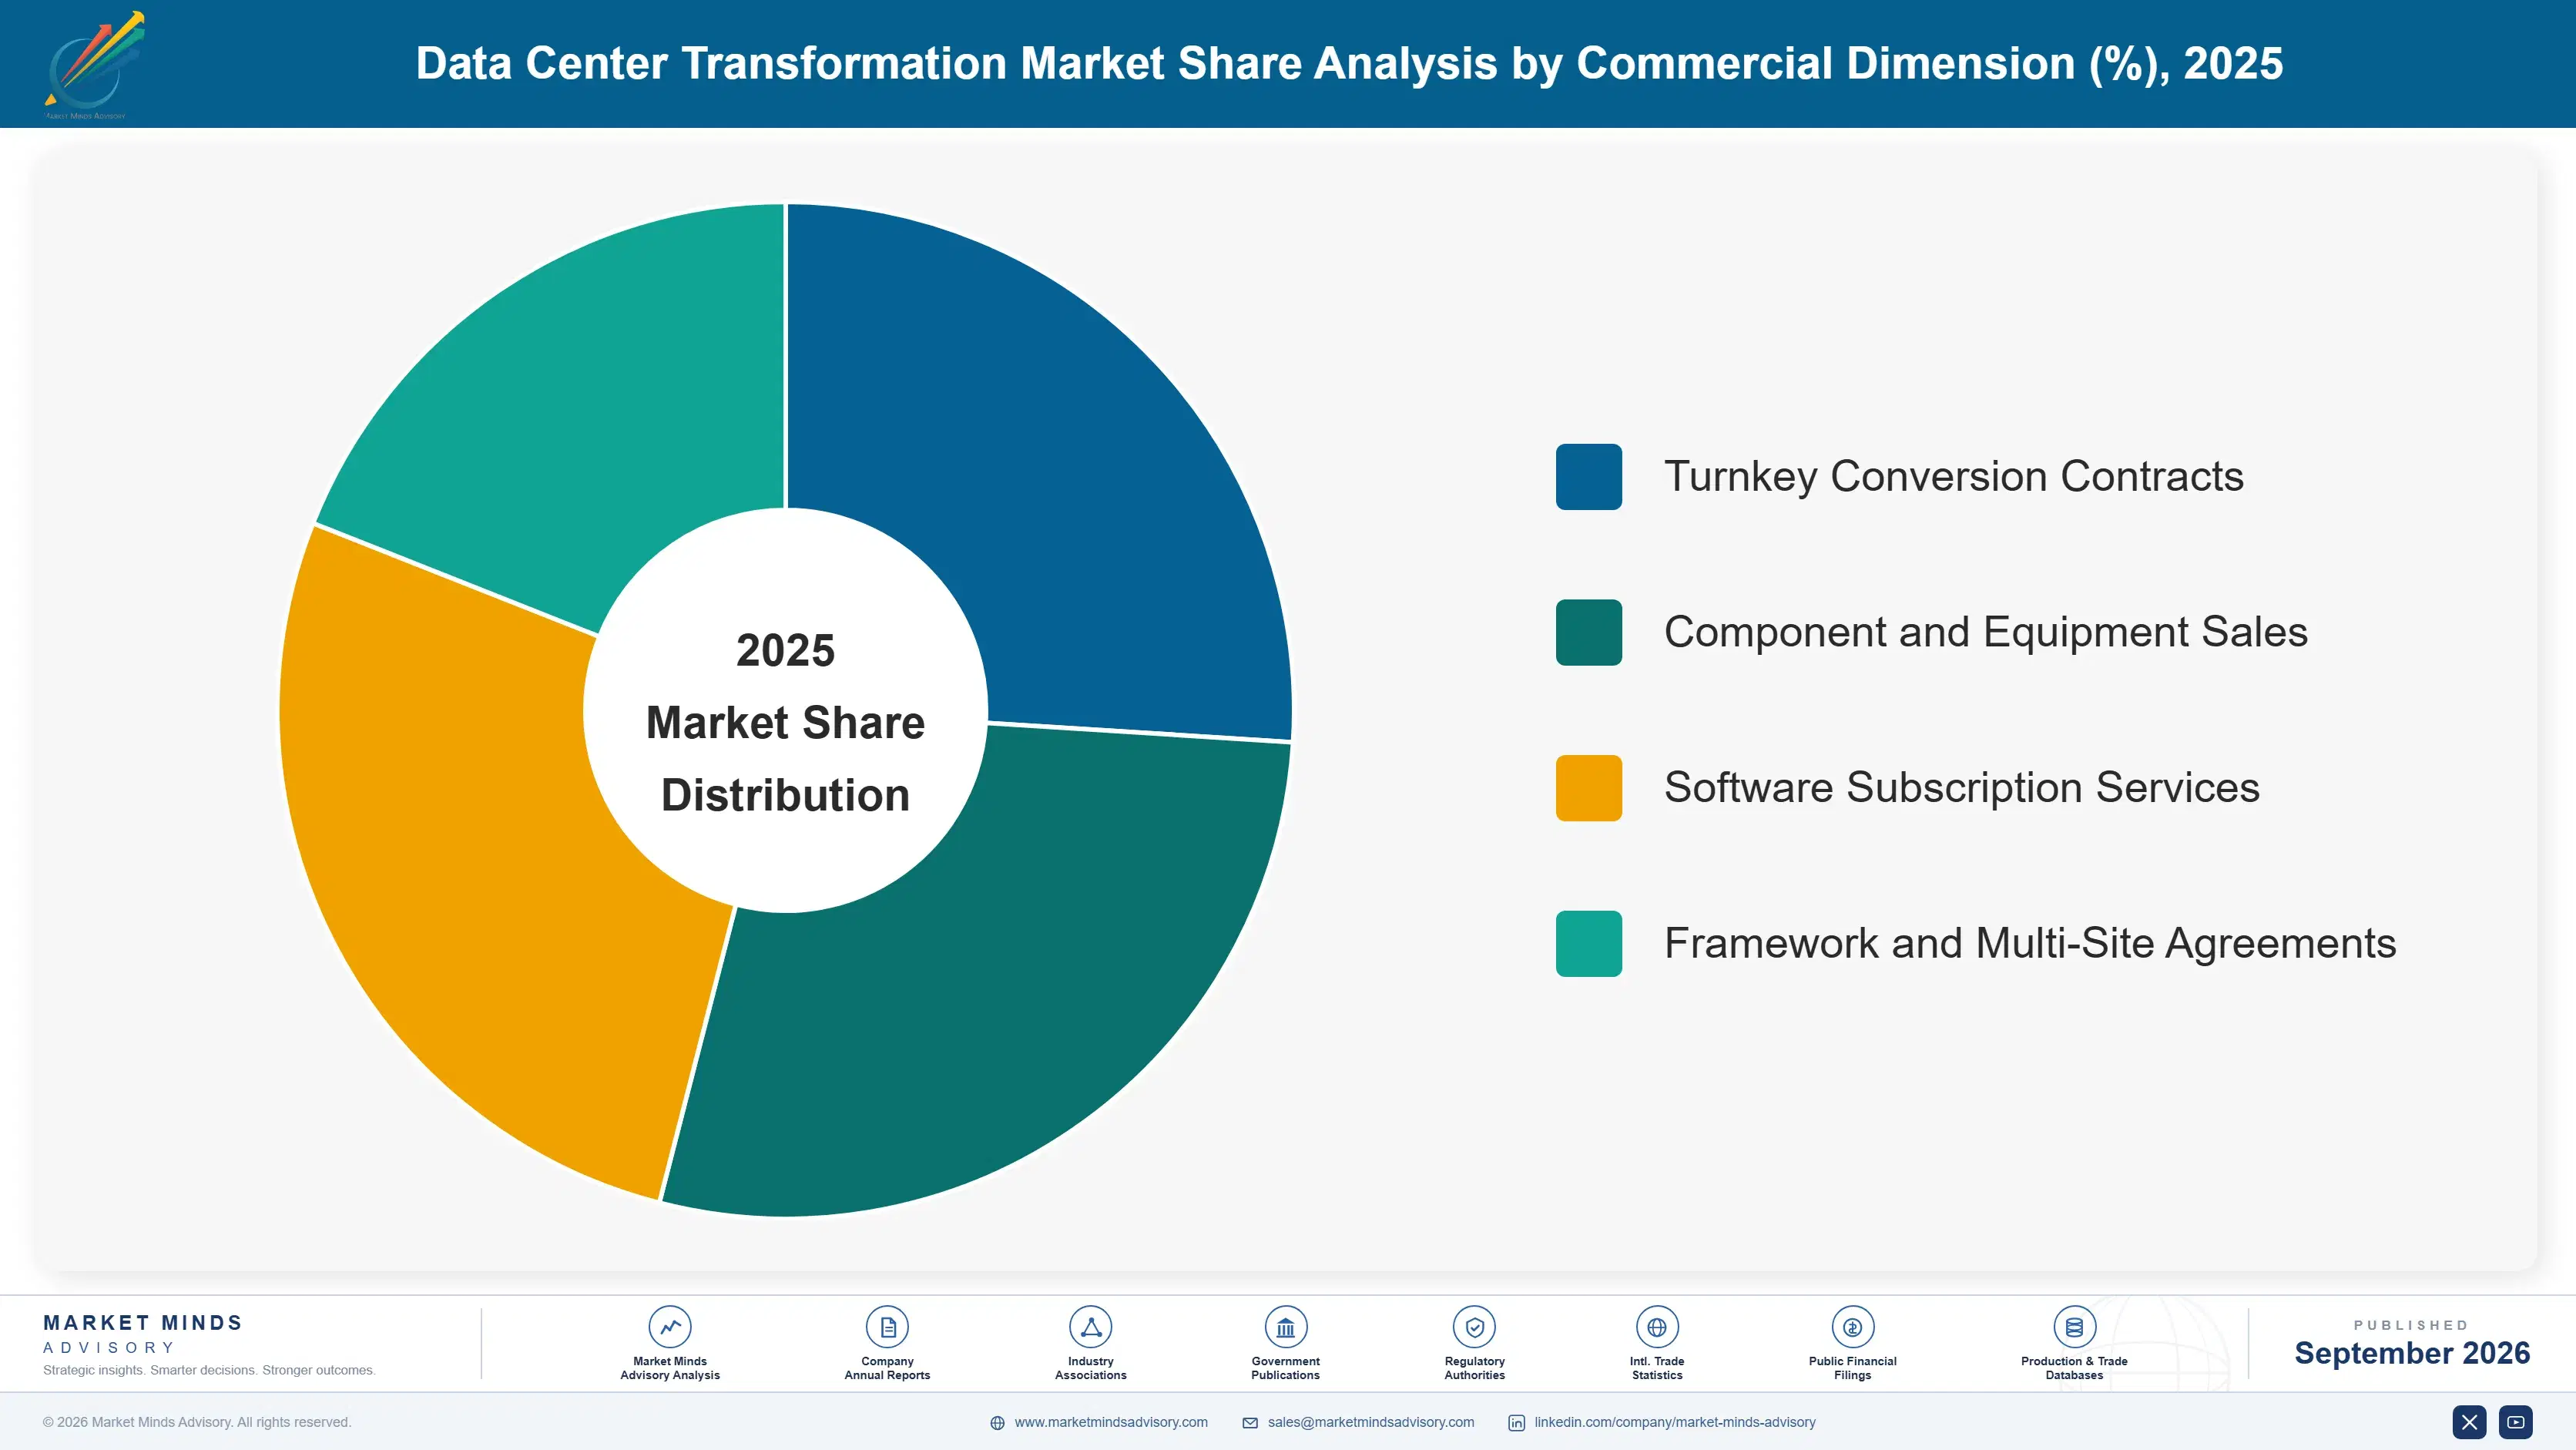
Turnkey Conversion Program Bundling Services Offering

Suppliers that bundle cooling hardware, installation labor, and commissioning into a single turnkey package are winning larger contracts than component-only vendors, since facility operators increasingly prefer one accountable party over coordinating multiple subcontractors under tight deadlines and shifting project schedules. Turnkey programs now command roughly 28% higher contract value than component sales alone, and lead times for bundled programs run measurably shorter since a single vendor controls scheduling across every phase of the conversion from design through commissioning. Several leading suppliers have restructured their sales organizations around this bundled model, phasing out standalone component teams almost entirely.
Market Impact: turnkey contracts now command roughly 28% more value

Predictive Maintenance Software Subscription Programs Overall

Hardware vendors are attaching predictive maintenance software subscriptions to cooling and power equipment sales, generating recurring revenue that extends well beyond the initial installation contract and original purchase order. Subscription attach rates have reached roughly 34% among large enterprise deployments, and the resulting recurring revenue stream carries meaningfully higher margin than the underlying hardware sale itself, giving suppliers a durable reason to maintain the customer relationship long after installation completes and warranties expire. Vendors increasingly treat this recurring software layer as the strategic core of their business rather than a secondary add-on to hardware sales, reallocating engineering investment accordingly.
Market Impact: software subscriptions now attach at roughly 34% rate

Emergency Expedited Delivery Premium Pricing Programs

Suppliers offering expedited delivery for cooling and power equipment outside standard lead times are capturing meaningful price premiums from operators facing contractual deadlines with AI customers who will not tolerate delay of any kind. Expedited orders now carry roughly 22% pricing premiums over standard lead-time orders, and several suppliers have built dedicated expedited production lines specifically to capture this segment of urgent, less price-sensitive demand growing across the industry. This premium pricing structure has proven durable even as overall component supply gradually loosens, since the underlying urgency driving customer demand shows no sign of easing meaningfully.
Market Impact: expedited orders now carry roughly 22% price premiums

Multi-Site Framework Agreement Consolidation Programs Overall

Suppliers that negotiate multi-site framework agreements with hyperscalers operating dozens of facilities are securing considerably larger and more predictable revenue streams than single-project vendors competing project by project for each new contract. These framework agreements increase average contract value by roughly 45% relative to comparable one-off projects, and they give suppliers meaningfully better visibility into future component demand, allowing more efficient production planning across their global manufacturing base. Suppliers without the balance sheet to support multi-year framework commitments increasingly find themselves excluded from the largest hyperscaler procurement processes entirely. That exclusion compounds over successive procurement cycles.
Market Impact: framework agreements now add roughly 45% more value

Who Controls the Margin Pool

The Data Center Transformation Market is moderately concentrated, with a CR5 of 38% reflecting revenue among the top five suppliers of cooling and power conversion equipment. Vertiv holds a clear lead as the largest integrated thermal management vendor, while the gap between it and mid-tier challengers like Rittal has widened as scale advantages in manufacturing capacity compound during this period of sustained order backlogs.
Current competitive activity centers on capacity expansion and vertical integration rather than pricing, since demand exceeds available supply across nearly every major product category. Leading suppliers are acquiring smaller specialized cooling technology firms to secure engineering talent and intellectual property faster than internal development would allow, while simultaneously investing heavily in domestic manufacturing capacity to reduce exposure to import tariffs and shipping delays.

Emerging pressure is coming from specialized liquid cooling startups that lack the balance sheet of incumbents but move faster on newer immersion cooling technologies that established vendors have been slower to commercialize at scale. Rankings could shift meaningfully over the next several years if any startup secures a large hyperscaler design win, since that kind of reference customer tends to accelerate enterprise adoption considerably faster than marketing spend alone ever could.
data-center-transformation-market-company-positioning-matrix-1789993698790

Competitive Moat and Risk Dimensions

VERTIV

Moat: Integrated Thermal Management Portfolio

Vertiv offers a full stack of cooling, power, and monitoring products under one brand, letting it win turnkey conversion contracts that component-only competitors cannot bid on as a single accountable vendor. This integration advantage compounds as operators increasingly prefer bundled solutions over managing multiple vendor relationships across a single retrofit project.
VERTIV

Risk: Premium Pricing Vulnerability Exposure

Vertiv's integrated offering commands premium pricing that leaves room for lower-cost component specialists to undercut it on individual product lines across several categories. If operators begin unbundling purchases to capture savings during any broader demand slowdown, Vertiv's blended margin advantage could compress meaningfully faster than most analysts currently expect.
SCHNEIDER ELECTRIC

Moat: Deep Utility Relationship Network

Schneider Electric's decades of power distribution relationships with utilities give it faster interconnection support and regulatory navigation than newer entrants can replicate quickly. That network advantage matters considerably more now that grid bottlenecks, not capital, are the binding constraint on project timelines across most major markets.
SCHNEIDER ELECTRIC

Risk: Slower Liquid Cooling Pivot

Schneider Electric's legacy strength in power distribution has come with a comparatively slower pivot into direct liquid cooling relative to thermal management specialists, risking meaningful share loss in the fastest-growing segment of the market. Catching up requires either acquisition or a multi-year internal investment cycle that competitors have already begun.

Players Tracked

Prominent Players

Vertiv
Schneider Electric
Eaton
Johnson Controls
Rittal

Other Key Players

nVent
STULZ
Trane Technologies
Legrand
ABB
Munters
Airedale International
CoolIT Systems
Motivair
LiquidStack
Asetek
Chilldyne
Delta Electronics
Sungrow
Huawei Digital Power

Recent Developments

FEBRUARY 2026

Vertiv acquired a privately held immersion cooling technology firm to accelerate its direct liquid cooling roadmap for next-generation AI accelerator racks facing rising thermal loads. The acquisition brings proprietary dielectric fluid formulations and an engineering team with several years of immersion deployment experience across hyperscale customer sites worldwide.
Signal: Signals Vertiv is filling an immersion cooling technology gap through acquisition rather than slower internal development timelines.
OCTOBER 2025

Schneider Electric signed a multi-year supply agreement with a major North American hyperscaler to provide power distribution equipment across a dedicated retrofit program spanning multiple existing facility campuses nationwide over several years. The agreement includes committed manufacturing capacity reserved specifically for the customer's ongoing conversion schedule.
Signal: Signals hyperscalers are locking in supplier capacity years ahead of need given persistent component shortages industry-wide.
JUNE 2025

Eaton expanded its domestic switchgear manufacturing capacity through an organic facility expansion in Texas aimed at reducing lead times for data center retrofit customers facing mounting delivery pressure across the country. The expansion adds meaningful annual production capacity once fully operational sometime early next year.
Signal: Signals suppliers are prioritizing domestic capacity investment over offshore manufacturing given current tariff exposure risk today.

Component Sourcing and Power Cost Exposure

Copper, aluminum, and specialty dielectric fluids together represent roughly 34% of cooling equipment cost of goods sold, with copper sourced primarily from Chile and Peru while dielectric fluid formulations depend heavily on a small number of specialty chemical producers concentrated in the United States and Germany's industrial heartland. Aluminum for busway and enclosure fabrication adds a further layer of exposure to global commodity price swings.
Copper prices rose sharply through 2025 as data center retrofit demand competed directly with electric vehicle and grid infrastructure buyers for the same constrained global supply, according to the IEA's 2025 Electricity Report. Several suppliers reported meaningful gross margin compression in quarterly filings tied directly to unhedged copper exposure during that period of sustained price volatility, with some citing double-digit percentage cost increases on major switchgear product lines.

Smaller regional suppliers lacking long-term copper hedging arrangements face a genuine competitive disadvantage against larger vendors like Vertiv and Eaton, which can absorb volatility through scale purchasing agreements and vertically integrated component production. This exposure varies considerably by geography too, since suppliers manufacturing primarily in North America face additional tariff-driven cost pressure that Asian-based competitors increasingly do not.
data-center-transformation-market-cost-volatility-analysis-1789993698986

Diversified Multi-Region Copper Sourcing Agreements

Leading suppliers are diversifying copper procurement across Chile, Peru, and domestic North American recycling streams to reduce dependence on any single mining region during periods of price volatility. This approach has measurably reduced input cost variance for suppliers with the purchasing scale to negotiate multi-region contracts directly with mine operators. Recycled copper now supplies a growing share of total volume.

Long-Term Copper Price Hedging Contracts

Larger suppliers are locking in copper prices through multi-year forward contracts with commodity trading desks, insulating quarterly margins from short-term volatility that smaller competitors lacking this leverage cannot access as easily. These hedges typically cover twelve to twenty-four months of forward production volume across major product lines and customer commitments. Several vendors are extending hedge durations further still.

Domestic Dielectric Fluid Manufacturing Investment

Several cooling equipment vendors are investing in domestic dielectric fluid production capacity to reduce reliance on a concentrated group of specialty chemical suppliers overseas. This investment reduces lead time risk considerably, though it requires meaningful upfront capital that smaller vendors often cannot justify internally without external financing support. Government incentive programs are offsetting some of that cost.

Portfolio Architecture for Margin Defence

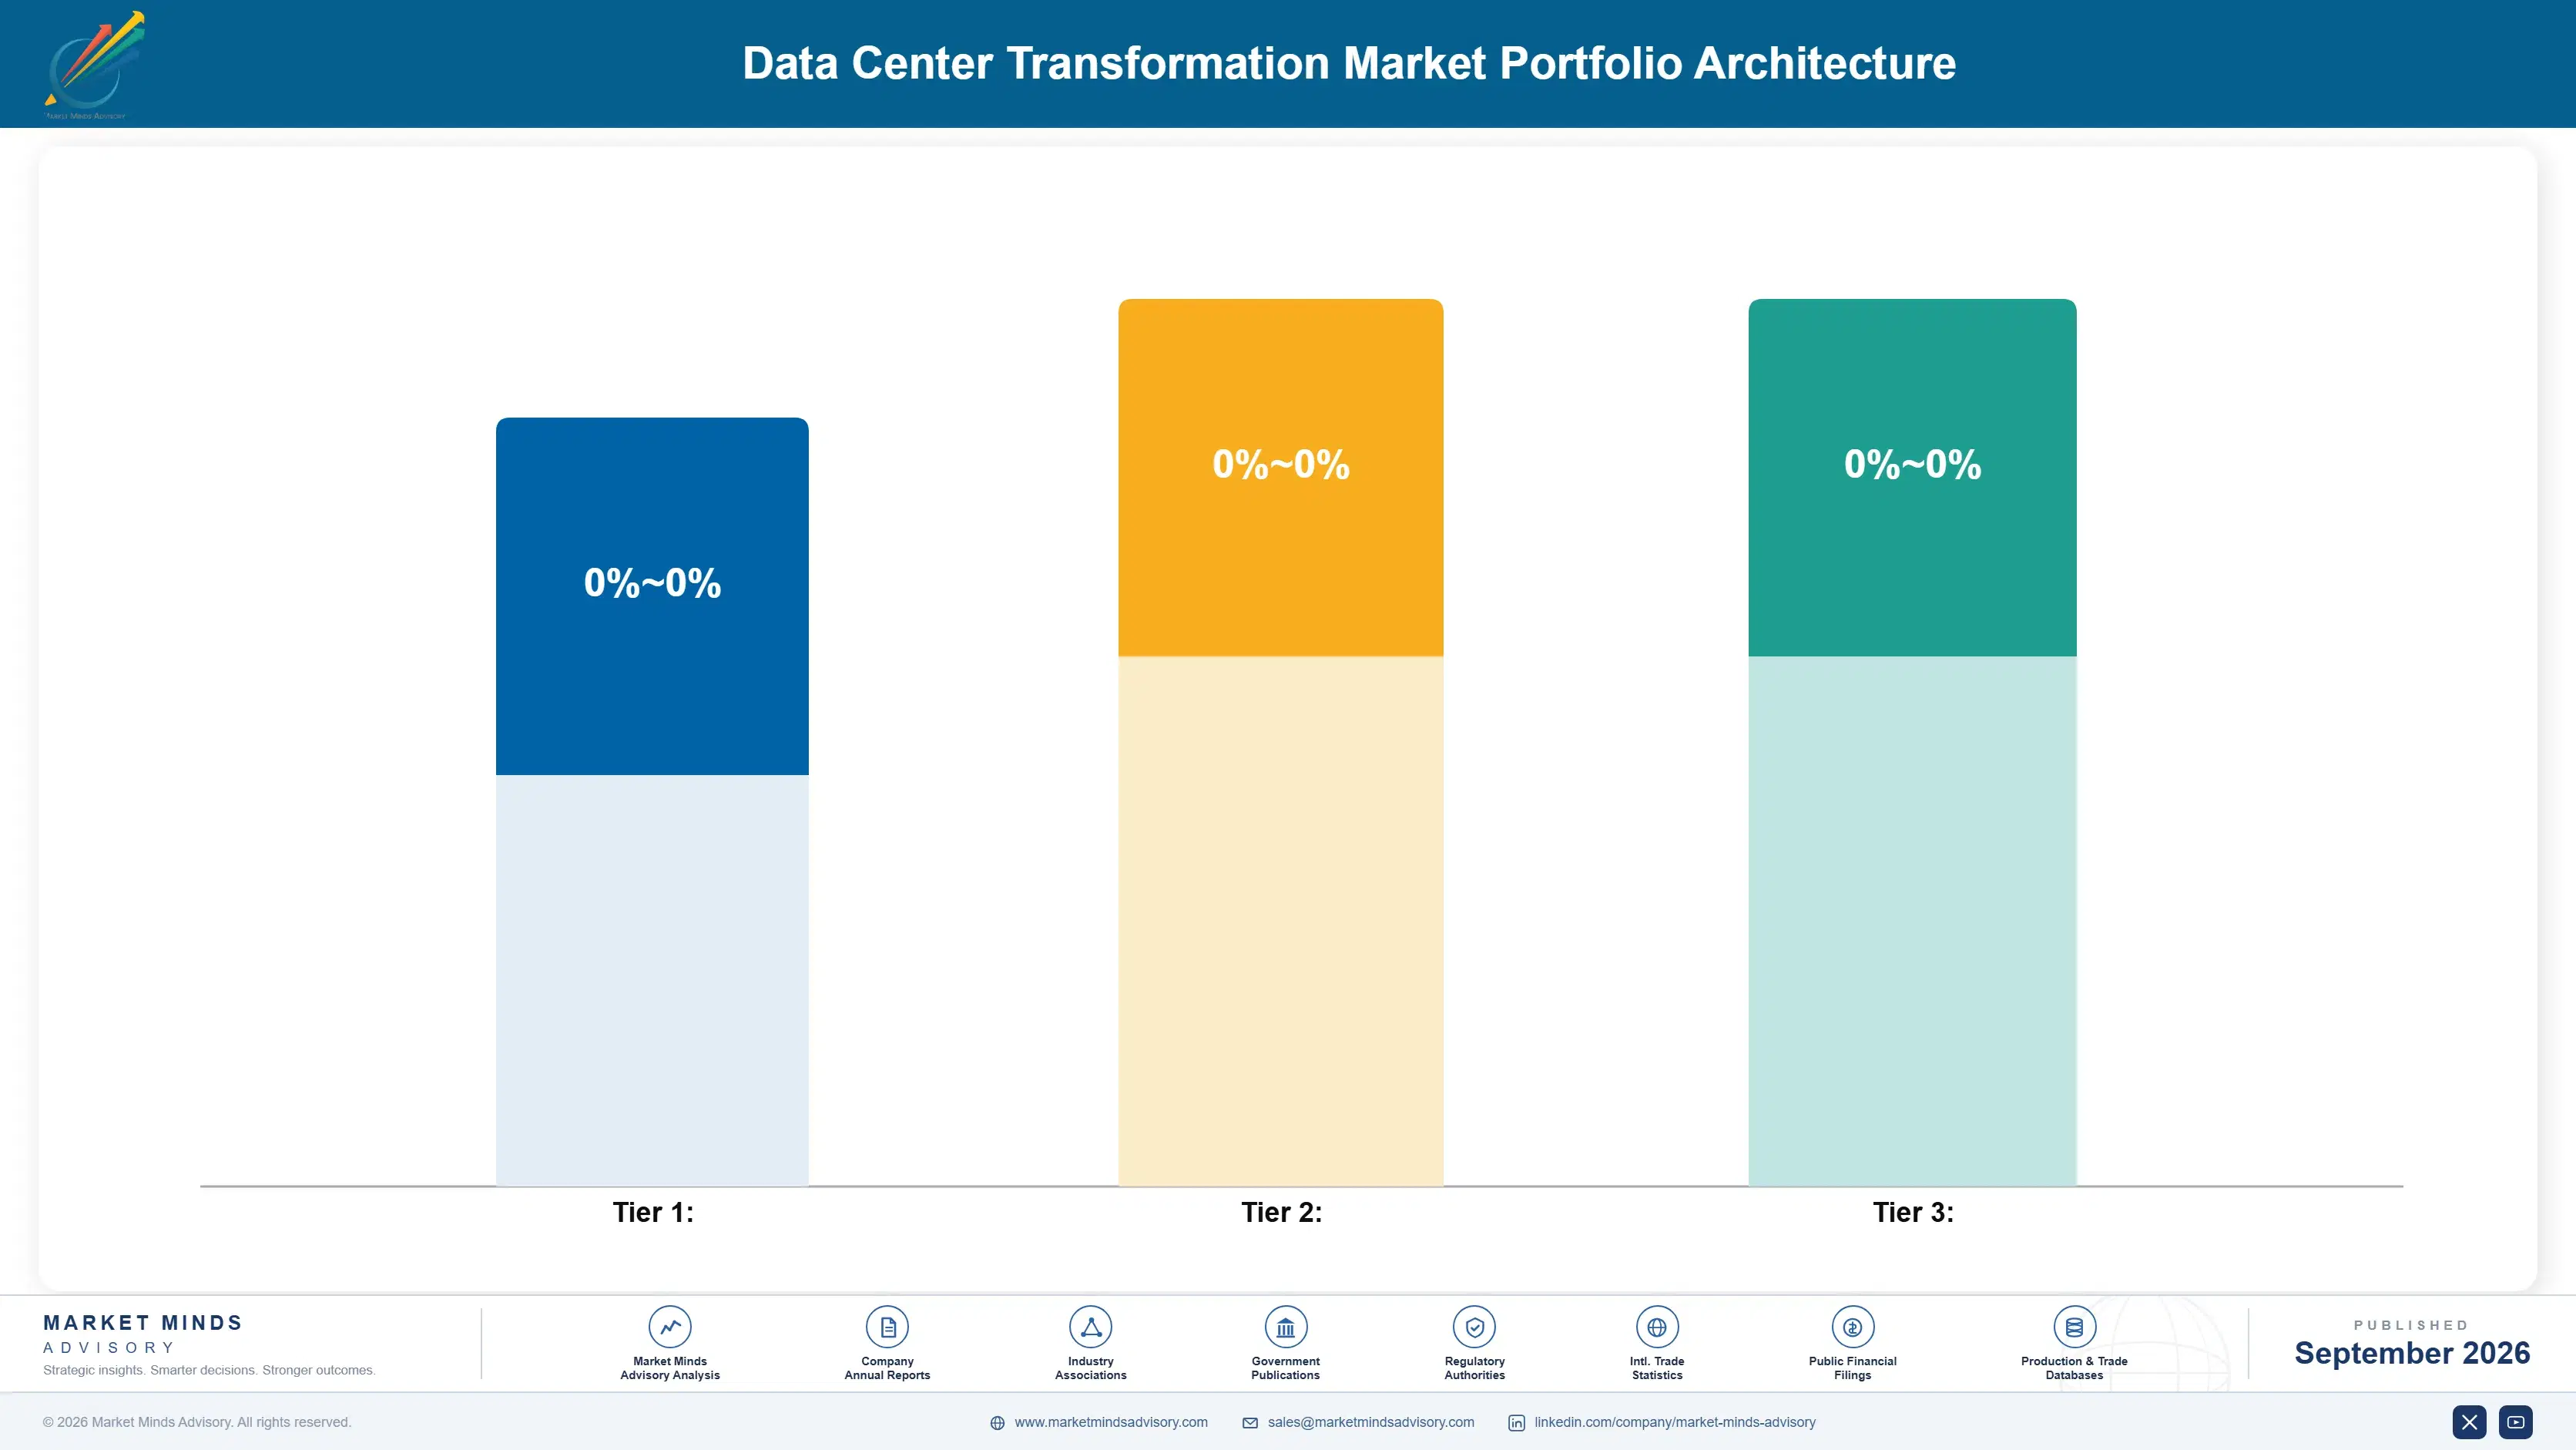
Retrofit economics split sharply between volume switchgear and enclosure products with mid-teens gross margins and premium liquid cooling systems commanding margins well above thirty percent given their engineering complexity and current supply constraints across nearly every product category tracked. That gap is widening rather than narrowing as accelerator density climbs generation over generation. Suppliers unable to differentiate beyond commodity pricing face persistently lower long-term returns.
The tension between volume and premium runs through nearly every supplier's product roadmap right now, since capital-constrained customers still need standard power distribution equipment even as the fastest-growing revenue pool sits squarely in specialized cooling technology and adjacent software. Vendors that chase volume exclusively risk ceding the higher-margin segment entirely to focused specialists moving faster on innovation. That risk compounds each year the retrofit cycle continues.

High-value pools concentrate around immersion cooling, predictive maintenance software, and expedited delivery services, all of which carry meaningfully better margins than commodity hardware sales across the broader category. Suppliers positioning early in these pools are capturing outsized profitability relative to their revenue share, a pattern MMA expects to persist through the current retrofit cycle and likely beyond it.

Standard switchgear, busway, and enclosure products sold largely on price and delivery lead time, carrying gross margins in the mid-teens to low twenties percent range across most vendors and geographies served today.
Gross Margin

Direct liquid cooling and immersion systems engineered for high-density AI racks, commanding gross margins above thirty percent given specialized engineering requirements and constrained supplier manufacturing capacity across the industry currently.
Gross Margin

Predictive maintenance software, energy efficiency monitoring, and emerging two-phase cooling technologies carrying the highest margins in the category but still limited deployment scale relative to established hardware product lines overall.
Gross Margin
data-center-transformation-market-portfolio-architecture-1789993699487

High-value Sub-segments and Strategic Watch-out

Liquid Cooling and Thermal Management Retrofits

High-value, high-growth segment where demand consistently outpaces manufacturing capacity, commanding premium pricing and the fastest revenue growth of any category tracked in this report by a considerable and widening margin over rivals. Supplier order backlogs extend well past a full year currently. Capacity remains the binding constraint on growth.

Power Distribution and Electrical Infrastructure Upgrades

High-value, moderate-growth segment benefiting from steady utility-driven upgrade cycles and long-term framework agreements, though growth trails liquid cooling given comparatively less severe capacity constraints across most regional markets. Utility partnerships increasingly determine which suppliers win here. Framework agreement duration is becoming the primary competitive battleground now.

Standard Rack and Enclosure Hardware

Volume core segment generating steady, predictable revenue across nearly every retrofit project regardless of which cooling technology gets chosen, though margins remain considerably compressed relative to more specialized product categories overall. Consolidation among smaller vendors here appears increasingly likely. Scale remains the only reliable defense against further margin compression.

Facility Management and Monitoring Software

Strategic watch-out segment where software vendors are attempting to capture recurring revenue historically owned by hardware suppliers, a shift that could meaningfully reshape margin distribution across the value chain over coming years. That growing convergence clearly favors vendors already offering both capabilities. Hardware margins face pressure as a result.

Retrofits as a Recurring Capital Cycle

Data center retrofit relationships behave like recurring capital annuities rather than one-time projects, since accelerator generations cycle roughly every eighteen months and each cycle triggers renewed cooling and power capacity assessments. Suppliers embedded in a facility's monitoring software and maintenance contracts capture a disproportionate share of each successive upgrade cycle, since switching costs compound with every additional integration point added over time. That dynamic keeps recurring revenue flowing well beyond initial installation.
Adoption depth varies meaningfully by end-use vertical. Hyperscalers show the deepest platform dependency, since their scale justifies custom engineering partnerships that smaller operators cannot replicate, while colocation providers adopt more cautiously given tighter capital constraints and shorter planning horizons tied to tenant lease terms. Enterprise-owned facilities lag furthest behind, often waiting for proven reference deployments before committing capital. Government-funded sovereign facilities fall somewhere between these two extremes.

Buyer profiles are shifting generationally as facilities engineers who managed conventional air-cooled halls give way to a cohort trained specifically on liquid cooling and high-density power systems from early in their careers. That newer generation increasingly evaluates suppliers on software integration and predictive maintenance capability rather than hardware specifications alone, reshaping which vendors win renewal negotiations.
data-center-transformation-market-end-use-penetration-index-1789993699975

Where MMA Sees the Advantage

These are among the four positions where our research anticipates prominent divergence between winners and laggards over the coming forecast period. Each is grounded in the demand model, the regulatory perimeter, and the announced capacity pipeline.
01 / TURNKEY BUNDLING INVESTMENT

Build integrated cooling and power bundles before rivals catch up

Suppliers that invest early in turnkey bundled offerings hold a durable edge as operators increasingly prefer one accountable vendor over coordinating multiple subcontractors under tight retrofit deadlines and shifting schedules. This capability is genuinely difficult to build quickly, which is exactly why component-only vendors are steadily losing larger contracts to bundled competitors today. MMA expects this gap to widen considerably further before it narrows meaningfully, rewarding suppliers willing to invest in integration capability now rather than waiting until much later.
02 / RECURRING SOFTWARE ATTACHMENT

Attach predictive maintenance software to every hardware sale

Predictive maintenance software subscriptions carry meaningfully higher margin than the hardware sales they attach to, and attach rates are still well below what mature markets eventually reach once customers recognize the value clearly across their fleet. That gap represents real margin being left on the table by suppliers still treating software as a secondary afterthought rather than a core revenue stream today. MMA sees considerable room for suppliers who formalize this attachment into a standard part of every deal going forward.
03 / MULTI-SITE FRAMEWORK EXPANSION

Pursue framework agreements with the largest hyperscale operators

Hyperscalers operating dozens of facilities represent the highest-value expansion opportunity in the entire category, since few competitors have built genuinely convincing multi-site delivery consistency at truly meaningful scale today across every region they currently serve worldwide and beyond. This complexity is exactly why framework agreements command considerably higher contract values than single-project arrangements ever could achieve on their own. MMA sees this segment as considerably underserved relative to its genuine commercial value going forward, and expects competition to intensify quite markedly.
04 / GRID DELAY RISK EXPOSURE

Watch grid interconnection delays stall committed retrofit capital

Grid interconnection delays stretching past four years in major metro markets pose the clearest risk to suppliers that assumed faster capacity activation when pricing their current retrofit contracts and customer commitments made earlier this cycle. Suppliers overexposed to markets with the worst permitting backlogs risk revenue recognition delays that could meaningfully compress near-term growth even as underlying demand remains genuinely strong across the broader category. MMA expects this risk to persist rather than resolve quickly across most major regional grids.

Engagement Snapshot From the Field

A live engagement with an industry participant carrying material or product regulatory and market exposure ahead of a defining policy shift, showing how our research translates into a defensible multi-year portfolio strategy.
MARKET MINDS ADVISORY · CLIENT ENGAGEMENT SUMMARY
Data Center Transformation Producer Strategic Portfolio Review and Transition Roadmap 2026·Investment Scenario on Data Center Transformation Exposure Evaluation 2025-26
CLIENT PROFILE
The client operates a top-tier hyperscale cloud platform with over forty existing data center campuses across North America and Europe, several built more than a decade ago for conventional server workloads well below current AI accelerator density requirements. Facing surging enterprise demand for AI training capacity and multi-year waits for new construction, leadership sought an independent assessment of which existing campuses could be retrofitted fastest and at the lowest cost.
STRATEGIC CHALLENGE
The client's internal facilities team lacked a consistent framework for prioritizing which of forty campuses to retrofit first, since each site carried different grid capacity, structural, and lease constraints that internal teams evaluated inconsistently across regions. Competing internal business units were separately lobbying for their preferred sites, creating political friction that delayed capital allocation decisions by several quarters.
MMA APPROACH
MMA built a standardized scoring framework evaluating each campus on grid interconnection timeline, structural load capacity, and available power headroom, then benchmarked retrofit costs against comparable completed conversions across the client's peer set. The engagement combined facilities engineering interviews, utility filing analysis, and supplier capacity assessments across all forty candidate campuses.
KEY FINDINGS
  1. Eight of forty campuses had sufficient existing grid headroom to support immediate liquid cooling retrofits without requiring new utility interconnection approval, representing the fastest path to added capacity.
  2. Structural floor loading constraints ruled out full retrofit at six older campuses entirely, meaning those sites required either partial conversion or exclusion from the near-term capacity plan altogether.
  3. Retrofit cost per megawatt varied by nearly 40% across candidate campuses depending primarily on existing electrical infrastructure age rather than cooling technology choice, reversing an internal assumption.
  4. Sequencing retrofits by grid readiness rather than by internal political priority reduced the client's average time-to-capacity by an estimated eight months across the first wave of eight campuses selected.
CLIENT PROFILE
The client operates a top-tier hyperscale cloud platform with over forty existing data center campuses across North America and Europe, several built more than a decade ago for conventional server workloads well below current AI accelerator density requirements. Facing surging enterprise demand for AI training capacity and multi-year waits for new construction, leadership sought an independent assessment of which existing campuses could be retrofitted fastest and at the lowest cost.
STRATEGIC CHALLENGE
The client's internal facilities team lacked a consistent framework for prioritizing which of forty campuses to retrofit first, since each site carried different grid capacity, structural, and lease constraints that internal teams evaluated inconsistently across regions. Competing internal business units were separately lobbying for their preferred sites, creating political friction that delayed capital allocation decisions by several quarters.
MMA APPROACH
MMA built a standardized scoring framework evaluating each campus on grid interconnection timeline, structural load capacity, and available power headroom, then benchmarked retrofit costs against comparable completed conversions across the client's peer set. The engagement combined facilities engineering interviews, utility filing analysis, and supplier capacity assessments across all forty candidate campuses.
KEY FINDINGS
  1. Eight of forty campuses had sufficient existing grid headroom to support immediate liquid cooling retrofits without requiring new utility interconnection approval, representing the fastest path to added capacity.
  2. Structural floor loading constraints ruled out full retrofit at six older campuses entirely, meaning those sites required either partial conversion or exclusion from the near-term capacity plan altogether.
  3. Retrofit cost per megawatt varied by nearly 40% across candidate campuses depending primarily on existing electrical infrastructure age rather than cooling technology choice, reversing an internal assumption.
  4. Sequencing retrofits by grid readiness rather than by internal political priority reduced the client's average time-to-capacity by an estimated eight months across the first wave of eight campuses selected.
RECOMMENDED STRATEGY
Phase 1: Phase one retrofits the eight campuses with existing grid headroom, prioritizing sites nearest current enterprise AI customer concentrations for fastest revenue capture. Phase 2: Phase two pursues utility interconnection approval for twelve mid-tier campuses in parallel, using the phase one retrofit data to strengthen regulatory filings submitted. Phase 3: Phase three evaluates the remaining campuses for partial retrofit or eventual decommissioning based on updated structural and grid assessments completed during phases one and two.
OUTCOME
The client approved a $310 million first-wave retrofit budget (client-reported, unverified by MMA) covering the eight priority campuses identified. Internal reporting credited the standardized scoring framework with resolving prior interdepartmental disputes over site prioritization, and the first three retrofitted campuses came online ahead of their original internal schedule.

Frequently Asked Questions

Foundational context covering the market sizes, CAGR, scope, country, region and competition that inform every finding below. This section is provided to cover basics and most often pre-purchase conversations, answered from the MMA Primary Research Dataset.

What is the current size of the Data Center Transformation Market?

The Data Center Transformation Market was valued at approximately $68.0 billion in 2025. That figure covers retrofit hardware, software, and services for existing facilities, excluding new greenfield construction.

How large will the Data Center Transformation Market be by 2036?

MMA projects the market will reach approximately $222.97 billion by 2036. Growth is driven primarily by AI accelerator density outpacing existing cooling and power infrastructure.

What is the CAGR for the Data Center Transformation Market 2026 to 2036?

The market is forecast to grow at an 11.4% compound annual rate between 2026 and 2036. Bull and bear scenarios range from 12.7% down to 10.1% depending on grid interconnection pace.

Which segment is growing fastest?

Liquid Cooling and Thermal Management Retrofits is the fastest-growing segment, expanding at roughly 18.2% annually, about 1.6 times the overall market rate. Accelerator thermal density is the primary driver behind that pace.

Who are the major companies in the Data Center Transformation Market?

Vertiv, Schneider Electric, Eaton, Johnson Controls, and Rittal lead the category on disclosed revenue and installed capacity estimates. Combined, the top five hold roughly 38% of the market.

Which country is growing fastest?

India is the fastest-growing country at approximately 14.8% annually, well ahead of the broader South Asia and Pacific region. Government-backed sovereign AI programs are the primary factor behind that pace.

Report Segmentation Architecture

The full report scope spans multiple orthogonal segmentation dimensions, with cross-tabulated demand data provided for each dimension pair. Coverage extends further to regional breakdowns, trend trajectories, and the competitive detail needed to support segment-level decision-making.

By Retrofit Technology Type

  • Liquid Cooling and Thermal Management Systems
  • Power Distribution and Electrical Infrastructure
  • Rack and Enclosure Hardware
  • Facility Management and Monitoring Software
  • Structural and Building Retrofit Services

By End-Use Industry

  • Hyperscale Cloud Providers
  • Colocation and Wholesale Data Centers
  • Enterprise Owned Facilities
  • Government and Sovereign AI Facilities

By Commercial Dimension

  • Turnkey Conversion Contracts
  • Component and Equipment Sales
  • Software Subscription Services
  • Framework and Multi-Site Agreements

By Region

  • North America
  • Western Europe
  • East Asia
  • South Asia and Pacific
  • Latin America
  • Middle East and Africa
  • Eastern Europe

Scope, Methodology, and Coverage

Every figure in this report is reproducible from documented input assumptions. The scope below maps the historical period, the forecast horizon, the segmentation dimensions, and the countries covered, alongside the underlying primary and qualitative methodology.
Historical Period
2020 to 2025
Forecast Period
2026 to 2036
Base Year
2025 (USD billions; MMA Primary Research Dataset, September 2026)
Market Definition
This report defines the Data Center Transformation Market as the hardware, software, and services used to retrofit, modernize, and re-architect existing data center facilities for higher rack density and AI workloads, including liquid cooling, power distribution upgrades, and facility management software. It excludes new greenfield data center construction and standard IT hardware procurement not tied to facility-level modernization.
Quantitative Units
USD Billion, CAGR (%), Megawatts Converted
Segmentation Dimensions
Retrofit Technology Type, End-Use Industry, Commercial Dimension, Region
Regions Covered
North America, Western Europe, East Asia, South Asia and Pacific, Latin America, Middle East and Africa, Eastern Europe
Countries Covered
United States, Germany, United Kingdom, China, Japan, India, Brazil, and 13 additional countries
Key Companies Profiled
Vertiv, Schneider Electric, Eaton, Johnson Controls, Rittal, and 15 additional companies
Quantitative Methodology
Primary survey, n=3,800 respondents, Q4 2025, six countries; demand-side model with trade association cross-validation
Qualitative Methodology
47 expert interviews, Q4 2025; applied to validate demand model assumptions, identify emerging dynamics, and assess competitive positioning
Report Format
PDF and XLSX data workbook (Word format preview document)
Publisher
Market Minds Advisory
Report Code
MMA-2026-TEC-250
Published
September 2026
Contact
sales@marketmindsadvisory.com | www.marketmindsadvisory.com

Purchase the full Data Center Transformation Market Report (2026 to 2036).

The full Data Center Transformation Market report delivers a complete analysis of segment-level growth, regional demand patterns, and competitive positioning across all major retrofit suppliers worldwide. It includes detailed profiles of the twenty leading companies, quantified trend and driver analysis, and a full regional breakdown across all seven world regions with country-level detail where relevant. Buyers receive input cost exposure modeling and portfolio margin benchmarking that go well beyond what the executive summary alone can provide. The report also includes a proprietary MMA revenue-lever framework identifying specifically where suppliers can capture incremental margin.
Full seven-region demand and pricing breakdown
Twenty-company competitive profiles and moat analysis
Segment-level CAGR and market share detail
Input cost exposure and mitigation strategy analysis
Portfolio margin tiering across product categories
Primary survey and expert interview data tables

Built For The People Who Decide

From boardroom strategy to bench-side execution, this report is read cover-to-cover by leaders shaping the next decade of their industry, turning demand scenarios, market dynamics and valuation benchmarks into decisions.
CXOs/ Presidents/ VPs/ Managers
M&A and Corporate Development
Strategy Teams and R&D Heads
Procurement and Product Directors
Regulatory and Compliance Leaders
Investor Relations and Equity Analysts