Market Minds Advisory
Data Center Liquid Cooling Market

Data Center Liquid Cooling Market: Chip Power Density Made Air Cooling Optional, Then Obsolete

A commercial reading of data center thermal management, where chip power density outran what air can remove economically, coolant distribution units became a bottleneck, and fluid regulation reshapes which architecture operators can deploy.

Lead Analyst

David Horsley

Published

September 2026

Make Smarter Decisions with Customized Research Insights

Request a free sample report and evaluate market opportunities, growth trends, and competitive dynamics relevant to your business needs.

2025 MARKET VALUE$8.4BMarket Size 2025
2036 FORECAST VALUE$49.5BBase Case , 2026 to 2036
CAGR 2026 TO 203617.5 %Bull 18.8% / Bear 16.2%
INCREMENTAL OPPORTUNITY$39.6BNet 10- year value creation
EXPANSION MULTIPLE5.02x2036 value over 2026 base
Strategic Levers
M&A Pipeline
Regional Outlook
Country Rankings
Competitive Intelligence
Segmental Deep-dive
Call-Us : 91 93563 13602

Executive Snapshot and Market Trajectory

Accelerator chips now dissipate far more heat per rack than a small building's central air handling system could realistically ever remove, which is exactly why liquid cooling stopped being an option and became the design starting point for any new AI data center built from this point forward.
The market stands at USD 8.4 billion in 2025 and reaches USD 49.51 billion by 2036 at a 17.5% CAGR. Direct-to-chip cold plate systems grow fastest at 23.4%, about 1.34 times the overall rate, as hyperscalers standardise on cold plates for GPU racks. North America holds the largest share at 30% on hyperscaler capital spending, while Malaysia posts the quickest national growth at 24.5% as new campuses come online regionally now.
Concentration sits at a modest CR5 of 48%, reflecting a market still young enough that specialist coolant distribution and immersion vendors compete alongside diversified thermal management giants. Two forces reshape the field. Coolant distribution unit capacity has become scarce and strategically important as the chips themselves, and regulatory restriction on fluorinated dielectric fluids is forcing a technology choice between water-based cold plates and next-generation immersion chemistries.
Market Definition
The data center liquid cooling market covers equipment and fluids used to remove heat from IT hardware using liquid media, including direct-to-chip cold plates, single-phase and two-phase immersion systems, rear door heat exchangers, coolant distribution units, and dielectric and water-based coolant fluids. General air-based CRAC and CRAH cooling, building-level chillers sold independently of the liquid loop, and general facility construction are excluded.
Base Year Value
$8.4B in 2025 (MMA Primary Research Dataset, August 2026)
Forecast Period
2026 to 2036, eleven discrete annual values
CAGR
17.5% base case. Bull 18.8%. Bear 16.2%.
Fastest Growth Segment
Direct-to-Chip Cold Plate Cooling Systems: 23.4% CAGR
Fastest Growth Country
Malaysia: 24.5% CAGR
Fastest Growth Region
South Asia and Pacific: 19.6% CAGR
Largest Region
North America: 30% of 2025 global value
Market Leaders
Vertiv, Schneider Electric, nVent Electric, CoolIT Systems, Boyd Corporation. Source: MMA Analysis based on company annual reports.
Primary Survey
n=3,800 procurement and R&D decision-makers, Q4 2025, six countries
Methodology
Demand-side build-up, cross-validated against public data, 47 expert interviews

Data Center Liquid Cooling Market Forecast Scenarios

data-center-liquid-cooling-market-size-forecast-scenario-1787324279251
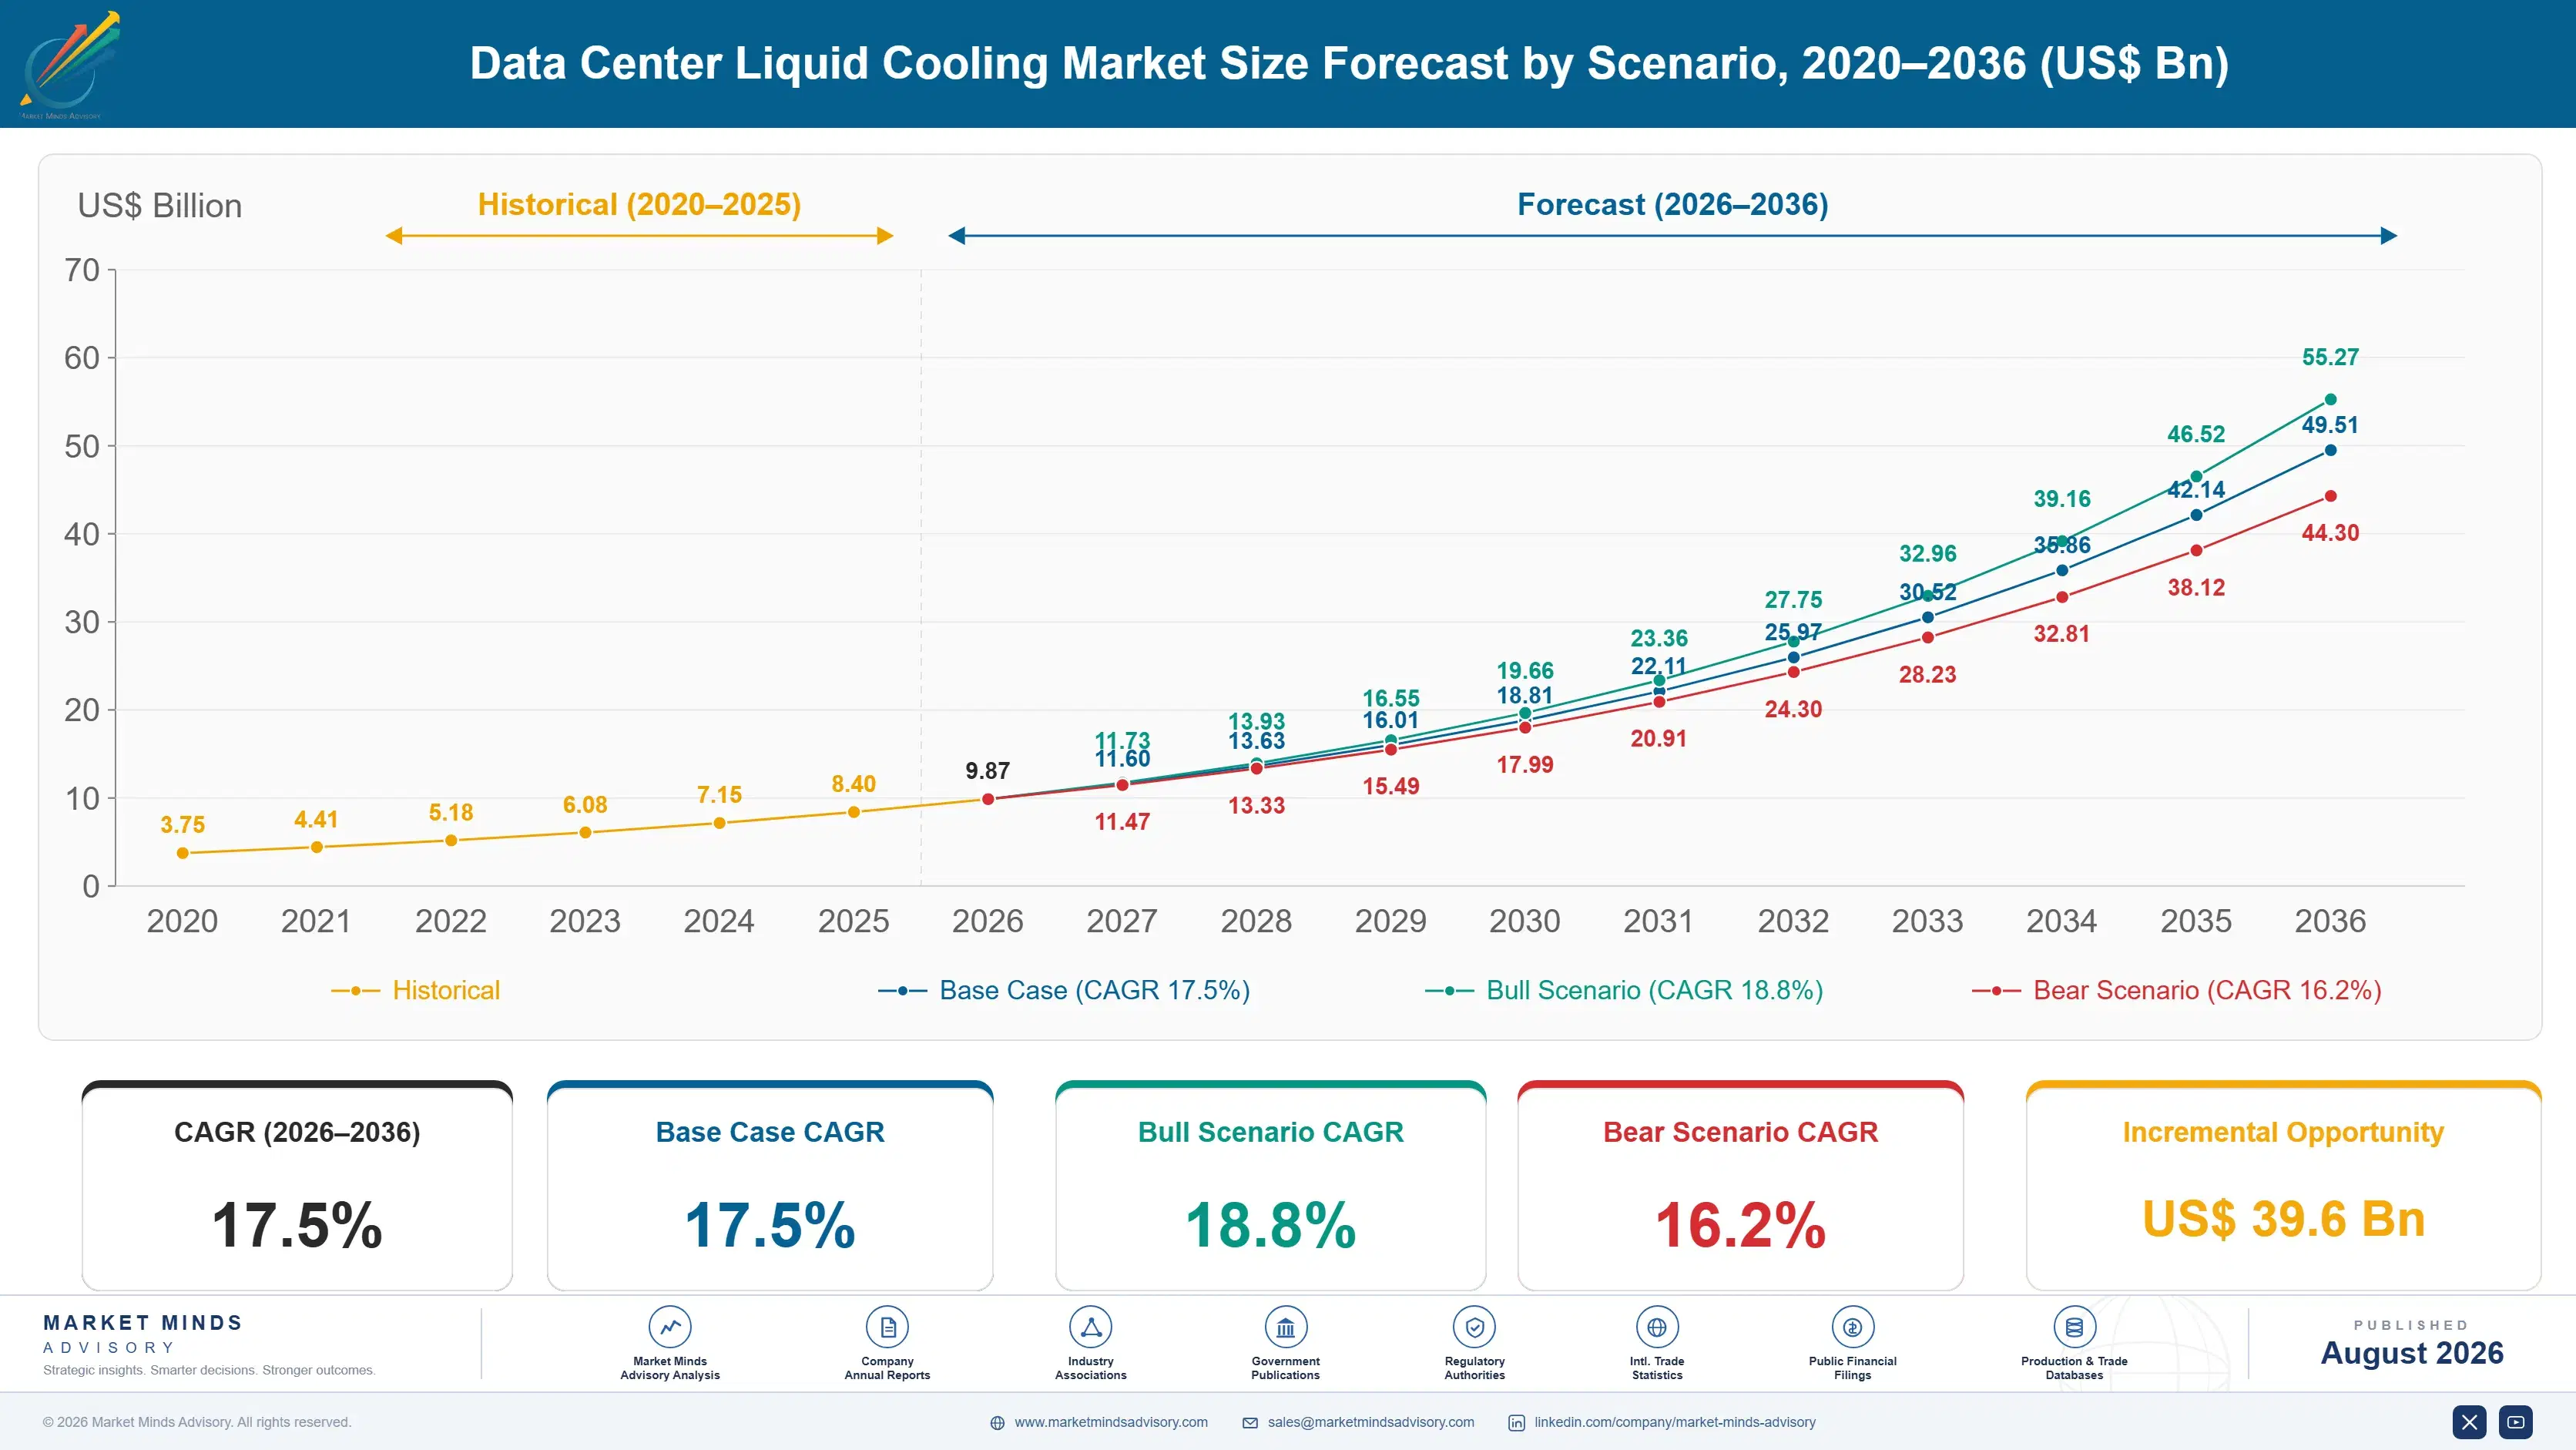
Growth from 2020 to 2025 compounded near 16.3%, starting from a niche high-performance computing base before generative AI training clusters turned liquid cooling into a mainstream hyperscale requirement almost overnight from 2023 onward. Deployment moved faster than supply chains could comfortably follow, and coolant distribution units became the visible bottleneck in an otherwise chip-constrained industry.
Three mechanisms carry the base case to 17.5%. First, accelerator power density: each new GPU generation dissipates meaningfully more heat per chip, pushing rack density past what air cooling can remove at any reasonable airflow. Second, retrofit demand, as existing air-cooled facilities add liquid loops to host AI workloads without a full rebuild. Third, sovereign and hyperscale campus construction, where new sites are increasingly liquid-cooled from the foundation rather than adapted later.
The bull case at 18.8% assumes accelerator power density keeps climbing at the recent pace and retrofit adoption spreads beyond the largest hyperscalers into enterprise and colocation facilities. The bear case at 16.2% assumes GPU generational power growth moderates, easing the urgency behind full liquid conversion, and that fluorinated fluid restrictions slow immersion cooling deployment faster than cold plate alternatives can absorb the displaced demand.

Why The Coolant Loop Now Gates The Data Hall

Three forces set demand. Accelerator power density provides the base, since each new GPU generation forces the thermal design conversation whether an operator wants to have it or not. Retrofit economics provide a second layer, as air-cooled facilities calculate whether adding liquid loops costs less than building new liquid-native capacity elsewhere. Sovereign and hyperscale campus construction provides the third, with new sites increasingly liquid-cooled from the foundation.
MARKET CONCENTRATIONCR5: 48%Moderately fragmented among specialist and diversified thermal vendors
LIQUID-COOLED RACK DENSITY SHAREAbout 22%New hyperscale rack deployments specified with a liquid loop
PUE IMPROVEMENT RANGE1.5 to 1.8 versus 1.1 to 1.3Facility power usage effectiveness before and after conversion
COOLANT DISTRIBUTION LEAD TIME9 to 14 monthsTypical order-to-delivery window seen for large-capacity distribution units
FLUID COST SHARE10 to 18%Dielectric or engineered fluid cost within total system spend
TOP DEPLOYING COUNTRY SHAREUnited States: about 27%Global liquid-cooled data center capacity concentrated in one country
The commercial character is decided by supply constraint rather than by demand uncertainty, which is unusual this early in a technology cycle. Coolant distribution units, precision-manufactured and produced by a handful of qualified vendors, now carry lead times that rival the chips they cool. Operators who secured distribution unit capacity early hold a genuine competitive advantage over those still queued behind them.
The next decade turns on two things. Whether cold plate architecture remains the default as density keeps climbing, or whether immersion cooling reaches the reliability and serviceability standard hyperscalers demand at scale. And whether fluorinated fluid regulation forces a wholesale shift toward water-based and next-generation chemistries before immersion vendors have fully proven the alternatives at data center scale.
"Everyone assumed the chip shortage was the constraint. It was never only the chip. A coolant distribution unit takes longer to build than a GPU takes to fabricate right now, and that is the queue nobody modelled two years ago."
Director, Data Center Infrastructure Practice · MMA Technology / Data Center The

Market Trends

Coolant Distribution Units Become The New Capacity Bottleneck

Coolant distribution units, the pumps, heat exchangers, and controls that manage fluid flow between facility water and the chip-level loop, now carry lead times of 9 to 14 months for large-capacity models, rivalling chip fabrication timelines. A handful of qualified manufacturers supply the precision components these units require, and demand has outrun capacity to expand production lines fast enough. Hyperscalers that secured orders early are deploying AI capacity months ahead of competitors still waiting in the queue. Manufacturers are responding with modular designs and expanded manufacturing footprints, but qualification cycles for mission-critical hardware move slower than the demand curve.
Market Impact: Rack density now exceeds 100 kilowa
Fluorinated Fluid Restrictions Force A Cooling Chemistry Choice

Regulatory restriction on per- and polyfluoroalkyl substances, the fluorinated compounds long used in two-phase immersion dielectric fluids, is forcing operators and vendors toward water-based cold plate systems or next-generation fluid chemistries without established long-term reliability data. A major fluid producer's 2022 decision to exit fluorinated fluid manufacturing removed supply that immersion cooling vendors had built product roadmaps around, and replacement chemistries remain under qualification. The commercial effect favours cold plate architecture, which uses water or dielectric fluid in closed loops rather than open immersion baths, over immersion cooling in new deployments where regulatory certainty matters more than raw thermal performance.
Market Impact: Retrofit capacity grows near 21% ye

Market Opportunities and Growth Drivers

Accelerator Power Density Outpaces What Air Can Remove

Each new generation of AI training and inference accelerators dissipates meaningfully more heat per chip, and rack-level power density in leading-edge AI clusters now exceeds 100 kilowatts, well past what conventional air cooling can remove without impractical airflow volumes. This is not a preference shift, it is a physical constraint: cooling a rack at that density with air would require fan power and floor space that make the economics worse than any liquid alternative. Chip designers are not slowing density growth to accommodate cooling limitations, which means liquid cooling adoption tracks accelerator roadmaps rather than following typical technology adoption curves.
Market Impact: Delays deployment by 14 months

Retrofit Economics Favour Liquid Over New Construction

Adding liquid cooling loops to existing air-cooled facilities frequently costs less and deploys faster than constructing new liquid-native capacity, particularly where the facility already has usable power and network connectivity in place. Operators calculate retrofit payback against the alternative cost of new construction, land acquisition, and grid interconnection queues that now stretch years in constrained power markets. This has turned retrofit into a genuine growth driver rather than a stopgap measure, with colocation providers marketing liquid-ready retrofit capacity as a distinct commercial product. The approach also lets operators capture AI workload revenue faster than a multi-year greenfield build would allow.
Market Impact: Training backlogs run 12 months

Market Restraints and Challenges

Coolant Distribution Supply Cannot Match Deployment Pace

Demand for coolant distribution units has outrun the manufacturing capacity of the small number of vendors qualified to build them, and lead times of 9 to 14 months now determine how quickly an operator can bring liquid-cooled AI capacity online. The root cause is that these units require precision heat exchangers and controls that cannot be mass-produced on typical electronics manufacturing lines, and qualification for mission-critical infrastructure takes considerably longer than for consumer hardware. Commercially this delays revenue-generating AI capacity by months regardless of chip availability. Vendors are responding with modular designs, expanded factory footprints, and long-term capacity reservation contracts.
Market Impact: Lead times reach 14 months

Skilled Liquid Cooling Technicians Remain Scarce

Liquid cooling systems require technicians comfortable with pressurised fluid loops, leak detection, and chemistry-sensitive maintenance, a skill set data center operations teams trained on air cooling rarely possess. The root cause is that facilities staff historically specialised in electrical and mechanical air-handling systems, not fluid engineering, and training pipelines have not kept pace with deployment speed. Commercially this raises operating risk during the transition, since a poorly maintained liquid loop can cause far more damage than an air-cooling fault ever would. Operators respond with vendor-delivered maintenance contracts and partnerships with technical training providers to build capability over time.
Market Impact: Immersion roadmaps delayed 24 month
3 additional market trends, 4 additional growth drivers, and 3 additional restraints and challenges are covered in the full report. Contact sales@marketmindsadvisory.com to access the complete intelligence.

Segment CAGR and Growth Architecture

Segmentation follows cooling technology type, a single engineering logic describing how heat is removed from the chip to the facility loop. Fluids and coolant distribution hardware are tracked within their own equipment categories because they are purchased and specified on separate technical criteria. End-use facility type and deployment model sit separately within the framework.
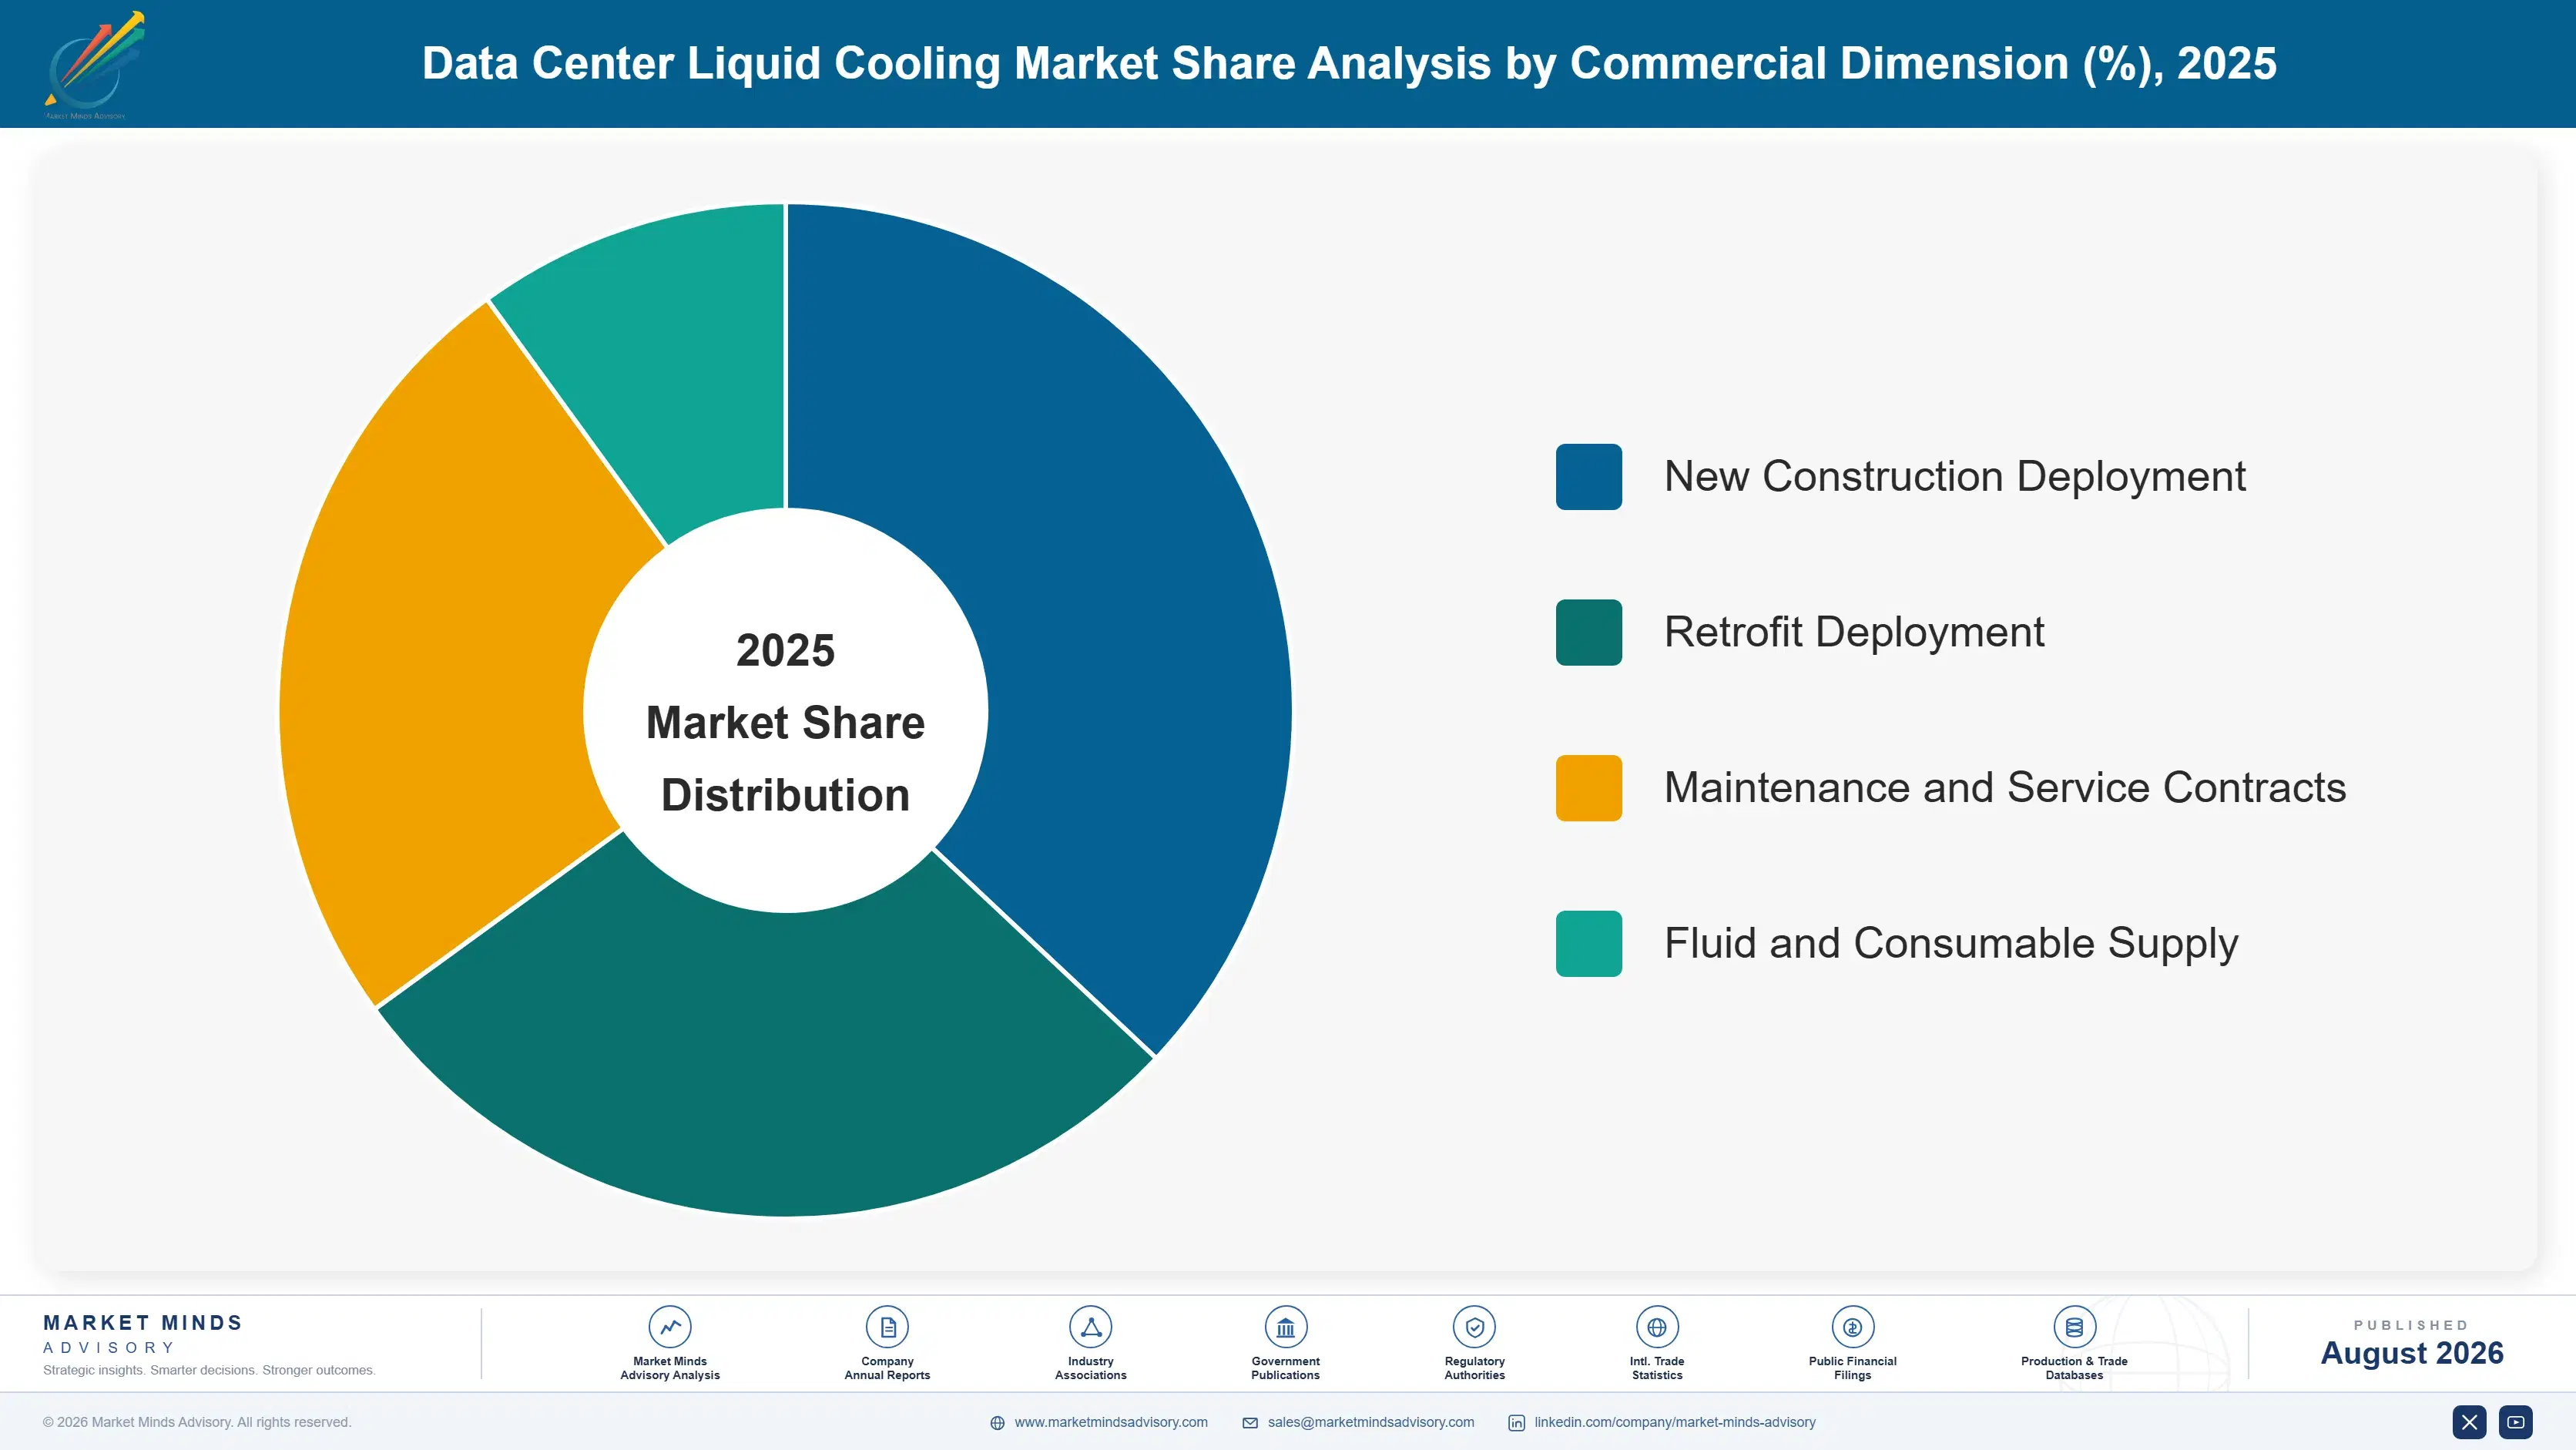
data-center-liquid-cooling-market-market-share-analysis-1787324279786

Direct-to-Chip Cold Plate Cooling Systems

Direct-to-chip cold plate systems grow fastest at 23.4%, about 1.34 times the overall 17.5% rate, covering the metal cold plates, manifolds, and closed-loop hardware that carry water or dielectric fluid directly across the processor die. Hyperscalers have standardised on cold plates for GPU rack deployments because the technology is proven at scale, serviceable without draining an entire tank, and unaffected by the fluorinated fluid restrictions now complicating immersion roadmaps. NVIDIA's largest GPU rack platforms ship cold plate ready, which has made the technology the default specification across new AI campus construction globally. Coolant distribution unit supply, not cold plate manufacturing capacity itself, is now the binding constraint on how fast this segment can convert additional racks.
CAGR 23.4%

Coolant Distribution Units and Manifolds

Coolant distribution units and manifolds grow at 20.8%, the second-fastest category, as every liquid-cooled rack deployment requires distribution infrastructure regardless of which chip-level technology it feeds. Lead times of 9 to 14 months on large-capacity units have made this segment the visible bottleneck across the whole liquid cooling supply chain, and hyperscalers now place orders years ahead of facility construction to secure position in vendor production queues. A small number of precision manufacturers, including Vertiv, nVent, and specialist suppliers, hold outsized influence over overall deployment pace as a result. Vendors are expanding manufacturing footprints and modularising designs to compress lead times, but qualification cycles for mission-critical infrastructure move slower than hyperscale capital deployment demands.
CAGR 20.8%
Full segment breakdown across 6 segments available in the complete report.

Regional Architecture and Country Demand Map

Hyperscaler capital spending concentration explains most of this distribution, with power availability increasingly shaping where new capacity actually lands. North America leads on sheer hyperscaler spend, while the fastest growth sits in South Asia and Pacific, where new campuses are being sited specifically for power access.

North America

United States hyperscaler capital spending dominates this 30% share almost entirely. Microsoft, Google, Meta, and Amazon are building AI campuses explicitly designed around liquid cooling from the foundation rather than retrofitting existing air-cooled halls, and grid interconnection queues in traditional data center hubs like Northern Virginia have pushed new construction toward power-abundant regions instead. Coolant distribution unit allocation from the largest vendors favours these hyperscale customers over smaller operators, reinforcing the concentration. Canadian capacity is smaller but growing on favourable power pricing and climate advantages for facility-level heat rejection. Growth of 18.2% reflects both new liquid-native construction and accelerating retrofit of existing capacity. Power interconnection timing, not construction cost, increasingly decides where the next campus actually lands.
Share: 30% | CAGR: 18.2% (2026 to 2036)

Western Europe

Power scarcity shapes this market more directly than anywhere else. Western Europe holds 20% of value, with grid connection constraints in Ireland, the Netherlands, and Frankfurt pushing operators toward efficiency gains that liquid cooling delivers through lower power usage effectiveness than air-cooled alternatives. German and Nordic operators lead on retrofit adoption, motivated partly by energy cost and partly by regulatory pressure to improve efficiency under national and EU sustainability reporting requirements. Nordic sites increasingly market waste heat reuse for district heating, a commercial angle unique to the region. Growth of 16.0% is the slowest of the seven, reflecting a mature, power-constrained market where expansion is gated by grid capacity rather than cooling technology choice. Grid capacity remains the binding constraint.
Share: 20% | CAGR: 16.0% (2026 to 2036)
Regional intelligence for 5 additional markets available in the complete report: East Asia, South Asia and Pacific, Latin America, Middle East and Africa, Eastern Europe. Contact sales@marketmindsadvisory.com.
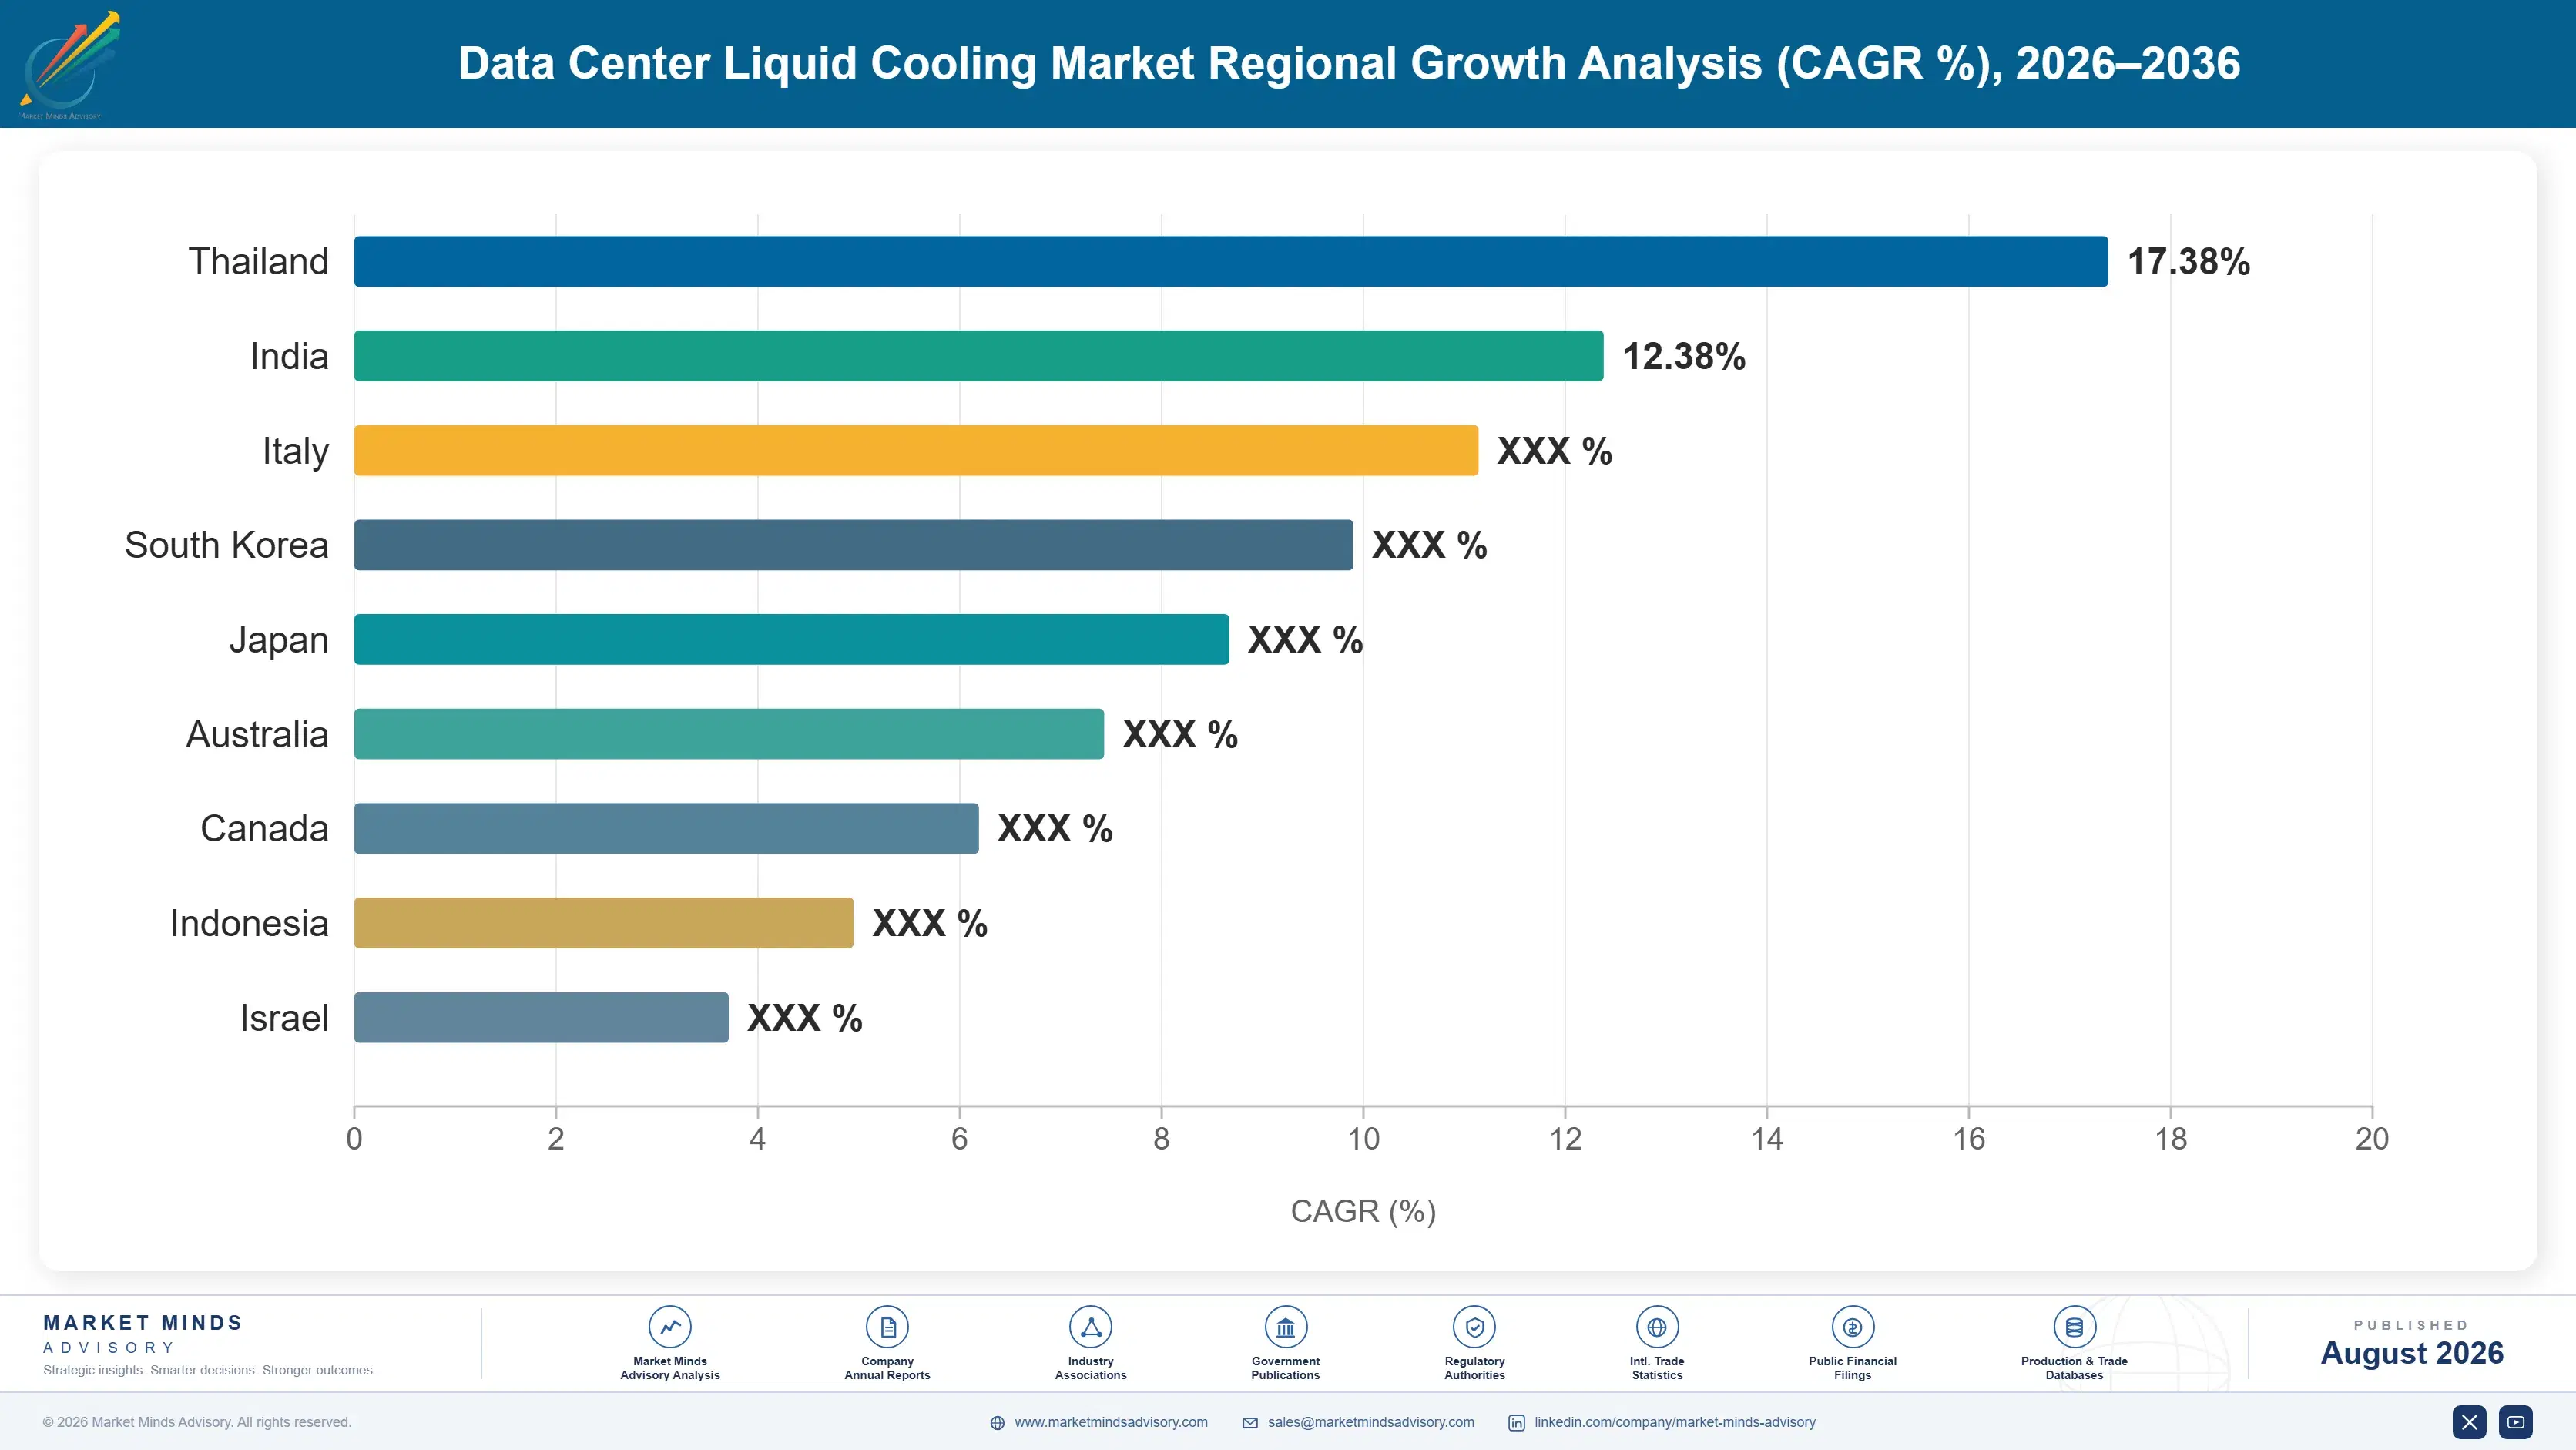
data-center-liquid-cooling-market-country-cagr-analysis-1787324280311

Where Liquid Cooling Vendors Actually Capture Value

Selling cooling hardware alone means competing on a component that hyperscalers increasingly specify by reference design and multi-source aggressively. The four moves below shift value toward positions a component supplier cannot simply match: distribution unit capacity reservation, fluid chemistry qualification, retrofit engineering services, and serviceability design that lowers total cost of ownership across the full contract life.

Sell Long-Term Distribution Unit Capacity Reservations

Coolant distribution unit lead times of 9 to 14 months have made manufacturing capacity itself a strategic asset, and vendors that offer multi-year capacity reservation contracts to hyperscale customers capture revenue certainty that spot ordering never provides. Hyperscalers now compete for position in vendor production queues years ahead of facility construction, which means securing reservation agreements early locks in customer relationships before a facility is built. This model shifts the vendor from a transactional equipment sale toward a planning partnership harder for a new entrant to displace, since the customer's own construction schedule depends on it.
Market Impact: Lead times of 9 to 14 months reward

Qualify Fluid Chemistry Ahead Of Regulatory Deadlines

Fluorinated fluid restrictions are forcing a chemistry transition across the industry, and vendors that complete qualification of water-based or next-generation dielectric alternatives ahead of competitors win specification into new facility designs before rivals can even bid. The qualification process for mission-critical cooling fluid takes 18 to 24 months given the reliability testing hyperscalers require, so an early start compounds into a multi-year specification advantage. Vendors still dependent on legacy fluorinated chemistry face a genuine cliff as regulatory deadlines approach, while those who invested in alternatives early are capturing share in exactly the immersion deployments regulatory uncertainty might otherwise have depressed.
Market Impact: Qualification lead time reaches 18

Build Retrofit Engineering Into A Standalone Service Line

Retrofitting an air-cooled facility for liquid cooling requires site-specific engineering that a standardised equipment sale does not capture, covering structural load, water piping routes, and leak containment design unique to each building. Vendors that package retrofit engineering as a paid service line, rather than a free add-on, capture margin that pure equipment competitors leave on the table. This also creates a durable relationship, since the engineering firm that designed a retrofit typically wins the maintenance and expansion contracts that follow. Retrofit demand is growing near 21% yearly, well ahead of new construction, making this increasingly central to revenue.
Market Impact: Retrofit demand grows near 21% year

Design For Servicing Without Draining The Loop

Total cost of ownership, not upfront hardware price, increasingly decides vendor selection once a hyperscaler has already absorbed one unplanned downtime event from a poorly serviceable liquid system. Cold plate and distribution unit designs that allow component replacement without draining an entire facility loop cut maintenance downtime by over 60% compared with first-generation systems that required a full shutdown for routine service. Vendors that lead on serviceability win renewal and expansion contracts even when a competitor's initial hardware price undercuts them, because operators weight avoided downtime heavily once they have experienced the alternative directly.
Market Impact: Serviceable designs cut downtime by

Who Controls the Margin Pool

Concentration sits at CR5 of 48%, with Vertiv, Schneider Electric, nVent Electric, CoolIT Systems, and Boyd Corporation holding leading positions in a market still young enough for specialists to compete against diversified giants. The gap between leaders and challengers rests on manufacturing capacity and qualification status rather than technology differentiation alone. All participants are assessed on one basis, annual revenue from liquid cooling hardware and fluids, excluding air-cooling and
Competition runs along three dimensions. First, coolant distribution unit manufacturing capacity, the binding constraint that increasingly decides which vendors win the largest hyperscale contracts. Second, fluid chemistry qualification status, particularly for vendors navigating the transition away from restricted fluorinated compounds. Third, serviceability and total cost of ownership, which matters more to repeat hyperscale buyers than initial hardware price.

Pressure is building from specialist immersion vendors including Submer and LiquidStack, racing to qualify next-generation fluid chemistries before regulatory deadlines close their current product lines. Meanwhile diversified thermal management giants are acquiring distribution unit manufacturing capacity outright rather than competing for allocation from independent suppliers. Rankings should favour companies with secured capacity and proven hyperscale deployment references over those still demonstrating technology at pilot scale.
data-center-liquid-cooling-market-company-positioning-matrix-1787324280834

Competitive Moat and Risk Dimensions

VERTIV

Moat: Distribution unit manufacturing scale

Vertiv's coolant distribution unit manufacturing capacity, built through organic investment and acquisition, positions it to fill hyperscale orders faster than smaller specialists facing the same lead time pressure. Its existing data center infrastructure relationships give it a direct path into retrofit conversations at facilities it already serves. Global service depth supports maintenance contracts that increasingly matter as installations mature.
VERTIV

Risk: Demand still outpacing capacity

Even Vertiv's expanded capacity has not fully closed the gap between hyperscale demand and available units, leaving growth constrained by production rather than order volume. Newer specialist entrants with narrower but deeper focus are winning individual contests in immersion and fluid chemistry. Margin pressure from customers negotiating multi-year commitments partly offsets the pricing power scarcity would otherwise provide.
SCHNEIDER ELECTRIC

Moat: Integrated facility infrastructure position

Schneider Electric's position across power distribution, facility management software, and cooling hardware lets it sell liquid cooling as part of an integrated package rather than a standalone component. That bundled relationship makes displacement harder for a rival, since switching vendors alone rarely justifies disrupting the broader contract. Its footprint spreads distribution unit production across more sites than narrower specialists match.
SCHNEIDER ELECTRIC

Risk: Bundled sales cycle moves slower

Selling cooling as part of a broader bundle lengthens sales cycles compared with specialist vendors who can close a standalone contract faster when a hyperscaler needs capacity immediately. Its breadth across many infrastructure categories means liquid cooling investment competes internally for capital. Specialist distribution manufacturers are winning some allocation-constrained deals purely on faster lead time.

Players Tracked

Prominent Players

Vertiv
Schneider Electric
nVent Electric
CoolIT Systems
Boyd Corporation

Other Key Players

Asetek
LiquidStack
Submer
Green Revolution Cooling
Munters
STULZ
Motivair
Iceotope
JetCool Technologies
ZutaCore
Chilldyne
Delta Electronics
Envicool
Midas Immersion Cooling
Wiwynn

Recent Developments

FEBRUARY 2025

Vertiv expands coolant distribution unit manufacturing capacity

Vertiv announced a capacity expansion at an existing manufacturing site dedicated to large-capacity coolant distribution units, aiming to shorten lead times for hyperscale customers facing multi-year queues. This was an organic expansion rather than an acquisition or joint venture, adding production lines to meet demand that had outrun planning assumptions.
Signal: Manufacturers are treating distribution un
SEPTEMBER 2024

nVent Electric acquires immersion cooling fluid specialist

nVent Electric completed the acquisition of a specialist developer of next-generation immersion cooling fluid chemistry, adding qualified alternatives to fluorinated dielectric fluids facing regulatory restriction. This was a full acquisition bringing the target's chemistry portfolio and qualification data fully inside nVent's thermal management division, not a licensing or supply arrangement.
Signal: Buying qualified fluid chemistry outright
MAY 2025

CoolIT Systems signs multi-year supply agreement with hyperscale operator

CoolIT Systems signed a multi-year supply agreement with a major hyperscale operator to reserve cold plate and distribution unit manufacturing capacity across upcoming AI campus construction. This was a capacity reservation supply agreement rather than an equity stake or acquisition, formalising priority production allocation in exchange for committed volume.
Signal: Reservation agreements are becoming the st

Precision Components, Fluids, And Qualified Manufacturing

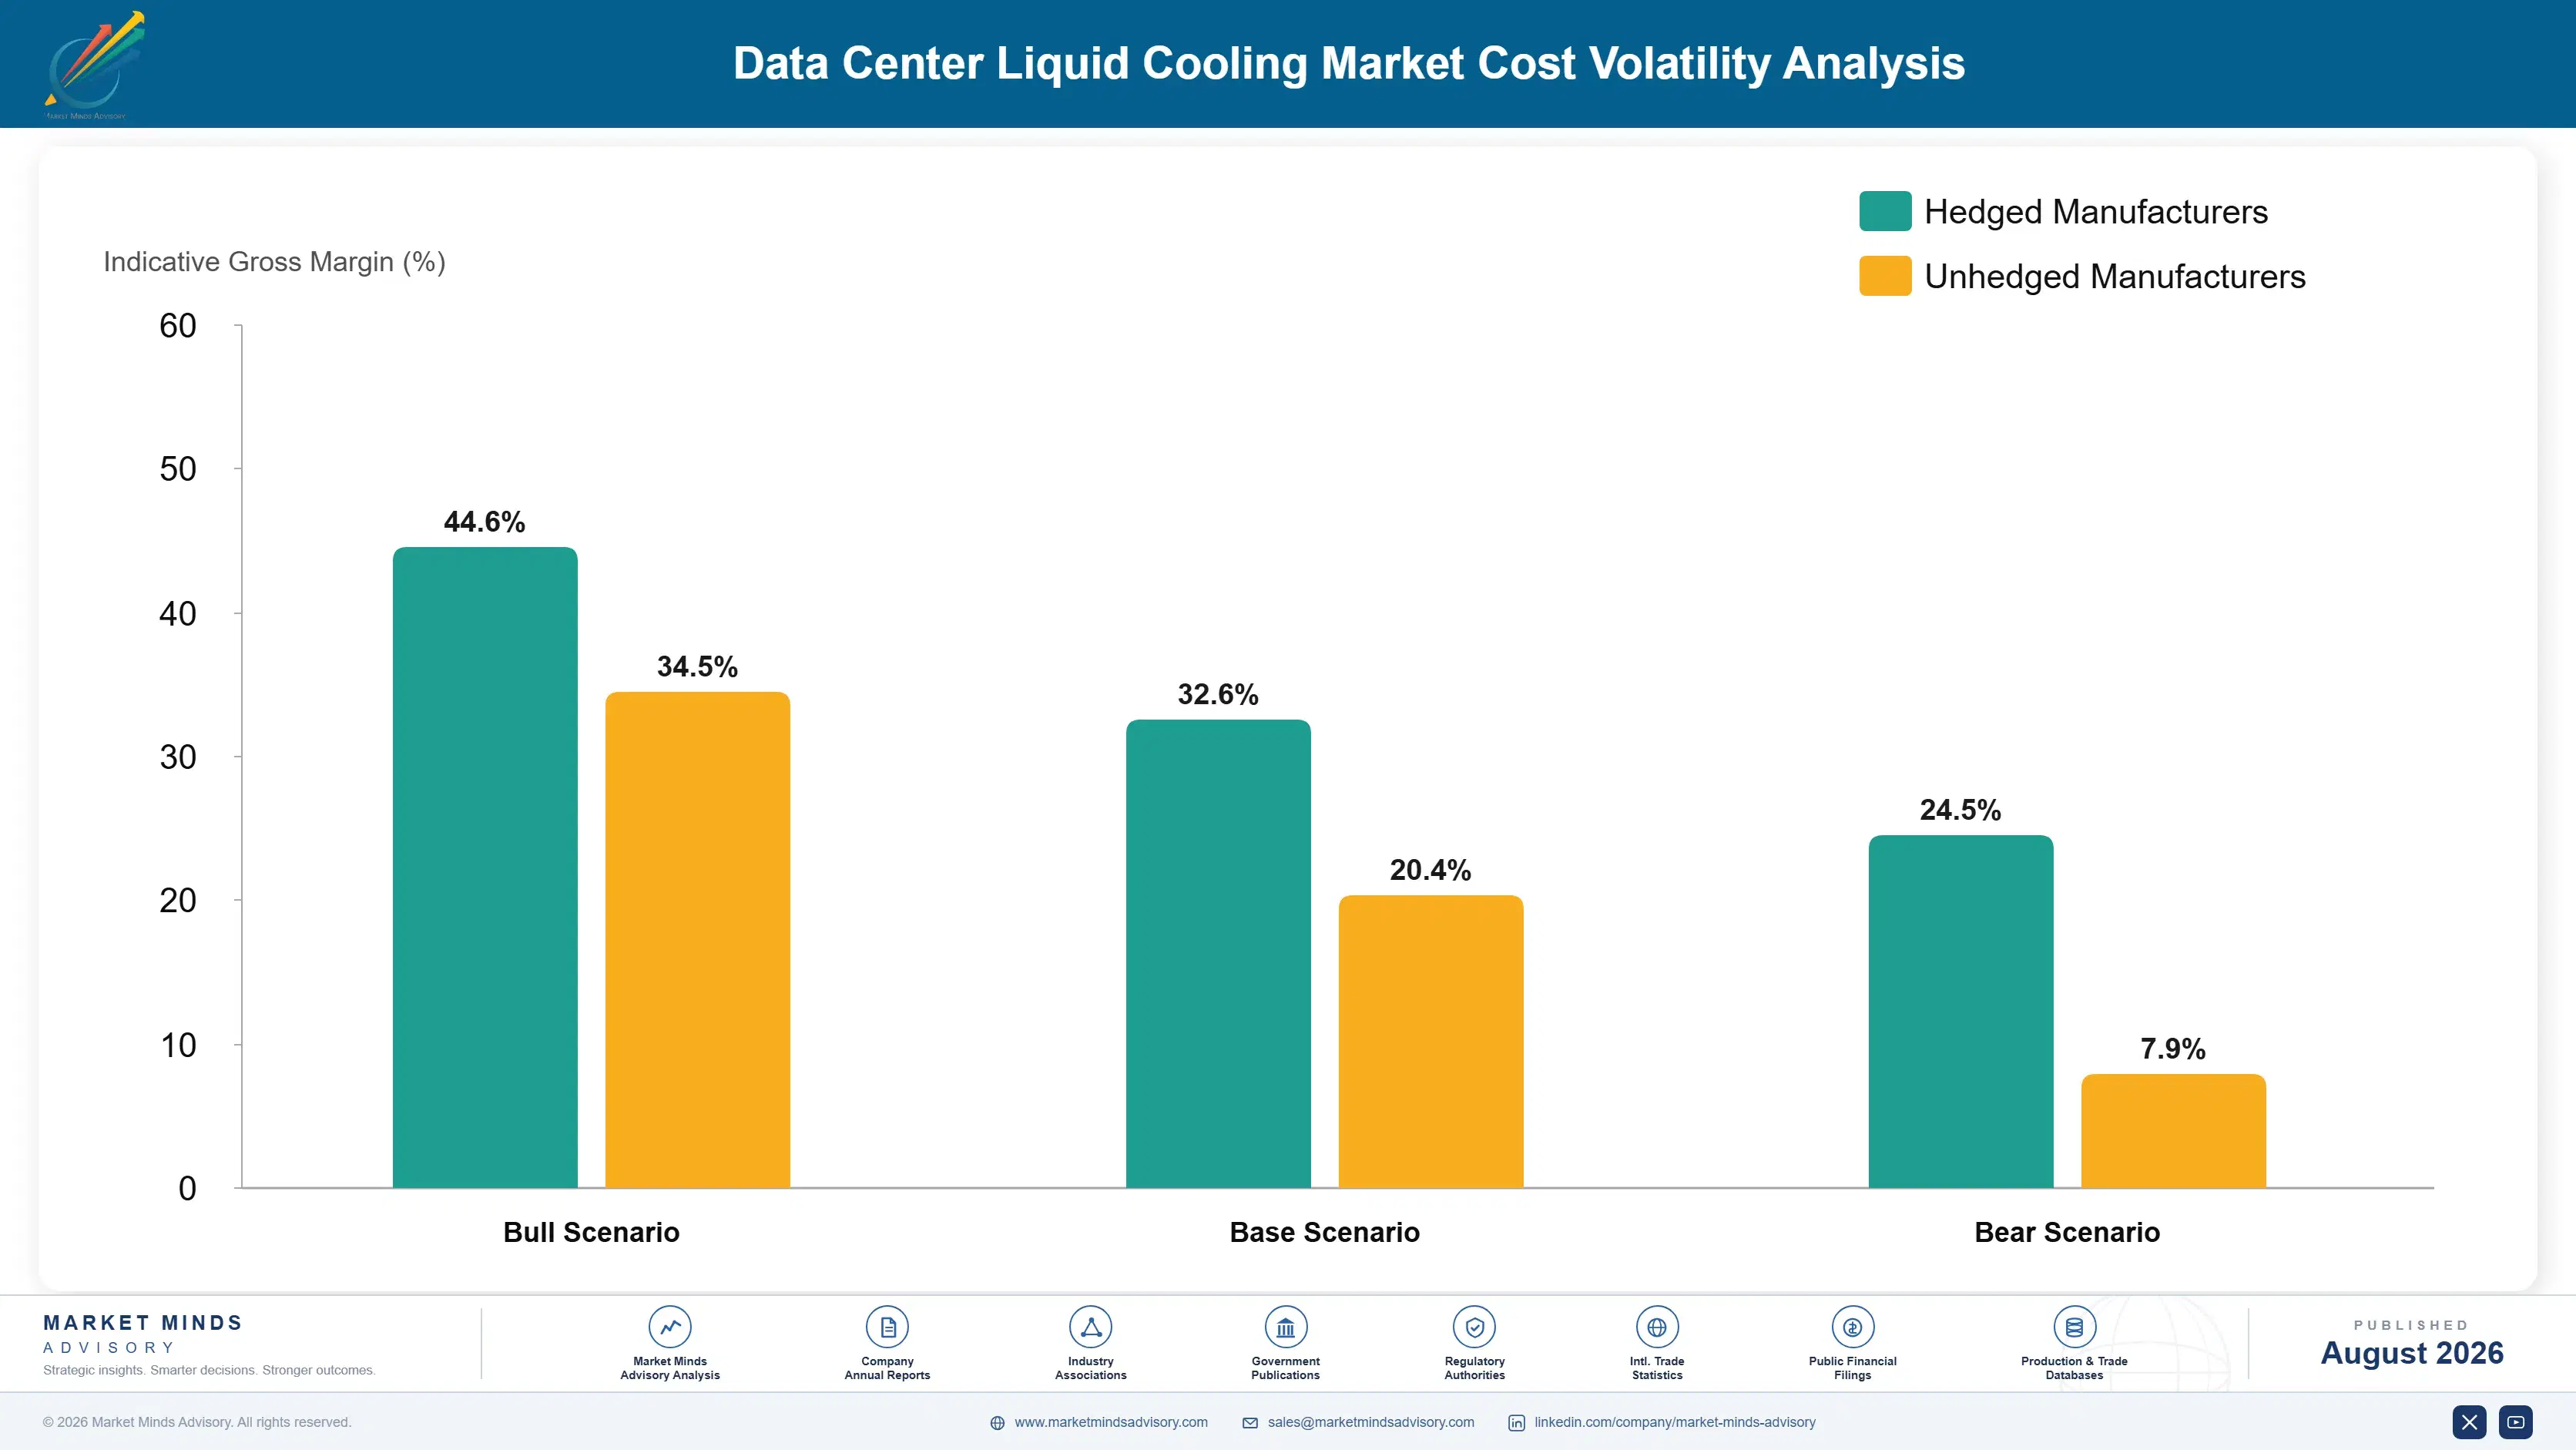
Precision-manufactured components dominate cost in this category. Pumps, heat exchangers, and control electronics within coolant distribution units account for roughly 30% to 38% of cost of goods sold, reflecting the tight manufacturing tolerances mission-critical cooling infrastructure requires. Cold plate copper and machining costs add a further 15% to 20%, while dielectric and engineered fluids account for 10% to 18% depending on chemistry and remain the most volatile input.
Fluorinated fluid supply disruption has been the sharpest recent pressure. A major fluid producer's 2022 announcement that it would exit manufacturing of fluorinated compounds used in two-phase immersion cooling removed established supply that vendors had built product roadmaps around, according to IEA data center energy reporting on cooling technology transitions. Replacement chemistry qualification has taken longer and cost more than initially planned across the immersion cooling segment specifically.

Exposure separates by technology commitment and vertical integration. A vendor still dependent on legacy fluorinated fluid supply faces both cost and availability risk that a cold plate specialist using water-based loops simply does not carry. Manufacturers with in-house precision component production control cost and lead time through the capacity crunch better than assemblers dependent on the same constrained third-party suppliers everyone else competes for.
data-center-liquid-cooling-market-cost-volatility-analysis-1787324281028

Qualify multiple fluid chemistries ahead of deadlines

Relying on a single fluid chemistry, particularly a fluorinated one facing regulatory restriction, concentrates supply and compliance risk exactly when demand for alternatives is accelerating fastest. Qualifying multiple water-based and next-generation chemistries in parallel preserves specification flexibility as regulations tighten further. Vendors that started this process early now hold a genuine advantage over those still single-sourced on legacy fluid.

Secure precision component supply through vertical integration

Pumps, heat exchangers, and control electronics represent the largest share of build cost, and manufacturers that bring precision component production in-house control quality and lead time better than those dependent on the same constrained supplier base as competitors. The capital requirement is substantial and only justifies itself at hyperscale volume, which is precisely why so few vendors have achieved it.

Lock in long-term capacity agreements with hyperscale customers

Multi-year capacity reservation agreements protect manufacturing utilisation through demand swings better than spot order books ever could, giving vendors revenue visibility to justify further capacity investment ahead of confirmed orders. Hyperscalers benefit through guaranteed production slots rather than competing in an open queue against every other customer. This mutual lock-in is becoming the default commercial structure across the largest contracts.

Portfolio Architecture for Margin Defence

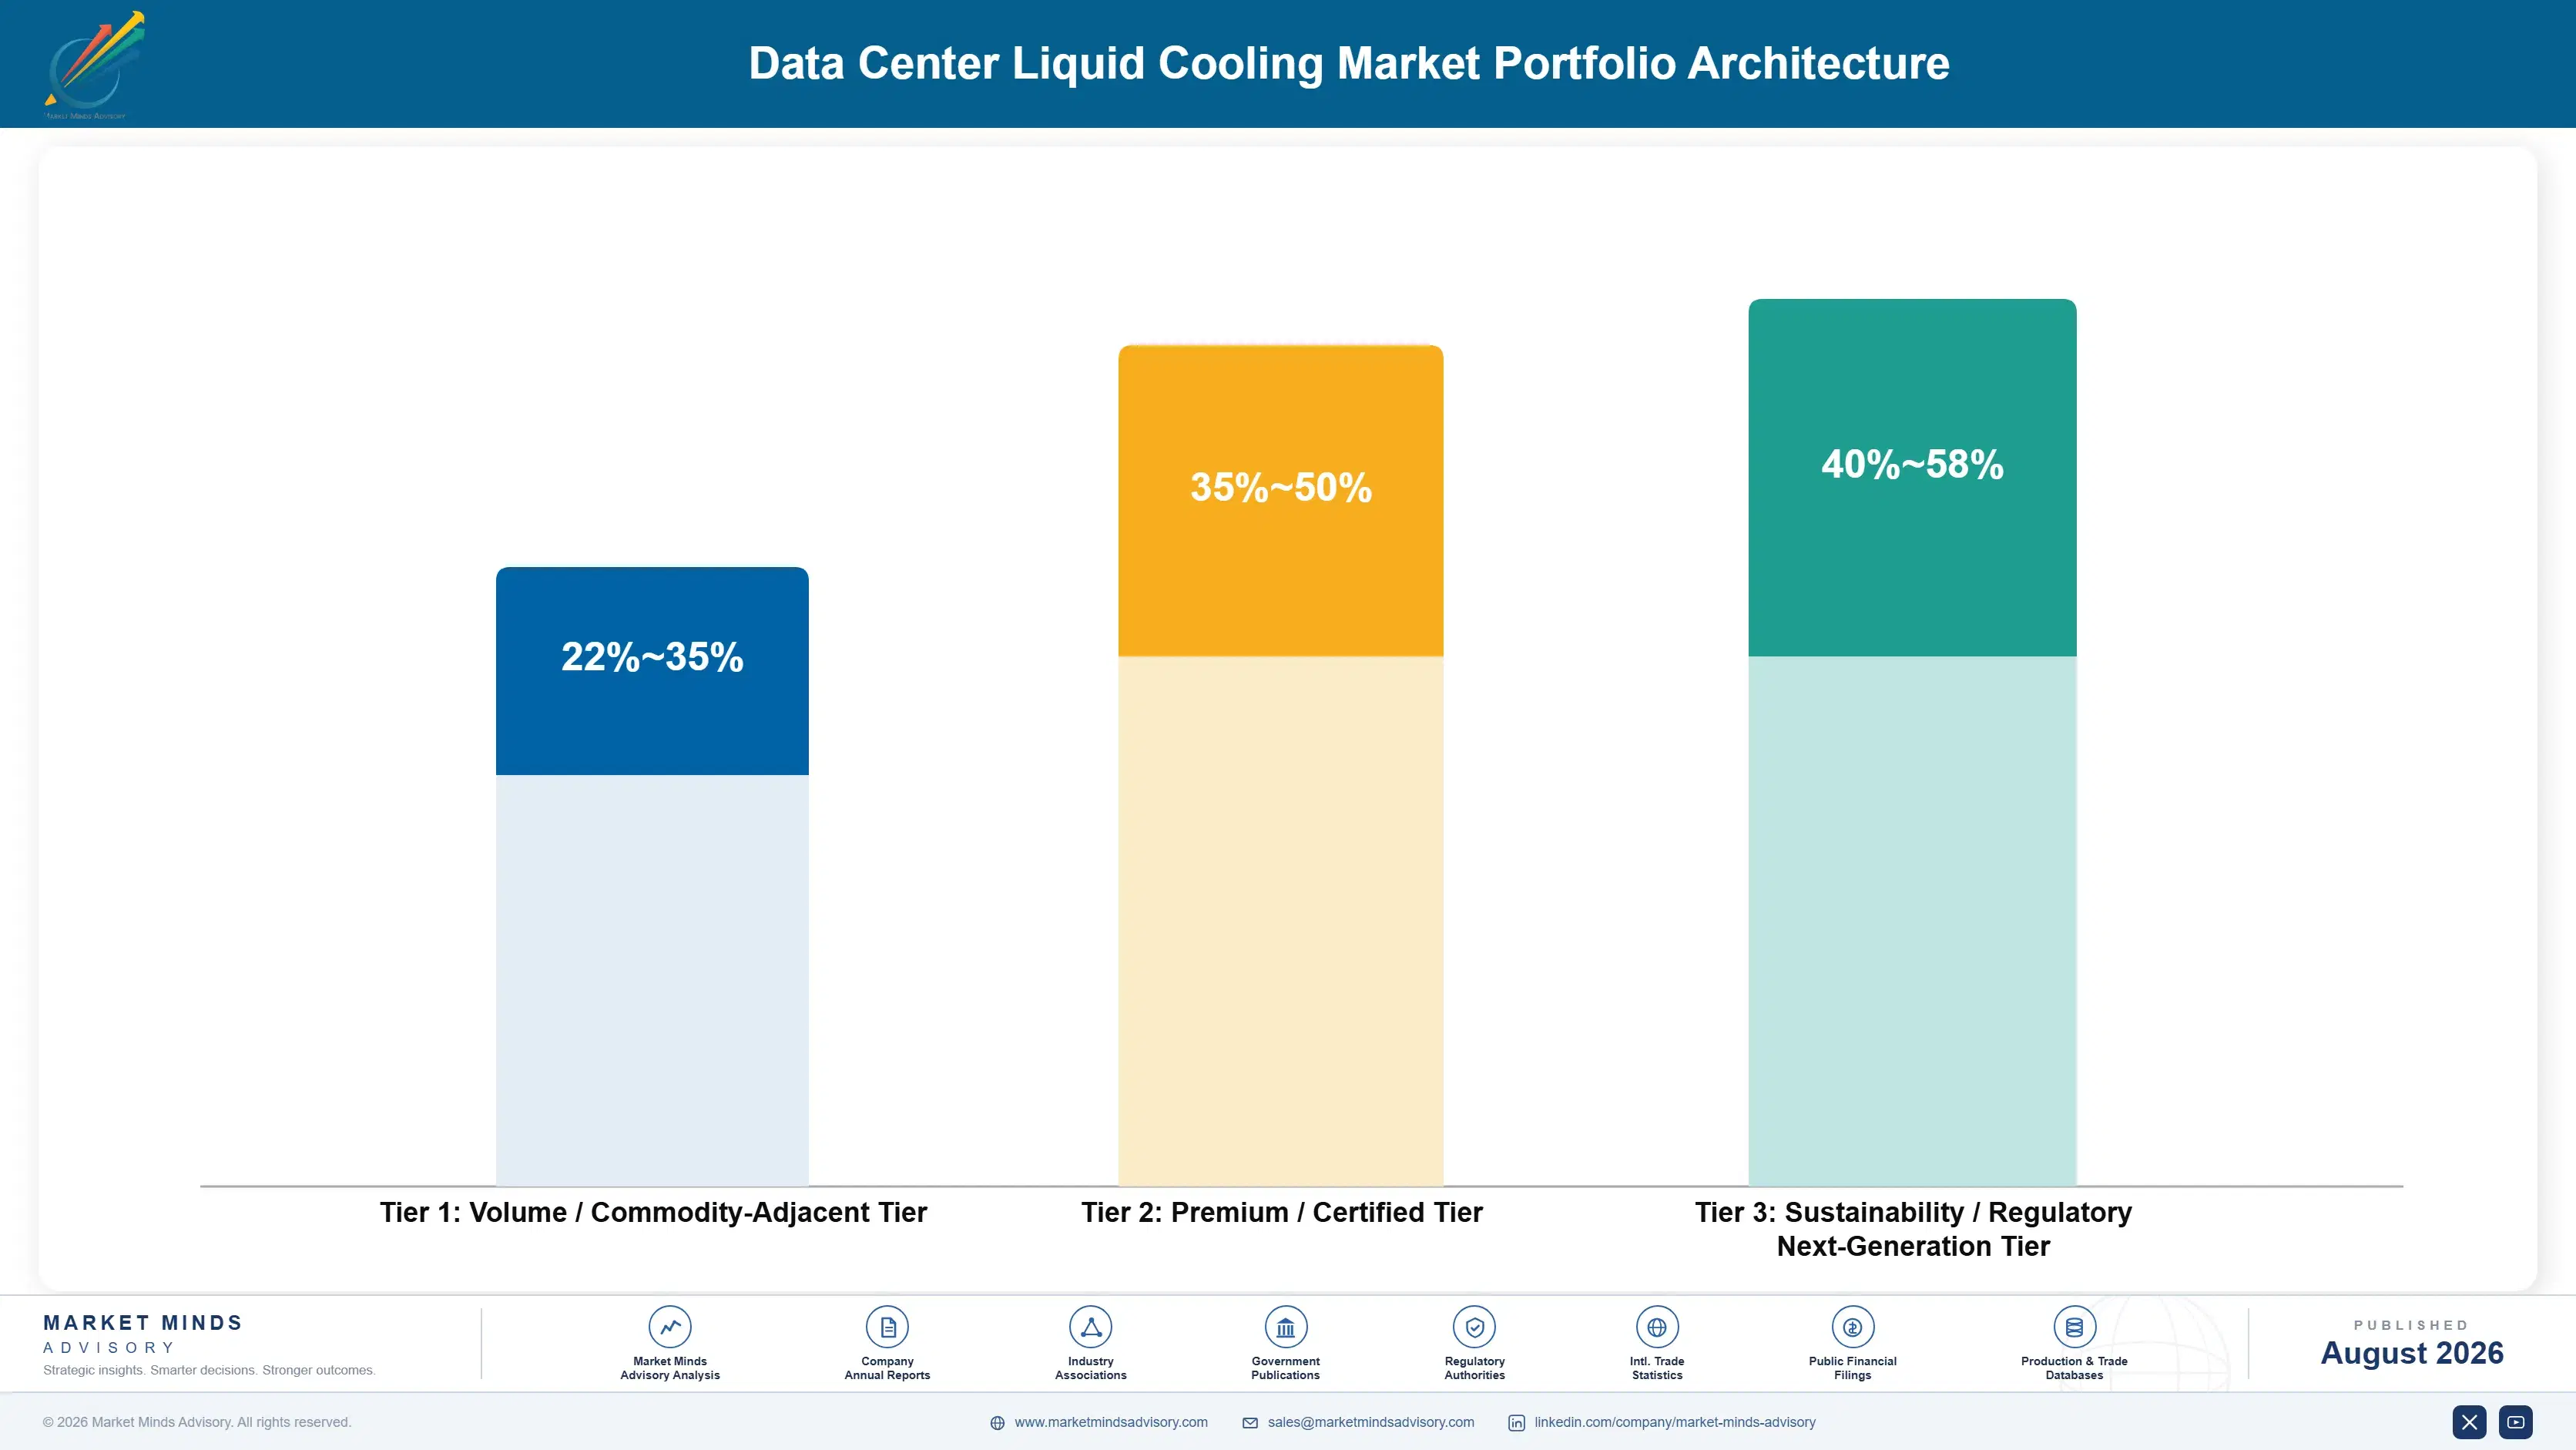
The portfolio splits into three tiers with different economics. Standardised cold plate and rear door heat exchanger hardware forms the volume tier, specified increasingly by reference design and competing on manufacturing capacity and delivery speed. Coolant distribution units with proven hyperscale reliability earn more, since scarcity and qualification both resist commoditisation. Next-generation immersion and fluid chemistry sit differently, priced against regulatory transition risk rather t
The tension runs between capturing today's cold plate demand, which funds most current revenue, and investing in immersion and fluid chemistry that may define the next architecture generation. Vendors over-indexed on cold plate risk missing the immersion transition if density keeps climbing past what cold plates can serve. Yet chasing immersion too early, ahead of regulatory certainty, risks capital committed to a chemistry that may not survive qualification.

High-value pools concentrate where manufacturing scarcity, qualification status, or regulatory positioning limit competition: distribution unit capacity reserved under long-term contract, qualified next-generation fluid chemistry ahead of restriction deadlines, and retrofit engineering bundled with hardware. All three resist price competition that standardised cold plate hardware increasingly faces as more manufacturers reach qualification. Commodity heat exchangers sold on price alone sit at the other end.

Volume / Commodity-Adjacent Tier

Standardised cold plates and rear door heat exchangers increasingly specified by reference design, sold largely on manufacturing capacity, delivery speed, and price against a growing field of qualified suppliers competing mainly on cost and available lead time.
Gross Margin: 22-35%

Premium / Certified Tier

Coolant distribution units and integrated cooling systems with proven hyperscale deployment track records, where qualification status and reliability data command sustained pricing power over newer entrants still building comparable operating history.
Gross Margin: 35-50%

Sustainability / Regulatory / Next-Generation Tier

Next-generation immersion systems, qualified non-fluorinated fluid chemistry, and retrofit engineering services sold with bundled reliability and compliance support ahead of regulatory deadlines, priced against transition risk competitors have not yet resolved.
Gross Margin: 40-58%
data-center-liquid-cooling-market-portfolio-architecture-1787324281570

High-value Sub-segments and Strategic Watch-out

Direct-to-Chip Cold Plate Cooling Systems

High value and high growth at 23.4%, the fastest category, as hyperscalers standardise on cold plates for GPU racks over immersion given proven reliability and freedom from fluorinated fluid restrictions. Coolant distribution supply, not cold plate manufacturing, is now the binding growth constraint across the industry.
Gross Margin: 35-52%

Coolant Distribution Units and Manifolds

High value with strong growth at 20.8% as every liquid-cooled rack requires distribution infrastructure regardless of chip-level technology chosen. Lead times of 9 to 14 months make this segment the visible bottleneck across the entire liquid cooling supply chain today, ahead of chips or racks themselves.
Gross Margin: 38-54%

Rear Door Heat Exchangers

The volume core by installed base, growing moderately as a lower-disruption retrofit option for facilities not yet ready for full direct-to-chip conversion. Adoption concentrates in enterprise and colocation facilities rather than the largest hyperscale AI campuses, where cold plates are already the default technology choice.
Gross Margin: 24-36%

Immersion Cooling Systems

The strategic watch-out, growth slowed by fluorinated fluid regulatory restriction even as the underlying thermal performance case remains genuinely strong for the highest-density future accelerator generations still to reach the market. Chemistry qualification timing, not underlying demand, decides this segment's near-term trajectory across every major market.
Gross Margin: 28-46%

How Cooling Specification Actually Locks In

Revenue depends on specification lock-in persisting across a facility's operating life, and once a hyperscaler qualifies a vendor's coolant distribution unit for a campus design, switching mid-programme carries revalidation cost that protects the incumbent for years. Maintenance and expansion contracts generate income across the full facility life while the initial hardware sale is paid for once. A small number of hyperscale customers drive disproportionate order volume.
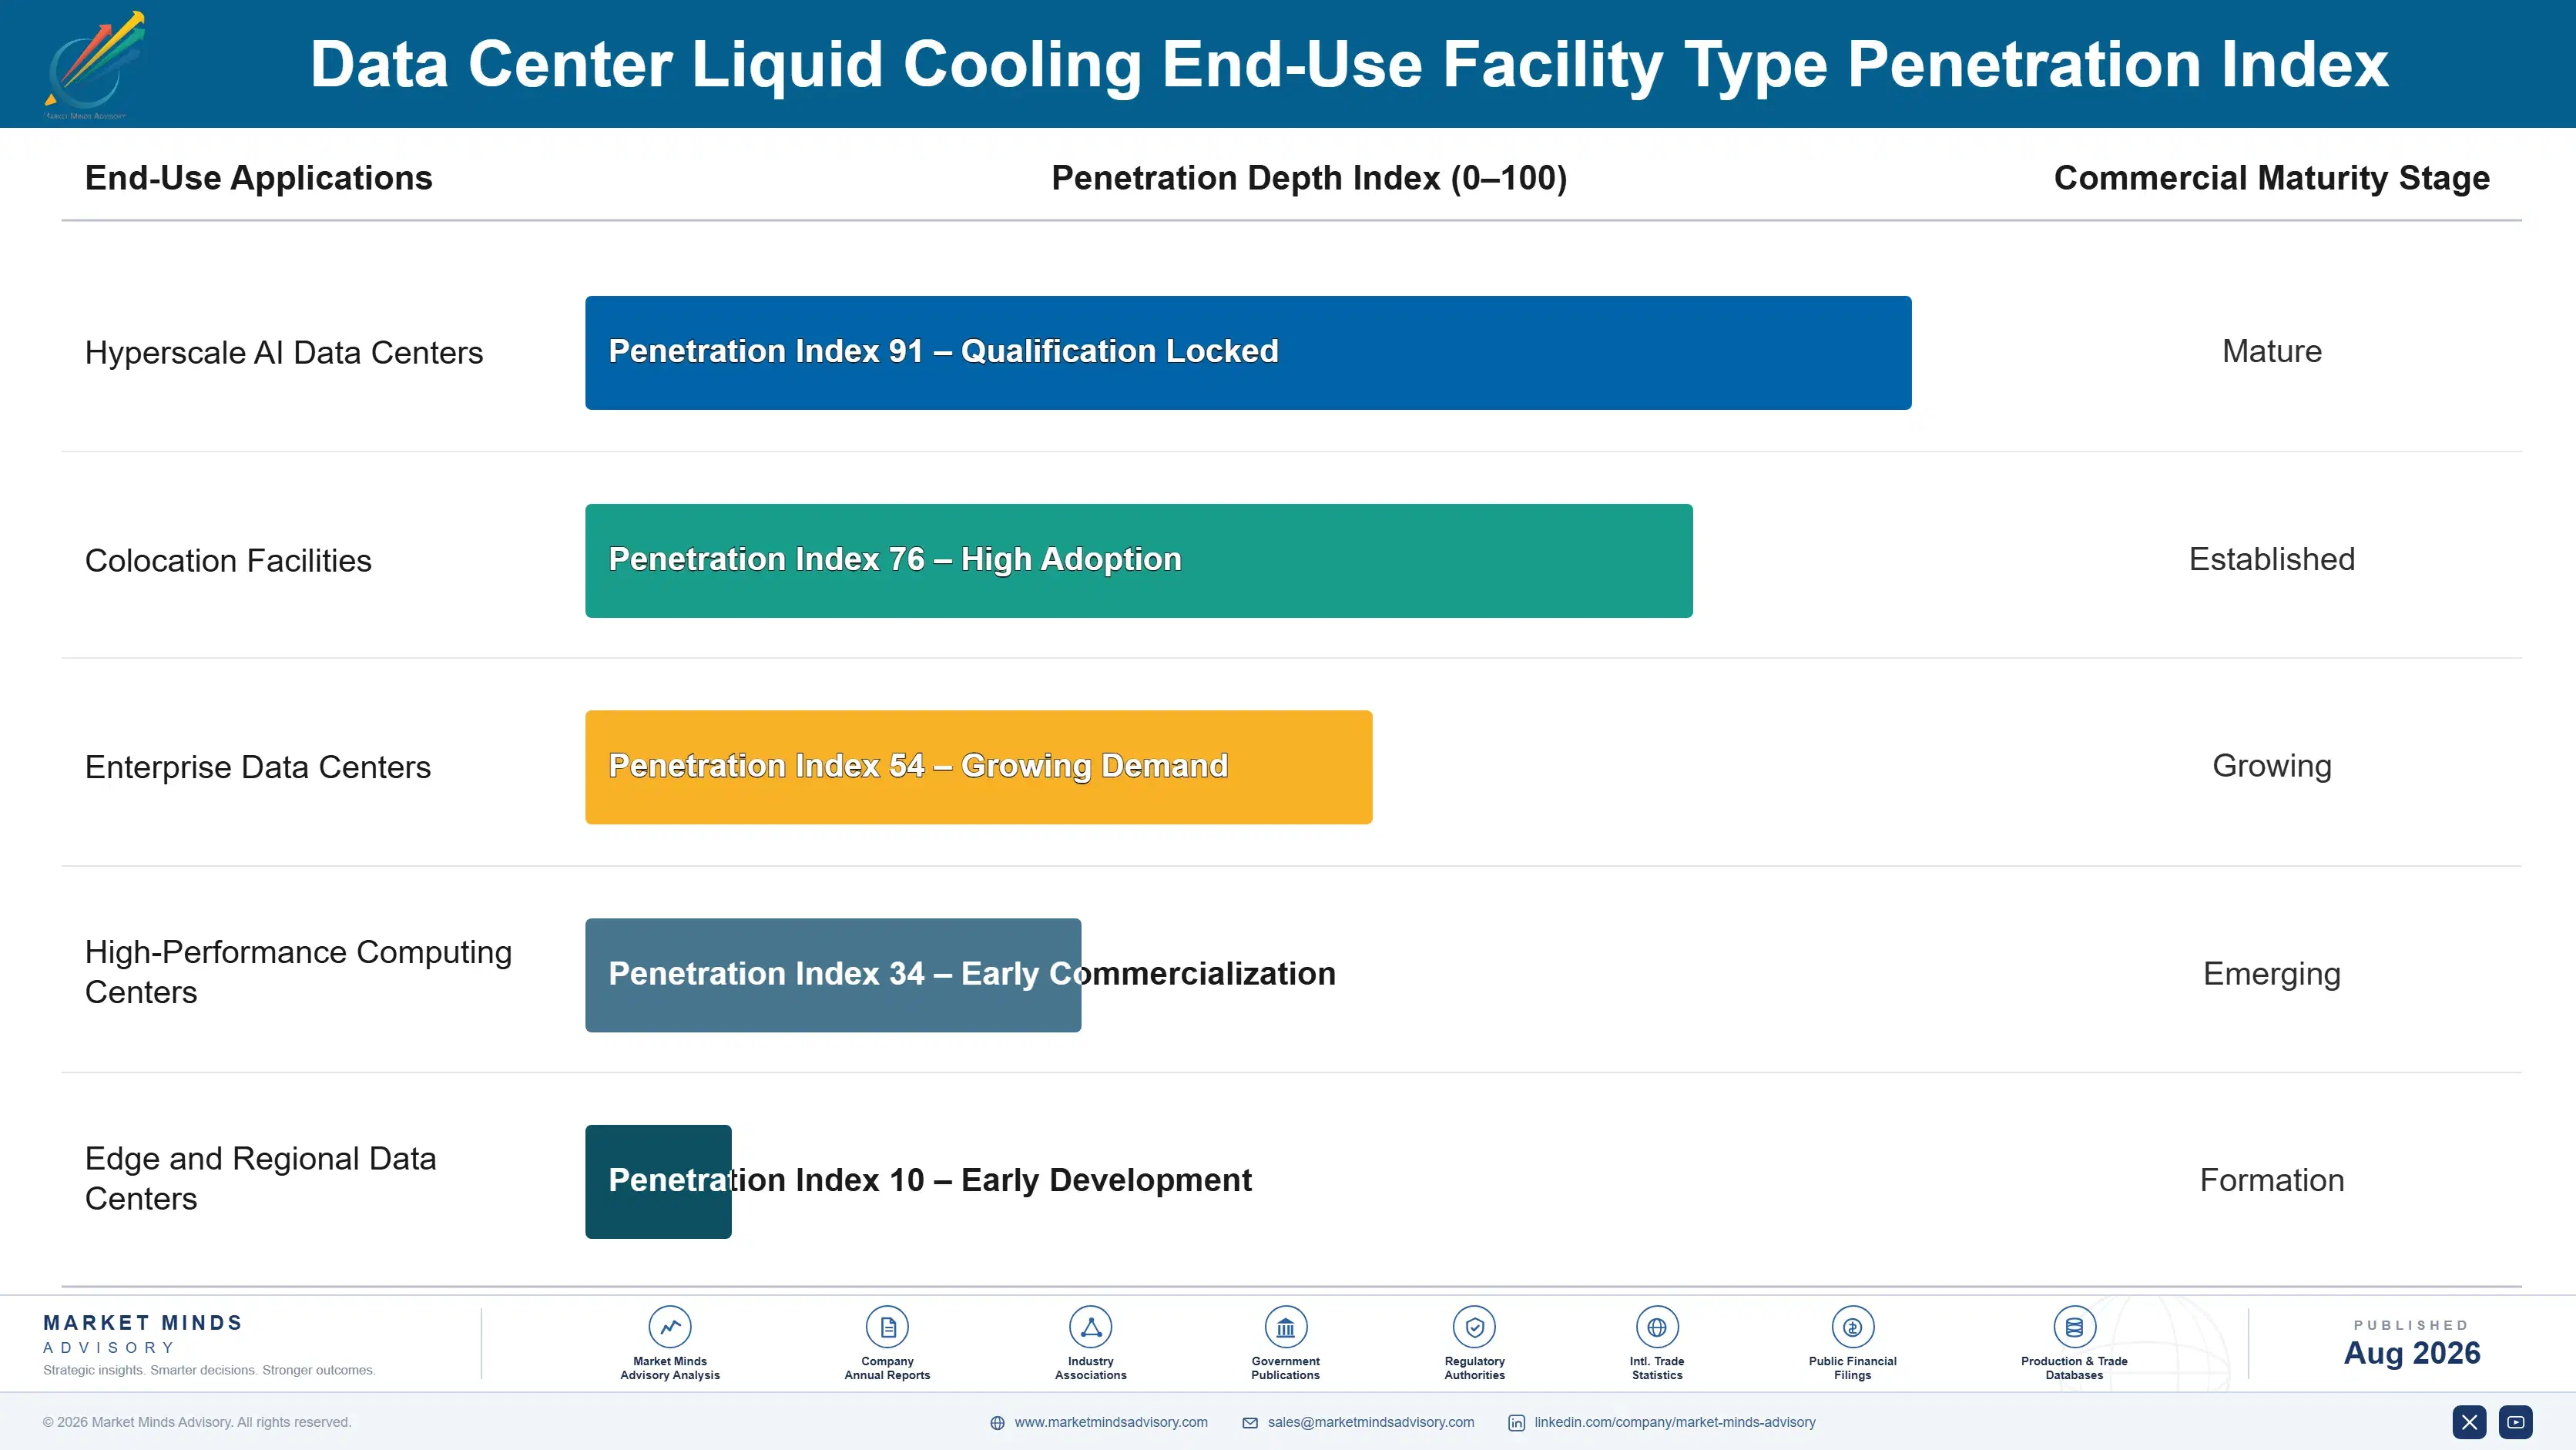
Adoption depth varies sharply by facility type. Hyperscale AI campuses adopt deepest, since extreme rack density leaves no viable air-cooling alternative. Enterprise and colocation facilities adopt more selectively, often starting with rear door heat exchangers before committing to full direct-to-chip conversion. Legacy enterprise data halls adopt slowest, constrained by capital budgets and workloads that do not yet demand the density liquid cooling exists to solve.

Buyer profiles have shifted from facilities managers focused on unit cost toward infrastructure engineering and capacity planning teams who evaluate cooling technology against multi-year accelerator roadmaps set by chip suppliers. Procurement now runs years ahead of construction to secure coolant distribution unit allocation, a planning horizon facilities teams rarely needed under air cooling. Younger data center engineers treat liquid cooling as the default architecture, not an exception needing justification.
data-center-liquid-cooling-market-end-use-penetration-index-1787324282226

Our Call On Liquid Cooling

These are among the four positions where our research anticipates prominent divergence between winners and laggards over the coming forecast period. Each is grounded in the demand model, the regulatory perimeter, and the announced capacity pipeline.
01 / DISTRIBUTION CAPACITY IS KING

Coolant hardware, not chips, now gates deployment speed

Coolant distribution unit lead times of 9 to 14 months now rival chip fabrication timelines, and hyperscalers who secured capacity reservations early are deploying AI infrastructure months ahead of competitors still queued behind them. This is a genuine capacity bottleneck rather than a temporary shortage, since qualified precision manufacturing capacity cannot expand as quickly as demand has grown. Vendors and operators alike should treat distribution unit capacity as a strategic asset worth securing years ahead of need, because the queue, not the technology, decides who actually ships AI capacity first.
02 / CHEMISTRY CHOICE DECIDES ARCHITECTURE

Fluorinated fluid restriction reshapes cooling technology bets

Regulatory restriction on fluorinated compounds has pushed the market decisively toward water-based cold plate architecture over immersion cooling in new deployments, since cold plates avoid the chemistry uncertainty immersion vendors are still working through. Vendors that qualified alternative chemistries early are capturing the immersion demand that regulatory uncertainty would otherwise have suppressed entirely. Operators evaluating cooling architecture today should weight chemistry regulatory status as heavily as thermal performance, because a technically superior fluid facing restriction offers no long-term specification security at all.
03 / RETROFIT IS NO STOPGAP

Existing facilities are a genuine growth channel, not an afterthought

Retrofit demand is growing near 21% yearly, faster than new construction in several major markets, because adding liquid loops to existing air-cooled facilities frequently costs less and deploys faster than building new liquid-native capacity from the ground up. Vendors treating retrofit engineering as a paid, standalone service capture margin that a hardware-only sale leaves on the table entirely. Operators should evaluate retrofit potential before defaulting to new construction, particularly in power-constrained markets where a new grid interconnection queue can stretch years beyond any retrofit timeline.
04 / SERVICEABILITY DECIDES RENEWALS

Downtime avoidance beats sticker price on repeat contracts

Hyperscalers that have absorbed one unplanned downtime event from a poorly serviceable liquid system weight avoided downtime far more heavily than initial hardware price on every subsequent purchase decision they make. Vendors offering component replacement without draining an entire facility loop are winning renewal and expansion contracts even against competitors with lower list prices. Manufacturers should invest in serviceable design now, because the total cost of ownership argument only strengthens as installed liquid cooling capacity accumulates real operating history across the industry.

Engagement Snapshot From the Field

A live engagement with an industry participant carrying material or product regulatory and market exposure ahead of a defining policy shift, showing how our research translates into a defensible multi-year portfolio strategy.
MARKET MINDS ADVISORY · CLIENT ENGAGEMENT SUMMARY
Data Center Liquid Cooling Producer Strategic Portfolio Review and Transition Roadmap 2026·Investment Scenario on Data Center Liquid Cooling Exposure Evaluation 2025-26
CLIENT PROFILE
A regional colocation operator running six air-cooled facilities across two countries engaged MMA as AI tenant demand began exceeding what its existing power and cooling infrastructure could support. The client reported facility utilisation near 91% and a tenant waiting list requesting liquid-cooled capacity the company reported it could not yet offer at any of its sites (client-reported, unverified by MMA).
STRATEGIC CHALLENGE
Leadership was evaluating a full new-build facility against retrofitting existing sites, with capital committee support leaning toward new construction as the cleaner path. Retrofit had been dismissed early as too disruptive to paying tenants already in the halls under consideration. Meanwhile competing operators in the same metro areas were already marketing liquid-ready capacity, pressuring a timeline the client had assumed it could take more slowly.
MMA APPROACH
MMA modelled retrofit cost and deployment timeline against new construction across the client's six sites individually, incorporating current coolant distribution unit lead times rather than the client's earlier and more optimistic internal assumptions. We assessed phased retrofit sequencing that isolated construction disruption from occupied tenant space. We then benchmarked the client's competitive position against colocation operators already marketing liquid-ready capacity in the same metro markets.
KEY FINDINGS
  1. Phased retrofit across three of the six sites modelled deployment 14 months faster than new construction, primarily by avoiding land acquisition and grid interconnection queue delays entirely.
  2. Coolant distribution unit lead times of roughly 11 months meant even the fastest new-build path could not deliver liquid-cooled capacity before competitors already placing orders (client-reported, unverified by MMA).
  3. Tenant disruption from phased retrofit sequencing was containable to under 8% of occupied floor space at any single point in the construction schedule.
  4. The addressable tenant waiting list represented an estimated USD 47 million in annual recurring revenue the client was not currently positioned to capture at all.
CLIENT PROFILE
A regional colocation operator running six air-cooled facilities across two countries engaged MMA as AI tenant demand began exceeding what its existing power and cooling infrastructure could support. The client reported facility utilisation near 91% and a tenant waiting list requesting liquid-cooled capacity the company reported it could not yet offer at any of its sites (client-reported, unverified by MMA).
STRATEGIC CHALLENGE
Leadership was evaluating a full new-build facility against retrofitting existing sites, with capital committee support leaning toward new construction as the cleaner path. Retrofit had been dismissed early as too disruptive to paying tenants already in the halls under consideration. Meanwhile competing operators in the same metro areas were already marketing liquid-ready capacity, pressuring a timeline the client had assumed it could take more slowly.
MMA APPROACH
MMA modelled retrofit cost and deployment timeline against new construction across the client's six sites individually, incorporating current coolant distribution unit lead times rather than the client's earlier and more optimistic internal assumptions. We assessed phased retrofit sequencing that isolated construction disruption from occupied tenant space. We then benchmarked the client's competitive position against colocation operators already marketing liquid-ready capacity in the same metro markets.
KEY FINDINGS
  1. Phased retrofit across three of the six sites modelled deployment 14 months faster than new construction, primarily by avoiding land acquisition and grid interconnection queue delays entirely.
  2. Coolant distribution unit lead times of roughly 11 months meant even the fastest new-build path could not deliver liquid-cooled capacity before competitors already placing orders (client-reported, unverified by MMA).
  3. Tenant disruption from phased retrofit sequencing was containable to under 8% of occupied floor space at any single point in the construction schedule.
  4. The addressable tenant waiting list represented an estimated USD 47 million in annual recurring revenue the client was not currently positioned to capture at all.
RECOMMENDED STRATEGY
Phase 1: Phase 1 (0 to 3 months): Place coolant distribution unit orders immediately across all three prioritised sites to enter vendor production queues. Phase 2: Phase 2 (3 to 14 months): Execute phased retrofit construction sequenced to contain tenant disruption within the modelled threshold at each site. Phase 3: Phase 3 (14 to 20 months): Commission liquid-cooled capacity across all sites and convert the existing tenant waiting list into signed contracts.
OUTCOME
The client redirected capital from the planned new-build toward phased retrofit across three priority sites and placed coolant distribution unit orders immediately to secure production queue position. Early tenant conversion tracked ahead of the modelled revenue capture, and the retrofit approach preserved capital the new-build path would have required upfront (client-reported, unverified by MMA).

Frequently Asked Questions

Foundational context covering the market sizes, CAGR, scope, country, region and competition that inform every finding below. This section is provided to cover basics and most often pre-purchase conversations, answered from the MMA Primary Research Dataset.

What is the current size of the Data Center Liquid Cooling Market?

The global data center liquid cooling market is valued at USD 8.4 billion in 2025, covering cold plates, immersion systems, rear door heat exchangers, coolant distribution units, and cooling fluids. General air cooling and building-level chillers are excluded.

How large will the Data Center Liquid Cooling Market be by 2036?

The market is forecast to reach USD 49.51 billion by 2036 in the base case, about 5.02 times the 2026 level. That represents incremental value of roughly USD 39.64 billion across the decade.

What is the CAGR for the Data Center Liquid Cooling Market 2026 to 2036?

The market grows at a 17.5% CAGR in the base case, with bull and bear scenarios at 18.8% and 16.2%. The spread turns mainly on accelerator power density growth and how fast fluid chemistry regulation resolves.

Which segment is growing fastest?

Direct-to-chip cold plate systems grow fastest at 23.4%, about 1.34 times the overall rate, as hyperscalers standardise on cold plates for GPU racks. Coolant distribution units and manifolds follow at 20.8%.

Who are the major companies in the Data Center Liquid Cooling Market?

Leading companies include Vertiv, Schneider Electric, nVent Electric, CoolIT Systems, and Boyd Corporation. Concentration remains modest at CR5 of 48%, reflecting a market still young enough for specialists to compete against diversified giants.

Which country is growing fastest?

Malaysia grows fastest at a 24.5% CAGR, as new hyperscale campuses in the Johor corridor come online liquid-cooled from the outset. China follows on domestic AI investment and component manufacturing proximity.

Report Segmentation Architecture

The full report scope spans multiple orthogonal segmentation dimensions, with cross-tabulated demand data provided for each dimension pair. Coverage extends further to regional breakdowns, trend trajectories, and the competitive detail needed to support segment-level decision-making.

By Cooling Technology Type

  • Direct-to-Chip Cold Plate Cooling Systems
  • Immersion Cooling Systems
  • Rear Door Heat Exchangers
  • Coolant Distribution Units and Manifolds
  • Liquid Cooling Fluids and Dielectrics
  • Retrofit and Integration Services

By End-Use Facility Type

  • Hyperscale AI Data Centers
  • Colocation Facilities
  • Enterprise Data Centers
  • High-Performance Computing Centers
  • Edge and Regional Data Centers

By Commercial Dimension

  • New Construction Deployment
  • Retrofit Deployment
  • Maintenance and Service Contracts
  • Fluid and Consumable Supply

By Region

  • North America
  • Western Europe
  • East Asia
  • South Asia and Pacific
  • Latin America
  • Middle East and Africa
  • Eastern Europe

Scope, Methodology, and Coverage

Every figure in this report is reproducible from documented input assumptions. The scope below maps the historical period, the forecast horizon, the segmentation dimensions, and the countries covered, alongside the underlying primary and qualitative methodology.
Historical Period
2020 to 2025
Forecast Period
2026 to 2036
Base Year
2025 (USD billions; MMA Primary Research Dataset, August 2026)
Market Definition
The data center liquid cooling market comprises equipment and fluids used to remove heat from IT hardware using liquid media, valued at manufacturer revenue from hardware, fluids, and directly attached engineering and maintenance services. It spans direct-to-chip cold plate systems, single-phase and two-phase immersion systems, rear door heat exchangers, coolant distribution units and manifolds, and dielectric and water-based coolant fluids. General air-based CRAC and CRAH cooling equipment, building-level chillers and cooling towers sold independently of the liquid loop, general facility construction, and IT hardware itself are excluded.
Quantitative Units
USD billions (current prices); deployed liquid-cooled rack capacity where applicable
Segmentation Dimensions
By Cooling Technology Type; By End-Use Facility Type; By Commercial Dimension; By Region
Regions Covered
North America, Western Europe, East Asia, South Asia and Pacific, Latin America, Middle East and Africa, Eastern Europe
Countries Covered
USA, China, Germany, France, UK, Japan, South Korea, India, Australia, Canada, Brazil, Mexico, Indonesia, Vietnam, Thailand, Malaysia, UAE, Saudi Arabia, South Africa, Nigeria, Turkey, Poland, Netherlands, Italy, Spain, Sweden, Switzerland, Argentina, Colombia, Singapore, and additional markets relevant to this sector
Key Companies Profiled
Vertiv, Schneider Electric, nVent Electric, CoolIT Systems, Boyd Corporation, Asetek, LiquidStack, Submer, Green Revolution Cooling, Munters, STULZ, Motivair, Iceotope, JetCool Technologies, ZutaCore, Chilldyne, Delta Electronics, Envicool, Midas Immersion Cooling, Wiwynn
Quantitative Methodology
Primary survey, n=3,800 respondents, Q4 2025, six countries; demand-side model with trade association cross-validation
Qualitative Methodology
47 expert interviews, Q4 2025; applied to validate demand model assumptions, identify emerging dynamics, and assess competitive positioning
Report Format
PDF and XLSX data workbook (Word format preview document)
Publisher
Market Minds Advisory
Report Code
MMA-2026-TEC-207
Published
August 2026
Contact
sales@marketmindsadvisory.com | www.marketmindsadvisory.com

Purchase the full Data Center Liquid Cooling Market Report (2026 to 2036).

The full MMA Data Center Liquid Cooling report sizes the market across six cooling technology categories, five facility types, four commercial dimensions, and seven regions through 2036. It profiles 20 companies on a consistent liquid cooling revenue basis, scoring each on coolant distribution manufacturing capacity, fluid chemistry qualification status, and hyperscale deployment references. Scenario models quantify how accelerator power density growth, fluorinated fluid regulation, and retrofit economics move both deployed capacity and achievable margin by technology category. The report also includes coolant distribution lead time tracking, fluid chemistry regulatory timeline analysis, and retrofit-versus-new-build cost modelling for infrastructure and capital planning teams.
Six-category and four-dimension market sizing to 2036
Twenty-company benchmark on liquid cooling revenue basis
Coolant distribution unit lead time and capacity tracking
Fluorinated fluid regulatory timeline and chemistry transition analysis
Retrofit-versus-new-build cost and deployment speed modelling
Hyperscale accelerator power density roadmap correlation analysis

Built For The People Who Decide

From boardroom strategy to bench-side execution, this report is read cover-to-cover by leaders shaping the next decade of their industry, turning demand scenarios, market dynamics and valuation benchmarks into decisions.
CXOs/ Presidents/ VPs/ Managers
M&A and Corporate Development
Strategy Teams and R&D Heads
Procurement and Product Directors
Regulatory and Compliance Leaders
Investor Relations and Equity Analysts