Market Minds Advisory
Data Center Direct-to-Chip Coolant Fluids Market

Data Center Direct-to-Chip Coolant Fluids Market: Data Center Direct-to-Chip Coolant Fluids: Commodity Chemistry, Catastrophic Failure Risk and the Supply Gap Left by a PFAS Exit

Coolant is under one percent of a liquid cooling budget and carries nearly all of its failure risk, and the withdrawal of incumbent fluorinated fluids forced an unplanned requalification across the whole industry.

Lead Analyst

Published

September 2026

Make Smarter Decisions with Customized Research Insights

Request a free sample report and evaluate market opportunities, growth trends, and competitive dynamics relevant to your business needs.

2025 MARKET VALUE$0.3BMarket Size 2025
2036 FORECAST VALUE$1.8BBase Case , 2026 to 2036
CAGR 2026 TO 203617.8 %Bull 19.0% / Bear 16.4%
INCREMENTAL OPPORTUNITY$1.4BNet 10- year value creation
EXPANSION MULTIPLE5.14x2036 value over 2026 base
Strategic Levers
M&A Pipeline
Regional Outlook
Country Rankings
Competitive Intelligence
Segmental Deep-dive
Call-Us : 91 93563 13602

Executive Snapshot and Market Trajectory.

The fluid is roughly 0.8% of what a direct-to-chip cooling system costs and close to 100% of what can go wrong with it. That asymmetry, rather than any chemistry, is what governs how this market behaves commercially. Everything else here follows from that.
Most of the volume is unglamorous. About 81% of deployed fluid is inhibited water and glycol, a chemistry the automotive industry has used for decades, while the industry conversation concentrates on dielectrics that account for a small fraction of litres. Single-phase dielectric fluids grow fastest at 26.7%, half again the market rate of 17.8%. North America takes 46% because that is where the accelerated capacity is being built. Chemistry is almost beside the point commercially.
Concentration sits near 58% across the top five on measured fluid supply revenue, and the field is being reshaped by a supply withdrawal rather than by competition. The exit of fluorinated fluids removed the incumbent dielectric option and forced operators into requalification programmes nobody had budgeted. Qualification, not price, is what decides these accounts now. Nobody wins these accounts on price per litre any longer. Qualification history outweighs everything else.
Market Definition
This market covers engineered heat transfer fluids formulated for or supplied into direct-to-chip liquid cooling of data centre information technology equipment, spanning propylene and ethylene glycol water blends, deionised and treated water formulations, single-phase and two-phase dielectric fluids, and hybrid low-conductivity specialty blends. Revenue is measured as fluid supply value including attributable conditioning services. Immersion cooling fluids, facility chilled water treatment chemicals, refrigerants in chiller circuits, and cold plate, manifold and distribution hardware are excluded.
Base Year Value
$0.3B in 2025 (MMA Primary Research Dataset, September 2026)
Forecast Period
2026 to 2036, eleven discrete annual values
CAGR
17.8% base case. Bull 19.0%. Bear 16.4%.
Fastest Growth Segment
Single-Phase Dielectric Fluids: 26.7% CAGR
Fastest Growth Country
Malaysia: 24.6% CAGR
Fastest Growth Region
South Asia and Pacific: 20.2% CAGR
Largest Region
North America: 46% of 2025 global value
Market Leaders
Dow, Castrol, Chemours, Clariant and Arteco lead on measured direct-to-chip coolant fluid supply revenue. Source: MMA Primary Research Dataset, July 2026.
Primary Survey
n=3,800 procurement and R&D decision-makers, Q4 2025, six countries
Methodology
Demand-side build-up, cross-validated against public data, 47 expert interviews

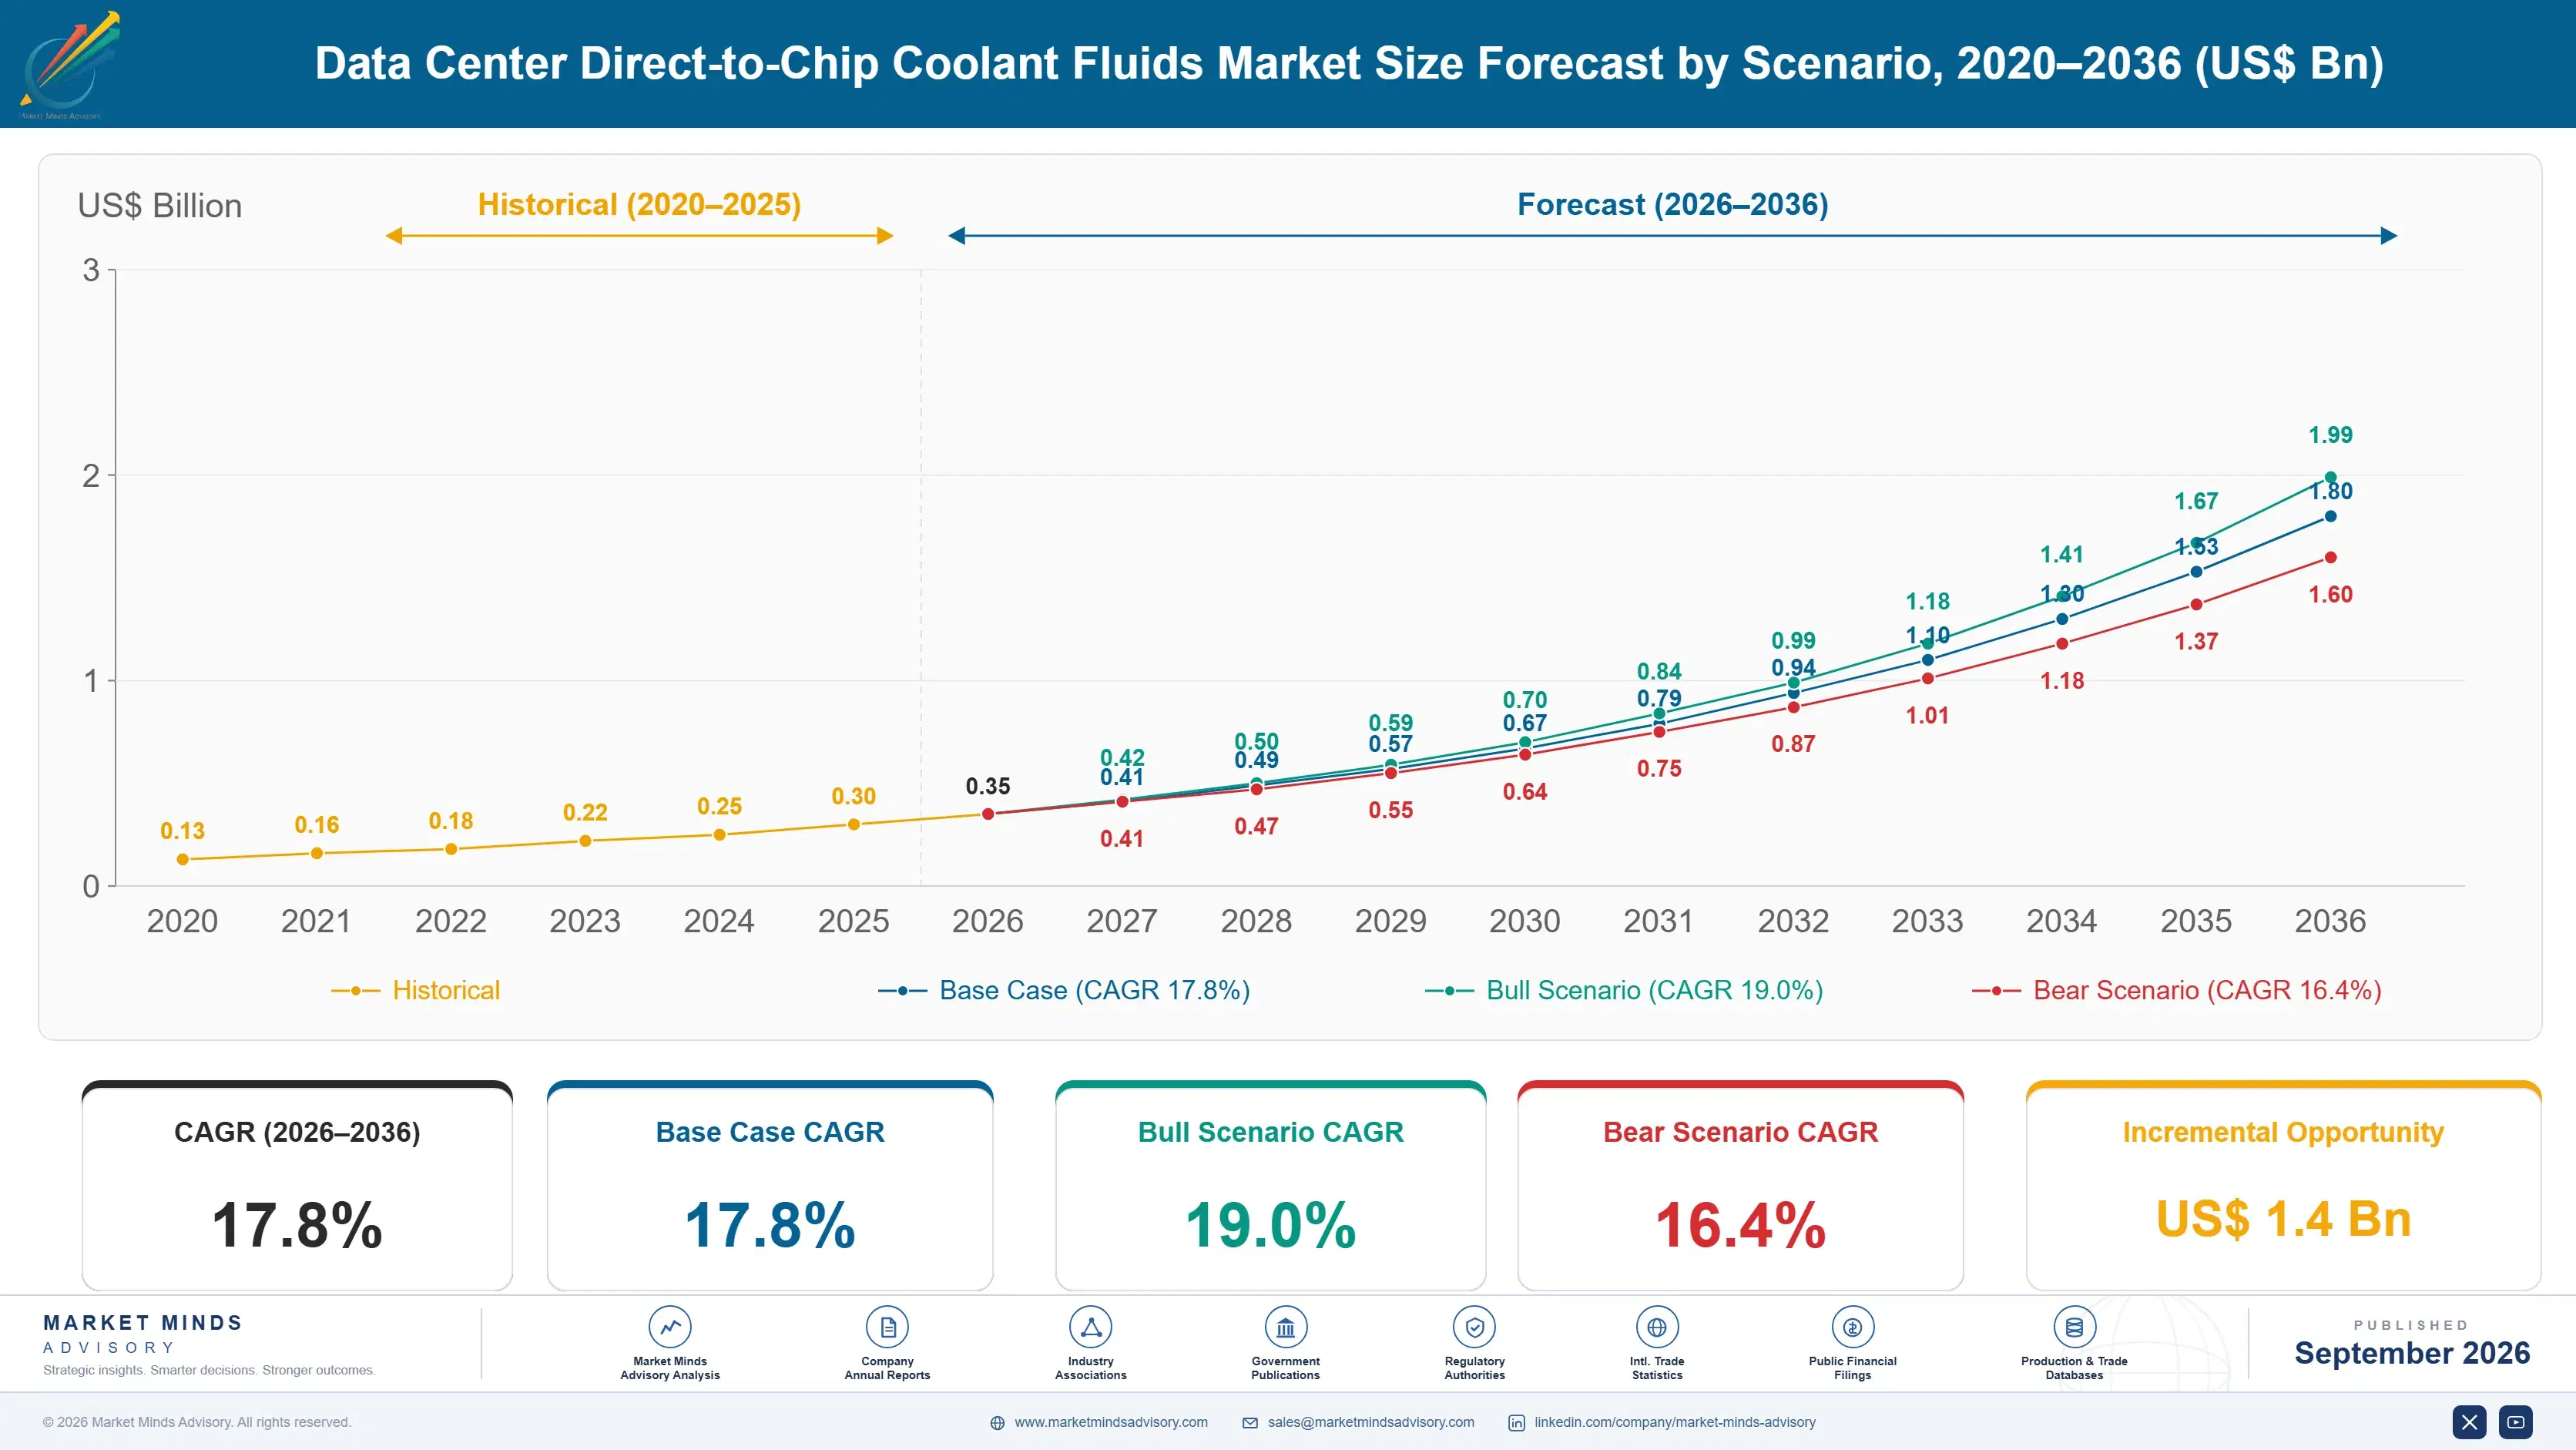
Data Center Direct-to-Chip Coolant Fluids Market Forecast Scenarios

data-center-direct-to-chip-coolant-fluids-market-size-forecast-scenario-1788419593927
The 2020 to 2025 period grew at 16.6% from a base small enough that individual deployments moved the figure. Early volume came from high performance computing installations and a handful of hyperscale pilots, and most of it used chemistry adapted from automotive and industrial process cooling. Accelerated computing changed that in 2024, when rack densities left air cooling behind.
The base case at 17.8% rests on three mechanisms. Accelerator thermal design power has passed the point where air cooling is practical at rack level, which makes liquid cooling a requirement on new builds. Fluid volumes scale with installed cooling capacity and then generate roughly 9% annual top-up demand through leakage, sampling and maintenance. Third, the withdrawal of fluorinated dielectric fluids created a requalification cycle that is pulling forward purchasing decisions across a large installed base.
The bull case at 19.0% assumes two-phase cooling reaches volume deployment rather than remaining in demonstration, which would multiply dielectric fluid consumption per rack. The bear case at 16.4% is that operators standardise almost entirely on inhibited water and glycol, which is cheap, well understood and adequate. That is the likelier outcome, and it caps value even as volumes grow.

A Cheap Fluid Carrying Expensive Consequences

Nobody buys coolant on price and almost nobody says so out loud. The fluid represents around 0.8% of what a direct-to-chip cooling installation costs, while the equipment it circulates through holds accelerators worth tens of thousands each and a warranty depending on nothing leaking or corroding. A procurement conversation that opens on cost per litre is being held by somebody who has not yet had a failure.
TOP FIVE CONCENTRATION58%Moderately concentrated among specialty chemical and lubricant suppliers
FLUID SHARE OF CAPEX0.8%Portion of a cooling system budget spent on fluid
WATER GLYCOL VOLUME SHARE81%Majority of deployed volume uses conventional inhibited chemistry
ANNUAL TOP-UP RATE9%Volume replaced each year through leakage and maintenance
COMPATIBILITY PILOT FAILURES14%Share of pilots halted by seal or metal incompatibility
AVERAGE FLUID PRICEUSD 12.40Mean price per litre across all deployed chemistries
The volume story is duller than the industry narrative suggests. Roughly 81% of deployed fluid is inhibited propylene or ethylene glycol in water, chemistry the automotive industry refined decades ago, adjusted for cold plate metals and elastomers. Dielectric fluids attract most of the attention and occupy a small share of litres. They matter because two-phase and certain single-phase applications have no alternative, not because they dominate anything.
What is actually reshaping supply is a withdrawal rather than a competitive move. The exit of fluorinated heat transfer fluids removed the incumbent dielectric option on a defined timetable, and operators standardised on it were left requalifying alternatives against compatibility, performance and stability. Around 14% of pilots halt on seal or metal incompatibility. That failure rate is why qualification history now outweighs almost everything else.
"The uncomfortable truth is that most of this market is antifreeze with a data sheet, and the suppliers who understand that sell fluid management rather than fluid. The ones still pitching thermal conductivity numbers are competing on the one attribute that has never lost anybody an account."
Director, Thermal Management Chemicals Practice · MMA Chemicals and Materials Practice · September 2026

Market Trends

Fluorinated Fluid Withdrawal Forces Unplanned Requalification

The decision by the incumbent supplier to exit fluorinated heat transfer fluids removed the dielectric option that most two-phase and specialist single-phase deployments had standardised on, and it did so on a fixed timetable rather than through gradual substitution. Operators discovered that replacing a fluid means revalidating materials compatibility, thermal performance and stability across an entire installed system. Qualification programmes that nobody budgeted are now running at every major operator. The commercial consequence is that suppliers with completed compatibility data are winning accounts that price competition would never have moved.
Market Impact: Densities exceed 100 kilowatts per rack
Fluid Management Displaces Fluid Supply as the Commercial Unit

Selling litres into a market where the fluid is 0.8% of system cost is a poor business, and suppliers have worked that out. What operators actually want is assurance: chemistry monitoring, inhibitor depletion tracking, particulate and biological control, scheduled sampling and documented top-up. Sold as a managed programme rather than as product, the same volume of fluid carries several times the revenue and renews annually rather than at replacement. It also creates the operating data that makes the next qualification argument, which is where the durable position sits. Litres alone were never a business worth having.
Market Impact: Generates 9% annual replacement volume

Market Opportunities and Growth Drivers

Accelerator Thermal Design Power Removes the Air Cooling Option

Rack power densities on accelerated computing platforms have moved past the point where air cooling is practical at any reasonable facility cost, and the transition happened faster than most operators had planned for. Cold plate cooling is now specified on new accelerated builds as a default rather than an option, which converts fluid from a niche consumable into a scheduled requirement tied to capacity additions. Every megawatt of liquid-cooled capacity carries a fluid charge and a recurring top-up obligation behind it. Deployment pace rather than chemistry preference sets demand. Chemistry preference barely enters into it.
Market Impact: Halts 14% of deployment pilots

Top-Up Demand Creates Recurring Volume From Installed Capacity

Direct-to-chip systems lose fluid through quick disconnect operations, sampling, filter changes, maintenance interventions and slow permeation, and the industry runs at roughly 9% annual replacement of charged volume. That converts an installed base into recurring demand independent of new construction, which is unusual for a chemical sold into capital projects. As the installed base compounds, top-up becomes a larger share of total volume than initial fill. Suppliers holding the original qualification capture that recurring demand almost automatically, since operators rarely change fluid mid-life. Requalification costs far more than any fluid saving could ever recover.
Market Impact: Covers 81% of deployed volume

Market Restraints and Challenges

Materials Compatibility Failures Halt Pilots Repeatedly

Around 14% of direct-to-chip pilots stop on seal swelling, elastomer degradation, metal corrosion or additive depletion rather than on thermal performance. The root cause is that cooling loops assemble components from many suppliers with no single party validating the full materials set against a specific fluid, and incompatibilities appear over months rather than in commissioning tests. Commercially this makes every new fluid a risk nobody wants to carry. Suppliers are mitigating through published compatibility matrices, accelerated ageing programmes and joint validation with cold plate and quick disconnect manufacturers. Joint validation is slow and it is the only real answer.
Market Impact: Affects 100% of fluorinated deployments

Inhibited Water and Glycol Is Adequate and Very Cheap

The most likely long-term outcome for most deployments is conventional chemistry, because it works, costs a fraction of engineered alternatives and carries decades of field history in other industries. The root cause is that direct-to-chip cooling does not require a dielectric fluid at all unless a specific architecture demands it, and most architectures do not. This caps realisable value even as volumes grow strongly. Suppliers respond by competing on inhibitor package performance, monitoring services and qualification support rather than on base chemistry, which cannot be differentiated. Base chemistry itself offers nothing anybody can differentiate on.
Market Impact: Multiplies revenue by 4 times
3 additional market trends, 4 additional growth drivers, and 2 additional restraints and challenges are covered in the full report. Contact sales@marketmindsadvisory.com to access the complete intelligence.

Segment CAGR and Growth Architecture

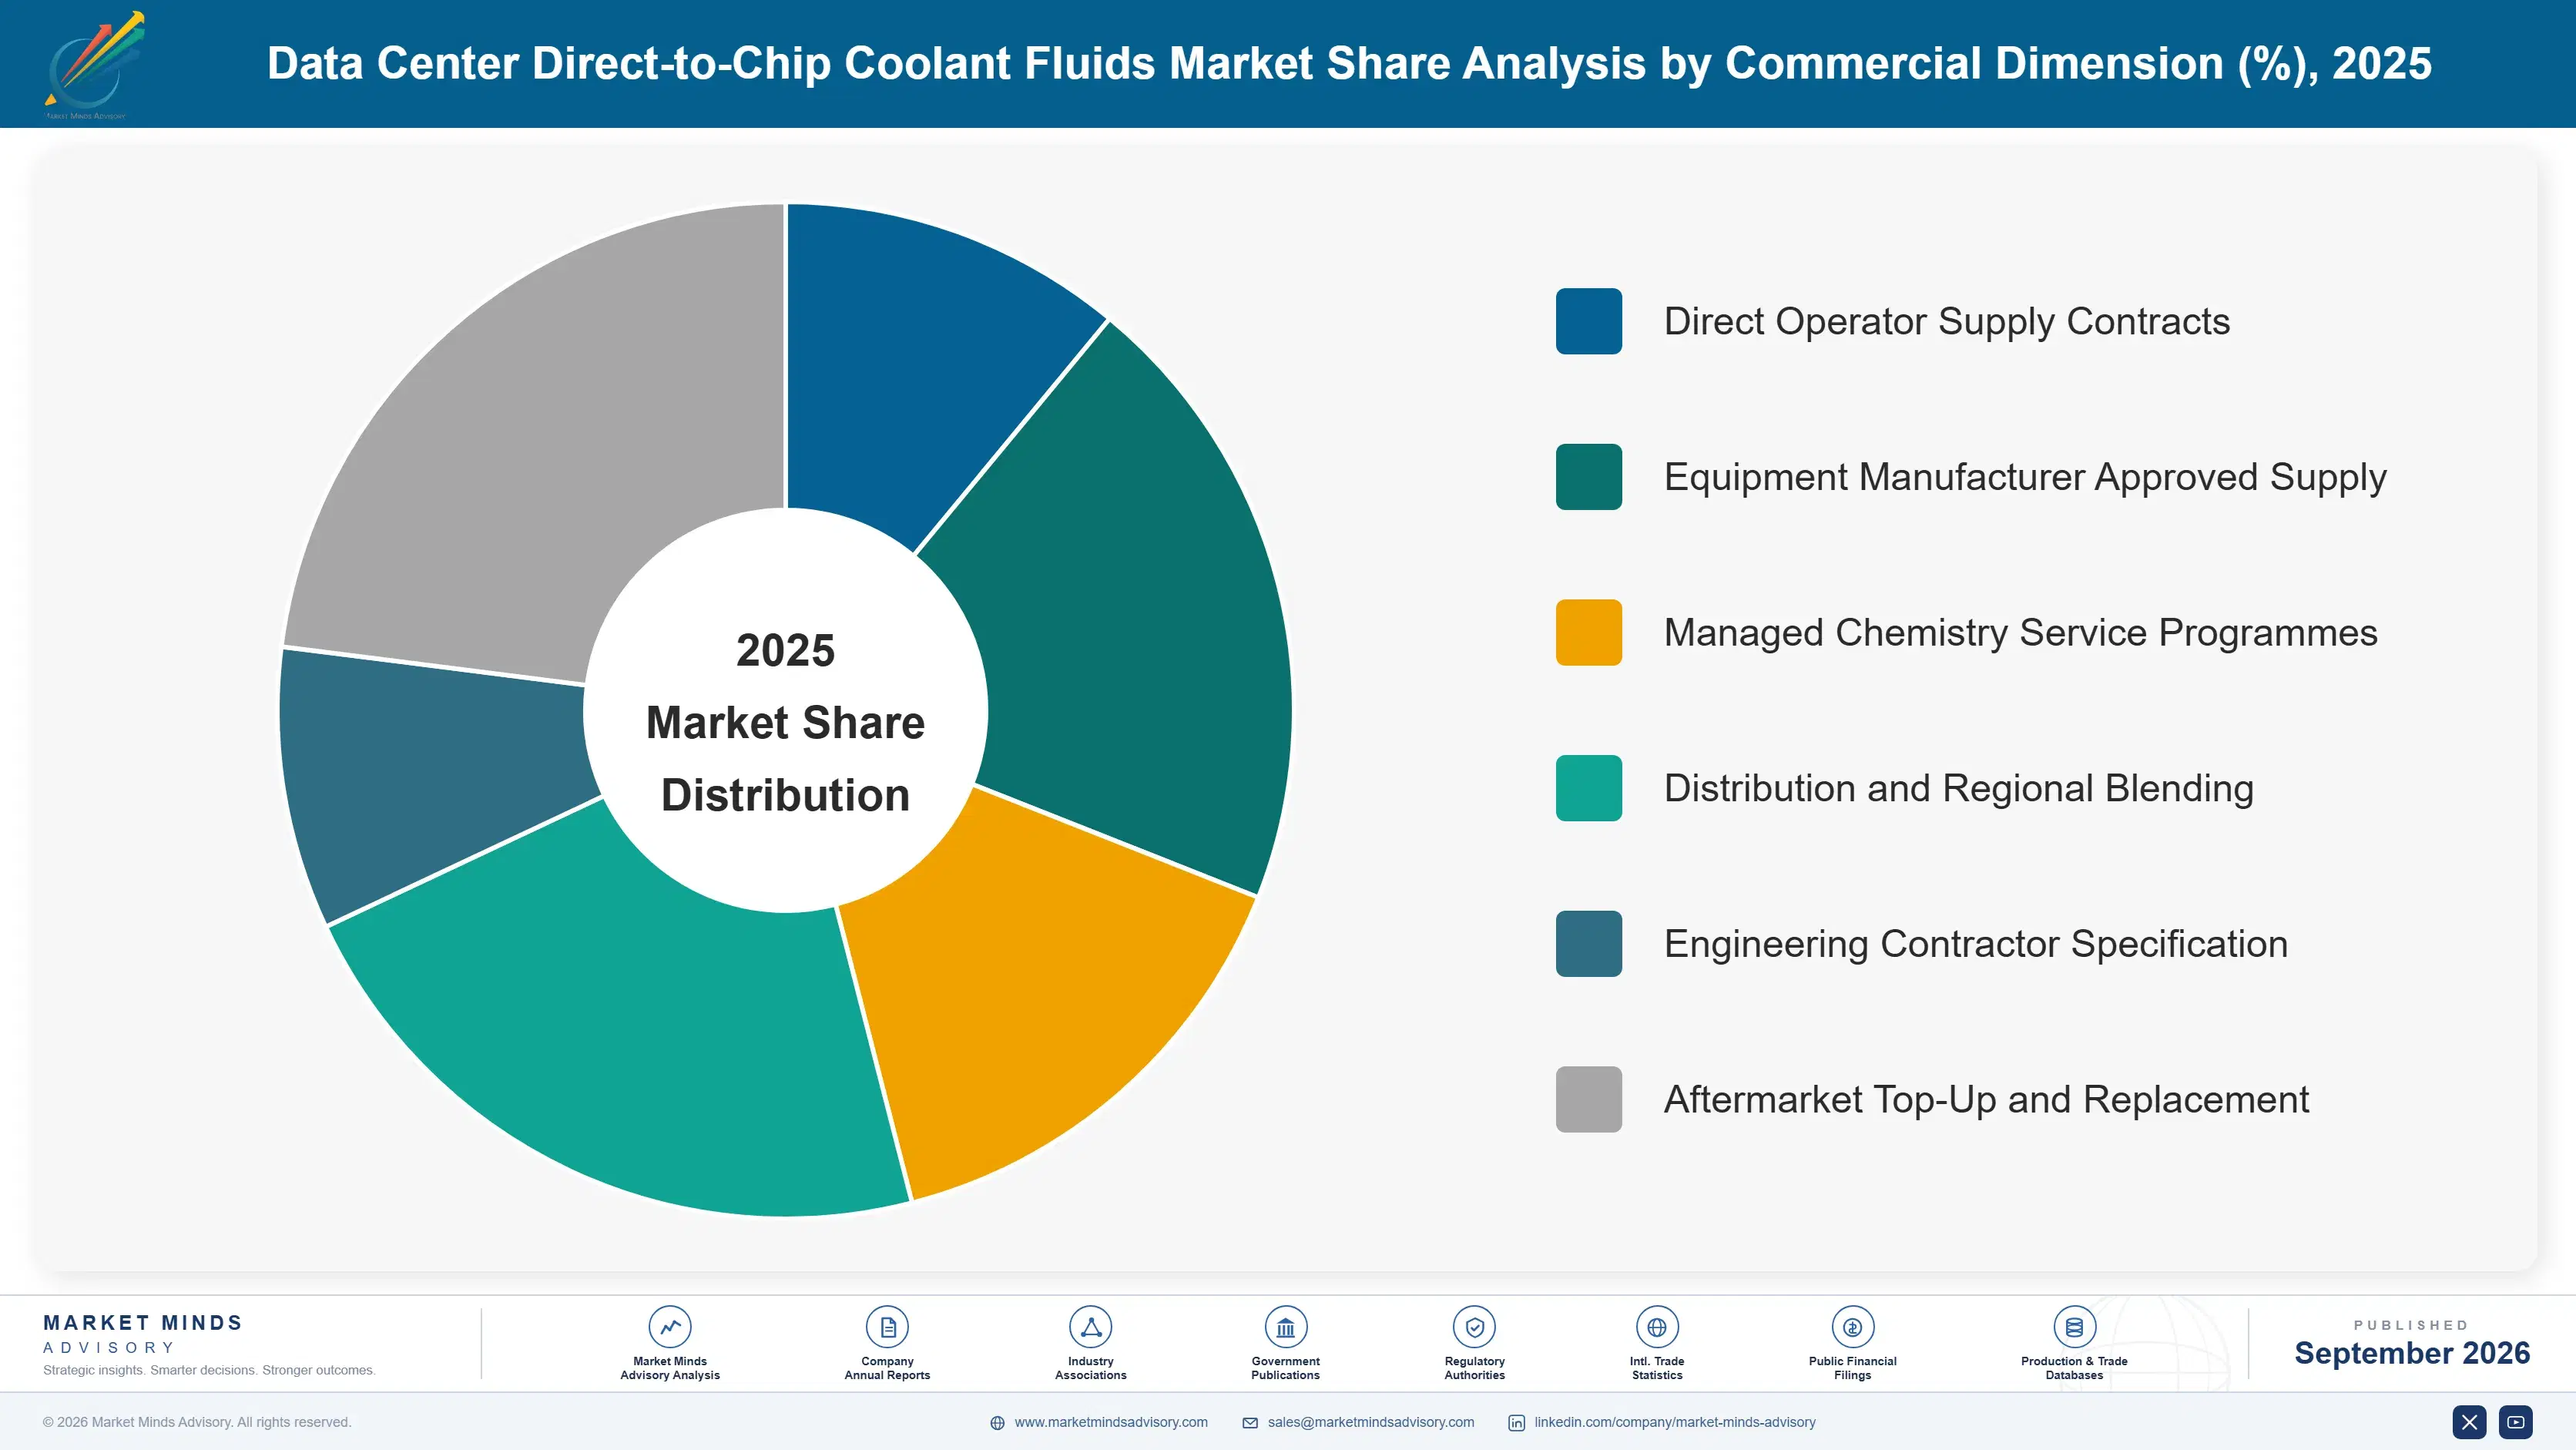
Segmentation follows fluid chemistry, since that determines the manufacturing base, the price point and the qualification burden a supplier must carry. Conventional inhibited chemistry holds the volume while engineered dielectrics hold the growth and the pricing, and the two are effectively separate businesses served by different kinds of company. Different companies serve each of them.
data-center-direct-to-chip-coolant-fluids-market-market-share-analysis-1788419594522

Single-Phase Dielectric Fluids

Single-phase dielectric fluids grow fastest at 26.7%, half again the market rate of 17.8%, driven almost entirely by the requalification cycle following the withdrawal of fluorinated products rather than by any expansion in the applications requiring them. Buyers are operators whose architecture cannot tolerate a conductive fluid near live electronics, which is a genuine engineering constraint rather than a preference. Prices run several times inhibited glycol chemistry and qualification cycles are long, since compatibility must be established across seals, metals and plastics throughout the loop. Hydrocarbon, ester and silicone-based alternatives are all competing for positions the fluorinated incumbent vacated, and none has yet established a clear default. Operators are choosing between unproven options under time pressure.
CAGR 26.7%

Two-Phase Dielectric Fluids

Two-phase fluids exploit latent heat of vaporisation to move far more heat per unit volume, which makes them technically attractive at the highest power densities and commercially difficult everywhere else. Growth at 21.2% comes from a small base and reflects demonstration deployments and a handful of production installations rather than broad adoption. The engineering demands are severe: boiling behaviour, vapour containment, condensate management and long-term fluid stability all have to work together. Fluorinated withdrawal hit this segment hardest of all, since the chemistry options that satisfy the thermodynamic requirements without regulatory exposure are genuinely few and none is inexpensive. Deployment counts remain small enough that individual projects move the segment figures noticeably, which makes forecasting here unusually uncertain.
CAGR 21.2%
Full segment breakdown across 6 segments available in the complete report.

Regional Architecture and Country Demand Map

Demand tracks accelerated computing capacity under construction rather than total data centre floor space. Regions building conventional enterprise capacity buy almost none of this, because air cooling remains entirely adequate at the power densities those workloads produce. Power density decides everything here. Floor space is a poor guide.

North America

North America holds 46%, far above the regional band, and the justification is simple concentration of accelerated capacity: the overwhelming majority of committed high density computing construction is happening in the United States, and liquid cooling follows it directly. Virginia, Texas, Arizona and Georgia account for most of that build. Water scarcity in several of those locations has pushed operators toward closed-loop direct-to-chip designs with higher fluid charges rather than evaporative facility cooling. Equipment warranty and insurance terms specifying coolant chemistry appeared here first, which has made qualification documentation a commercial requirement earlier than elsewhere. Regional growth at 17.0% tracks committed construction closely, and the pipeline visibility here is better than in any other region covered.
Share: 46% | CAGR: 17.0% (2026 to 2036)

East Asia

Chinese hyperscale and state-supported computing investment accounts for most regional demand, and domestic chemical suppliers serve it almost entirely with inhibited glycol chemistry produced locally. Japanese operators buy smaller volumes at higher specification, with a preference for documented long-term stability that reflects conservative facility engineering practice. Korean deployments follow semiconductor and platform investment closely. Taiwanese demand is disproportionate to the island's size because server and cold plate manufacture happens there, which means fluid qualification work is performed regionally even when the equipment ships elsewhere entirely. Regional growth at 19.0% runs ahead of the market on Chinese capacity additions, though domestic suppliers capture most of that volume rather than the international producers profiled here. Japanese specification practice remains notably conservative.
Share: 22% | CAGR: 19.0% (2026 to 2036)
Regional intelligence for 5 additional markets available in the complete report: Western Europe, South Asia and Pacific, Latin America, Middle East and Africa, Eastern Europe. Contact sales@marketmindsadvisory.com.
data-center-direct-to-chip-coolant-fluids-market-country-cagr-analysis-1788419595096

Where Coolant Suppliers Actually Earn

Selling litres of a product that represents 0.8% of system cost is a losing proposition however good the chemistry is. Revenue comes from managing the fluid rather than supplying it, from owning the qualification data that makes a change expensive, and from the recurring top-up demand an installed base generates automatically. Litres are the least valuable part of it.

Sell Managed Chemistry Programmes Not Drums of Fluid

Fluid supply alone is a commodity transaction on a product worth 0.8% of the system it protects. Wrapping it in scheduled sampling, inhibitor depletion tracking, particulate and biological control and documented top-up converts the same volume into a managed programme worth roughly 4 times the fluid revenue, renewing annually rather than at replacement. Operators want the assurance far more than they want the litres. The programme also generates the operating history that supports the next qualification, which compounds the position rather than merely extending it. Assurance is what they are buying throughout.
Market Impact: Multiplies the fluid revenue by roughly 4 times

Own the Compatibility Data Before Competitors Generate It

Around 14% of pilots halt on materials incompatibility, and no operator wants to discover a seal problem eighteen months into a deployment holding accelerators worth tens of thousands each. Suppliers publishing validated compatibility matrices across common cold plate metals, elastomers and quick disconnects win positions that price never moves, and they shorten customer qualification by roughly 7 months. Generating that data requires accelerated ageing programmes and joint work with hardware manufacturers. It is slow, unexciting and the most defensible investment available in this market. Nobody else has finished the work.
Market Impact: Shortens customer qualification by roughly 7 further months

Capture Top-Up Demand at Initial Fill

Installed systems consume roughly 9% of charged volume annually through disconnects, sampling and maintenance, and operators almost never change fluid mid-life because requalification is expensive and risky. That makes the initial fill decision worth far more than the initial order, since it captures a decade of recurring demand at negligible competitive exposure. Suppliers pricing aggressively on first fill to secure the position outperform those maximising the opening transaction. Distribution and stocking arrangements close to major capacity clusters are what convert the position into actual recurring revenue. First fill decides a decade of supply.
Market Impact: Secures roughly 9% of annual recurring replacement volume

Position Against Warranty and Insurance Requirements

Equipment warranties and facility insurance terms now name acceptable coolant chemistries in roughly 38% of cases, which relocates the purchasing decision from facilities procurement to risk management. That buyer is materially less price sensitive and considerably more interested in certification records, sampling documentation and chemistry traceability. Suppliers who engage equipment manufacturers and insurers directly get named in the terms rather than competing against them afterwards. This is relationship work with parties who never buy the product themselves, which most chemical sales organisations are not structured to do. Insurers and equipment makers never buy the fluid themselves.
Market Impact: Now named in 38% of current warranty terms

Who Controls the Margin Pool

Concentration sits near 58% across the top five on measured fluid supply revenue, reflecting a market where established glycol and specialty producers hold volume while smaller formulators compete on service depth. The gap between leaders and challengers is one of manufacturing scale and distribution rather than formulation capability, since inhibited glycol chemistry is well understood and differentiation sits in the additive package and surrounding support.
Competition runs on three dimensions rather than on thermal properties. Qualification data breadth is first and decisive, since 14% of pilots fail on compatibility and operators buy whoever answered that already. Second is service infrastructure: sampling, analysis and top-up logistics close to capacity clusters. Third is manufacturing position on base chemistry, which determines whether a supplier can compete in the 81% of conventional volume.

Two forces are reshaping the field. The withdrawal of fluorinated fluids opened dielectric positions that hydrocarbon, ester and silicone formulators are all contesting, and no default has emerged, which is temporary. Meanwhile cooling equipment manufacturers are specifying or supplying fluid alongside hardware, capturing the fill decision before any chemical supplier reaches the operator. Rankings will move toward suppliers holding compatibility data and equipment maker relationships.
data-center-direct-to-chip-coolant-fluids-market-company-positioning-matrix-1788419595661

Competitive Moat and Risk Dimensions

DOW

Moat: Glycol manufacturing and formulation scale

Dow produces the base glycols underpinning the majority of deployed volume and formulates finished heat transfer fluids with decades of inhibitor package development behind them. That integration gives cost position in the 81% of volume that conventional chemistry serves. Established industrial heat transfer relationships transfer usefully here, including field data no newer entrant holds.
DOW

Risk: Limited dielectric fluid position

The company's strength sits in glycol and water-based chemistry rather than in the dielectric fluids that carry the fastest growth and the highest prices after the fluorinated withdrawal. Building a dielectric position means competing against specialty fluorochemical and silicone producers on their own base. Operators buying both chemistries increasingly prefer a single qualified supplier.
CASTROL

Moat: Dedicated thermal management product line

Castrol built a direct-to-chip coolant range specifically for this application rather than adapting industrial fluids, and it has invested in compatibility validation with cold plate and quick disconnect manufacturers ahead of demand. That positions it as a specified fluid rather than an accepted one. Lubricant distribution infrastructure reaches capacity clusters with logistics specialty formulators cannot match.
CASTROL

Risk: Base chemistry cost disadvantage

The company buys rather than produces the base glycols and synthetic fluids underpinning its formulations, which leaves it permanently behind integrated chemical producers on cost in the highest volume conventional chemistry. Its advantage depends on qualification depth outweighing price, which holds while operators value assurance. A shift toward commodity purchasing would erode it quickly.

Players Tracked

Prominent Players

Dow
Castrol
Chemours
Clariant
Arteco

Other Key Players

Shell
ExxonMobil
TotalEnergies
Lubrizol
Dober
Kurita Water Industries
Veolia Water Technologies
Recochem
Solvay
Engineered Fluids
M&I Materials
Cargill
Fuchs
Idemitsu Kosan
ENEOS

Recent Developments

DECEMBER 2025

Incumbent supplier completes withdrawal from fluorinated heat transfer fluids

The scheduled exit from manufacture of fluorinated heat transfer fluids concluded, removing products that two-phase and specialist single-phase deployments had standardised on. Operators had been given several years of notice, though requalification programmes at many sites began considerably later than that notice period allowed for.
Signal: A supply withdrawal rather than any competitive move is what reordered positions across the dielectric part of this market.
JUNE 2025

Cooling equipment manufacturers begin specifying approved coolant chemistries

Several cold plate and coolant distribution unit manufacturers published approved fluid lists as a condition of equipment warranty, naming specific formulations rather than generic chemistry classes. The lists were developed through joint validation programmes with fluid suppliers rather than through any acquisition or equity arrangement.
Signal: Equipment makers now hold the fill decision, which moves the commercial relationship one step away from the operator.
MARCH 2025

European regulators advance restriction proposals covering fluorinated substances

Restriction proposals covering broad classes of fluorinated substances progressed through European regulatory assessment, with heat transfer applications among the uses under consideration. Derogation scope for data centre cooling remained unresolved, leaving operators planning on the assumption that alternatives will be required regardless. Timetables extend across several years.
Signal: Regulatory direction rather than availability is now driving dielectric chemistry selection across European deployments and beyond.

What Sits Inside Coolant Pricing

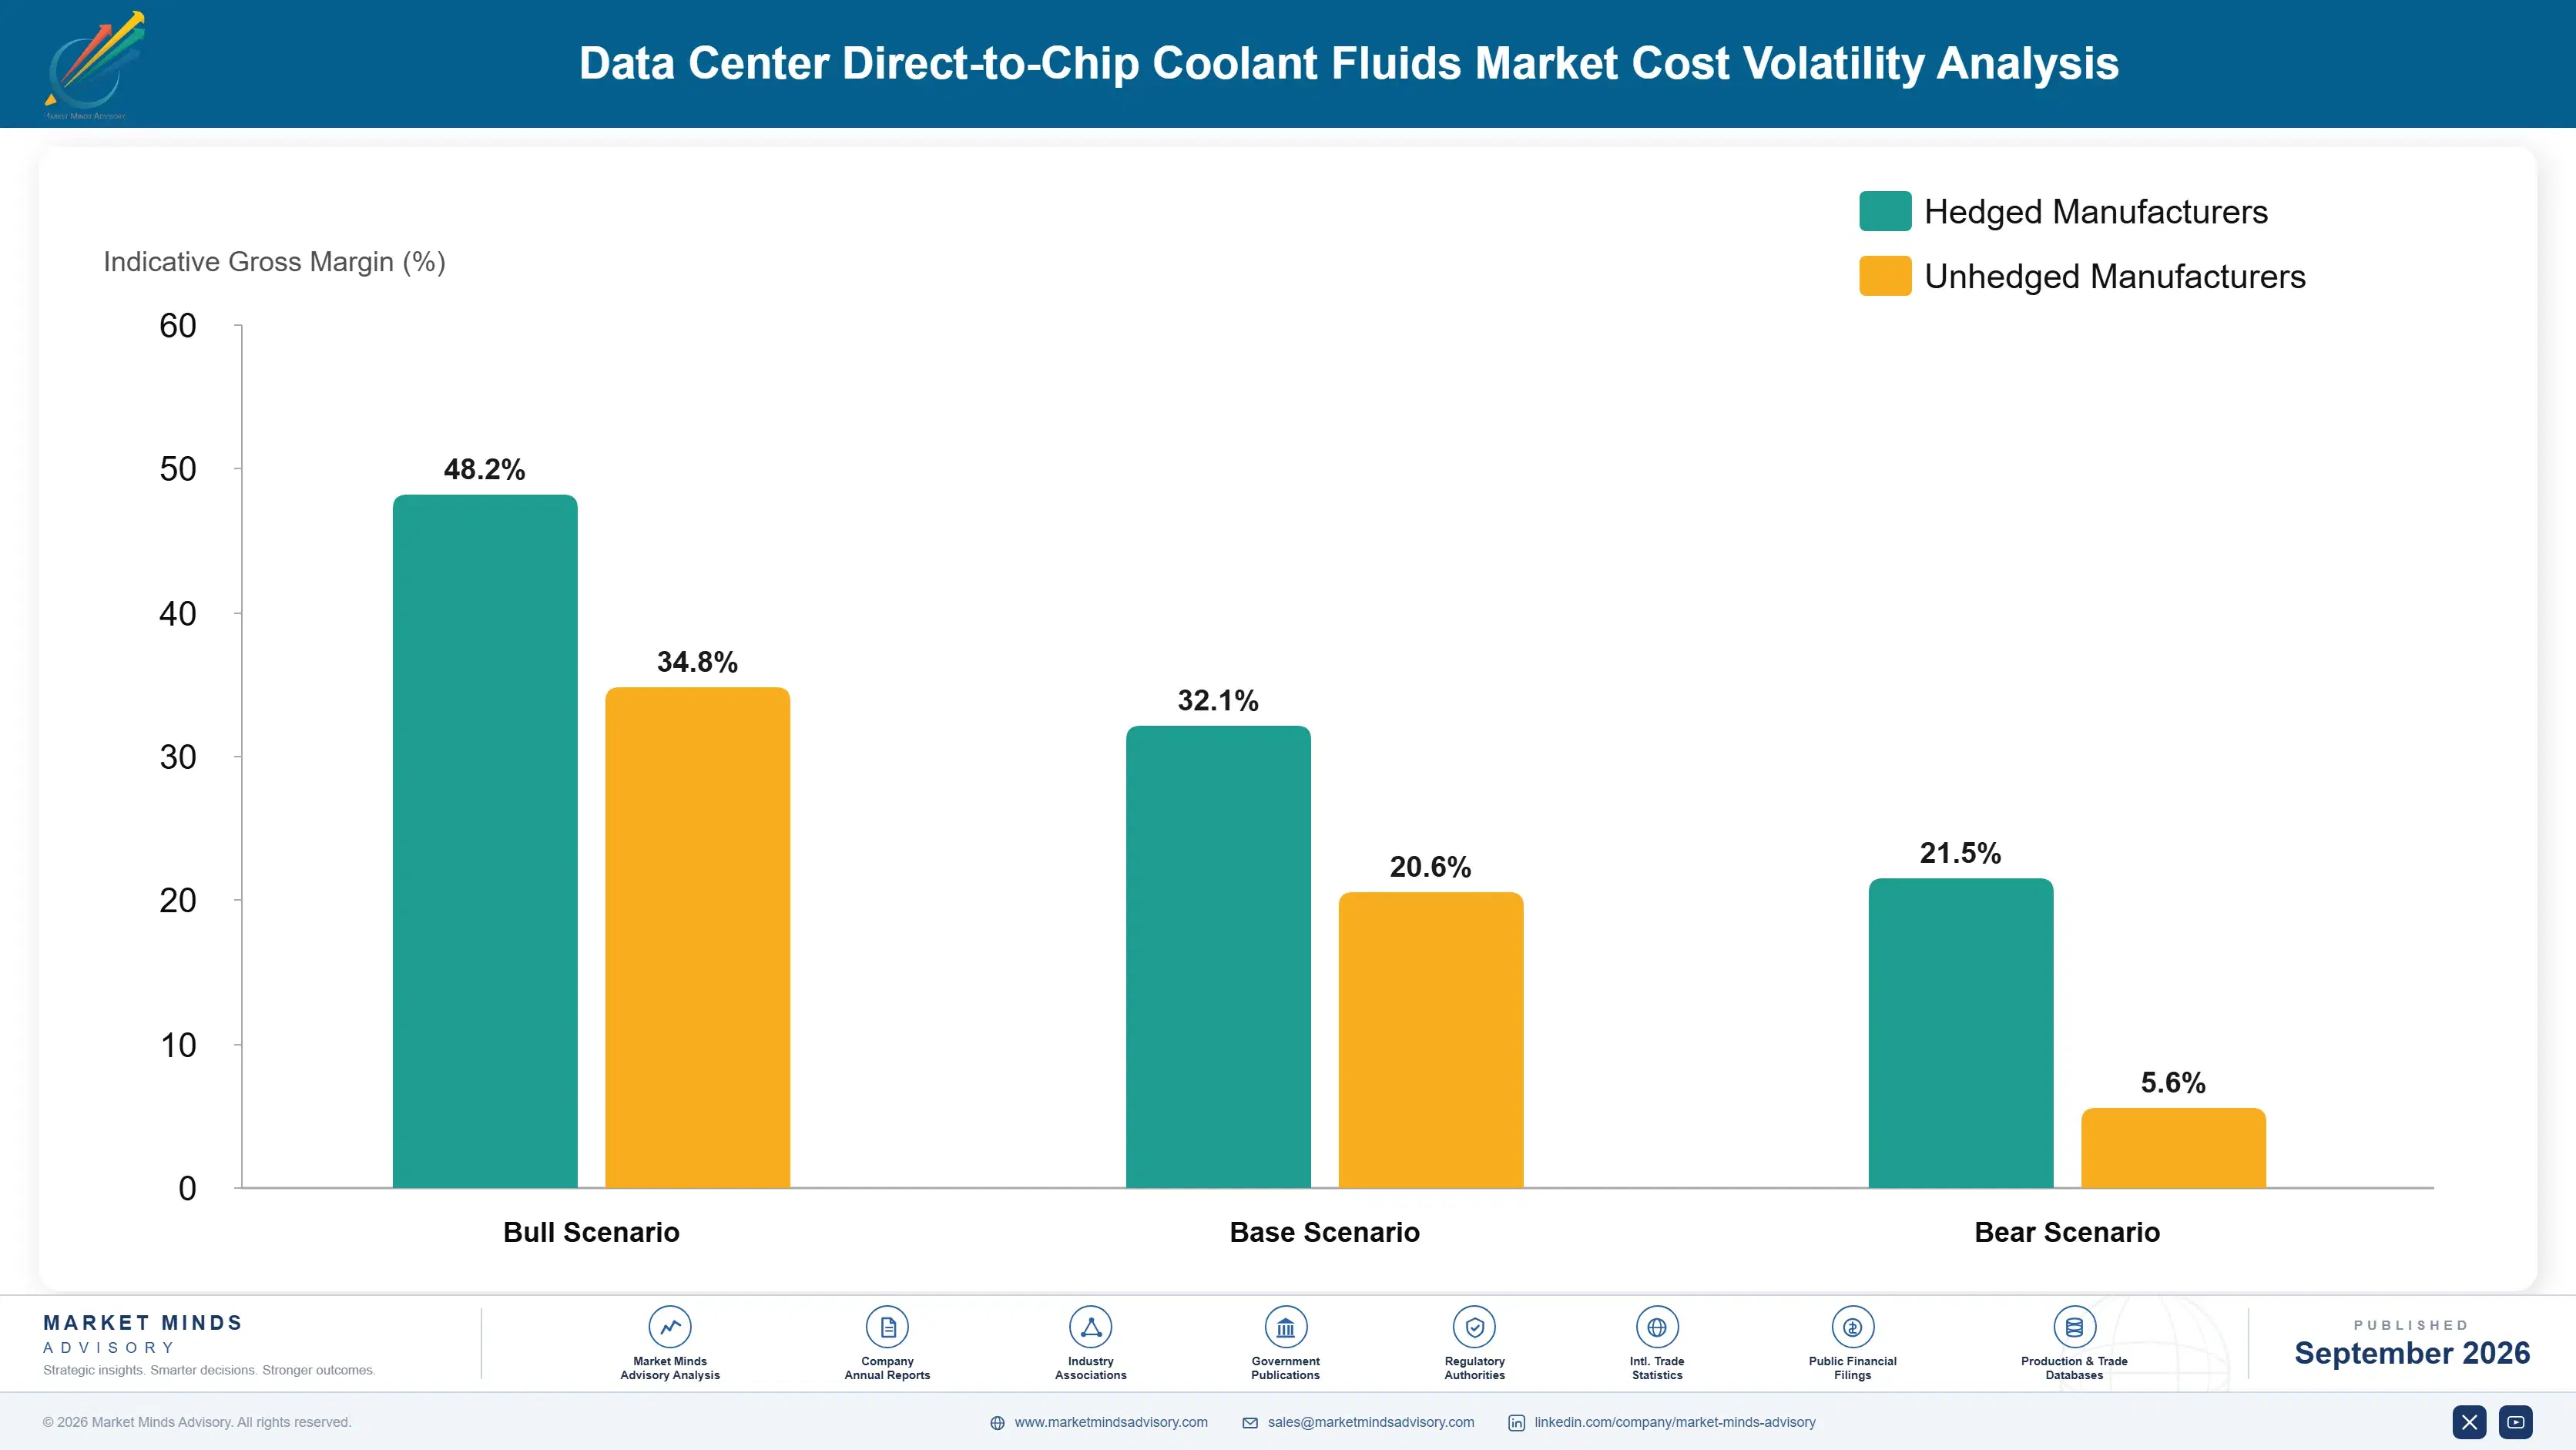
Cost structure separates sharply by chemistry. Inhibited glycol formulations are dominated by base glycol, running between 54% and 71% of cost depending on whether propylene or ethylene grade is specified and on feedstock conditions. Inhibitor and biocide packages add roughly 14%, deionised water preparation and blending 8%, and packaging and distribution the balance. Dielectric fluids invert this, with base synthesis dominating and additive content minimal.
Glycol feedstock pricing has been the principal volatility. Propylene oxide and ethylene oxide costs track olefin feedstocks, and energy-driven swings through 2024 and 2025 moved base glycol contract prices sufficiently to compress formulator margins that had been quoted on annual terms. Dow disclosed feedstock and energy cost effects in 2024 annual reporting, and EIA petrochemical feedstock price series document the underlying movement. Formulators buying rather than producing glycol absorbed most of it.

Exposure follows integration rather than size. Producers making their own base glycol pass through feedstock movement and hold margin, while formulators buying glycol face compression from both directions when they have quoted fixed annual pricing. Dielectric specialists avoid glycol exposure entirely but face far narrower synthesis supply chains. Regional blenders serving single clusters lack both integration and volume to negotiate base terms.
data-center-direct-to-chip-coolant-fluids-market-cost-volatility-analysis-1788419595859

Index formulated pricing to base glycol movement

Fixed annual pricing where base chemistry is up to 71% of cost transfers feedstock risk to the wrong party entirely. Indexed contracts referencing published glycol pricing move that exposure to buyers. Operators resist indexation until a shortage makes supply continuity the greater concern, so the negotiating window follows market conditions rather than supplier preference.

Blend regionally near major capacity clusters

Coolant is mostly water by volume and shipping it long distances is expensive relative to the product value, particularly for pre-diluted formulations operators increasingly prefer. Regional blending against concentrate shipments cuts delivered cost by around 22% and shortens response time for top-up demand. It requires local quality control capability, since blending errors create exactly the failures the industry fears most.

Qualify multiple inhibitor package sources early

Additive and inhibitor packages are roughly 14% of formulated cost and come from a much narrower supplier base than the base glycol does, creating a concentration risk formulators underestimate. Qualifying alternatives during development rather than during a shortage protects continuity. Changing an inhibitor package can itself trigger requalification, so alternatives must be validated in the original programme.

Portfolio Architecture for Margin Defence

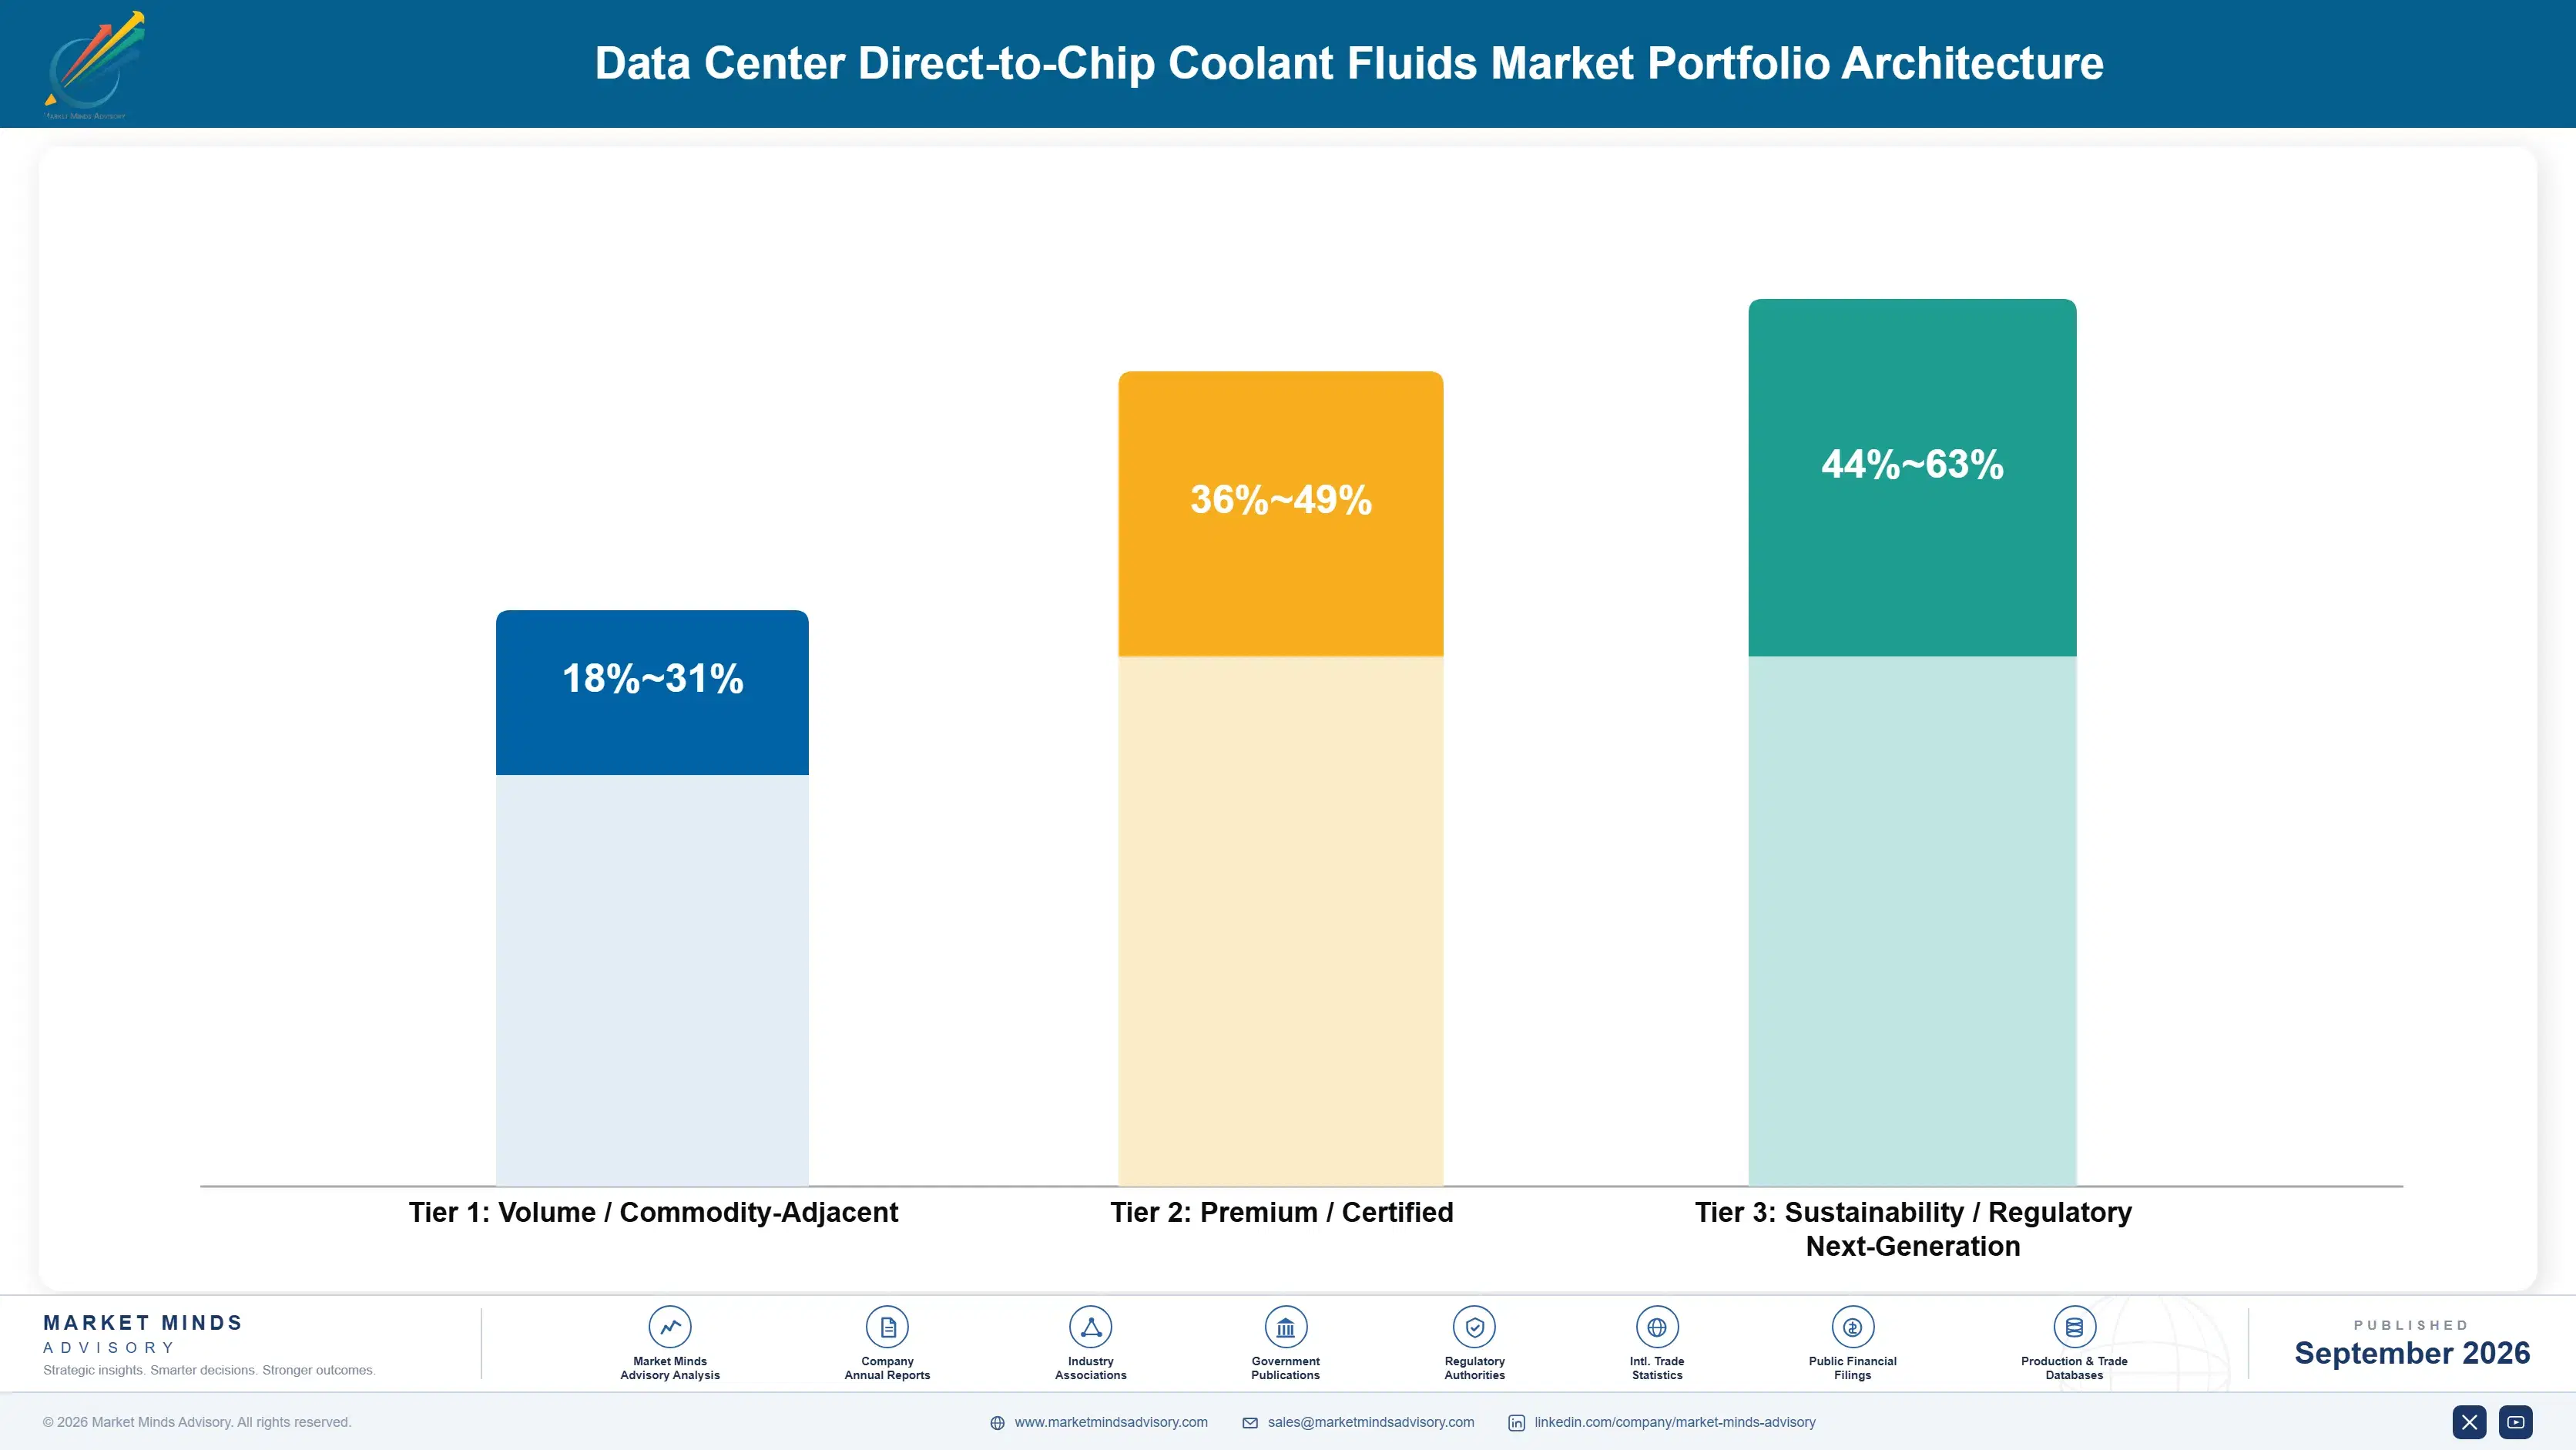
Margin architecture divides on whether the supplier sells a product or a programme. Fluid supplied in drums against a purchase order earns commodity chemical margins regardless of formulation quality, because the buyer compares price per litre and has no other basis. The same fluid sold inside a managed programme with sampling, analysis and documented top-up earns multiples of that, and looks cheap against the hardware it protects.
The volume tension is between conventional glycol chemistry and engineered dielectrics. Glycol formulations carry 81% of litres, absorb blending capacity and generate the account relationships everything else is sold through, at thin margins. Dielectrics carry a small fraction of volume, command several times the price and are where the requalification cycle is currently creating openings. Suppliers need both, and those holding only conventional chemistry cannot reach the growth.

High-value revenue concentrates in dielectric fluids and in managed chemistry services. Both share the property that the buyer is purchasing risk reduction on assets worth vastly more than the fluid, which removes price from the centre of the decision. Conventional glycol supply occupies the volume position and will remain the majority of litres indefinitely, and no formulation improvement changes how those tenders are evaluated.

Volume / Commodity-Adjacent

Inhibited glycol and treated water formulations supplied against purchase orders on price per litre. The wide range separates integrated glycol producers from formulators buying base chemistry, which changes cost position fundamentally. This tier carries most volume and generates account access for everything else.
Gross Margin: 18-31%

Premium / Certified

Formulations qualified into named equipment manufacturer approved lists, sold with compatibility documentation and certification records. Margin holds because requalification cost makes displacement expensive once a system is charged. Approval work is slow and specific to each equipment platform, which limits how quickly positions extend.
Gross Margin: 36-49%

Sustainability / Regulatory / Next-Generation

Dielectric fluids and managed chemistry programmes including sampling, analysis and documented maintenance. The widest range in the portfolio, reflecting how much service content accompanies the fluid and how constrained the chemistry is. Highest margin and the least price-sensitive buyers anywhere in this market.
Gross Margin: 44-63%
data-center-direct-to-chip-coolant-fluids-market-portfolio-architecture-1788419596367

High-value Sub-segments and Strategic Watch-out

Managed Chemistry Programmes

High value and high growth together, because operators are buying assurance on hardware worth vastly more than the fluid. The margin range reflects sampling frequency and analytical content, which vary by contract. Programmes renew annually and generate the operating history that supports the next qualification decision, compounding the position.
Gross Margin: 52-63%

Single-Phase Dielectric Supply

High value with the fastest growth in the market, driven by requalification following the fluorinated withdrawal rather than by expanding applications. The range reflects base chemistry, since hydrocarbon, ester and silicone options carry quite different cost structures. No default has emerged, which makes current positions unusually contestable.
Gross Margin: 46-60%

Inhibited Glycol Supply

The volume core at 81% of litres and the least attractive part commercially, evaluated on price per litre against chemistry nobody can meaningfully differentiate. It funds blending capacity and provides the account relationships other products reach through. Suppliers cannot exit it and struggle to earn adequately within it.
Gross Margin: 19-32%

Equipment Maker Fluid Supply

The strategic watch-out, carried at zero because it represents fluid supplied through hardware manufacturers rather than sold directly. Approved fluid lists move the fill decision away from the operator entirely. Suppliers treating equipment makers as channel partners rather than as gatekeepers are misreading where the specification power now sits.
Gross Margin: 0-0%

How Coolant Demand Recurs

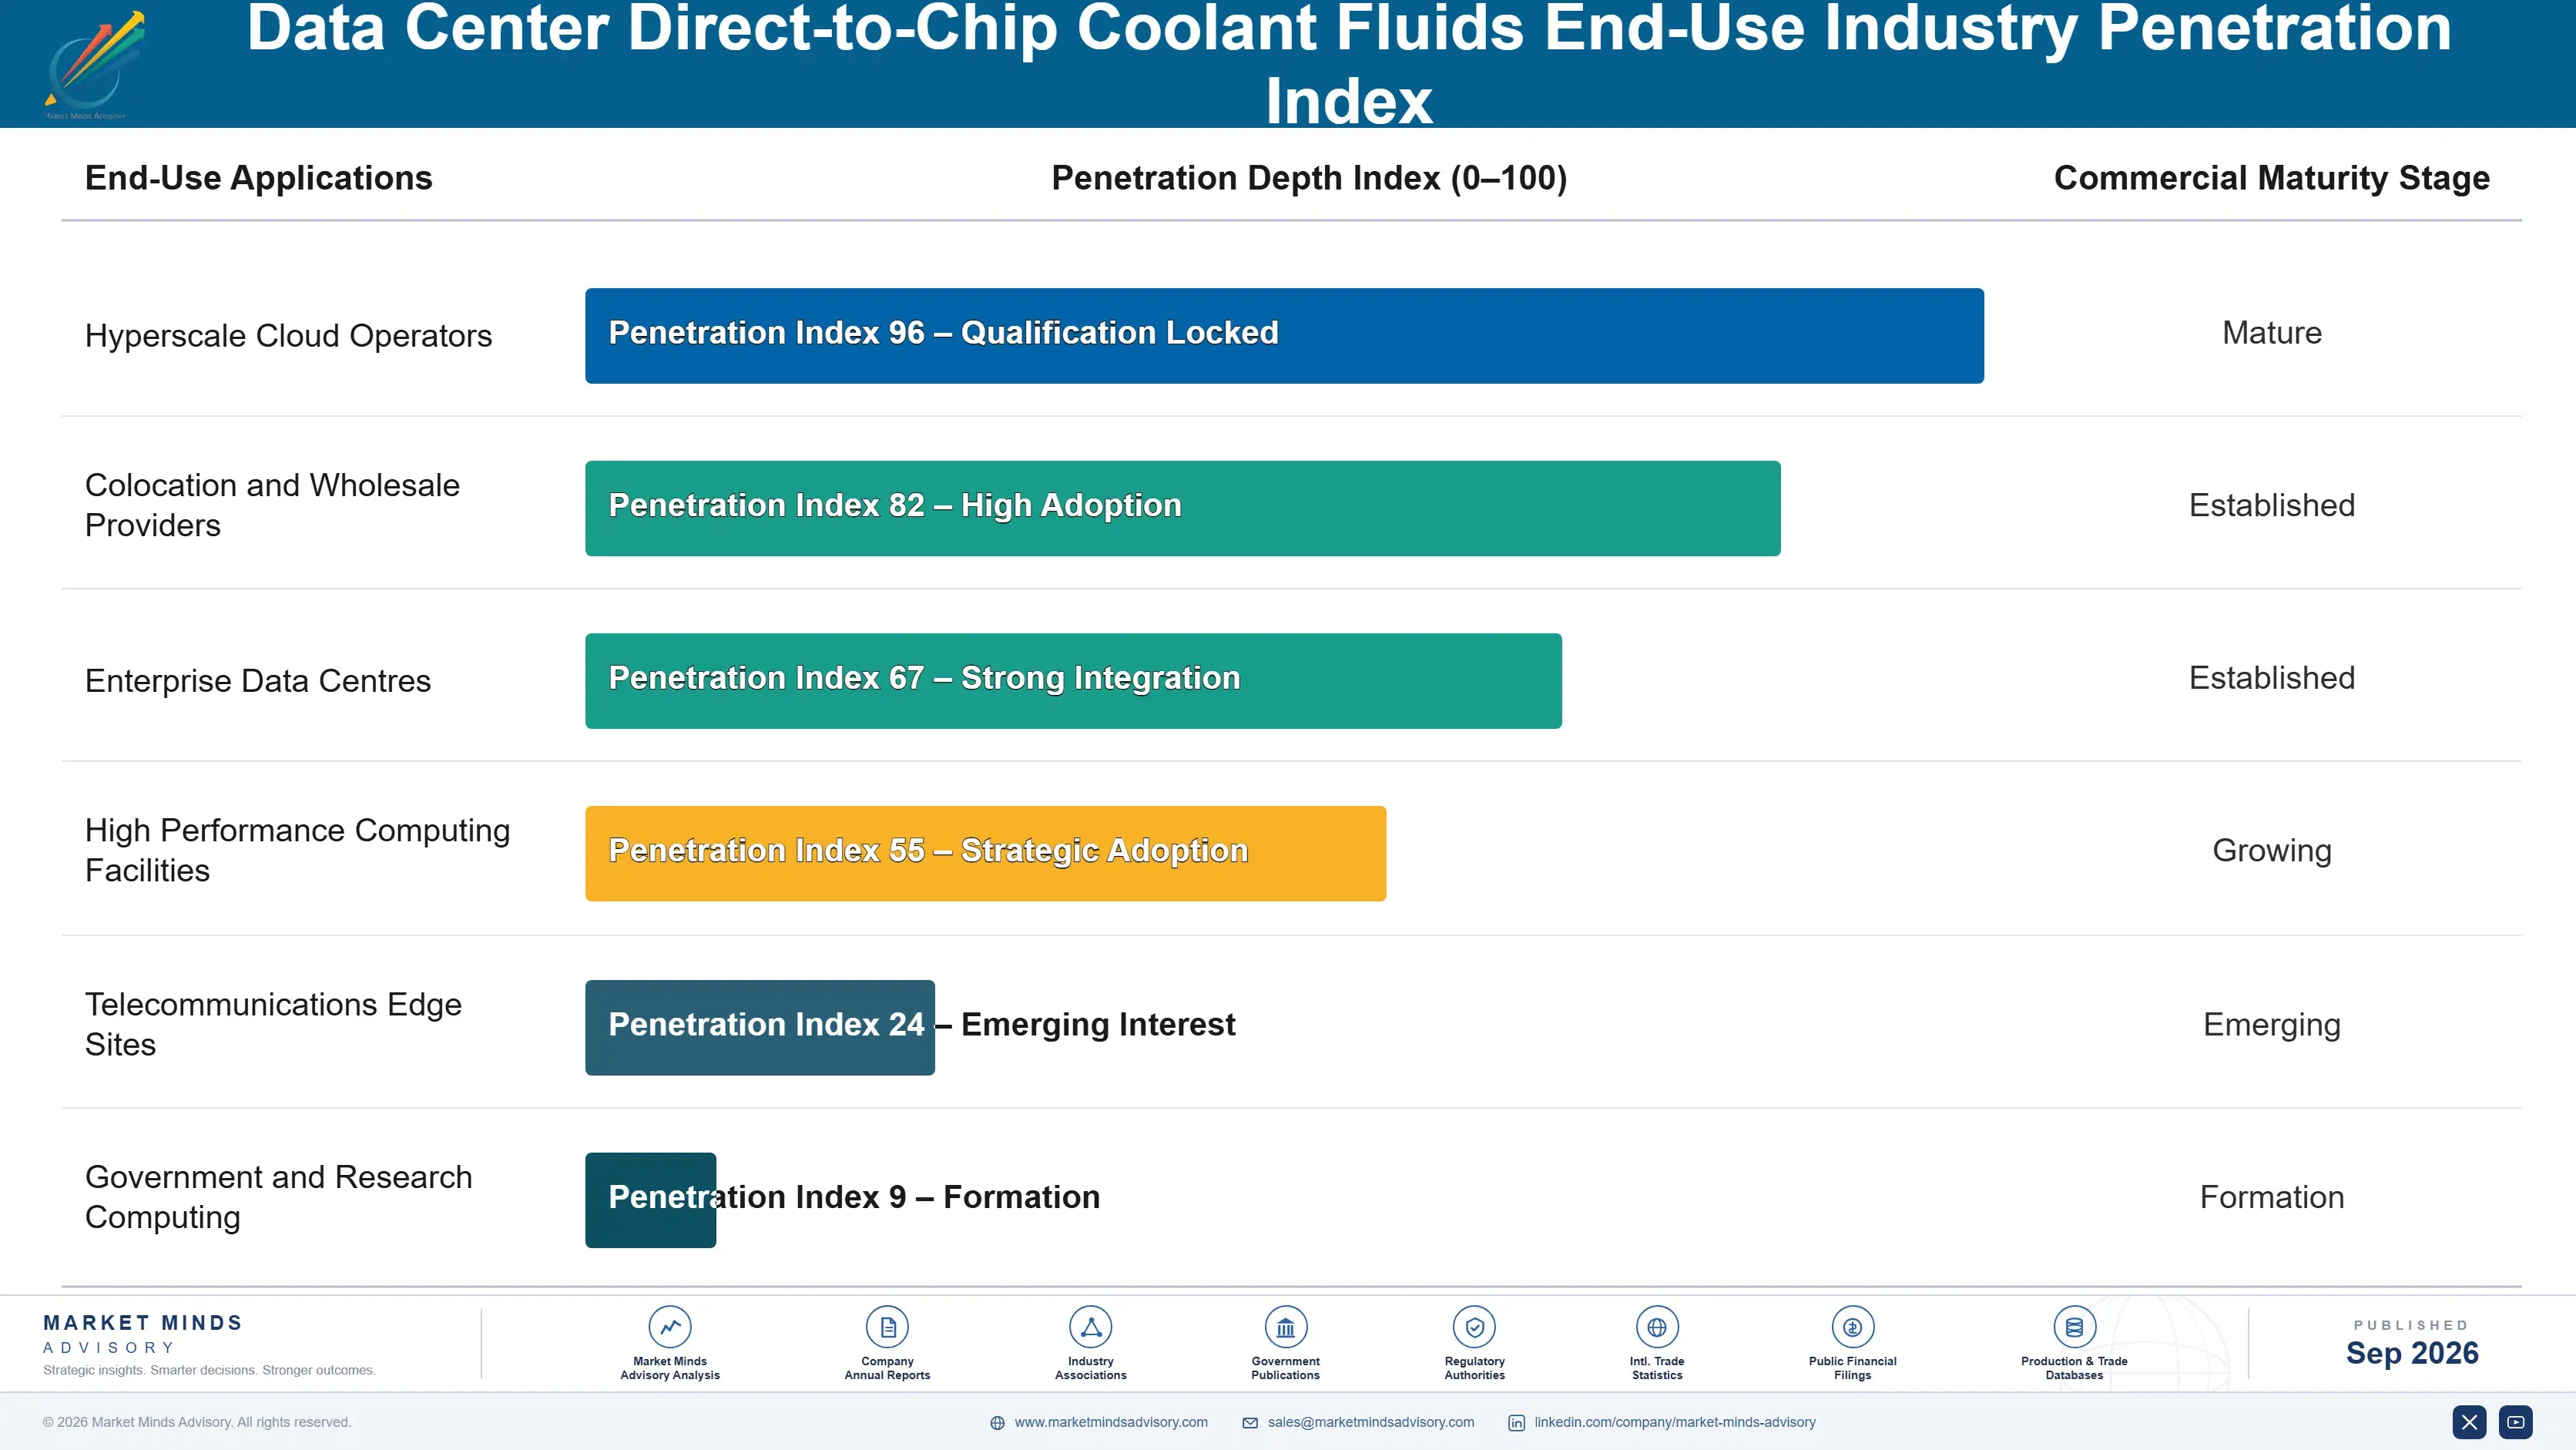
Revenue repeats through top-up rather than through replacement, and the annuity attaches to a charged system rather than to a customer. Operators run roughly 9% annual replacement of charged volume through disconnects, sampling and maintenance, and almost never change chemistry mid-life, since requalification costs more than the fluid will. The initial fill therefore captures a decade of recurring demand, worth far more than the first order suggests.
Adoption depth varies considerably by operator type. Hyperscale operators run the deepest programmes, with sampling, chemistry tracking and documented maintenance built in from commissioning. Colocation providers adopt to whatever standard their tenants require, which produces inconsistency across a single facility. Enterprise operators buy the minimum their equipment warranty specifies and monitor rarely. Specialist high performance computing sites are the most technically engaged, though volumes are modest.

The buyer profile has moved from facilities engineering toward risk management. A few years ago coolant was specified by a mechanical engineer choosing on thermal properties. Today warranty terms, insurance conditions and equipment maker approved lists constrain the choice before facilities sees it, and the remaining decision is about documentation and service. Suppliers selling on thermal conductivity address an engineer whose specification was written elsewhere.
data-center-direct-to-chip-coolant-fluids-market-end-use-penetration-index-1788419596894

What Actually Wins Here

These are among the four positions where our research anticipates prominent divergence between winners and laggards over the coming forecast period. Each is grounded in the demand model, the regulatory perimeter, and the announced capacity pipeline.
01 / PROGRAMME OVER PRODUCT

Sell managed chemistry, never drums against a purchase order

Fluid representing 0.8% of system cost cannot be sold profitably as a commodity however good the formulation is, because the buyer has no basis for comparison beyond price per litre. Wrapping the same volume in sampling, inhibitor tracking and documented top-up produces roughly 4 times the revenue and renews every year rather than at replacement. It also generates the operating history that supports the next qualification argument, which compounds a supplier position instead of merely extending it by another year.
02 / COMPATIBILITY DATA OWNERSHIP

Generate validation evidence before anyone asks for it

Around 14% of direct-to-chip pilots halt on seal, elastomer or metal incompatibility rather than on any kind of thermal shortfall, and operators simply buy from whichever supplier has already answered that question properly. Published compatibility matrices across common cold plate metals and quick disconnects shorten customer qualification by roughly 7 months and win positions that price competition never moves. The accelerated ageing work required is slow and unexciting, which is exactly why so few suppliers have actually completed any of it.
03 / FIRST FILL POSITIONING

Price to win the charge, not the opening transaction

Charged cooling systems consume roughly 9% of their volume every year and operators almost never change chemistry mid-life, since requalification costs far more than any conceivable fluid saving could recover. The initial fill therefore captures close to a decade of recurring demand at very nearly negligible competitive exposure afterwards. Suppliers that maximise the opening order consistently lose out to those pricing for the position instead, and the difference only becomes visible years later, when the recurring volume turns up somewhere else entirely.
04 / SPECIFICATION GATEKEEPER ACCESS

Get named in warranty terms and approved fluid lists

Equipment warranties and facility insurance arrangements now name acceptable coolant chemistries in roughly 38% of cases, which relocates the decision away from facilities procurement and into risk management before any supplier reaches the operator. Being named on an equipment maker approved list is worth more than any direct commercial relationship with the buyer. Reaching those gatekeepers requires sustained validation work with parties that never purchase the product themselves, which most chemical sales organisations are simply not structured to pursue at all.

Engagement Snapshot From the Field

A live engagement with an industry participant carrying material or product regulatory and market exposure ahead of a defining policy shift, showing how our research translates into a defensible multi-year portfolio strategy.
MARKET MINDS ADVISORY · CLIENT ENGAGEMENT SUMMARY
Data Center Direct-to-Chip Coolant Fluids Producer Strategic Portfolio Review and Transition Roadmap 2026·Investment Scenario on Data Center Direct-to-Chip Coolant Fluids Exposure Evaluation 2025-26
CLIENT PROFILE
A colocation operator running eleven facilities across three countries with roughly 340 megawatts of contracted capacity (client-reported, unverified by MMA), of which 62 megawatts was liquid cooled across four sites. Two of those sites had standardised on fluorinated dielectric fluid in two-phase demonstration deployments that tenants had subsequently expanded into full production workloads without any formal review.
STRATEGIC CHALLENGE
The withdrawal of fluorinated fluid supply required requalification of roughly 18 megawatts of two-phase capacity within an eighteen month window (client-reported, unverified by MMA). Tenant agreements contained availability commitments that made any fluid change during operation commercially hazardous, and no candidate replacement had published compatibility data covering the full materials set in the installed loops.
MMA APPROACH
MMA catalogued the complete materials inventory across the affected loops, which the operator had never assembled, then assessed each candidate fluid against that inventory rather than against generic compatibility claims. We interviewed seven fluid suppliers, three cold plate manufacturers and two insurers. Supplier evaluation weighted completed validation evidence and service infrastructure near the sites far above thermal performance or unit price.
KEY FINDINGS
  1. The installed loops contained four elastomer grades and two aluminium alloys that no candidate fluid supplier had validated, and nobody had recorded the inventory anywhere.
  2. Converting two of the four affected halls to single-phase operation removed the requalification problem entirely at lower cost than any fluid substitution would have achieved.
  3. Insurance terms already named acceptable chemistries, and two of the five shortlisted fluids would have breached them, which procurement had not checked at all.
  4. Only one supplier could provide sampling and top-up service within a day of all four sites, and response time mattered more to operations than any chemistry difference.
CLIENT PROFILE
A colocation operator running eleven facilities across three countries with roughly 340 megawatts of contracted capacity (client-reported, unverified by MMA), of which 62 megawatts was liquid cooled across four sites. Two of those sites had standardised on fluorinated dielectric fluid in two-phase demonstration deployments that tenants had subsequently expanded into full production workloads without any formal review.
STRATEGIC CHALLENGE
The withdrawal of fluorinated fluid supply required requalification of roughly 18 megawatts of two-phase capacity within an eighteen month window (client-reported, unverified by MMA). Tenant agreements contained availability commitments that made any fluid change during operation commercially hazardous, and no candidate replacement had published compatibility data covering the full materials set in the installed loops.
MMA APPROACH
MMA catalogued the complete materials inventory across the affected loops, which the operator had never assembled, then assessed each candidate fluid against that inventory rather than against generic compatibility claims. We interviewed seven fluid suppliers, three cold plate manufacturers and two insurers. Supplier evaluation weighted completed validation evidence and service infrastructure near the sites far above thermal performance or unit price.
KEY FINDINGS
  1. The installed loops contained four elastomer grades and two aluminium alloys that no candidate fluid supplier had validated, and nobody had recorded the inventory anywhere.
  2. Converting two of the four affected halls to single-phase operation removed the requalification problem entirely at lower cost than any fluid substitution would have achieved.
  3. Insurance terms already named acceptable chemistries, and two of the five shortlisted fluids would have breached them, which procurement had not checked at all.
  4. Only one supplier could provide sampling and top-up service within a day of all four sites, and response time mattered more to operations than any chemistry difference.
RECOMMENDED STRATEGY
Phase 1: Convert two halls from two-phase to single-phase operation during scheduled tenant maintenance windows, avoiding fluid requalification on the majority of affected capacity. Phase 2: Requalify the remaining two halls against a single fluid validated on the full recorded materials inventory rather than on the supplier's generic compatibility claims. Phase 3: Contract managed chemistry service with the supplier holding local response capability, and record the materials inventory formally for every future loop built.
OUTCOME
The operator completed the transition inside the window with no tenant availability breach and no fluid-related incident. Total cost reached roughly USD 4.6 million against an initial estimate near USD 11 million for full fluid substitution across all four halls (client-reported, unverified by MMA). Materials inventories are now recorded at commissioning.

Frequently Asked Questions

Foundational context covering the market sizes, CAGR, scope, country, region and competition that inform every finding below. This section is provided to cover basics and most often pre-purchase conversations, answered from the MMA Primary Research Dataset.

What is the current size of the Data Center Direct-to-Chip Coolant Fluids Market?

The market was worth USD 0.3 billion in 2025 and reaches USD 0.35 billion in 2026. Roughly 81% of deployed volume uses conventional inhibited glycol and water chemistry.

How large will the Data Center Direct-to-Chip Coolant Fluids Market be by 2036?

MMA forecasts USD 1.80 billion by 2036, an expansion of 5.14 times over the forecast period. That represents USD 1.45 billion of incremental annual revenue against 2026.

What is the CAGR for the Data Center Direct-to-Chip Coolant Fluids Market 2026 to 2036?

The base case is 17.8% compound annual growth, with a bull case at 19.0% and a bear case at 16.4%. Whether two-phase cooling reaches volume deployment separates the scenarios.

Which segment is growing fastest?

Single-phase dielectric fluids grow at 26.7%, half again the market rate of 17.8%. The requalification cycle following withdrawal of fluorinated products rather than new applications drives that growth.

Who are the major companies in the Data Center Direct-to-Chip Coolant Fluids Market?

Dow, Castrol, Chemours, Clariant and Arteco lead on measured fluid supply revenue. Together they hold roughly 58%, with most volume concentrated among the integrated glycol producers rather than specialty formulators.

Which country is growing fastest?

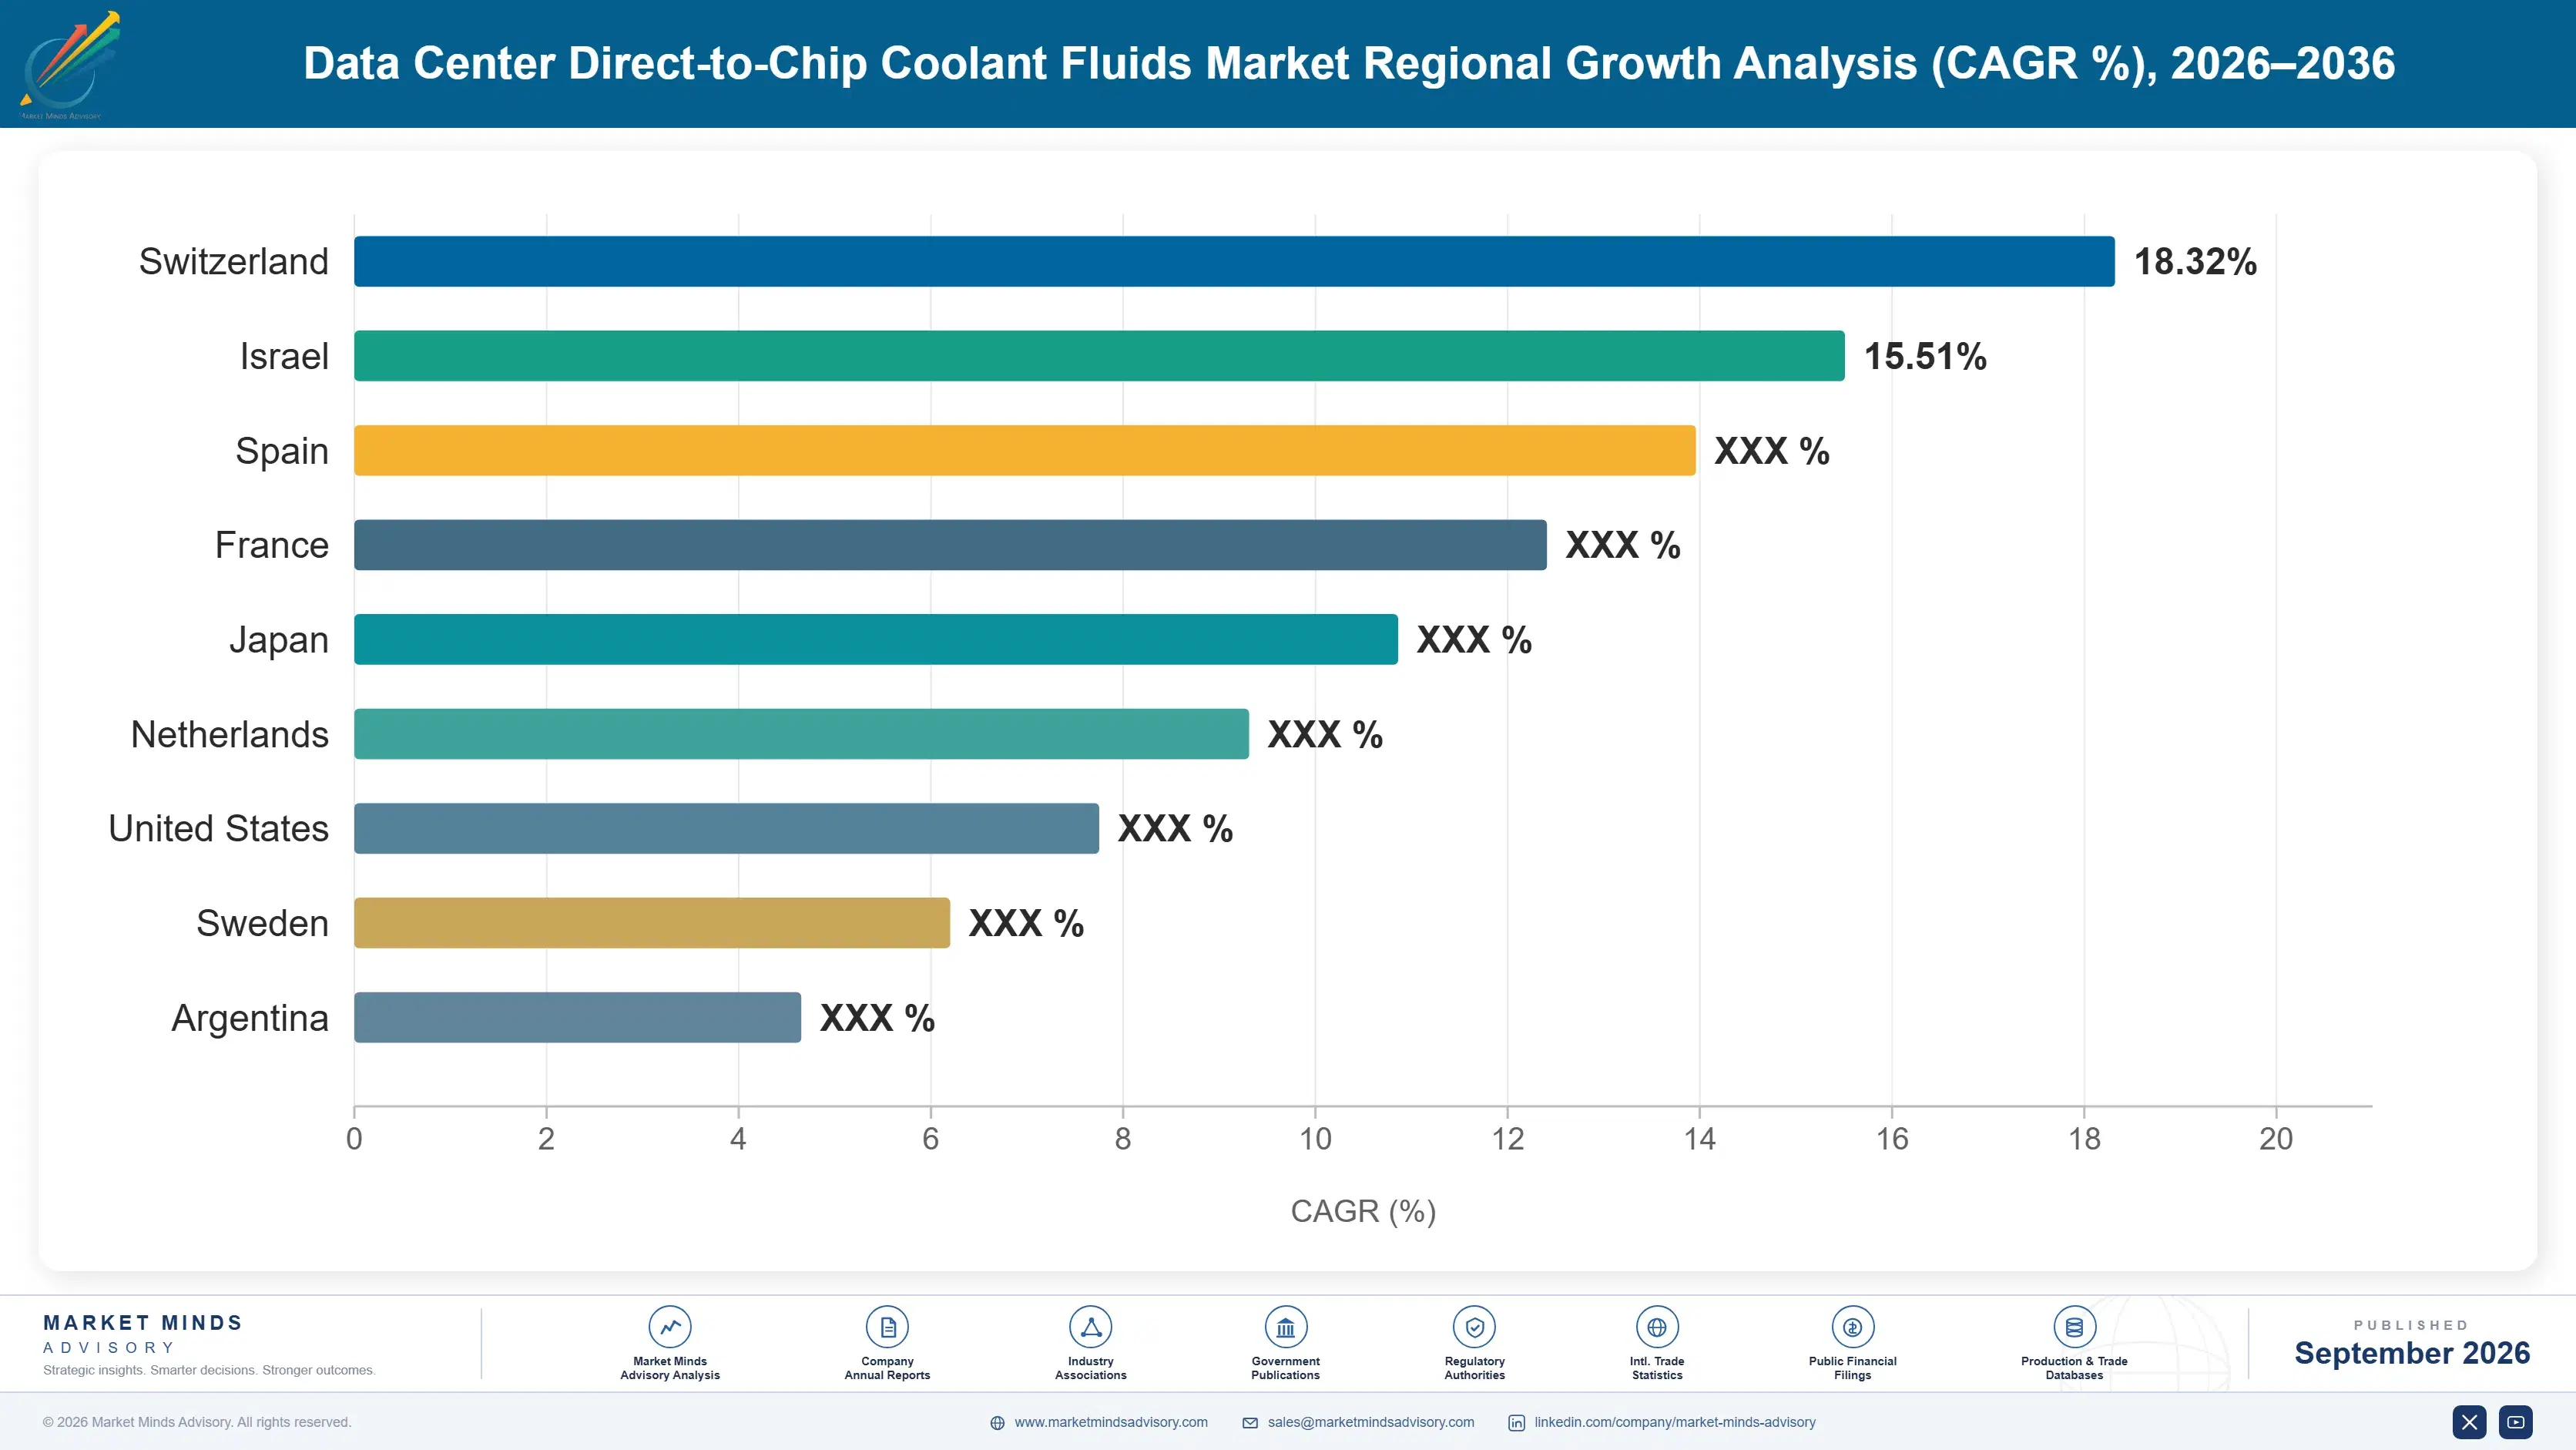
Malaysia grows fastest at 24.6%, as Johor absorbs capacity displaced from Singapore and high wet bulb temperatures make air cooling economics poor. Committed build there exceeds anything else regionally.

Report Segmentation Architecture

The full report scope spans multiple orthogonal segmentation dimensions, with cross-tabulated demand data provided for each dimension pair. Coverage extends further to regional breakdowns, trend trajectories, and the competitive detail needed to support segment-level decision-making.

By Primary Market Dimension

  • Propylene Glycol Water Blends
  • Ethylene Glycol Water Blends
  • Deionised and Treated Water Formulations
  • Single-Phase Dielectric Fluids
  • Two-Phase Dielectric Fluids
  • Hybrid Low-Conductivity Specialty Blends

By End-Use Industry

  • Hyperscale Cloud Operators
  • Colocation and Wholesale Providers
  • Enterprise Data Centres
  • High Performance Computing Facilities
  • Telecommunications Edge Sites
  • Government and Research Computing

By Commercial Dimension

  • Direct Operator Supply Contracts
  • Equipment Manufacturer Approved Supply
  • Managed Chemistry Service Programmes
  • Distribution and Regional Blending
  • Engineering Contractor Specification
  • Aftermarket Top-Up and Replacement

By Region

  • North America
  • East Asia
  • Western Europe
  • South Asia and Pacific
  • Latin America
  • Middle East and Africa
  • Eastern Europe

Scope, Methodology, and Coverage

Every figure in this report is reproducible from documented input assumptions. The scope below maps the historical period, the forecast horizon, the segmentation dimensions, and the countries covered, alongside the underlying primary and qualitative methodology.
Historical Period
2020 to 2025
Forecast Period
2026 to 2036
Base Year
2025 (USD billions; MMA Primary Research Dataset, September 2026)
Market Definition
This market covers engineered heat transfer fluids formulated for or supplied into direct-to-chip liquid cooling of data centre information technology equipment, spanning propylene and ethylene glycol water blends, deionised and treated water formulations, single-phase and two-phase dielectric fluids, and hybrid low-conductivity specialty blends. Revenue is measured as fluid supply value at supplier level including attributable sampling, analysis and conditioning services. Immersion cooling fluids, facility chilled water treatment chemicals, refrigerants circulating in chiller and coolant distribution unit compressor circuits, and cold plate, manifold and distribution hardware are excluded.
Quantitative Units
USD billions, fluid supply and attributable service revenue at supplier level
Segmentation Dimensions
Fluid chemistry, operator type, commercial channel, region
Regions Covered
North America, East Asia, Western Europe, South Asia and Pacific, Latin America, Middle East and Africa, Eastern Europe
Countries Covered
United States, Canada, Mexico, Brazil, Chile, United Kingdom, Ireland, Germany, Netherlands, France, Sweden, Denmark, Spain, Poland, Czechia, Romania, China, Japan, South Korea, Taiwan, Singapore, Malaysia, India, Australia, United Arab Emirates, Saudi Arabia, South Africa
Key Companies Profiled
Dow, Castrol, Chemours, Clariant, Arteco, Shell, ExxonMobil, TotalEnergies, Lubrizol, Dober, Kurita Water Industries, Veolia Water Technologies, Recochem, Solvay, Engineered Fluids, M&I Materials, Cargill, Fuchs, Idemitsu Kosan, ENEOS
Quantitative Methodology
Primary survey, n=3,800 respondents, Q4 2025, six countries; demand-side model with trade association cross-validation
Qualitative Methodology
47 expert interviews, Q4 2025; applied to validate demand model assumptions, identify emerging dynamics, and assess competitive positioning
Report Format
PDF and XLSX data workbook (Word format preview document)
Publisher
Market Minds Advisory
Report Code
MMA-2026-CHM-141
Published
September 2026
Contact
sales@marketmindsadvisory.com | www.marketmindsadvisory.com

Purchase the full Data Center Direct-to-Chip Coolant Fluids Market Report (2026 to 2036).

The full MMA report examines why a fluid worth under one percent of a cooling system's cost determines almost all of its risk, and what that means for how coolant should be sold. It sizes the market to 2036 across six fluid chemistries, seven regions and 27 countries, with segment growth rates and regional demand mechanisms set out in full. Competitive analysis covers 20 suppliers assessed on measured fluid supply revenue, including moat and risk assessment for the two leaders. The report quantifies formulation cost structure, feedstock exposure and margin architecture across three portfolio tiers. It closes with four strategic verdicts and an anonymised colocation operator engagement.
Six fluid chemistries sized to 2036
Seven regions with demand mechanism analysis
Twenty suppliers on consistent supply revenue basis
Formulation cost structure and feedstock exposure benchmarks
Margin architecture across three portfolio tiers
Anonymised colocation coolant requalification client engagement

Built For The People Who Decide

From boardroom strategy to bench-side execution, this report is read cover-to-cover by leaders shaping the next decade of their industry, turning demand scenarios, market dynamics and valuation benchmarks into decisions.
CXOs/ Presidents/ VPs/ Managers
M&A and Corporate Development
Strategy Teams and R&D Heads
Procurement and Product Directors
Regulatory and Compliance Leaders
Investor Relations and Equity Analysts