Market Minds Advisory
Data Centre Colocation Market

Data Centre Colocation Market: Data Centre Colocation Market: Product Classes, Grid Constraint Economics and Density Transition 2026 to 2036

Land is available almost everywhere. A grid connection is not, and the operator holding a signed interconnect agreement holds something a competitor with far more capital simply cannot buy at any price.

Lead Analyst

Published

September 2026

Make Smarter Decisions with Customized Research Insights

Request a free sample report and evaluate market opportunities, growth trends, and competitive dynamics relevant to your business needs.

2025 MARKET VALUE$68.0BMarket Size 2025
2036 FORECAST VALUE$223.0BBase Case , 2026 to 2036
CAGR 2026 TO 203611.4 %Bull 12.6% / Bear 10.2%
INCREMENTAL OPPORTUNITY$147.2BNet 10- year value creation
EXPANSION MULTIPLE2.94x2036 value over 2026 base
Strategic Levers
M&A Pipeline
Regional Outlook
Country Rankings
Competitive Intelligence
Segmental Deep-dive
Call-Us : 91 93563 13602

Executive Snapshot and Market Trajectory.

Colocation stopped being a real estate business and became a power procurement business, and most operators worked that out late. Vacancy sits near 3% across major metros, which is not a demand story. It is a supply story, and the constraint is the grid rather than capital or land.
The market reaches USD 75.75 billion in 2026 and USD 222.96 billion by 2036, a 2.94 times expansion at 11.4%. Liquid-cooled high-density colocation grows at 17.1%, half again the market rate of 11.4%, because an artificial intelligence training rack draws 110 kilowatts and air cannot remove that heat. North America holds 36% of contracted load revenue, and India grows fastest at 19.4%. The pricing trend of two decades has now reversed.
Five operators hold 44% of contracted load revenue, which is fragmented for an industry this capital intensive. Equinix and Digital Realty built global platforms on interconnection density. NTT DATA and China Telecom hold regional scale that no global operator matches locally. Vantage and the private capital vehicles behind Aligned and STACK compete on speed of delivery rather than on any existing footprint. Speed is what sells now.
Market Definition
This report covers third-party data centre facilities leasing space, power and cooling to tenant organisations: hyperscale build-to-suit leasing, wholesale colocation halls, retail cage and cabinet colocation, liquid-cooled high-density colocation, metro edge colocation, and sovereign air-gapped colocation. It excludes owner-operated hyperscale facilities, enterprise on-premises data centres, cloud computing services sold above the facility layer, network transit and bandwidth, and data centre construction contracting.
Base Year Value
$68.0B in 2025 (MMA Primary Research Dataset, September 2026)
Forecast Period
2026 to 2036, eleven discrete annual values
CAGR
11.4% base case. Bull 12.6%. Bear 10.2%.
Fastest Growth Segment
Liquid-Cooled High-Density Colocation: 17.1% CAGR
Fastest Growth Country
India: 19.4% CAGR
Fastest Growth Region
South Asia and Pacific: 13.6% CAGR
Largest Region
North America: 36% of 2025 global value
Market Leaders
Equinix, Digital Realty, NTT DATA, China Telecom and Vantage Data Centers lead on contracted IT load revenue. Source: MMA Analysis.
Primary Survey
n=3,800 procurement and R&D decision-makers, Q4 2025, six countries
Methodology
Demand-side build-up, cross-validated against public data, 47 expert interviews

Data Centre Colocation Market Forecast Scenarios

data-center-colocation-market-size-forecast-scenario-1789988849270
Between 2020 and 2025 the category compounded at 10.1%, and the character of that growth changed completely halfway through. The first years were cloud migration filling wholesale halls at falling prices. From about 2023 artificial intelligence training demand arrived, prices stopped falling, and operators discovered their constraint was not capital or land but a utility connection queue.
The base case holds 11.4% on three mechanisms. Artificial intelligence training and inference demand keeps arriving faster than power can be delivered, which holds vacancy near 3% and supports pricing. Data localisation rules across India, the Gulf, Indonesia and the European Union force capacity into jurisdictions that previously imported it. And enterprise migration out of owned facilities continues, driven less by cost than by an inability to hire anybody who can run a data centre.
The bull case at 12.6% assumes grid connection queues shorten as utilities respond to load growth, releasing capacity that demand is already waiting for. The bear case at 10.2% is an artificial intelligence capital spending pause: hyperscalers hold enormous contracted pipelines, and a deferral of even a fraction of that lands directly on operators who have already committed the construction spending.

Power Is The Whole Constraint

Twenty years of colocation strategy assumed land and capital were the binding constraints. Neither is now. Grid interconnection queues in Northern Virginia, Dublin, Singapore and Amsterdam run around 48 months, and in several of those metros the utility has simply stopped accepting new applications. An operator holding a signed interconnect agreement holds an asset that a better capitalised competitor cannot buy at any price.
TOP FIVE CONCENTRATION44%Fragmented across regional operators and global platform builders
GRID INTERCONNECTION QUEUE48 monthsTypical wait for new utility connection in constrained metros
MARKET VACANCY RATE3%Available contracted capacity across all major metropolitan markets
AI RACK POWER DRAW110 kilowattsPer rack for current training hardware configurations today
POWER USAGE EFFECTIVENESS1.28Facility overhead measured against the delivered computing load
LEASE RENEWAL UPLIFT14%Pricing increase on renewals in supply constrained metros
That constraint produced a pricing inversion nobody in the industry expected to see. Colocation prices fell every year for two decades as capacity outran demand. Since roughly 2023 they have risen, with renewal uplifts around 14% in constrained metros. Vacancy near 3% is not a sign of exceptional demand so much as a sign that supply cannot respond, which is a different business entirely.
Artificial intelligence also changed the physics. A conventional rack draws six to eight kilowatts and air handles it. A training rack draws around 110 kilowatts and air does not. A facility built in 2019 cannot host 2026 demand without a retrofit costing a large fraction of a new build, and a great deal of the world's colocation footprint is exactly that facility.
"Ask a colocation operator about their expansion plan and you get a map of land parcels. Ask which of those have a signed interconnect agreement and the map gets very much smaller. That second map is the only one worth reading."
Director, Digital Infrastructure and Data Centre Markets Practice · MMA Technology Practice · September 2026

Market Trends

Grid Connection Replaced Capital As The Binding Constraint

For two decades an operator with money could build wherever demand appeared. Utility interconnection queues in Northern Virginia, Dublin, Singapore and Amsterdam now run around 48 months, and several of those authorities have stopped accepting applications outright. The asset that matters is no longer land or a construction pipeline, it is a signed interconnect agreement, and those cannot be purchased from a competitor at any price. Operators who secured connections speculatively before 2022 hold positions that look considerably smarter now than the boards who approved them thought at the time.
Market Impact: Sovereign capacity compounds at 12.8%
Liquid Cooling Split The Installed Base In Two

A conventional rack draws six to eight kilowatts and air removes the heat adequately. An artificial intelligence training rack draws around 110 kilowatts and air does not, which makes the cooling method a physical constraint rather than an efficiency preference. Direct-to-chip and immersion cooling require different floor loading, different plumbing and different power distribution, so retrofitting an existing hall costs a large share of new construction. The practical result is that the world's colocation footprint has divided into facilities that can host this demand and facilities that cannot. There is no comfortable middle position.
Market Impact: Retail colocation still grows 4.2%

Market Opportunities and Growth Drivers

Data Localisation Forces Capacity Into New Jurisdictions

India's data protection framework, Gulf state sovereignty requirements, Indonesian financial sector rules and European Union data governance all require certain categories of data to remain physically within a jurisdiction. That converts demand which previously landed in Singapore, Frankfurt or Northern Virginia into a requirement for local facilities, regardless of whether local economics would otherwise justify them. Sovereign and air-gapped colocation compounds at 12.8% on exactly this, and the tenants are governments, banks and health systems who pay for compliance rather than for price. That is a considerably better customer to have.
Market Impact: Connections take about 48 months

Enterprises Cannot Staff Their Own Facilities Any More

The migration out of enterprise-owned data centres is usually explained as a cost decision, and for most organisations it is not. A mid-sized company running its own facility needs electrical engineers, mechanical engineers and 24 hour operations staff, and those people now work for hyperscalers and colocation operators at salaries a manufacturing firm will not match. Retirement is doing the rest. Retail cage and cabinet colocation still grows at 4.2% on this alone, decades after the category was pronounced finished by nearly everybody. The staffing problem is not going to improve.
Market Impact: Old halls cap at 8 kilowatts

Market Restraints and Challenges

Utility Connection Queues Cap Deliverable Capacity

An operator can hold land, capital, a signed tenant and a construction contract and still deliver nothing, because the utility connection runs around 48 months in constrained metros and several authorities have paused new applications entirely. The root cause is that transmission and generation planning cycles run on decade timescales while data centre demand arrives on eighteen month ones. Commercially this converts revenue into a queue position. Mitigation runs through on-site generation, grid-adjacent siting in less constrained regions, and demand response agreements that trade flexibility for earlier connection. None of the three is fast enough.
Market Impact: Queues run about 48 months

Existing Halls Cannot Host High Density Demand

Most of the installed colocation footprint was designed for six to eight kilowatt racks and cannot physically support the 110 kilowatt racks that current artificial intelligence hardware requires. The root cause is that floor loading, cooling distribution and electrical topology are fixed when the building is designed and not adjustable afterwards. Commercially this strands otherwise healthy assets in markets where demand is strongest. Mitigation runs through selective retrofit of the newest halls, hybrid deployments that keep inference workloads on air cooling, and honest reclassification of older capacity toward tenants who still want it.
Market Impact: Training racks draw 110 kilowatts
3 additional market trends, 4 additional growth drivers, and 2 additional restraints and challenges are covered in the full report. Contact sales@marketmindsadvisory.com to access the complete intelligence.

Segment CAGR and Growth Architecture

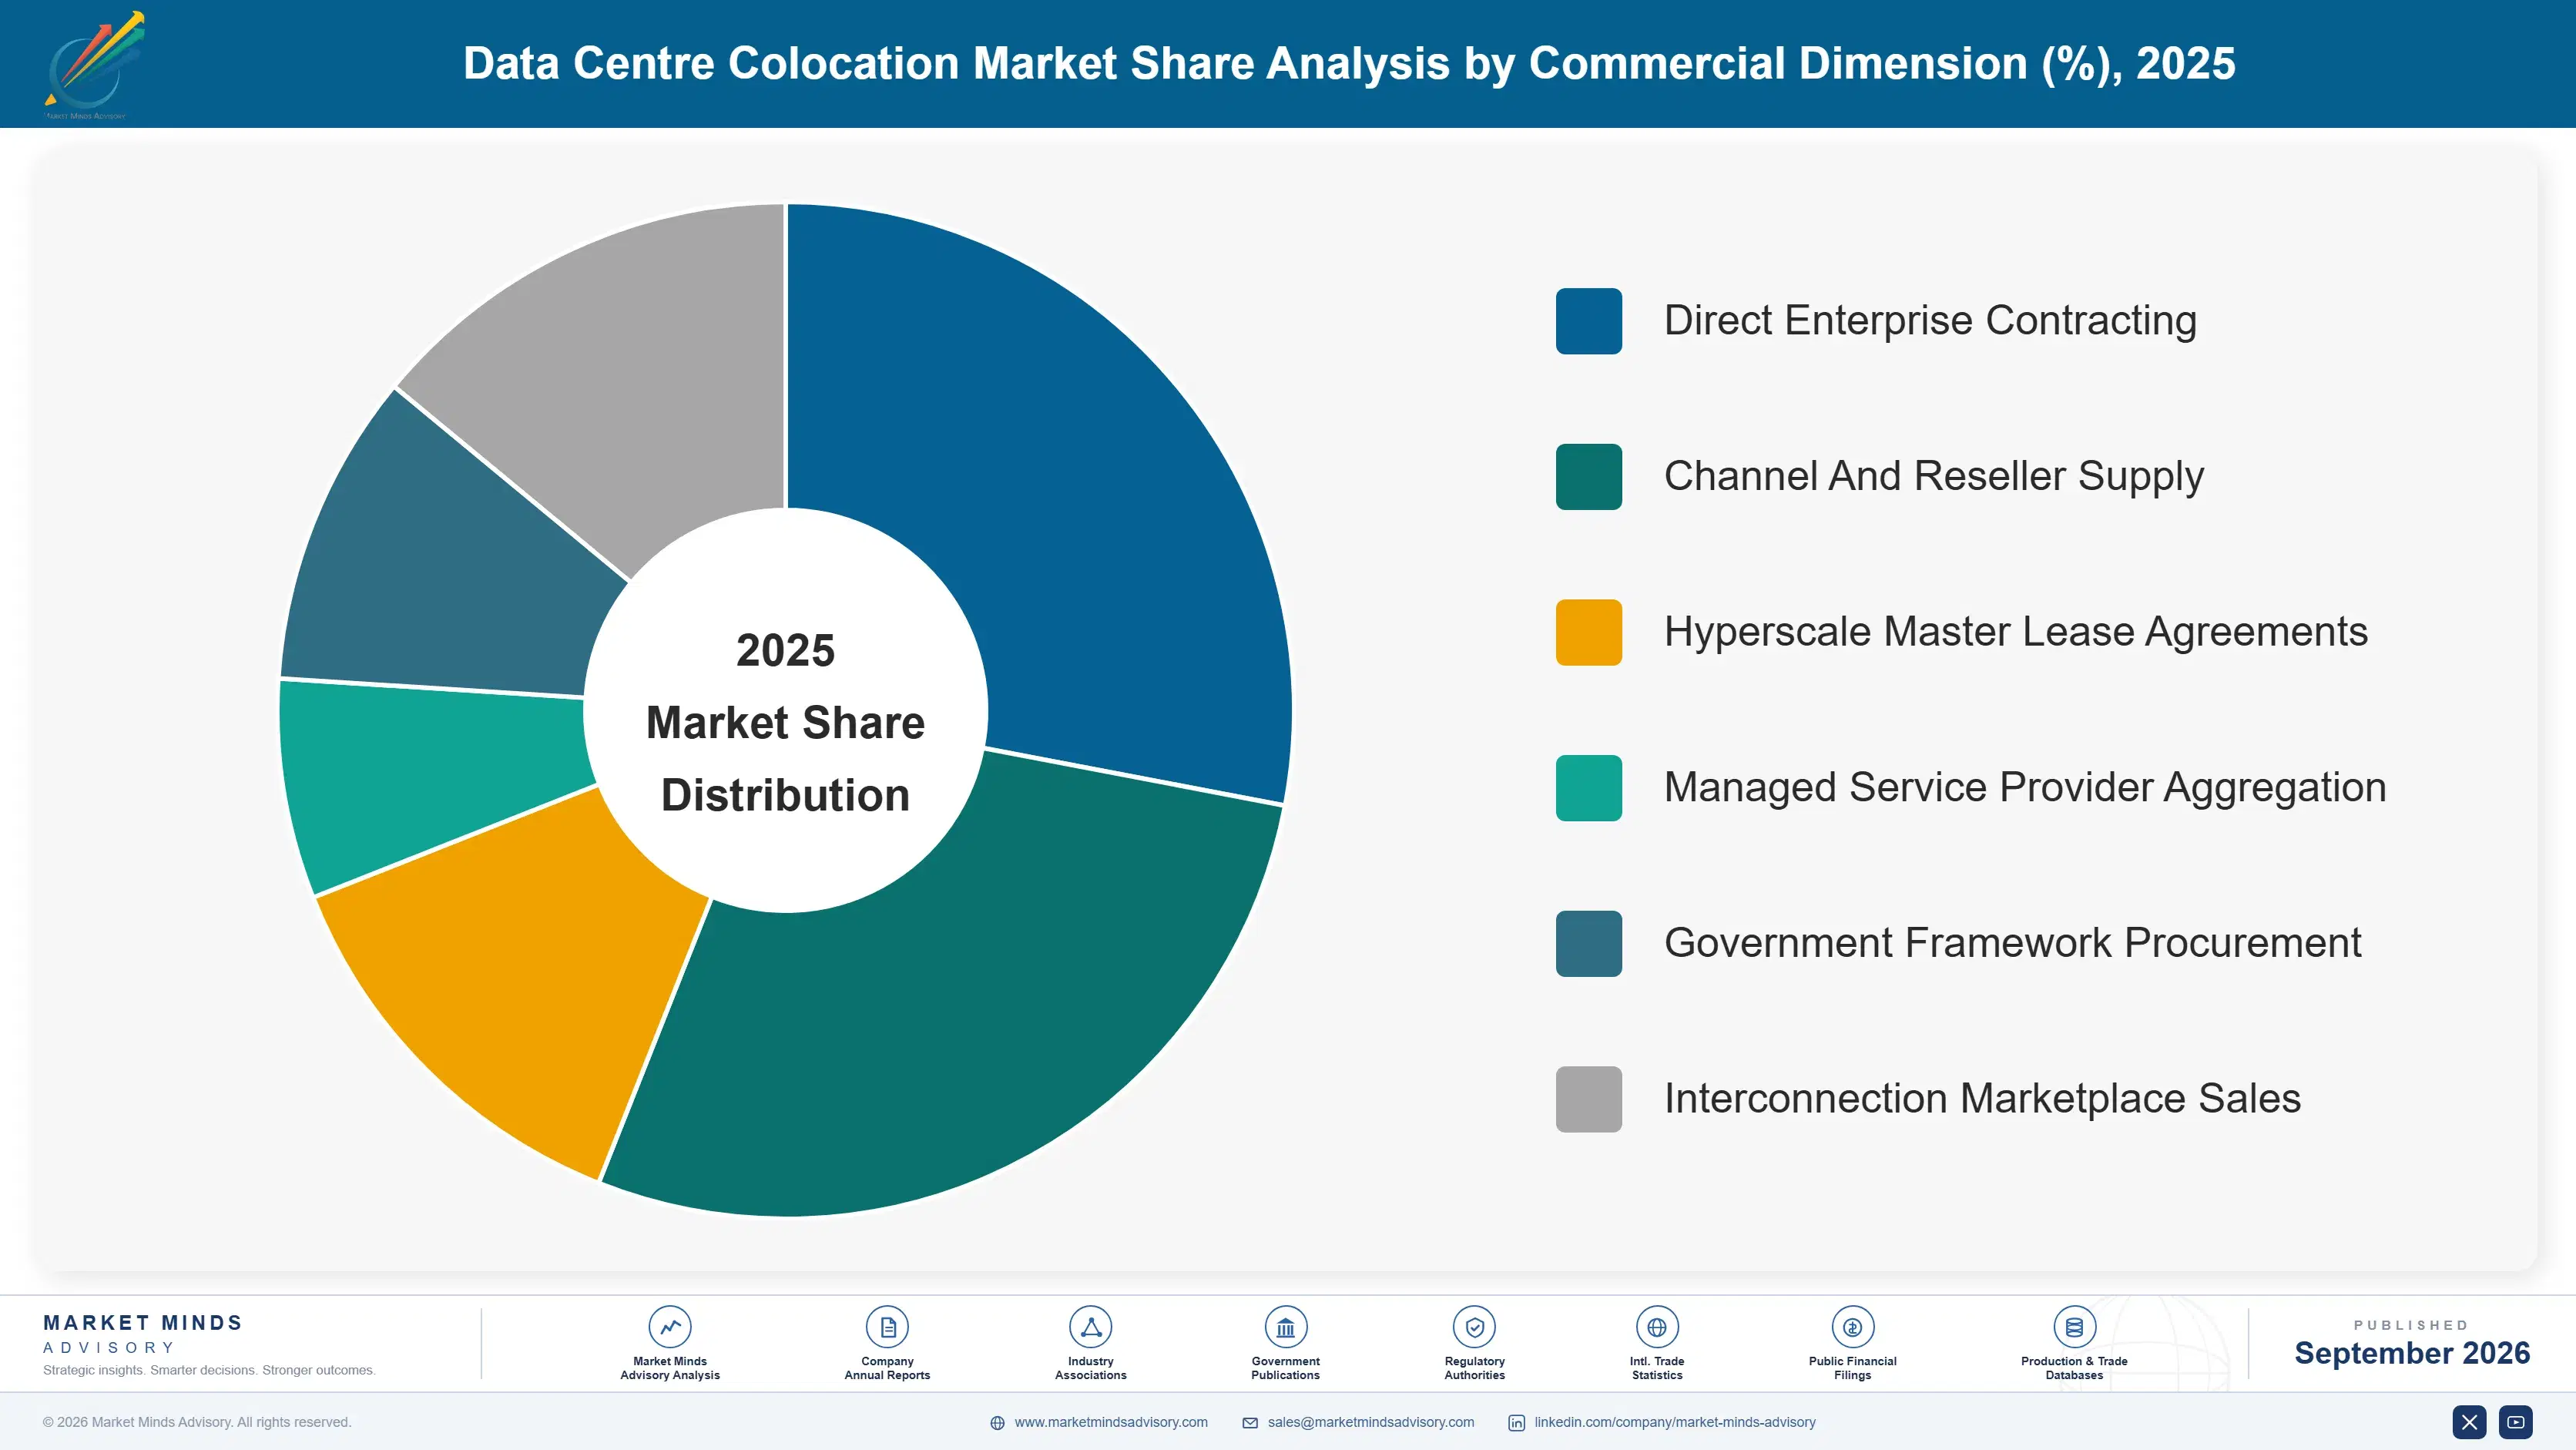
Segmentation follows colocation product class, since what a tenant contracts for determines the facility design, the pricing basis and the length of the commitment. Six classes cover the market: liquid-cooled high-density colocation, hyperscale build-to-suit leasing, sovereign and air-gapped colocation, metro edge colocation, wholesale halls, and retail cage and cabinet. Geography and tenant industry are separate dimensions.
data-center-colocation-market-market-share-analysis-1789988850253

Liquid-Cooled High-Density Colocation

Liquid-cooled high-density colocation grows at 17.1%, half again the market rate of 11.4%, and the driver is physics rather than preference. A conventional rack draws six to eight kilowatts and air removes the heat. An artificial intelligence training rack draws around 110 kilowatts and air simply cannot. Direct-to-chip and immersion cooling need different floor loading, plumbing and power distribution, so this is new construction rather than upgraded capacity in almost every case. The commercial consequence is that operators who committed to liquid cooling before the demand was proven now hold the only capacity a large category of tenant can actually use. Timing mattered considerably more than scale did in this instance.
CAGR 17.1%

Hyperscale Build-to-Suit Leasing

Hyperscale build-to-suit leasing compounds at 14.6% on a handful of tenants who together account for most of the contracted pipeline in this industry. The arrangement is closer to project finance than to property leasing: the tenant specifies the facility, commits for fifteen years or longer, and the operator builds against that commitment. Margins are thinner than retail colocation earns and the counterparty risk is enormous, since a small number of buyers can defer capital spending together. Operators accept it because the scale fills a campus at once and because turning down the only tenants who can absorb that capacity is not a realistic strategy. Concentration risk is the price of scale.
CAGR 14.6%
Full segment breakdown across 6 segments available in the complete report.

Regional Architecture and Country Demand Map

North America takes 36% of contracted load revenue, above the standard band, and the reason is that Northern Virginia alone is larger than most national markets. East Asia follows at 25%. This is one of the few infrastructure categories where American dominance is genuinely unarguable.

North America

North America holds 36% of contracted load revenue, above the 32% band ceiling, because Northern Virginia alone carries more colocation capacity than most national markets and the concentration compounds itself: fibre routes, tenant presence and utility relationships all accumulated in one county. Dallas, Phoenix, Atlanta and Chicago follow, each chosen for power availability rather than for proximity to users. The constraint is now the grid, with Dominion Energy connection queues around 48 months and several jurisdictions imposing moratoria. Growth at 11.0% is close to the global rate and would be higher if power could be delivered. Land and capital are not the problem here. They have not been for several years.
Share: 36% | CAGR: 11.0% (2026 to 2036)

East Asia

Twenty-five percent of contracted load revenue sits in East Asia, and the market divides on ownership rather than on geography. China Telecom, China Unicom and China Mobile operate enormous state-linked capacity at pricing no commercial operator matches, while GDS Holdings and Chindata compete for the internet platform tenants. Japanese demand runs through NTT DATA and KDDI on facilities built to seismic standards that add real cost. Korean capacity concentrates around Seoul, where power constraints now match anything seen in Virginia. Growth at 12.2% sits above the global rate on artificial intelligence buildout across all three countries. Ownership structure explains more here than demand does. That is unusual for infrastructure of this kind.
Share: 25% | CAGR: 12.2% (2026 to 2036)
Regional intelligence for 5 additional markets available in the complete report: Western Europe, South Asia and Pacific, Latin America, Middle East and Africa, Eastern Europe. Contact sales@marketmindsadvisory.com.
data-center-colocation-market-country-cagr-analysis-1789988851172

How Colocation Operators Make Money

Nothing in this business earns a return without power, and power is now rationed by a queue nobody controls. The four levers below all reduce to the same discipline: securing electrical capacity earlier than demand requires it, and designing facilities that can host what tenants will need rather than what they need today. Both cost money early.

Buy Grid Capacity Before You Need It

Interconnection queues in constrained metros run around 48 months and several utilities have paused new applications entirely, which means the connection an operator applies for today serves demand arriving in 2030. Applying speculatively costs deposit money and looks undisciplined to a board reviewing capital allocation quarterly. It is nonetheless the single highest return decision available in this industry, because a signed interconnect agreement cannot be bought from a competitor at any price. Operators who did this before 2022 hold positions their better funded rivals cannot replicate. The deposit is trivial against the option value.
Market Impact: A 48 month queue makes early application decisive

Build For 110 Kilowatt Racks Now

A conventional rack draws six to eight kilowatts, a training rack draws around 110, and the difference is not a specification choice but a building design. Floor loading, cooling distribution and electrical topology are fixed at construction, so a hall built for air cooling is stranded when high-density demand arrives. Liquid-cooled colocation compounds at 17.1% against 11.4% for the market. Building liquid-ready capacity before the tenant asks costs more per megawatt and reaches a category of demand that competitors physically cannot serve at all. Retrofit later costs most of a new build.
Market Impact: Liquid-cooled capacity compounds at 17.1% against 11.4% overall

Reprice Renewals Rather Than Chasing New Tenants

Colocation prices fell every year for two decades and the commercial organisations in this industry were built around that assumption, with renewal teams trained to defend against churn rather than to raise price. Supply constraint reversed the trend and renewal uplifts now run around 14% in constrained metros, but only where the operator asks. A tenant facing a 48 month wait for alternative capacity has very little negotiating position. The revenue available from repricing an existing book exceeds what new construction delivers in the same period, at no capital cost.
Market Impact: Renewal uplifts reach a full 14% in constrained metros

Site Where The Power Is, Not The Users

Latency requirements for training workloads are far looser than for interactive services, which means an artificial intelligence campus does not need to sit near anybody. Operators keep siting against a user map inherited from the interactive era while the constraint has moved entirely to the grid. Regions with available generation and short connection queues, including the Nordics, the American interior, Johor and the Gulf, deliver capacity years earlier than a metro facing a 48 month queue can. That timing advantage is worth more than the latency penalty costs, for a large and growing share of demand.
Market Impact: Unconstrained siting easily beats a 48 month queue

Who Controls the Margin Pool

Five operators hold 44% of contracted load revenue, fragmented for an industry requiring this much capital. Equinix and Digital Realty lead the global platforms, with a gap to the next tier that reflects interconnection density rather than square footage. NTT DATA and China Telecom hold regional scale nobody global matches locally. Vantage rounds out the group on delivery speed. All participants are assessed on contracted load revenue.
Competition runs on delivery date rather than on price or specification. A tenant needing 30 megawatts in 2028 selects whoever can actually provide it, which means the contest is decided by grid position and construction speed years before any commercial conversation. Private capital vehicles behind Aligned, STACK and Vantage compete specifically on this, and they moved faster than the listed operators did.

Rankings shift on which operators committed to liquid cooling early, because that decision cannot be reversed after construction and it determines whether a facility can host the fastest growing demand at all. The second pressure is hyperscaler self-build: the largest tenants increasingly construct their own campuses, which removes the anchor tenant from exactly the projects operators financed against them. That is an uncomfortable dependency.
data-center-colocation-market-company-positioning-matrix-1789988852090

Competitive Moat and Risk Dimensions

EQUINIX

Moat: Interconnection Density Compounds Itself

Equinix facilities hold the largest concentration of network and cloud connection points anywhere, and every tenant that joins makes the next one more valuable. That is a genuine network effect in an industry that otherwise has none, and it explains pricing per cabinet that wholesale operators cannot approach. Replicating it requires tenants to move first, which they will not.
EQUINIX

Risk: Retail Density Constrains Growth

The interconnection advantage lives in retail colocation, which grows at 4.2% while liquid-cooled high-density capacity compounds at 17.1%. Serving artificial intelligence demand requires large new-build facilities where the network effect does not apply and the company competes on cost and delivery like everybody else. Growing into the fast segment means competing without the advantage that defines it.
DIGITAL REALTY

Moat: Land And Power Bank

Digital Realty accumulated land parcels with secured utility connections across constrained metros over many years, at a time when nobody valued them highly. Those positions cannot be assembled now at any price, because the interconnection queues that make them valuable also prevent anybody replicating them. It is an inventory advantage that looks unremarkable and decides which projects are deliverable.
DIGITAL REALTY

Risk: Hyperscale Tenant Concentration

A large share of contracted capacity sits with a small number of hyperscale tenants who negotiate hard, commit for long periods and increasingly build their own campuses instead. A deferral of artificial intelligence capital spending by two or three buyers would land on construction already committed. Concentration delivers the scale and creates the exposure at exactly the same time.

Players Tracked

Prominent Players

Equinix
Digital Realty
NTT DATA
China Telecom
Vantage Data Centers

Other Key Players

CyrusOne
QTS Data Centers
STACK Infrastructure
Aligned Data Centers
CoreSite
Iron Mountain Data Centers
GDS Holdings
Chindata Group
Global Switch
Telehouse
Colt Data Centre Services
NEXTDC
AirTrunk
Yotta Infrastructure
Princeton Digital Group

Recent Developments

MARCH 2025

Equinix Commits Capital To Liquid Cooled Capacity Expansion

Equinix committed capital to expanding liquid-cooled high-density capacity across several existing campuses, an organic expansion rather than an acquisition. The work targets artificial intelligence tenants whose racks draw far beyond what air cooled halls support, and it addresses the fastest growing product class in the industry directly.
Signal: Retail interconnection operators are being pulled into a wholesale build contest they did not really choose.
AUGUST 2024

Digital Realty Secures Additional Grid Capacity In Constrained Metros

Digital Realty secured additional utility interconnection capacity across several supply constrained metropolitan markets, an organic procurement action rather than a joint venture or acquisition. Connection queues in those markets run years, so capacity secured now serves demand arriving toward the end of the decade rather than any current tenant requirement.
Signal: Buying power years ahead of demand is now the defining commercial discipline in this whole industry.
JUNE 2025

Yotta Infrastructure Expands Indian Capacity Under Localisation Rules

Yotta Infrastructure expanded data centre capacity across Indian markets, an organic capacity expansion rather than a partnership or merger. Indian data protection requirements keep categories of data onshore, and cheap land beside Mumbai and Chennai landing stations makes the economics work in a way that European sites no longer do.
Signal: Regulation is relocating capacity to places that also happen to have plenty of available cheap power.

What A Megawatt Actually Costs

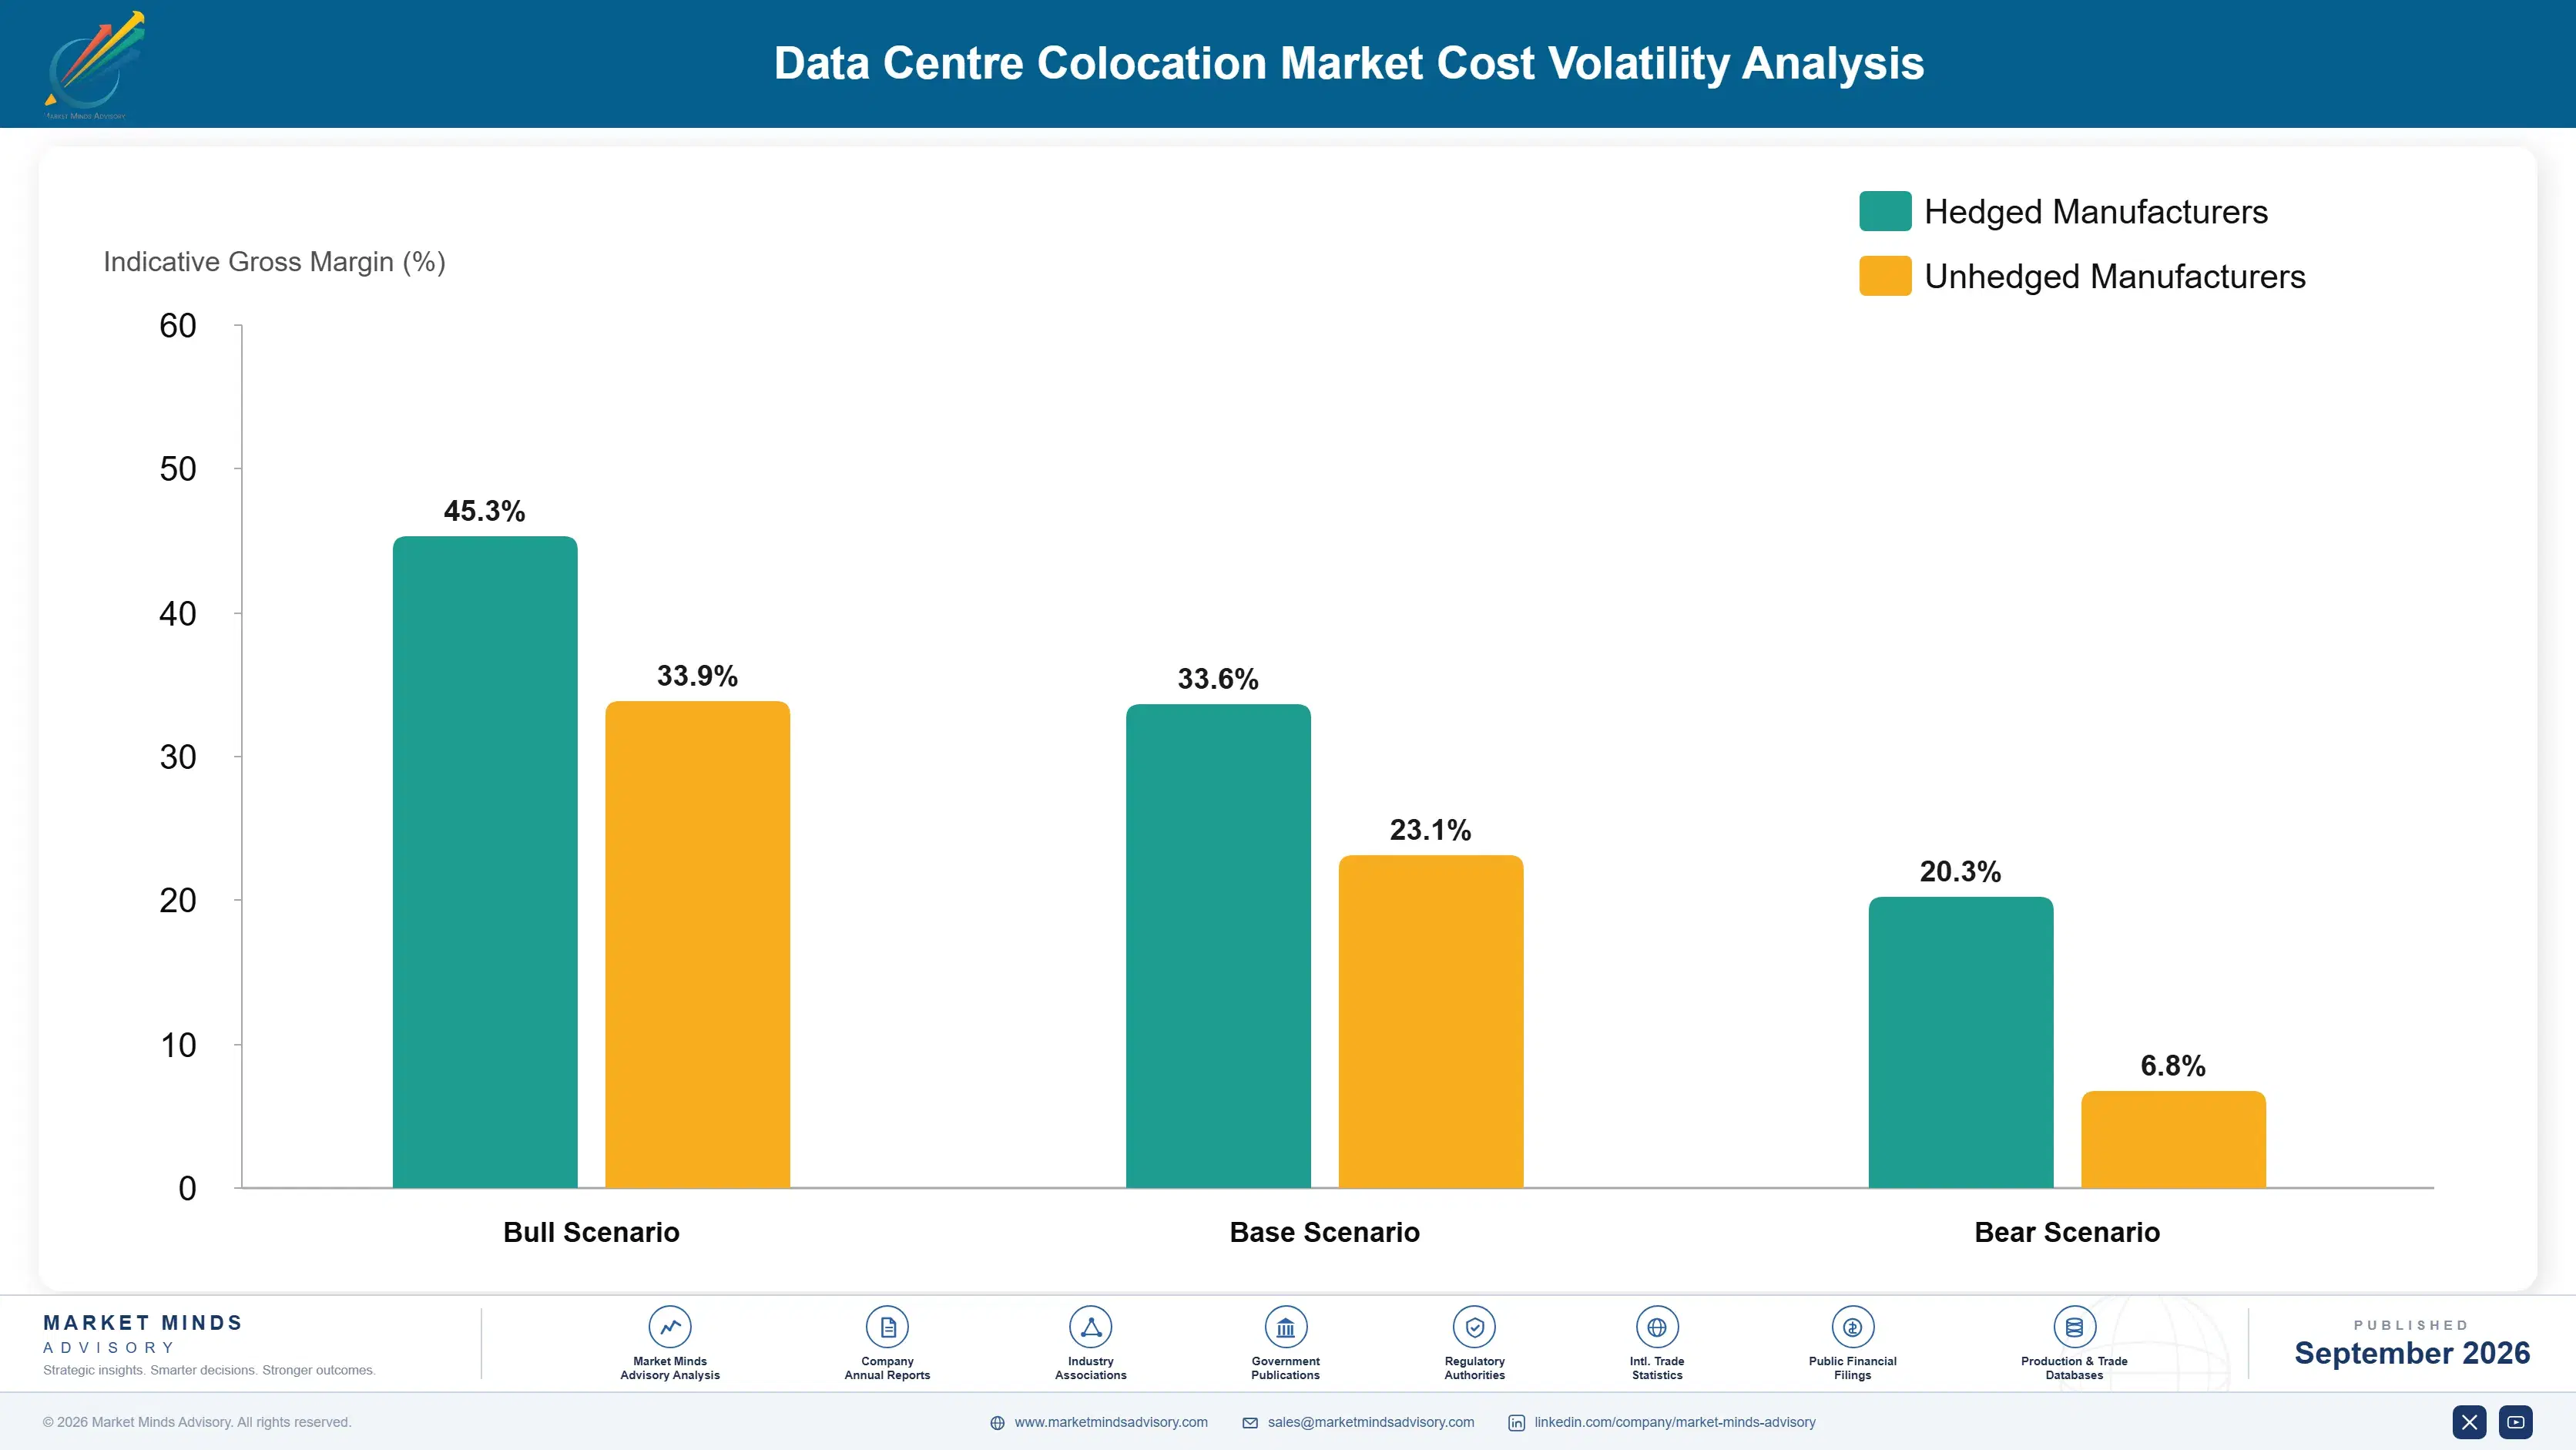
Electricity accounts for roughly 42% of operating cost at a typical facility, purchased on wholesale contracts that vary enormously by grid. Construction depreciation carries around 24%, concentrated in electrical distribution and cooling plant rather than in the building shell. Staffing runs about 12%, and the balance covers maintenance, network transit, insurance and local property tax.
European wholesale power prices moved violently through 2022 and 2023, and the IEA has documented how far industrial electricity costs diverged between regions as a result. Equinix Annual Report 2024 and Digital Realty Annual Report 2024 both record energy procurement as a principal cost variable, with hedging programmes running years forward. Operators with fixed price tenant contracts and floating power exposure discovered the mismatch expensively, and several repriced as soon as leases permitted.

The competitive disadvantage mechanism is power contract structure rather than consumption. Two operators in the same metro running identical efficiency can differ by a wide margin on delivered cost, purely because one hedged and one did not. Exposure varies by geography as well: Gulf and Nordic operators buy power at a fraction of European rates, while operators in constrained American metros face rising rates and rising property tax together.
data-center-colocation-market-cost-volatility-analysis-1789988852408

Hedge Power Purchase Across The Lease Term

Electricity runs about 42% of operating cost and tenant contracts frequently fix pricing for five years or more, which leaves the operator absorbing every movement in between. Matching the hedge tenor to the lease tenor removes that mismatch entirely, at a premium that is small against the exposure. Operators learned this expensively through 2022 and several still have not.

Trade Load Flexibility For Earlier Grid Connection

Utility connection queues run around 48 months in constrained metros, and utilities will move applicants forward in exchange for interruptible load commitments or on-site generation that supports the grid at peak. Most colocation tenants can tolerate brief curtailment on non-critical load if the contract prices it. Selling that flexibility buys years of earlier revenue for a modest service level concession.

Design Cooling For Efficiency At Partial Load

Power usage effectiveness around 1.28 is achievable at design load and considerably worse when a hall runs half full, which is how most facilities operate for their first several years. Cooling plant sized in modular increments rather than as one large system holds efficiency through the fill period. The capital cost is marginally higher and the operating saving arrives immediately.

Portfolio Architecture for Margin Defence

Margin architecture separates on how much the tenant depends on the operator beyond the space itself. Hyperscale build-to-suit earns least per megawatt, because a sophisticated tenant specifying its own facility captures the value of doing so. Wholesale halls sit above that. Retail cage and cabinet, sovereign colocation and liquid-cooled high-density earn most, each for a different reason but all because substitution is difficult.
The volume versus premium tension is a capital allocation problem with a long memory. A hyperscale campus fills instantly at thin margin and consumes the grid capacity that would have served retail tenants at three times the rate per megawatt. Operators keep taking the volume because it de-risks the construction financing, then discover the scarce input went to the lowest yielding use. Grid capacity, not capital, is what gets allocated.

High-value pools concentrate in liquid-cooled high-density capacity and in sovereign colocation, and neither is reached by building more of what an operator already has. Liquid cooling requires design decisions taken before construction. Sovereign facilities require accreditation, cleared staff and physical separation that a commercial hall cannot retrofit. Both are commitments made years ahead of the revenue, which is why few operators hold meaningful positions in either.

Volume / Commodity-Adjacent

Hyperscale build-to-suit leasing and wholesale halls, where sophisticated tenants specify their own requirements and negotiate against multiple bidders. The eight point spread separates operators with cheap secured power from those buying at market rates in constrained metros.
Gross Margin: 32% to 40%

Premium / Certified

Retail cage and cabinet colocation plus metro edge capacity, sold on interconnection density and proximity rather than on price per megawatt. The ten point spread tracks how much network and cloud connectivity a given facility concentrates, which is what tenants actually pay for.
Gross Margin: 48% to 58%

Sustainability / Regulatory / Next-Generation

Liquid-cooled high-density colocation and sovereign air-gapped facilities, where the tenant has few alternatives and the operator committed capital years before the demand existed. The twelve point spread reflects how early each operator made that commitment relative to everybody else.
Gross Margin: 60% to 72%
data-center-colocation-market-portfolio-architecture-1789988853249

High-value Sub-segments and Strategic Watch-out

Liquid-Cooled High-Density Colocation

Grows at 17.1% because training racks draw around 110 kilowatts and air cooling cannot remove that heat at all. The twelve point spread reflects commitment timing. Retrofit is not practical, so this is new construction and the decision was made years ago by whoever holds it.
Gross Margin: 60% to 72%

Hyperscale Build-to-Suit Leasing

Grows at 14.6% on a handful of tenants who account for most of the contracted pipeline in this industry. The eight point spread reflects power procurement. Margins are thin and counterparty concentration is severe, which operators accept because the scale fills a campus at once.
Gross Margin: 32% to 40%

Sovereign And Air-Gapped Colocation

Grows at 12.8% on data localisation rules across India, the Gulf, Indonesia and the European Union. The twelve point spread reflects accreditation depth. Tenants are governments, banks and health systems who pay for compliance rather than for any competitive price per megawatt anywhere at all.
Gross Margin: 60% to 72%

Retail Cage And Cabinet Colocation

Grows at 4.2%, slowest of the six classes, but survives because enterprises can no longer staff their own facilities and retirement is doing the rest. The ten point spread tracks interconnection density. Margins per megawatt remain the highest anywhere in this business, and always have.
Gross Margin: 48% to 58%

Why Tenants Almost Never Leave

The annuity is physical rather than contractual. Moving a production workload out of a colocation facility means migrating live systems, re-establishing network connections and accepting downtime that most organisations will not schedule, which is why churn in retail colocation runs at a fraction of what comparable service contracts see. Wholesale and hyperscale leases run fifteen years or longer and the tenant has usually funded facility-specific fit-out that has no value elsewhere.
Depth varies sharply by tenant type. A financial institution with regulated systems and network peering built over a decade is effectively permanent. A government tenant in an accredited sovereign facility is more permanent still, because the accreditation itself is site-specific. A hyperscaler is the shallowest despite the longest lease, since it can build its own campus and increasingly does exactly that.

The buyer changed and the sales organisation mostly did not. Fifteen years ago the customer was an infrastructure manager comparing rack prices. Today it is a capital committee evaluating whether power will be available in 2029, which is a different conversation requiring different evidence. Operators still selling on price per cabinet are answering a question that stopped mattering some time ago.
data-center-colocation-market-end-use-penetration-index-1789988854123

Where Colocation Returns Are Decided

These are among the four positions where our research anticipates prominent divergence between winners and laggards over the coming forecast period. Each is grounded in the demand model, the regulatory perimeter, and the announced capacity pipeline.
01 / GRID CAPACITY ACQUISITION

Apply For Power Before You Have Tenants

Interconnection queues in constrained metros run around 48 months and several utilities have paused new applications entirely, so the connection applied for today serves demand arriving in 2030 rather than any tenant currently in negotiation. Applying speculatively costs deposit money and looks undisciplined to a board reviewing capital allocation quarterly, which is precisely why so few operators do it. It is nonetheless the highest return decision available in this industry, because a signed interconnect agreement cannot be bought from a competitor at any price whatsoever.
02 / HIGH DENSITY READINESS

Build For The Rack You Cannot Cool

A conventional rack draws six to eight kilowatts and an artificial intelligence training rack draws around 110, and the difference is a building design rather than a specification choice. Floor loading, cooling distribution and electrical topology are fixed at construction, so a hall built for air cooling is stranded exactly where demand is strongest and retrofit costs a large fraction of new build. Liquid-cooled colocation compounds at 17.1% against 11.4% for the market, and the operators serving it decided years ago.
03 / RENEWAL BOOK REPRICING

Ask For The Increase The Market Allows

Colocation prices fell every year for two decades and commercial organisations were built around defending against churn rather than raising price, which is a habit that has outlived the conditions that created it. Supply constraint reversed the trend and renewal uplifts now run around 14% in constrained metros, but only where the operator actually asks for them. A tenant facing a 48 month wait for alternative capacity has very little negotiating position, and repricing an existing book requires no capital at all.
04 / SITING AGAINST POWER

Follow The Grid, Not The Users

Latency requirements for training workloads are far looser than for interactive services, so an artificial intelligence campus does not need to sit near anybody in particular. Operators keep siting against a user map inherited from the interactive era while the binding constraint moved entirely to the grid several years ago. Regions with available generation and short connection queues, including the Nordics, the American interior, Johor and the Gulf, deliver capacity years before a metro facing a 48 month queue can.

Engagement Snapshot From the Field

A live engagement with an industry participant carrying material or product regulatory and market exposure ahead of a defining policy shift, showing how our research translates into a defensible multi-year portfolio strategy.
MARKET MINDS ADVISORY · CLIENT ENGAGEMENT SUMMARY
Data Centre Colocation Producer Strategic Portfolio Review and Transition Roadmap 2026·Investment Scenario on Data Centre Colocation Exposure Evaluation 2025-26
CLIENT PROFILE
A colocation operator with facilities across nine metropolitan markets and a construction pipeline committed against tenant demand it could not yet deliver. Three of the nine markets had utility connection queues beyond four years, and the board had approved land acquisition in two of them without establishing when power would actually arrive. The construction budget was already committed. Nobody had connected the two facts.
STRATEGIC CHALLENGE
Development wanted to continue building in the established metros where tenant demand was strongest and brand recognition was highest. Finance pointed out that capital was being deployed into markets where the asset could not generate revenue for years. Neither position accounted for what tenants would accept on latency, which nobody had actually asked them about at any point.
MMA APPROACH
MMA mapped utility connection timelines across the nine existing markets and eleven alternative sites, and modelled deliverable capacity by year against the committed pipeline. We surveyed tenant latency tolerance by workload class through the quantitative survey of 3,800 respondents conducted in Q4 2025 across six countries, and tested the resulting siting options against power cost and connection availability together.
KEY FINDINGS
  1. Training workload tenants accepted latency penalties that 7 of the 11 alternative sites met comfortably, which nobody at the operator had established before committing capital.
  2. Two of the three constrained markets could not deliver power before 2031, which was 3 years beyond the date the committed pipeline assumed.
  3. Alternative sites with available generation delivered capacity roughly 30 months earlier at power costs about 22% below the constrained metros (client-reported, unverified by MMA).
  4. Interactive and sovereign workloads genuinely required the constrained metros, and represented about 40% of the pipeline rather than the whole of it.
CLIENT PROFILE
A colocation operator with facilities across nine metropolitan markets and a construction pipeline committed against tenant demand it could not yet deliver. Three of the nine markets had utility connection queues beyond four years, and the board had approved land acquisition in two of them without establishing when power would actually arrive. The construction budget was already committed. Nobody had connected the two facts.
STRATEGIC CHALLENGE
Development wanted to continue building in the established metros where tenant demand was strongest and brand recognition was highest. Finance pointed out that capital was being deployed into markets where the asset could not generate revenue for years. Neither position accounted for what tenants would accept on latency, which nobody had actually asked them about at any point.
MMA APPROACH
MMA mapped utility connection timelines across the nine existing markets and eleven alternative sites, and modelled deliverable capacity by year against the committed pipeline. We surveyed tenant latency tolerance by workload class through the quantitative survey of 3,800 respondents conducted in Q4 2025 across six countries, and tested the resulting siting options against power cost and connection availability together.
KEY FINDINGS
  1. Training workload tenants accepted latency penalties that 7 of the 11 alternative sites met comfortably, which nobody at the operator had established before committing capital.
  2. Two of the three constrained markets could not deliver power before 2031, which was 3 years beyond the date the committed pipeline assumed.
  3. Alternative sites with available generation delivered capacity roughly 30 months earlier at power costs about 22% below the constrained metros (client-reported, unverified by MMA).
  4. Interactive and sovereign workloads genuinely required the constrained metros, and represented about 40% of the pipeline rather than the whole of it.
RECOMMENDED STRATEGY
Phase 1: Phase one: redirect training workload capacity to the seven alternative sites that meet tenant latency tolerance and have power available years earlier. Phase 2: Phase two: hold the constrained metro land for the 40% of pipeline that genuinely requires it, and stop buying more there. Phase 3: Phase three: apply speculatively for utility connections in six further unconstrained markets, ahead of any identified tenant demand at all.
OUTCOME
The operator redirected roughly 60% of its pipeline to unconstrained sites and brought capacity online about 30 months earlier than the original plan allowed (client-reported, unverified by MMA). Power cost fell materially on the redirected volume. Speculative connection applications are now standard practice ahead of tenant demand, which is the change that outlasted the engagement.

Frequently Asked Questions

Foundational context covering the market sizes, CAGR, scope, country, region and competition that inform every finding below. This section is provided to cover basics and most often pre-purchase conversations, answered from the MMA Primary Research Dataset.

What is the current size of the Data Centre Colocation Market?

Global value reaches USD 75.75 billion in 2026, measured as contracted IT load revenue across third-party colocation facilities. The 2025 base is USD 68.0 billion.

How large will the Data Centre Colocation Market be by 2036?

Contracted load revenue reaches USD 222.96 billion by 2036, an increase of USD 147.21 billion over the forecast period. That represents 2.94 times expansion from the 2026 base.

What is the CAGR for the Data Centre Colocation Market 2026 to 2036?

The base case runs at 11.4% annually, with a bull case at 12.6% if grid connection queues shorten and a bear case at 10.2% if artificial intelligence capital spending pauses.

Which segment is growing fastest?

Liquid-cooled high-density colocation grows at 17.1%, half again the market rate of 11.4%. A training rack draws around 110 kilowatts and air cooling physically cannot remove that heat.

Who are the major companies in the Data Centre Colocation Market?

Equinix, Digital Realty, NTT DATA, China Telecom and Vantage Data Centers lead on contracted load revenue, together holding 44%. CyrusOne, GDS Holdings and AirTrunk hold smaller positions.

Which country is growing fastest?

India leads at 19.4%, on data localisation rules that keep categories of data onshore and cheap land beside the Mumbai and Chennai landing stations. Brazil and Poland follow.

Report Segmentation Architecture

The full report scope spans multiple orthogonal segmentation dimensions, with cross-tabulated demand data provided for each dimension pair. Coverage extends further to regional breakdowns, trend trajectories, and the competitive detail needed to support segment-level decision-making.

By Colocation Product Class

  • Liquid-Cooled High-Density Colocation
  • Hyperscale Build-to-Suit Leasing
  • Sovereign And Air-Gapped Colocation
  • Metro Edge Colocation
  • Wholesale Colocation Halls
  • Retail Cage And Cabinet Colocation

By End-Use Industry

  • Cloud And Internet Platforms
  • Financial Services And Banking
  • Government And Public Sector
  • Telecommunications Carriers
  • Healthcare And Life Sciences
  • Manufacturing And Industrial

By Commercial Dimension

  • Direct Enterprise Contracting
  • Channel And Reseller Supply
  • Hyperscale Master Lease Agreements
  • Managed Service Provider Aggregation
  • Government Framework Procurement
  • Interconnection Marketplace Sales

By Region

  • North America
  • Western Europe
  • East Asia
  • South Asia and Pacific
  • Latin America
  • Middle East and Africa
  • Eastern Europe

Scope, Methodology, and Coverage

Every figure in this report is reproducible from documented input assumptions. The scope below maps the historical period, the forecast horizon, the segmentation dimensions, and the countries covered, alongside the underlying primary and qualitative methodology.
Historical Period
2020 to 2025
Forecast Period
2026 to 2036
Base Year
2025 (USD billions; MMA Primary Research Dataset, September 2026)
Market Definition
This report covers third-party data centre facilities leasing space, power and cooling to tenant organisations: hyperscale build-to-suit leasing, wholesale colocation halls, retail cage and cabinet colocation, liquid-cooled high-density colocation, metro edge colocation, and sovereign air-gapped colocation. It excludes owner-operated hyperscale facilities, enterprise on-premises data centres, cloud computing services sold above the facility layer, network transit and bandwidth, and data centre construction contracting.
Quantitative Units
USD millions, contracted IT load revenue basis; contracted capacity in megawatts; power usage effectiveness as a ratio; rack power draw in kilowatts; utility connection lead time in months.
Segmentation Dimensions
Colocation product class; tenant industry; commercial contracting channel; geography across seven regions.
Regions Covered
North America, Western Europe, East Asia, South Asia and Pacific, Latin America, Middle East and Africa, Eastern Europe
Countries Covered
United States, Canada, Mexico, Brazil, Chile, Colombia, United Kingdom, Germany, France, Netherlands, Ireland, Spain, Poland, Czechia, China, Japan, South Korea, India, Australia, Singapore.
Key Companies Profiled
Equinix, Digital Realty, NTT DATA, China Telecom, Vantage Data Centers, CyrusOne, QTS Data Centers, STACK Infrastructure, Aligned Data Centers, CoreSite, GDS Holdings, NEXTDC, AirTrunk, Yotta Infrastructure, Princeton Digital Group.
Quantitative Methodology
Primary survey, n=3,800 respondents, Q4 2025, six countries; demand-side model with trade association cross-validation
Qualitative Methodology
47 expert interviews, Q4 2025; applied to validate demand model assumptions, identify emerging dynamics, and assess competitive positioning
Report Format
PDF and XLSX data workbook (Word format preview document)
Publisher
Market Minds Advisory
Report Code
MMA-2026-TEC-451
Published
September 2026
Contact
sales@marketmindsadvisory.com | www.marketmindsadvisory.com

Purchase the full Data Centre Colocation Market Report (2026 to 2036).

This report sizes the global data centre colocation market from 2026 to 2036 across six product classes, six tenant industries and seven regions. It explains why grid interconnection rather than capital is now the binding constraint, how a 48 month connection queue reshapes competitive position, and why colocation pricing reversed a two decade decline. Cost composition is sourced to IEA electricity analysis and company annual reports, with power at 42% of operating cost. Regional analysis explains why North America holds 36% of contracted load revenue while India grows at 19.4%. Competitive assessment covers 20 named operators with four revenue lever analyses.
Grid interconnection queues modelled as the binding constraint
Six colocation product classes sized to 2036
Power cost composition from IEA and filings
Twenty named operators assessed on contracted load
Four revenue levers with quantified commercial impact
Anonymised global operator siting engagement included in full

Built For The People Who Decide

From boardroom strategy to bench-side execution, this report is read cover-to-cover by leaders shaping the next decade of their industry, turning demand scenarios, market dynamics and valuation benchmarks into decisions.
CXOs/ Presidents/ VPs/ Managers
M&A and Corporate Development
Strategy Teams and R&D Heads
Procurement and Product Directors
Regulatory and Compliance Leaders
Investor Relations and Equity Analysts