Market Minds Advisory
Dark Fiber Market

Dark Fiber Market: AI Datacenter Buildout Drives Unprecedented Dark Fiber Leasing Demand

Hyperscalers are locking up long-term dark fiber leases to interconnect AI training clusters as existing lit capacity proves too rigid for rapidly scaling datacenter campus footprints across major metro markets.

Lead Analyst

Published

September 2026

Make Smarter Decisions with Customized Research Insights

Request a free sample report and evaluate market opportunities, growth trends, and competitive dynamics relevant to your business needs.

2025 MARKET VALUE$6.2BMarket Size 2025
2036 FORECAST VALUE$19.2BBase Case , 2026 to 2036
CAGR 2026 TO 203610.8 %Bull 12.0% / Bear 9.6%
INCREMENTAL OPPORTUNITY$12.3BNet 10- year value creation
EXPANSION MULTIPLE2.79x2036 value over 2026 base
Strategic Levers
M&A Pipeline
Regional Outlook
Country Rankings
Competitive Intelligence
Segmental Deep-dive
Call-Us : 91 93563 13602

Executive Snapshot and Market Trajectory.

Hyperscalers are signing multi-decade dark fiber leases at unprecedented pace to interconnect sprawling AI training campuses, since owning dedicated unlit capacity gives them control over latency and bandwidth that leased lit services cannot reliably guarantee at scale, particularly across the busiest metro corridors and interconnection hubs nationwide.
Data center interconnect demand now dominates new lease signings, outpacing traditional carrier and enterprise wide-area network use cases that once anchored the market for decades before the AI infrastructure boom began reshaping capital allocation. North America generates the largest share of leasing revenue given its dense concentration of hyperscale datacenter campuses, though Asian markets are building new long-haul routes faster than expected as regional cloud providers race to match American infrastructure scale and capability.
Competitive character increasingly favors vendors controlling extensive existing conduit and right-of-way networks over newer entrants building routes from scratch, since permitting and construction timelines now stretch years in dense metro corridors nationwide and internationally across every major market. Regulatory scrutiny of infrastructure consolidation compounds this dynamic, pushing major providers toward strategic partnerships rather than outright acquisition to expand route density across contested urban markets.
Market Definition
The Dark Fiber Market comprises unlit optical fiber infrastructure leased or sold to carriers, hyperscalers, and enterprises for private network deployment. It excludes lit managed bandwidth services, wireless spectrum, and satellite communication infrastructure entirely.
Base Year Value
$6.2B in 2025 (MMA Primary Research Dataset, September 2026)
Forecast Period
2026 to 2036, eleven discrete annual values
CAGR
10.8% base case. Bull 12.0%. Bear 9.6%.
Fastest Growth Segment
Data Center Interconnect Dark Fiber: 18.5% CAGR
Fastest Growth Country
India: 15.2% CAGR
Fastest Growth Region
South Asia and Pacific: 13.0% CAGR
Largest Region
North America: 37% of 2025 global value
Market Leaders
Zayo, Lumen, Crown Castle, Cologix, and Uniti lead the field. Source: MMA Analysis, July 2026.
Primary Survey
n=3,800 procurement and R&D decision-makers, Q4 2025, six countries
Methodology
Demand-side build-up, cross-validated against public data, 47 expert interviews

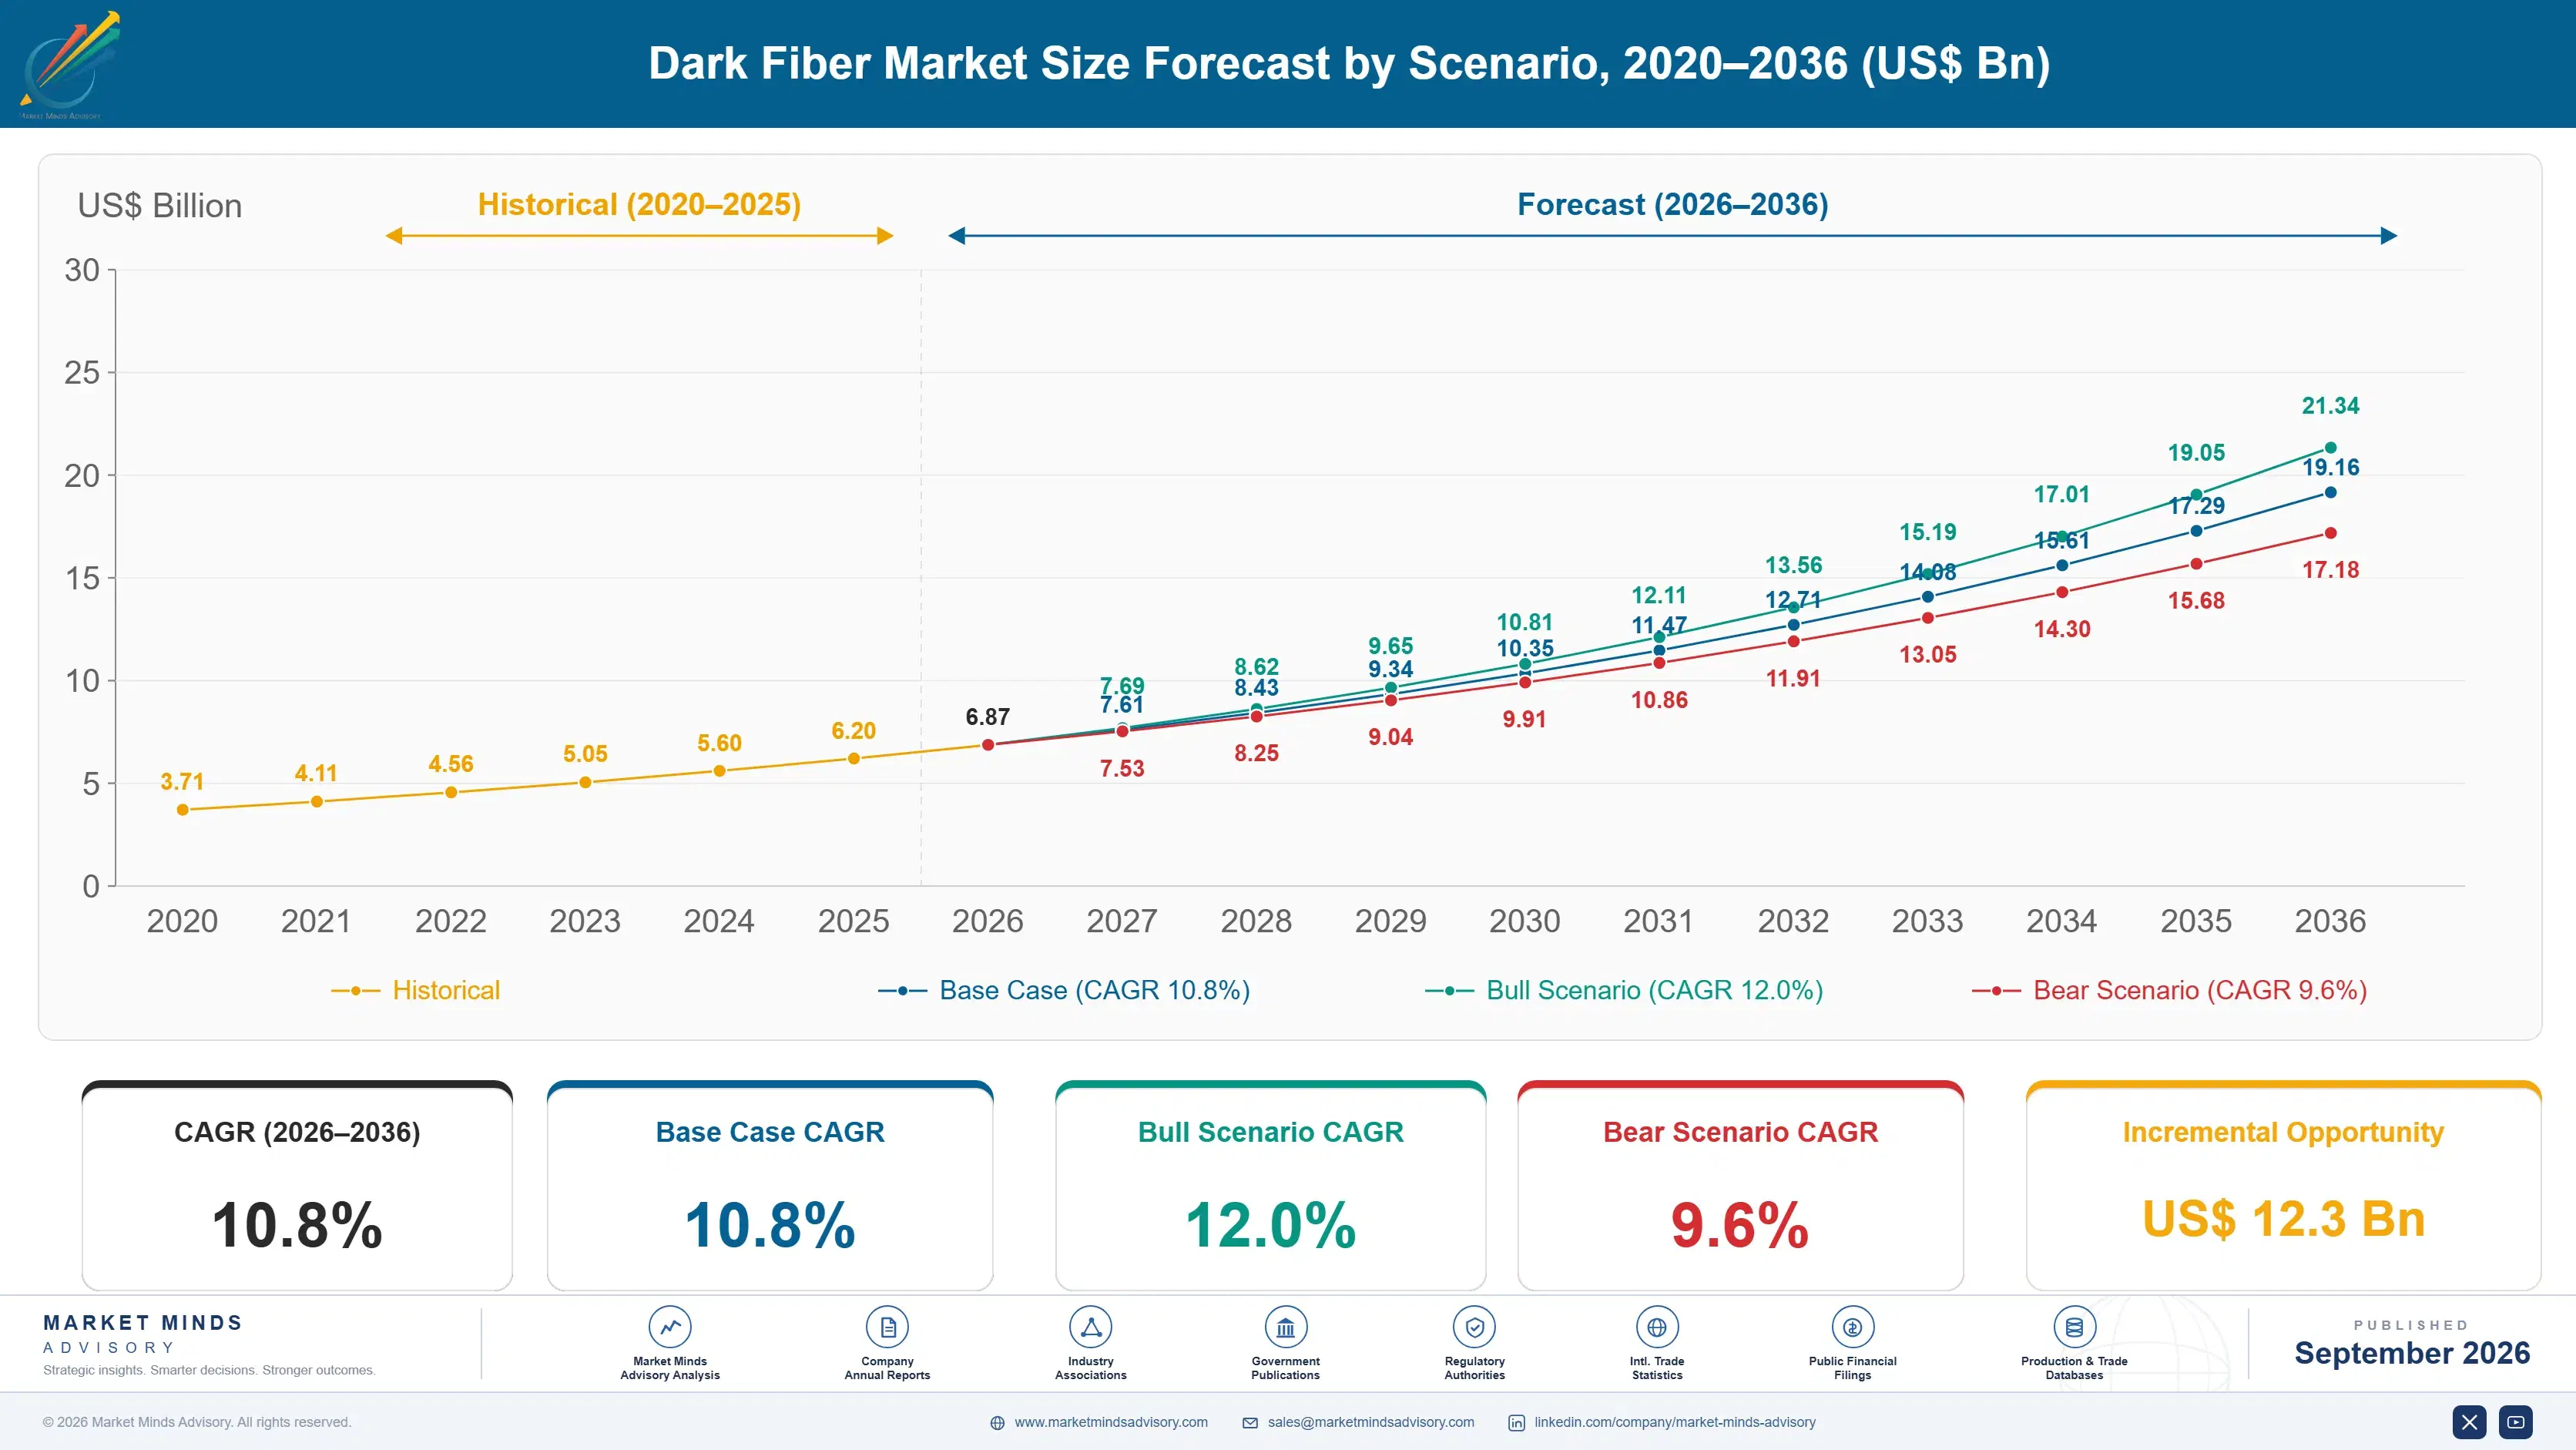
Dark Fiber Market Forecast Scenarios

dark-fiber-market-size-forecast-scenario-1788503375982
Between 2020 and 2025, dark fiber leasing grew steadily as cloud providers expanded regional datacenter footprints, producing a historical CAGR of 9.8 percent as carriers and hyperscalers alike sought dedicated capacity ahead of anticipated bandwidth demand growth across major metropolitan interconnection markets nationwide and internationally, though growth accelerated sharply toward the period's end as AI workloads scaled.
The base case rests on three commercial mechanisms: accelerating hyperscaler datacenter campus construction requiring dedicated interconnect capacity, expanding AI training workload bandwidth requirements exceeding what shared lit services can economically support, and rising enterprise appetite for private network control amid growing cybersecurity concerns. Together these mechanisms support a 10.8 percent compound annual growth rate through 2036, with data center interconnect leasing contributing an increasing share of incremental revenue each year.
The bull case assumes accelerated AI infrastructure investment sustains hyperscaler capital expenditure well above current levels, pushing growth toward 12.0 percent as datacenter campus construction continues expanding rapidly across every major metro market. The bear case reflects a moderation in AI infrastructure spending following current build-out peaks, slowing growth to 9.6 percent as hyperscalers pause new lease signings temporarily.

AI Infrastructure Reshapes Fiber Leasing Economics

Converging forces are reshaping fiber leasing economics across the sector: accelerating AI datacenter campus construction, mounting scarcity of available conduit and right-of-way in dense metro corridors, and growing hyperscaler willingness to pay premium rates locking in long-term dedicated capacity across every major interconnection market. Providers controlling extensive existing route networks now command materially stronger negotiating position than newer entrants building fresh routes from scratch nationwide.
MARKET CONCENTRATION44% CR5share held by top five infrastructure providers combined
AVERAGE LEASE TERM18.5 yearstypical contract duration for long-haul route lease agreements today
TOP METRO MARKET SHARENorthern Virginia 22%share of North American route demand concentrated regionally
FIBER UTILIZATION RATE38% litshare of installed fiber pairs currently activated for service
ROUTE CONSTRUCTION COST$95,000 per mileaverage expense for new metro fiber route deployment
INTERCONNECT LEASE GROWTH31% annuallygrowth rate for datacenter-to-datacenter fiber route agreements yearly
Commercial character in this market increasingly favors providers offering dense metro interconnection points and proven multi-decade infrastructure reliability over newer entrants with unproven route networks and limited operating history. Hyperscalers now evaluate vendors on route diversity and physical redundancy rather than raw price per strand mile alone, reflecting a genuine shift in procurement criteria driven by mounting concerns over single points of failure across critical infrastructure.
The next decade will be shaped by continued AI infrastructure buildout sustaining unprecedented demand for datacenter interconnect capacity, alongside growing subsea cable investment connecting new international AI training hub locations across multiple continents. Providers slow to expand route density risk losing hyperscaler accounts to challengers offering superior physical diversity, faster provisioning timelines, and broader geographic coverage overall.
"Dark fiber used to be a commodity nobody thought about, now it is the single scarcest resource standing between a hyperscaler and its next AI cluster."
Senior Analyst, Digital Infrastructure and Connectivity Practice · MMA Technology Practice · September 2026

Market Trends

Hyperscaler AI Clusters Drive Interconnect Demand

Major cloud providers are constructing massive AI training clusters requiring dedicated, low-latency interconnection between geographically distributed datacenter campuses, driving unprecedented demand for high-count dark fiber routes capable of supporting future bandwidth expansion needs and requirements. Microsoft, Google, Amazon, and Meta collectively announced capital expenditure plans exceeding 300 billion dollars for AI infrastructure in 2025 alone, a meaningful share of which funds dedicated fiber interconnect construction between campus sites. Providers capable of delivering multi-terabit route capacity within compressed construction timelines increasingly win these contracts over competitors offering standard provisioning schedules and terms.
Market Impact: Lifts enterprise leasing revenue 16 percent

Metro Route Scarcity Intensifies Competitive Positioning

Available conduit and right-of-way in dense metro corridors near major datacenter clusters has grown increasingly scarce, as municipal permitting processes and physical space constraints limit how quickly new routes can be constructed to meet surging demand across every contested market, metro region, and interconnection hub nationwide. Providers holding existing route rights in constrained corridors like Northern Virginia and Silicon Valley increasingly command premium lease rates reflecting genuine construction scarcity rather than simple competitive positioning. This scarcity is pushing hyperscalers toward longer lease commitments to secure capacity before availability tightens further.
Market Impact: Expands subsea route capacity 22 percent

Market Opportunities and Growth Drivers

Enterprise Private Network Demand Grows Steadily

Large enterprises across finance, healthcare, and government sectors increasingly lease dedicated dark fiber for private network connectivity, driven by rising concerns over shared-infrastructure security vulnerabilities and regulatory requirements mandating strict data sovereignty and traffic isolation controls across sensitive workloads, applications, and financial transactions. Financial institutions particularly value the deterministic latency dark fiber provides for high-frequency trading connections between exchanges and datacenters, where microsecond advantages translate directly into trading profitability. This driver is reinforced by growing enterprise willingness to pay premium rates for infrastructure entirely outside shared carrier networks vulnerable to congestion.
Market Impact: Delays route construction 8 months

Subsea Cable Investment Expands International Routes

Hyperscalers and consortiums are funding new subsea cable systems connecting emerging AI training hub locations across multiple continents, driven by growing need for international bandwidth capacity that existing decades-old cable systems cannot adequately support at current utilization levels and expected future growth rates over the coming decade ahead. This driver is reinforced by geopolitical diversification strategies, as major cloud providers seek alternative routing paths avoiding congested or politically sensitive cable landing corridors. Vendors participating in these consortium investments secure long-term capacity rights positioning them favorably for future international interconnect demand.
Market Impact: Concentrates 70 percent of route miles

Market Restraints and Challenges

Permitting Delays Slow New Route Construction

Municipal permitting processes for new fiber route construction in dense metro corridors routinely take longer than anticipated, since multiple jurisdictions with overlapping authority over roadway excavation and right-of-way access must each approve construction plans before work can begin. The root cause is fragmented local government authority over infrastructure permitting rather than any single provider's execution shortfall, making acceleration genuinely difficult without policy reform. This friction translates into new route construction projects routinely running 8 to 14 months longer than initially planned, delaying revenue recognition. Providers are addressing this through dedicated permitting specialist teams and standardized applications across jurisdictions simultaneously.
Market Impact: Lifts interconnect route demand 34 percent

Capital Intensity Limits New Entrant Competition

Building new dark fiber routes requires substantial upfront capital investment in trenching, conduit, and cable deployment well before any lease revenue materializes, creating a genuine barrier that limits new entrant competition against established providers with existing route networks and lower incremental construction costs. The underlying cause is the fundamentally capital-intensive nature of physical infrastructure construction, which cannot be circumvented through software or operational efficiency alone. This dynamic concentrates market share among well-capitalized incumbents controlling an estimated 70 percent of existing route miles. Some smaller providers mitigate this by focusing narrowly on underserved regional corridors avoiding direct incumbent competition.
Market Impact: Raises lease rates 28 percent
3 additional market trends, 4 additional growth drivers, and 3 additional restraints and challenges are covered in the full report. Contact sales@marketmindsadvisory.com to access the complete intelligence.

Segment CAGR and Growth Architecture

Segmentation follows network layer and route type, the dimension providers and hyperscalers use most consistently to evaluate capacity availability, construction cost, and lease economics across the industry and every regional market. Six segments span the full network hierarchy from long-haul routes through last-mile enterprise connections, reflecting distinct commercial dynamics and pricing structures at each network layer.
dark-fiber-market-market-share-analysis-1788503376553

Data Center Interconnect Dark Fiber

This segment connects geographically distributed datacenter campuses operated by the same hyperscaler or colocation provider, letting distributed compute clusters function as a single logical unit for AI training and inference workloads requiring extremely low latency and high bandwidth between sites across the entire compute network, campus footprint, and regional data fabric. Demand is concentrated overwhelmingly around major metro clusters like Northern Virginia, Silicon Valley, and increasingly emerging AI infrastructure hubs where multiple hyperscalers operate campuses within reasonable fiber construction distance of one another and shared substations. Providers offering diverse physical routing between campus pairs increasingly win contracts over single-path alternatives vulnerable to outage risk and service disruption during construction and maintenance.
CAGR 18.5%

Subsea and Submarine Dark Fiber

This segment provides dedicated fiber pairs within transoceanic and regional submarine cable systems, connecting international markets and enabling hyperscalers to route AI training data and content delivery traffic across continents without depending entirely on shared carrier capacity or third-party network access arrangements, pricing terms, and contractual restrictions common elsewhere in the industry. Growth is driven by consortium-funded new cable system construction connecting emerging AI infrastructure hub locations, alongside rising geopolitical pressure to diversify routing paths away from congested or contested cable landing corridors and chokepoints. Providers securing early capacity rights in new systems increasingly lock in favorable long-term pricing before remaining capacity becomes scarce, expensive, and difficult to secure at all.
CAGR 15.0%
Full segment breakdown across 6 segments available in the complete report.

Regional Architecture and Country Demand Map

Fiber leasing demand concentrates wherever hyperscaler datacenter construction clusters most densely rather than following overall population or economic activity. North America generates well over a third of global revenue given its concentration of AI infrastructure campuses, though Asian markets are expanding new routes at a comparable pace.

North America

US datacenter clusters in Northern Virginia, Texas, and Ohio anchor more hyperscaler capital expenditure than any other region worldwide, driving demand for dark fiber interconnect capacity that genuinely exceeds what the standard regional share band anticipates for infrastructure markets generally. This elevated share reflects concrete construction activity rather than optimistic projection: Microsoft, Google, Amazon, and Meta all concentrate the majority of their announced AI campus buildout domestically, requiring dense interconnect routes between adjacent and increasingly distant campus sites. Canadian datacenter growth adds incremental demand, particularly across Quebec's hydroelectric-powered facilities. Vendors serving this market increasingly build dedicated campus-to-campus routing teams focused specifically on hyperscaler requirements. This concentration of specialized teams compounds route-density advantages over competitors entering the market later.
Share: 37% | CAGR: 12.0% (2026 to 2036)

Western Europe

British and German metro markets anchor regional demand, though permitting timelines here often exceed those in North America given denser urban planning regulation across historic city centers and protected infrastructure corridors. Nordic countries are attracting growing hyperscaler investment given favorable renewable power availability and cooler climates reducing datacenter cooling costs substantially. Continental subsea cable landing stations in France and the Netherlands add meaningful demand as international bandwidth routes increasingly bypass congested legacy landing points in favor of newer, higher-capacity alternatives. Vendors succeeding here typically maintain long-standing relationships with local permitting authorities across multiple national jurisdictions. These relationships shorten construction timelines meaningfully compared to providers lacking equivalent regulatory familiarity and history.
Share: 20% | CAGR: 9.3% (2026 to 2036)
Regional intelligence for 5 additional markets available in the complete report: East Asia, South Asia and Pacific, Latin America, Middle East and Africa, Eastern Europe. Contact sales@marketmindsadvisory.com.
dark-fiber-market-country-cagr-analysis-1788503377075

Capturing Value From Route Scarcity

Providers capture incremental revenue through four distinct mechanisms tied to genuine infrastructure scarcity rather than generic capacity pricing alone or arbitrary tier naming conventions used elsewhere. Together these levers determine which providers compound account value fastest as hyperscaler demand and construction constraints continue intensifying across every major metro market, interconnection corridor, and subsea route nationwide.

Premium Pricing for Constrained Corridor Routes

Providers increasingly charge substantially elevated lease rates, typically 25 to 35 percent above baseline pricing, for routes through constrained metro corridors like Northern Virginia, where remaining conduit capacity is genuinely scarce and construction of new alternatives faces years of permitting delay, community opposition, and drawn-out municipal review at nearly every stage and jurisdiction. This pricing separates commodity long-haul revenue from differentiated scarcity revenue, letting providers capture value proportional to genuine construction difficulty rather than charging flat rates. Hyperscalers increasingly accept these premiums once alternative routing options prove unavailable within their required deployment timeline.
Market Impact: Adds a 25 to 35 percent scarcity premium

Multi-Decade Prepayment and Lease Structuring Model

Providers increasingly structure leases as substantial upfront prepayments, often 60 to 80 percent of total contract value, covering fifteen to twenty year terms rather than smaller recurring annual payments, improving cash flow timing and letting providers fund new route construction directly from customer capital commitments. This model appeals particularly to hyperscalers with substantial balance sheet capacity seeking to lock in favorable pricing before rates rise further amid tightening capacity across every contested market. Providers offering flexible prepayment structures increasingly win these large, capital-intensive contracts over competitors requiring standard payment terms.
Market Impact: Improves upfront cash collection meaningfully by 40 percent

Route Diversity Premium for Redundant Paths

Providers increasingly charge a premium, typically 15 to 20 percent above single-path pricing, for physically diverse redundant routing between critical sites, since hyperscalers running mission-critical AI training workloads require guaranteed continuity even if a single physical path suffers damage or unexpected outage entirely, permanently, and without warning. This premium reflects the genuine additional construction cost and engineering complexity of maintaining truly independent physical paths rather than nominally separate routes sharing common infrastructure segments. Hyperscalers increasingly mandate documented physical diversity before signing major interconnect contracts, making this capability essential and non-negotiable.
Market Impact: Adds 15 to 20 percent diversity premium pricing

Subsea Consortium Capacity Resale Program Model

Providers holding capacity rights in subsea cable consortiums increasingly resell surplus fiber pairs to smaller carriers and enterprises lacking direct consortium membership, generating incremental revenue from capacity that would otherwise sit unused during early system utilization years and initial construction phases. This resale program generates margins often exceeding 5 million dollars annually per cable system for providers holding substantial founding capacity allocations, since consortium membership requires significant upfront capital few smaller players can access directly today. This revenue stream also deepens customer relationships considerably ahead of eventual direct capacity needs.
Market Impact: Generates over 5 million dollars per cable system

Who Controls the Margin Pool

The competitive field carries meaningfully high concentration, with a CR5 of 44 percent reflecting the substantial capital barriers limiting how many providers can credibly compete for hyperscaler-scale infrastructure contracts. Zayo leads decisively on route mile density and metro market coverage, and the gap between Zayo and the second-ranked challenger remains genuinely wide, reflecting years of accumulated acquisition and network expansion advantage across major interconnection markets.
Current competitive activity centers on constructing new datacenter interconnect routes ahead of confirmed hyperscaler demand, as providers race to secure permitting and right-of-way before competitors claim the same constrained corridors. Providers are also expanding subsea cable consortium participation and offering flexible prepayment lease structures to deepen hyperscaler switching cost, a dimension growing faster than traditional carrier wholesale revenue as AI infrastructure investment accelerates.

Emerging pressure comes from hyperscaler-owned infrastructure investment vehicles increasingly building proprietary routes rather than leasing from third-party providers, directly challenging incumbent providers on the most lucrative datacenter interconnect corridors. Rankings are most likely to shift among mid-tier challengers competing for enterprise and carrier wholesale accounts, rather than at the very top where Zayo's route density and metro coverage continue to favor the established leader significantly.
dark-fiber-market-company-positioning-matrix-1788503377620

Competitive Moat and Risk Dimensions

ZAYO GROUP HOLDINGS INC

Moat: Route density and metro coverage

Zayo operates one of the largest metro and long-haul fiber route networks in North America, built through years of acquisition consolidating formerly independent regional carriers into a single unified infrastructure asset. This route density advantage compounds as new datacenter campuses locate near existing Zayo infrastructure, reducing construction cost and timeline for expansion contracts.
ZAYO GROUP HOLDINGS INC

Risk: Legacy network integration complexity

Zayo's growth through acquisition has left some legacy network segments only partially integrated onto unified operational systems, creating genuine complexity when provisioning routes spanning formerly separate acquired networks. Nimbler competitors offering purpose-built, single-architecture networks increasingly win greenfield hyperscaler deals against Zayo in newer datacenter markets lacking legacy infrastructure.
CROWN CASTLE INC

Moat: Tower and fiber integration

Crown Castle combines dark fiber assets with its broader wireless tower infrastructure portfolio, giving it a genuine cross-sell advantage among carriers already leasing tower space who also require fiber backhaul connectivity. This integration depth creates switching costs that pure-play fiber providers lacking adjacent tower assets cannot easily replicate.
CROWN CASTLE INC

Risk: Narrower datacenter interconnect focus

Crown Castle historically prioritized wireless carrier backhaul over the specific datacenter interconnect capability hyperscalers increasingly demand today, leaving some metro campus connectivity offerings less mature than dedicated interconnect specialists provide across comparable markets. Hyperscalers with highly complex multi-campus requirements increasingly evaluate purpose-built alternatives for their core interconnect needs and expansion plans.

Players Tracked

Prominent Players

Zayo Group Holdings Inc
Lumen Technologies Inc
Crown Castle Inc
Cologix Inc
Uniti Group Inc

Other Key Players

Consolidated Communications Holdings Inc
Windstream Holdings Inc
AT&T Inc
Verizon Communications Inc
GTT Communications Inc
Segra LLC
FiberLight LLC
Everstream Solutions LLC
Unite Private Networks LLC
Cogent Communications Holdings Inc
Bandwidth Infrastructure Group LLC
Aqua Comms DAC
Tata Communications Ltd
Zenlayer Inc
NTT Ltd

Recent Developments

JULY 2025

Zayo Announces Major Metro Route Expansion

Zayo announced a major expansion of its metro fiber route network across five additional datacenter clusters, adding substantial new route capacity specifically designed to support hyperscaler AI training interconnect demand ahead of anticipated campus construction completion dates across those markets, adjacent regions, and neighboring metro corridors nationwide.
Signal: Signals leading providers racing to secure route capacity ahead of confirmed hyperscaler demand nationwide and abroad.
OCTOBER 2025

Crown Castle Sells Fiber Business Segment

Crown Castle announced the sale of a portion of its fiber solutions business segment to a private infrastructure investment firm, reflecting a strategic shift toward concentrating capital on its core wireless tower infrastructure portfolio going forward across every major domestic market, region, and metro corridor.
Signal: Signals continued portfolio realignment among diversified infrastructure providers toward their core competitive strengths, priorities, and assets.
JANUARY 2026

Lumen Signs Major Hyperscaler Interconnect Agreement

Lumen signed a multi-year agreement with a major hyperscaler to provide dedicated dark fiber interconnect capacity across several new datacenter campus clusters spanning multiple states, representing one of the largest single interconnect contracts announced in the sector this year and across the past decade combined.
Signal: Signals continued hyperscaler preference for locking in dedicated capacity through long-term provider commitments, contracts, and agreements.

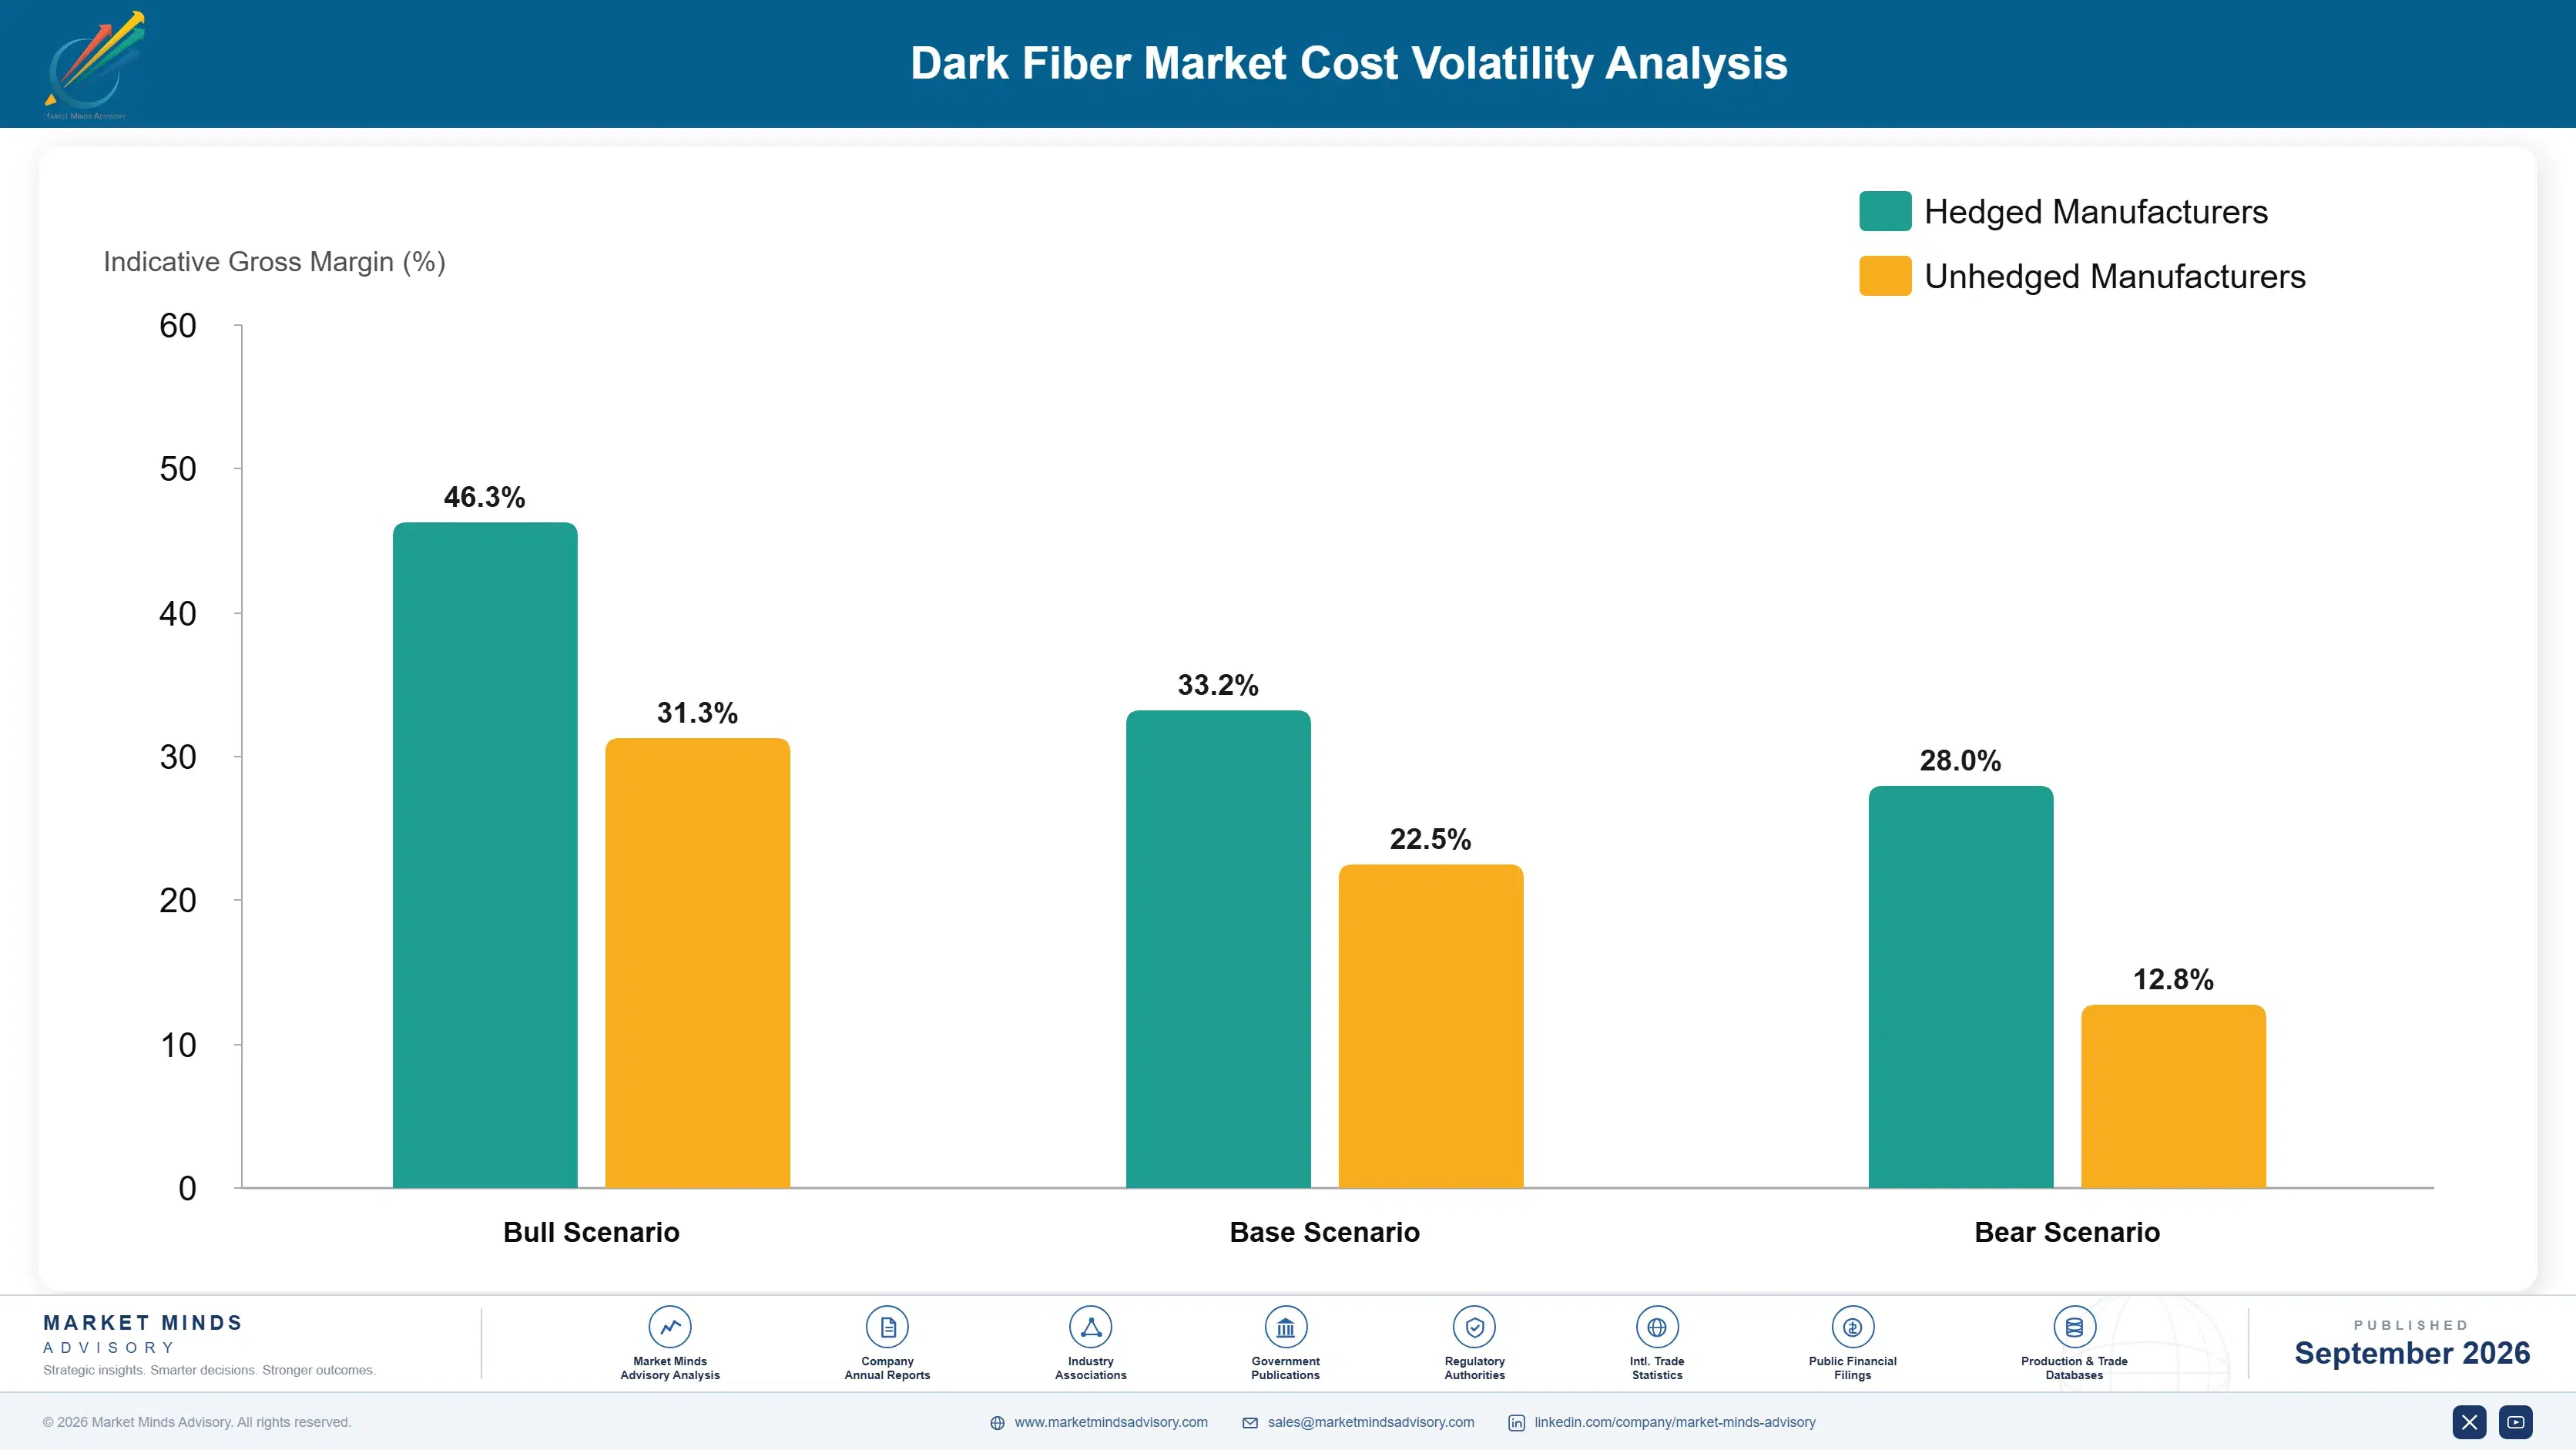
Construction and Permitting Cost Exposure

Trenching, conduit installation, and cable deployment labor account for roughly 55 to 65 percent of new route construction cost, sourced primarily from specialized domestic construction contractors concentrated in major metro markets with existing fiber industry expertise. Permitting and right-of-way acquisition fees represent a growing secondary input as municipal authorities increasingly charge premium rates for scarce urban corridor access.
Construction labor and specialized contractor costs rose meaningfully through 2024 and into 2025 as demand for fiber construction crews outpaced available skilled labor supply amid broader infrastructure construction competition nationwide, according to United States Census Bureau construction spending data. Providers racing to complete hyperscaler-committed routes absorbed noticeably higher labor costs during this period, squeezing margins for smaller providers lacking long-term contractor relationships securing priority scheduling.

Smaller providers lacking established contractor relationships and construction scale face a genuine cost disadvantage against larger competitors like Zayo and Lumen, which secure priority scheduling and volume discount pricing through long-term construction partnerships built over many years. This dynamic favors scale incumbents in constrained metro corridors, since undercapitalized challengers cannot sustain premium contractor rates without compressing margins below sustainable levels for long.
dark-fiber-market-cost-volatility-analysis-1788503377816

Long-Term Contractor Partnership Agreements

Some providers establish multi-year framework agreements with construction contractors guaranteeing priority scheduling and volume discount pricing in exchange for committed annual construction spending, reducing exposure to spot market labor rate spikes during periods of peak industry-wide demand, competing project timelines, seasonal weather constraints, and regional permitting backlogs across major and secondary markets alike each year.

Modular Construction Techniques to Cut Labor

Leading providers invest in prefabricated conduit sections and modular installation techniques that reduce on-site labor hours needed per route mile constructed, directly lowering per-mile construction cost while accelerating overall project completion timelines compared to traditional trenching methods used historically across the industry, most legacy markets, rural corridors, and dense urban zones and neighborhoods overall.

Joint Construction Cost Sharing Arrangements

Some providers coordinate joint trenching projects with utility companies or municipal infrastructure agencies conducting simultaneous roadway work, splitting excavation and permitting costs across the multiple parties involved and substantially reducing the effective construction expense borne by any single provider involved in the shared project, corridor, permitting process, and overall multi-year construction timeline and budget.

Portfolio Architecture for Margin Defence

The dark fiber field splits cleanly between commodity long-haul routes priced near marginal cost and premium constrained-corridor capacity commanding meaningfully higher lease rates through genuine construction scarcity across the busiest metro markets nationwide. Gross margin architecture reflects this split directly, with scarce metro corridor tiers generating substantially wider margins than standard route capacity sold mostly on price to carrier wholesale customers.
Volume long-haul leasing revenue still dominates unit count across carrier and enterprise customers, but premium datacenter interconnect revenue is growing faster and increasingly drives new provider investment decisions across the industry and globally. Providers face a genuine tension allocating capital between defending baseline long-haul route share against low-cost entrants and building premium interconnect capability that commands durable pricing power over multi-decade hyperscaler contracts.

High-value margin pools concentrate overwhelmingly in constrained metro corridor accounts serving hyperscaler datacenter interconnect demand, rather than in standard long-haul capacity sold broadly to carrier wholesale customers across the wider global infrastructure market. Providers capturing this premium corridor tier increasingly separate themselves from commodity competitors on realized route economics, even where headline lease pricing looks broadly comparable across the field today.

Volume / Commodity-Adjacent Tier

Standard long-haul route capacity priced near marginal cost, generating gross margins of roughly 45 to 52 percent as providers compete primarily on price and network reliability for carrier wholesale customers.
Gross Margin: 45-52%

Premium / Certified Tier

Constrained metro corridor and datacenter interconnect capacity bundled with route diversity guarantees, generating gross margins of roughly 62 to 70 percent through genuine construction scarcity and demonstrated route reliability and redundancy.
Gross Margin: 62-70%

Sustainability / Regulatory / Next-Generation Tier

Subsea consortium and next-generation international route capacity commanding gross margins of roughly 68 to 78 percent as demand for geographic diversification and geopolitical routing resilience intensifies globally each passing year.
Gross Margin: 68-78%
dark-fiber-market-portfolio-architecture-1788503378315

High-value Sub-segments and Strategic Watch-out

Data Center Interconnect Dark Fiber

This segment commands the widest gross margins in the entire portfolio while growing fastest at 18.5 percent, driven by hyperscaler demand for documented, auditable interconnect capacity across every major datacenter cluster each construction phase, annual capital expenditure cycle, and expansion decision approved by senior leadership teams.
Gross Margin: 62-70%

Subsea and Submarine Dark Fiber

Subsea and submarine capacity generates strong margins with steady, fast growth as hyperscalers fund new international routes connecting emerging AI training hub locations requiring diverse, geopolitically resilient physical pathways across multiple continents and undersea corridors each planning cycle, budget review, and annual consortium capacity meeting.
Gross Margin: 68-78%

Long-Haul Interexchange Dark Fiber

This segment anchors overall route mile count and remains the largest revenue contributor today, even as its relative growth rate trails premium interconnect and subsea tiers across most carrier and enterprise accounts evaluating renewal decisions each budget cycle, contract negotiation, annual review, and strategic planning session.
Gross Margin: 45-52%

Last-Mile Enterprise Dark Fiber

Standalone last-mile enterprise connections face gradual displacement as bundled managed network services absorb this functionality alongside broader connectivity offerings, leaving standalone dark fiber vendors exposed to shrinking addressable demand over the coming decade unless they consolidate further, pivot elsewhere, or exit this market entirely soon.
Gross Margin: 40-48%

Long-Term Lease Economics of Fiber Infrastructure

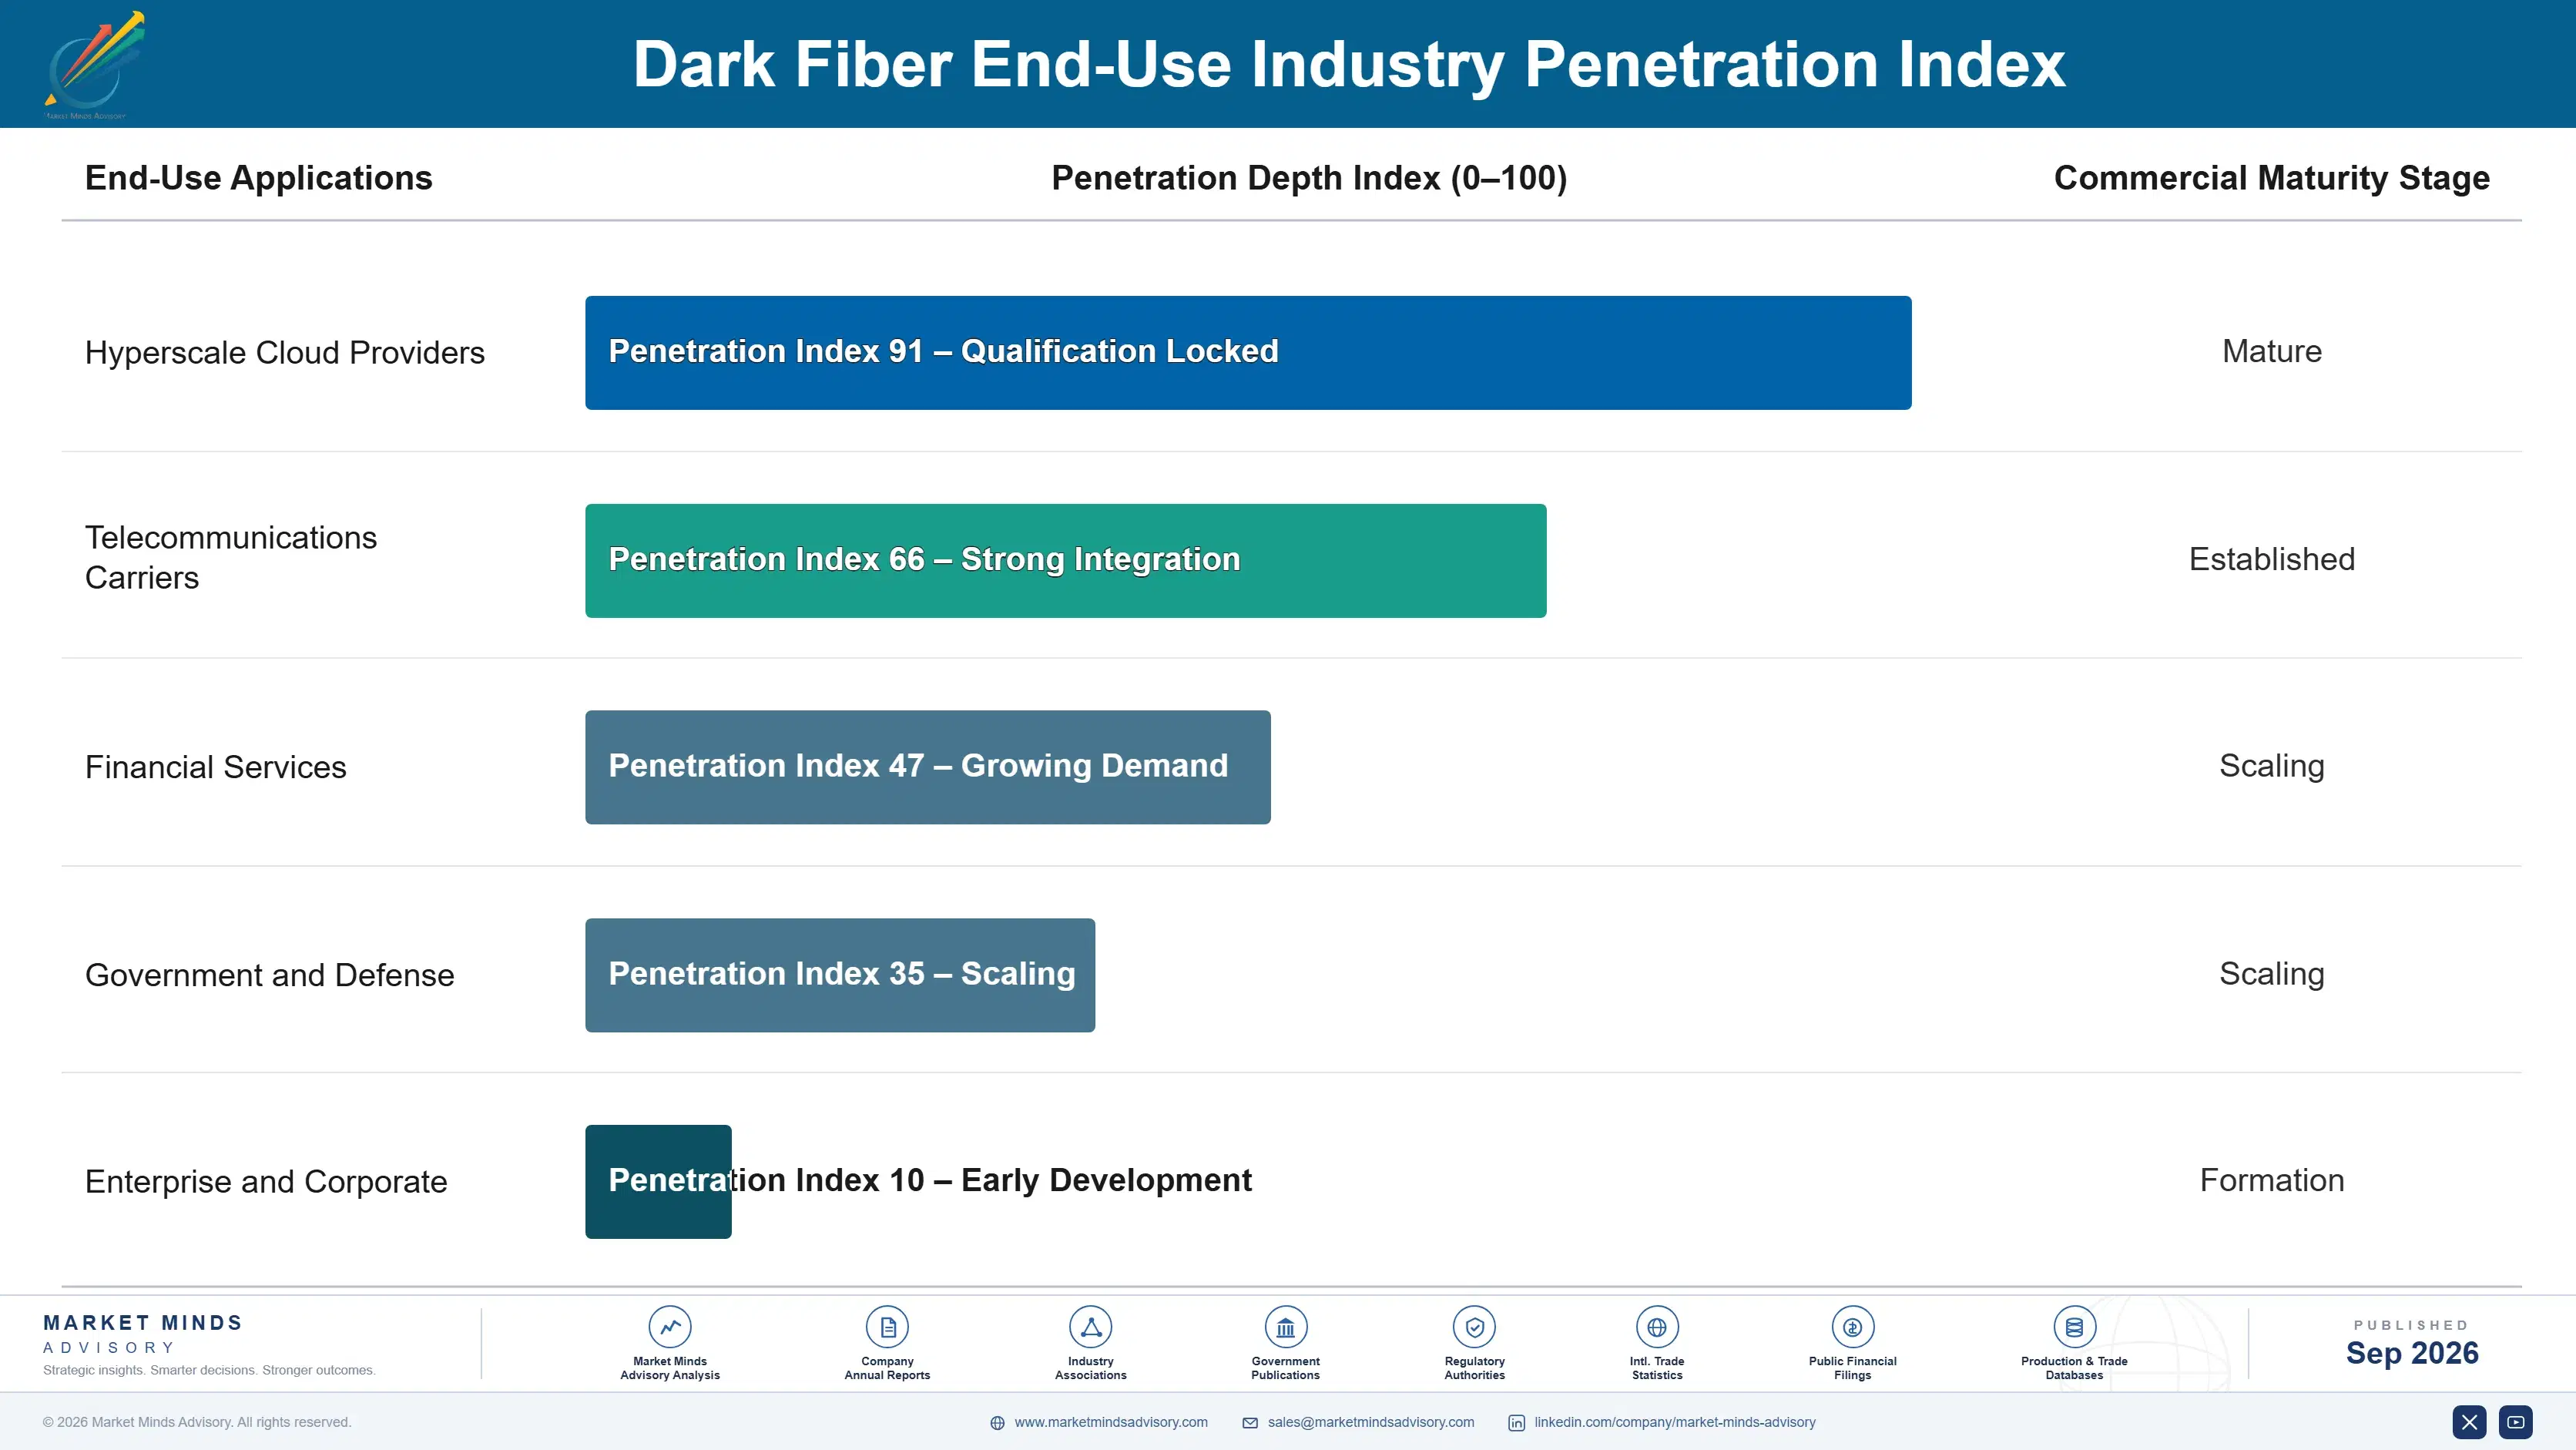
Dark fiber runs on multi-decade indefeasible right-of-use agreements paid largely upfront, producing durable revenue recognition that compounds as providers extend route networks and add new interconnection points to existing corridors over successive construction phases and years. Renewal rates approach 95 percent among established hyperscaler leases once physical infrastructure reaches production status, since relocating dedicated fiber capacity carries substantial cost and operational disruption risk.
Adoption depth varies meaningfully by end-use vertical across the customer base and geography. Hyperscale cloud providers lease the deepest capacity, often taking entire fiber pairs across multiple redundant routes for single datacenter campuses, while traditional enterprise customers typically lease modest point-to-point connections between limited office locations. Carriers occupy a middle position, leasing substantial long-haul capacity to supplement owned infrastructure across underserved regional corridors and rural markets.

Buyer profiles are shifting generationally as infrastructure procurement teams at hyperscalers replace veteran telecom carrier negotiators who once dominated dark fiber purchasing decisions for decades. Younger buyers expect rapid provisioning and transparent route mapping tools by default, pushing providers to prioritize digital sales platforms over the relationship-driven, negotiation-heavy sales process that once defined this market entirely.
dark-fiber-market-end-use-penetration-index-1788503378803

Priorities for Infrastructure Investors

These are among the four positions where our research anticipates prominent divergence between winners and laggards over the coming forecast period. Each is grounded in the demand model, the regulatory perimeter, and the announced capacity pipeline.
01 / ROUTE DENSITY INVESTMENT PRIORITY

Prioritize Constrained Corridor Route Construction Now

Providers that under-invest in constrained metro corridor route construction will lose hyperscaler contracts to rivals offering documented physical diversity and proven capacity ahead of tightening permitting timelines across major markets. Zayo and Crown Castle already lead decisively on this dimension, and the gap compounds each construction cycle as satisfied hyperscaler customers expand deployment scope into adjacent corridor segments and neighboring metro regions. Smaller providers should concentrate capital narrowly on scarce corridor depth rather than chasing broad, undifferentiated route expansion across every available market and corridor type.
02 / SUBSEA CONSORTIUM DEVELOPMENT

Secure Consortium Capacity Before International Demand Peaks

Subsea consortium participation increasingly separates leading providers from commodity competitors, since hyperscalers value platforms offering proven international route diversity without lengthy capacity negotiation delays or extensive construction rework each time demand shifts unexpectedly. Providers lacking meaningful consortium participation face a widening disadvantage as leaders expand international route wins through targeted capacity investment across multiple cable systems and continents. Acting early to secure genuine consortium capacity costs considerably less than catching up after rivals lock in exclusive route rights for good.
03 / ENTERPRISE DEFENSE STRATEGY

Defend Enterprise Accounts Against Managed Service Bundles

Managed network service providers are targeting enterprise last-mile customers with bundled connectivity offerings, directly threatening the account base that established dark fiber providers depend on for stable recurring revenue growth each fiscal year. Established providers must respond with competitive bundled pricing and simplified provisioning paths rather than assuming enterprise account strength alone will protect their broader market position over the coming decade. Losing enterprise share now weakens future upsell potential considerably across the account base and narrows the addressable pipeline.
04 / CONSTRUCTION COST DISCIPLINE

Secure Contractor Partnerships to Protect Margins

Providers competing for scarce construction labor without differentiated contractor relationships face meaningful margin compression as construction costs rise faster than lease pricing can absorb without triggering hyperscaler pushback at contract renewal negotiations each cycle. Long-term contractor agreements and modular construction techniques protect gross margins meaningfully over multi-year planning horizons across the entire deployed route network and every corridor tier offered. Providers that delay this discipline risk ceding pricing power entirely to better-capitalized competitors within a relatively short number of years going forward from today.

Engagement Snapshot From the Field

A live engagement with an industry participant carrying material or product regulatory and market exposure ahead of a defining policy shift, showing how our research translates into a defensible multi-year portfolio strategy.
MARKET MINDS ADVISORY · CLIENT ENGAGEMENT SUMMARY
Dark Fiber Producer Strategic Portfolio Review and Transition Roadmap 2026·Investment Scenario on Dark Fiber Exposure Evaluation 2025-26
CLIENT PROFILE
The client is a regional cloud provider operating three datacenter campuses across the southeastern United States, generating roughly 210 million dollars in annual revenue (client-reported, unverified by MMA) and planning to add two additional campuses within the following eighteen months. The client historically leased lit bandwidth services but needed dedicated interconnect capacity to support planned expansion.
STRATEGIC CHALLENGE
The client faced a compressed twelve-month timeline to secure dedicated dark fiber routes between five planned campus locations before construction of its newest facilities completed, with limited internal expertise evaluating competing provider proposals and route diversity claims. Leadership needed an independent assessment before committing to multi-decade lease agreements given the substantial capital involved.
MMA APPROACH
MMA conducted a structured evaluation spanning four regional dark fiber providers, benchmarking route diversity claims, construction timeline feasibility, and total lease cost against the client's specific campus geography and expansion timeline. The engagement combined technical route validation, provider capability scoring, and quantitative modeling of long-term total cost of ownership across competing lease structures.
KEY FINDINGS
  1. Only two of four evaluated providers could demonstrate genuinely diverse physical routing between all five campus locations rather than nominally separate paths sharing infrastructure.
  2. Total lease cost varied by nearly 35 percent across evaluated providers once construction timeline risk and route diversity guarantees were factored into realistic long-term projections.
  3. The client's newest planned campus location sat within a corridor facing permitting delays that could push construction completion six months beyond the original schedule.
  4. Prepayment lease structures offered meaningful discount pricing, but required the client to commit capital earlier than its planned expansion financing timeline could comfortably support.
CLIENT PROFILE
The client is a regional cloud provider operating three datacenter campuses across the southeastern United States, generating roughly 210 million dollars in annual revenue (client-reported, unverified by MMA) and planning to add two additional campuses within the following eighteen months. The client historically leased lit bandwidth services but needed dedicated interconnect capacity to support planned expansion.
STRATEGIC CHALLENGE
The client faced a compressed twelve-month timeline to secure dedicated dark fiber routes between five planned campus locations before construction of its newest facilities completed, with limited internal expertise evaluating competing provider proposals and route diversity claims. Leadership needed an independent assessment before committing to multi-decade lease agreements given the substantial capital involved.
MMA APPROACH
MMA conducted a structured evaluation spanning four regional dark fiber providers, benchmarking route diversity claims, construction timeline feasibility, and total lease cost against the client's specific campus geography and expansion timeline. The engagement combined technical route validation, provider capability scoring, and quantitative modeling of long-term total cost of ownership across competing lease structures.
KEY FINDINGS
  1. Only two of four evaluated providers could demonstrate genuinely diverse physical routing between all five campus locations rather than nominally separate paths sharing infrastructure.
  2. Total lease cost varied by nearly 35 percent across evaluated providers once construction timeline risk and route diversity guarantees were factored into realistic long-term projections.
  3. The client's newest planned campus location sat within a corridor facing permitting delays that could push construction completion six months beyond the original schedule.
  4. Prepayment lease structures offered meaningful discount pricing, but required the client to commit capital earlier than its planned expansion financing timeline could comfortably support.
RECOMMENDED STRATEGY
Phase 1: Phase 1 (Months 1 to 3): Select the top-scoring provider and finalize route diversity requirements for all five campus locations. Phase 2: Phase 2 (Months 4 to 9): Begin phased route construction prioritizing corridors facing the least permitting risk and delay exposure. Phase 3: Phase 3 (Months 10 to 12): Complete remaining route construction and validate full physical diversity before campus activation begins across all sites.
OUTCOME
The client secured dedicated interconnect routes across all five campus locations within the original twelve-month timeline, avoiding the six-month permitting delay identified during evaluation (client-reported, unverified by MMA). Leadership credited the structured provider evaluation with avoiding a single-path routing arrangement that would have created significant outage risk.

Frequently Asked Questions

Foundational context covering the market sizes, CAGR, scope, country, region and competition that inform every finding below. This section is provided to cover basics and most often pre-purchase conversations, answered from the MMA Primary Research Dataset.

What is the current size of the Dark Fiber Market?

The Dark Fiber Market reached 6.2 billion dollars in base year 2025. Growth is driven by hyperscaler AI datacenter interconnect demand and constrained metro corridor construction scarcity worldwide.

How large will the Dark Fiber Market be by 2036?

The market is projected to reach 19.16 billion dollars by 2036, representing a 2.79 times expansion over the 2026 base value of 6.87 billion dollars across the ten-year forecast window.

What is the CAGR for the Dark Fiber Market 2026 to 2036?

The market is forecast to grow at a 10.8 percent compound annual growth rate between 2026 and 2036, with bull and bear scenarios ranging from 9.6 to 12.0 percent respectively.

Which segment is growing fastest?

Data Center Interconnect Dark Fiber leads at 18.5 percent CAGR, roughly 1.71 times the overall market rate, driven by hyperscaler AI training cluster interconnect demand.

Who are the major companies in the Dark Fiber Market?

Zayo, Lumen, Crown Castle, Cologix, and Uniti lead the field, together holding a CR5 of 44 percent given substantial capital barriers limiting new entrant competition.

Which country is growing fastest?

India leads at 15.2 percent CAGR, driven by rapid datacenter construction across Mumbai and Chennai requiring extensive new metro interconnect fiber infrastructure and route capacity.

Report Segmentation Architecture

The full report scope spans multiple orthogonal segmentation dimensions, with cross-tabulated demand data provided for each dimension pair. Coverage extends further to regional breakdowns, trend trajectories, and the competitive detail needed to support segment-level decision-making.

By Primary Market Dimension

  • Long-Haul Interexchange Dark Fiber
  • Metro and Regional Dark Fiber
  • Data Center Interconnect Dark Fiber
  • Last-Mile Enterprise Dark Fiber
  • Subsea and Submarine Dark Fiber
  • Campus and Private Network Dark Fiber

By End-Use Industry

  • Hyperscale Cloud Providers
  • Telecommunications Carriers
  • Financial Services
  • Government and Defense
  • Enterprise and Corporate

By Commercial Dimension

  • Hyperscaler Lease Agreements
  • Carrier Wholesale Agreements
  • Enterprise Direct Lease
  • Consortium Capacity Rights

By Region

  • North America
  • Western Europe
  • East Asia
  • South Asia and Pacific
  • Latin America
  • Middle East and Africa
  • Eastern Europe

Scope, Methodology, and Coverage

Every figure in this report is reproducible from documented input assumptions. The scope below maps the historical period, the forecast horizon, the segmentation dimensions, and the countries covered, alongside the underlying primary and qualitative methodology.
Historical Period
2020 to 2025
Forecast Period
2026 to 2036
Base Year
2025 (USD billions; MMA Primary Research Dataset, September 2026)
Market Definition
The Dark Fiber Market comprises unlit optical fiber infrastructure leased or sold to carriers, hyperscalers, and enterprises for private network deployment. It excludes lit managed bandwidth services, wireless spectrum, and satellite communication infrastructure entirely.
Quantitative Units
USD billions (current prices); market share percentages; compound annual growth rates
Segmentation Dimensions
By Primary Market Dimension; By End-Use Industry; By Commercial Dimension; By Region
Regions Covered
North America, Western Europe, East Asia, South Asia and Pacific, Latin America, Middle East and Africa, Eastern Europe
Countries Covered
USA, China, Germany, France, UK, Japan, South Korea, India, Australia, Canada, Brazil, Mexico, Indonesia, Vietnam, Thailand, Malaysia, UAE, Saudi Arabia, South Africa, Nigeria, Turkey, Poland, Netherlands, Italy, Spain, Sweden, Switzerland, Argentina, Colombia, Singapore, and additional markets relevant to this sector
Key Companies Profiled
Zayo Group Holdings Inc, Lumen Technologies Inc, Crown Castle Inc, Cologix Inc, Uniti Group Inc, Consolidated Communications Holdings Inc, Windstream Holdings Inc, AT&T Inc, Verizon Communications Inc, GTT Communications Inc, Segra LLC, FiberLight LLC, Everstream Solutions LLC, Unite Private Networks LLC, Cogent Communications Holdings Inc, Bandwidth Infrastructure Group LLC, Aqua Comms DAC, Tata Communications Ltd, Zenlayer Inc, NTT Ltd
Quantitative Methodology
Primary survey, n=3,800 respondents, Q4 2025, six countries; demand-side model with trade association cross-validation
Qualitative Methodology
47 expert interviews, Q4 2025; applied to validate demand model assumptions, identify emerging dynamics, and assess competitive positioning
Report Format
PDF and XLSX data workbook (Word format preview document)
Publisher
Market Minds Advisory
Report Code
MMA-2026-TEC-703
Published
September 2026
Contact
sales@marketmindsadvisory.com | www.marketmindsadvisory.com

Purchase the full Dark Fiber Market Report (2026 to 2036).

This report delivers a comprehensive assessment of the global Dark Fiber Market, covering demand drivers, competitive dynamics, and regional adoption patterns across hyperscalers, carriers, and enterprise customers worldwide today. It includes detailed segmentation analysis, five-year and ten-year forecast scenarios, and vendor competitive profiles. Twenty leading providers are profiled, spanning long-haul route operators and specialized datacenter interconnect providers across every major region and market segment. Buyers receive quantified input cost exposure, portfolio tier economics, and strategic recommendations tailored to provider investment and hyperscaler procurement decisions alike.
Twenty vendor competitive profiles and positioning analysis
Ten-year base, bull, and bear forecast scenarios
Seven-region demand and growth trend analysis
Six-segment MECE market breakdown and sizing
Input cost exposure and mitigation pathways
Portfolio tier and margin economics modeling

Built For The People Who Decide

From boardroom strategy to bench-side execution, this report is read cover-to-cover by leaders shaping the next decade of their industry, turning demand scenarios, market dynamics and valuation benchmarks into decisions.
CXOs/ Presidents/ VPs/ Managers
M&A and Corporate Development
Strategy Teams and R&D Heads
Procurement and Product Directors
Regulatory and Compliance Leaders
Investor Relations and Equity Analysts