Market Minds Advisory
Damaged Starch Analyzer Market

Damaged Starch Analyzer Market: Damaged Starch Analyzer Market. Benchtop, Inline and Enzymatic Systems for Flour Quality Control

Damaged starch analyzers are moving from lab benches into mill process lines as flour buyers demand tighter water absorption control, yet long instrument lives, low unit volumes and electronic component costs limit who earns margins.

Lead Analyst

Published

September 2026

Make Smarter Decisions with Customized Research Insights

Request a free sample report and evaluate market opportunities, growth trends, and competitive dynamics relevant to your business needs.

2025 MARKET VALUE$0.3BMarket Size 2025
2036 FORECAST VALUE$0.5BBase Case , 2026 to 2036
CAGR 2026 TO 20365.5 %Bull 6.8% / Bear 4.2%
INCREMENTAL OPPORTUNITY$0.2BNet 10- year value creation
EXPANSION MULTIPLE1.71x2036 value over 2026 base
Strategic Levers
M&A Pipeline
Regional Outlook
Country Rankings
Competitive Intelligence
Segmental Deep-dive
Call-Us : 91 93563 13602

Executive Snapshot and Market Trajectory.

Damaged starch analyzers measure the share of starch granules cracked during roller milling, which sets how much water flour absorbs and how dough behaves. Mills and bakeries use them to hold flour specifications. One reading can decide whether a truckload of flour is accepted or rejected.
Inline and Near-Infrared Analyzers grow fastest as large mills move quality checks from the lab to the process line, while benchtop amperometric analyzers carry the largest installed base. East Asia leads because China's vast flour milling capacity concentrates instrument buying, with Western Europe close behind. Gross margins run 30% to 62%, and electronics, optics and enzymes shape profit. Margins stay firm. Buyers reward reliable results. Component costs stay high. Calibration records shape every contract.
Five groups hold about 46% of value, led by FOSS, KPM Analytics and Brabender, so specialist cereal instrument makers compete with broader analytical groups and enzyme kit suppliers. Milling standards, flour specifications and customer audits govern positioning, and buyers check accuracy, repeatability and service response before approving suppliers, renewing service contracts or adding units across additional mill sites. Buyers compare cost per test. Audits decide new contracts. Margins stay firm.
Market Definition
The market covers global supplier revenue from damaged starch analyzers, defined as instruments and consumables that measure mechanically damaged starch in flour and milled cereal products, in benchtop amperometric analyzers, inline and near-infrared analyzers, enzymatic assay kits and reagents, colorimetric and rapid test systems, and calibration, service and software, sold to flour mills, bakeries, food manufacturers and laboratories. It excludes general grain analyzers, rheology instruments, baking equipment and contract laboratory testing services.
Base Year Value
$0.3B in 2025 (MMA Primary Research Dataset, September 2026)
Forecast Period
2026 to 2036, eleven discrete annual values
CAGR
5.5% base case. Bull 6.8%. Bear 4.2%.
Fastest Growth Segment
Inline and Near-Infrared Analyzers: 7.7% CAGR
Fastest Growth Country
India: 8.2% CAGR
Fastest Growth Region
South Asia and Pacific: 7.6% CAGR
Largest Region
East Asia: 27% of 2025 global value
Market Leaders
FOSS, KPM Analytics, Brabender, Bruker, Buhler. Source: MMA Analysis, company annual reports.
Primary Survey
n=3,800 procurement and R&D decision-makers, Q4 2025, six countries
Methodology
Demand-side build-up, cross-validated against public data, 47 expert interviews

Damaged Starch Analyzer Market Forecast Scenarios

damaged-starch-analyzer-market-size-forecast-scenario-1790038084667
From 2020 to 2025 damaged starch analyzer revenue grew at about 4.8% a year. Pandemic disruption delayed 2020 installations, mill investment recovered in 2021 and 2022, electronic component shortages slowed deliveries and lifted prices, and supply normalised in 2024. Benchtop units dominated revenue, while inline systems and service contracts gained share. Inline systems were smaller but grew faster.
The base case of 5.5% rests on three named mechanisms. Mill capacity growth in India, China and Africa adds new laboratory and process analyzers. Flour buyers and bakeries tighten specifications, which pushes checks from occasional sampling to routine control. Digital connectivity and inline sensing lift replacement and upgrade cycles. Each mechanism is visible in mill investment, instrument launches and service contracts over the last three years. Together they support steady adoption across major markets.
The bull case reaches 6.8% if inline adoption accelerates and Asian mill investment surges. The bear case falls to 4.2% if wheat prices fall, mills delay capital spending and component shortages return. Both cases assume stable milling standards and no major trade disruption. Neither case assumes a change in mill group concentration. Both assume steady flour specifications.

Flour Specifications, Inline Sensing and Component Costs Set Analyzer Returns

Benchtop analyzers measure iodine absorption by damaged starch using amperometric detection, while enzymatic kits digest damaged granules with alpha-amylase and measure released sugars, and near-infrared systems predict damage from spectra calibrated against reference methods. Accuracy and repeatability decide acceptance, and each method must match the reference used by the customer, since a small bias changes flour approval. Mills audit suppliers and calibration records every year before renewing contracts.
MARKET CONCENTRATION46% CR5Top five participants hold nearly half of category revenue
BENCHTOP SHARE41%Portion of revenue from benchtop amperometric analyzers and systems
MILL CLIENT SHARE64%Portion of revenue sold to flour mills rather than bakeries
ELECTRONICS COST SHARE32% of COGSSensors, boards and optics within total manufacturing cost
TYPICAL INSTRUMENT LIFE12 yearsTypical working life of a benchtop analyzer before replacement
SERVICE REVENUE SHARE22%Portion of revenue from calibration, service and software contracts
Value concentrates in five places. Inline and near-infrared analyzers grow fastest. Benchtop amperometric analyzers carry the largest installed base, enzymatic kits and reagents serve laboratories and research, colorimetric and rapid test systems serve smaller mills and bakeries, and calibration, service and software serve installed fleets that need drift control and audit records. Method and calibration details stay closely guarded within each supplier.
Supply combines global analytical groups, specialist cereal instrument makers and enzyme kit suppliers. FOSS, Bruker and Buhler serve large mills through direct sales, KPM Analytics and Brabender serve laboratories and bakeries, and Megazyme supplies assay kits to research. Buyers qualify instruments over months, compare results against reference methods and review service contracts every year. Buyers compare cost per test before awarding contracts.
"A damaged starch reading is a small number that moves a very large truckload of flour. The suppliers that will grow are the ones whose instrument agrees with the customer's reference method every day, because a miller forgives price sooner than a rejected shipment."
Senior Analyst, Food Processing Instrumentation Practice · MMA Damaged Starch Analyzer Practice · September 2026

Market Trends

Inline Near-Infrared Sensing Moves Damaged Starch Checks Onto Process Lines

Large mills are installing near-infrared sensors on roller lines and flour streams, and suppliers such as FOSS and Bruker sell calibrated systems that predict starch damage and moisture within seconds, so operators adjust roll gaps without waiting for laboratory results. Inline and Near-Infrared Analyzers grow about 7.7% a year, and gross margins run 45% to 62%. The trend needs calibration models, sensor durability and reference data, and it rewards suppliers with credibility. Buyers judge suppliers on accuracy, repeatability and service response times. Suppliers with scale and clear plans hold the strongest positions.
Market Impact: 800 million tonnes global wheat output
Connected Laboratory Software Turns Analyzer Readings Into Audit Records

Mills and bakeries want readings stored, trended and shared with customers, and suppliers now bundle cloud dashboards, calibration tracking and certificate export with instruments, so quality managers prove compliance to retailers. Calibration, Service and Software grows about 6.2% a year, and gross margins run 55% to 68%. The trend needs secure data handling and integration with mill systems, and it rewards suppliers with speed, while data ownership disputes can slow adoption. Suppliers with scale and clear plans hold the strongest positions. Early movers set the standard that later entrants must match.
Market Impact: limits of 6-9% damaged starch

Market Opportunities and Growth Drivers

Flour Mill Capacity Growth in Asia and Africa Lifts Demand

Flour milling capacity is expanding in India, China, Egypt and Nigeria, and the Food and Agriculture Organization reports global wheat output near 800 million tonnes in 2024. Each new roller mill needs laboratory analyzers and increasingly process sensors. The driver rewards suppliers with regional service teams and financing, and it supports steady unit sales, while price sensitivity and local competitors can limit margins in fast growing markets. Early movers set the standard that later entrants must match. Millers reward suppliers that respond quickly to calibration and audit needs. Progress should be reviewed every quarter against the agreed targets.
Market Impact: electronics reach 32% of cost

Tighter Flour Specifications From Bakeries Raise Routine Testing Frequency

Industrial bakeries and noodle makers run automated lines that tolerate little variation in flour water absorption, and retailers audit suppliers, so specifications now name damaged starch limits, typically 6% to 9% for bread flour. The driver rewards suppliers with fast, repeatable methods, and it supports consumable and service revenue as checks rise from daily to hourly. Buyers only pay where measured results avoid rejected batches, though method disputes slow orders. Millers reward suppliers that respond quickly to calibration and audit needs. Progress should be reviewed every quarter against the agreed targets.
Market Impact: benchtop life reaches 12 years

Market Restraints and Challenges

Electronic Component Costs and Shortages Squeeze Instrument Maker Margins

Sensors, boards and optics make up about 32% of manufacturing cost, and shortages in 2021 and 2022 stretched lead times to 40 weeks, according to SEMI and company filings, while prices rose. The root cause is concentrated semiconductor supply and thin buffers. Makers can pass through only part of the increase, so margins fall two to four points. Makers respond with dual sourcing, redesigns and longer forward orders. Progress should be reviewed every quarter against the agreed targets. Smaller suppliers carry the heaviest exposure and have the least room to adjust.
Market Impact: inline systems grow 7.7% yearly

Long Instrument Lives and Small Unit Volumes Limit Replacement Demand

A benchtop analyzer works for 12 years or more, and many mills service old units rather than replace them, so new unit sales depend on mill openings and upgrades. The root cause is simple, durable hardware and a small buyer base of roughly 30,000 mills worldwide. Replacement cycles stretch, and unit volumes stay low. Makers respond with service contracts, software upgrades and inline products. Smaller suppliers carry the heaviest exposure and have the least room to adjust. Buyers judge suppliers on accuracy, repeatability and service response times. Suppliers with scale and clear plans hold the strongest positions.
Market Impact: software grows 6.2% yearly
3 additional market trends, 2 additional growth drivers, and 4 additional restraints and challenges are covered in the full report. Contact sales@marketmindsadvisory.com to access the complete intelligence.

Segment CAGR and Growth Architecture

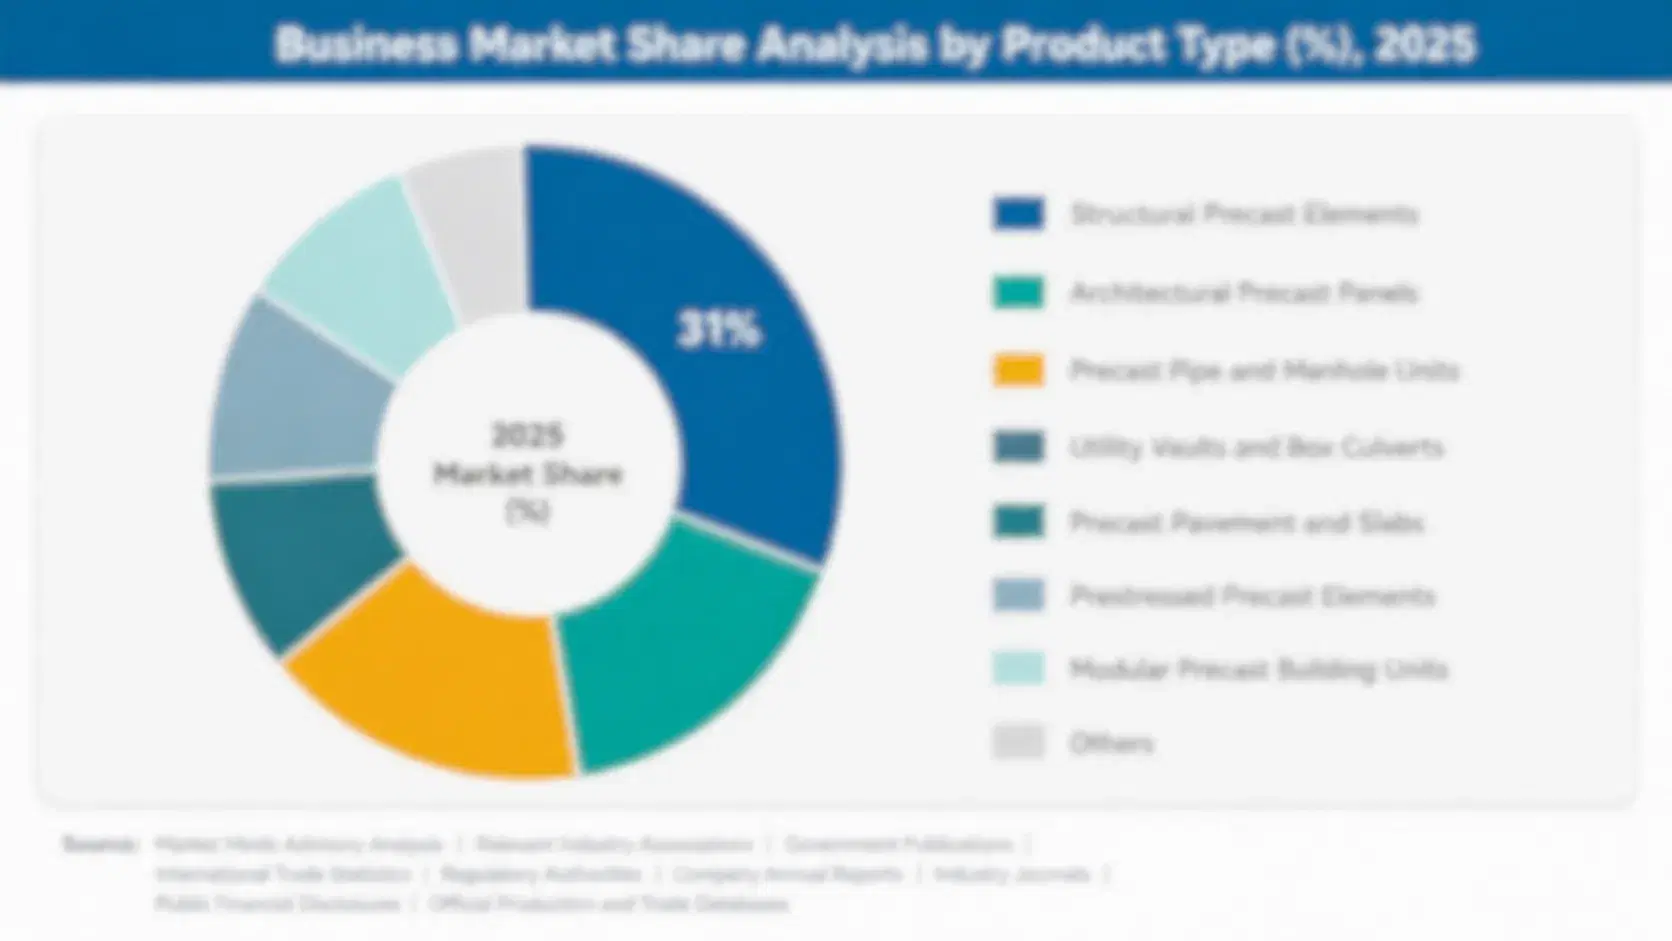
The damaged starch analyzer market is segmented by offering type, which shows where hardware, consumables and services differ in margins and buying cycles. Five segments cover benchtop amperometric analyzers, inline and near-infrared analyzers, enzymatic assay kits and reagents, colorimetric and rapid test systems and calibration, service and software. Inline analyzers grow fastest, while benchtop units carry the largest installed base.
damaged-starch-analyzer-market-market-share-analysis-1790038084936

Inline and Near-Infrared Analyzers

Inline and Near-Infrared Analyzers is the fastest-growing segment at 7.7% a year, about 1.40 times the overall market rate. Large mills fit sensors to roller lines and flour streams so operators tune rolls in seconds, and unit prices run three to five times those of benchtop analyzers. Gross margins of 45% to 62% reward suppliers with calibration models, sensor durability and service. Growth depends on mill investment, reference data and integration, while long approval cycles limit speed. Early movers set the standard that later entrants must match. Millers reward suppliers that respond quickly to calibration and audit needs. Progress should be reviewed every quarter against the agreed targets. Buyers judge suppliers on accuracy, repeatability and service response times.
CAGR 7.7%

Enzymatic Assay Kits and Reagents

Enzymatic Assay Kits and Reagents grows at 6.6% a year, about 1.20 times the overall market rate, because reference laboratories, wheat breeders and mill quality teams use enzyme digestion methods as the benchmark against which other analyzers are calibrated. Suppliers use enzyme purity and method validation to differentiate. Gross margins of 50% to 65% support suppliers with reliable batches. Growth depends on research funding, standards and price, and suppliers with dependable quality and supply hold the strongest positions. Millers reward suppliers that respond quickly to calibration and audit needs. Progress should be reviewed every quarter against the agreed targets. Smaller suppliers carry the heaviest exposure and have the least room to adjust.
CAGR 6.6%
Full segment breakdown across 5 segments available in the complete report.

Regional Architecture and Country Demand Map

East Asia leads at 27% because China's vast flour milling capacity concentrates instrument buying, while Western Europe holds 24%. North America holds 22%. South Asia and Pacific holds 11% and grows fastest. Latin America holds 7%. Middle East and Africa holds 5%. Eastern Europe holds 4%.

North America

North America holds 22% share, at the floor of its band, and growth of 5.3%, close to the global rate. United States and Canadian mills, bakeries and wheat research centres buy benchtop and inline analyzers to meet flour specifications set by industrial bakers, and FOSS, Bruker, Brabender and KPM Analytics supply. Consolidated milling groups buy in fleets, and buyers demand accuracy, service response and audit records. Buyers also review calibration records and audit results before every annual service renewal. Volumes stay steady, and suppliers compete mainly on accuracy proof, documentation and service reliability. Distributors handle most shipments and set order sizes. Currency moves and freight rates change landed cost each quarter.
Share: 22% | CAGR: 5.3% (2026 to 2036)

Western Europe

Western Europe holds 24% share, inside its band, and growth of 4.2%, below the global rate. France, Germany, Italy and the United Kingdom run dense milling and baking sectors and host the leading instrument makers, including KPM Analytics in France and Brabender in Germany. Mature installed bases temper new unit growth, and buyers demand method equivalence, service networks and connected records. Buyers also review calibration records and audit results before every annual service renewal. Volumes stay steady, and suppliers compete mainly on accuracy proof, documentation and service reliability. Distributors handle most shipments and set order sizes. Currency moves and freight rates change landed cost each quarter. Suppliers offering multi-year terms win repeat volume.
Share: 24% | CAGR: 4.2% (2026 to 2036)
Regional intelligence for 5 additional markets available in the complete report: East Asia, South Asia and Pacific, Latin America, Middle East and Africa, Eastern Europe. Contact sales@marketmindsadvisory.com.
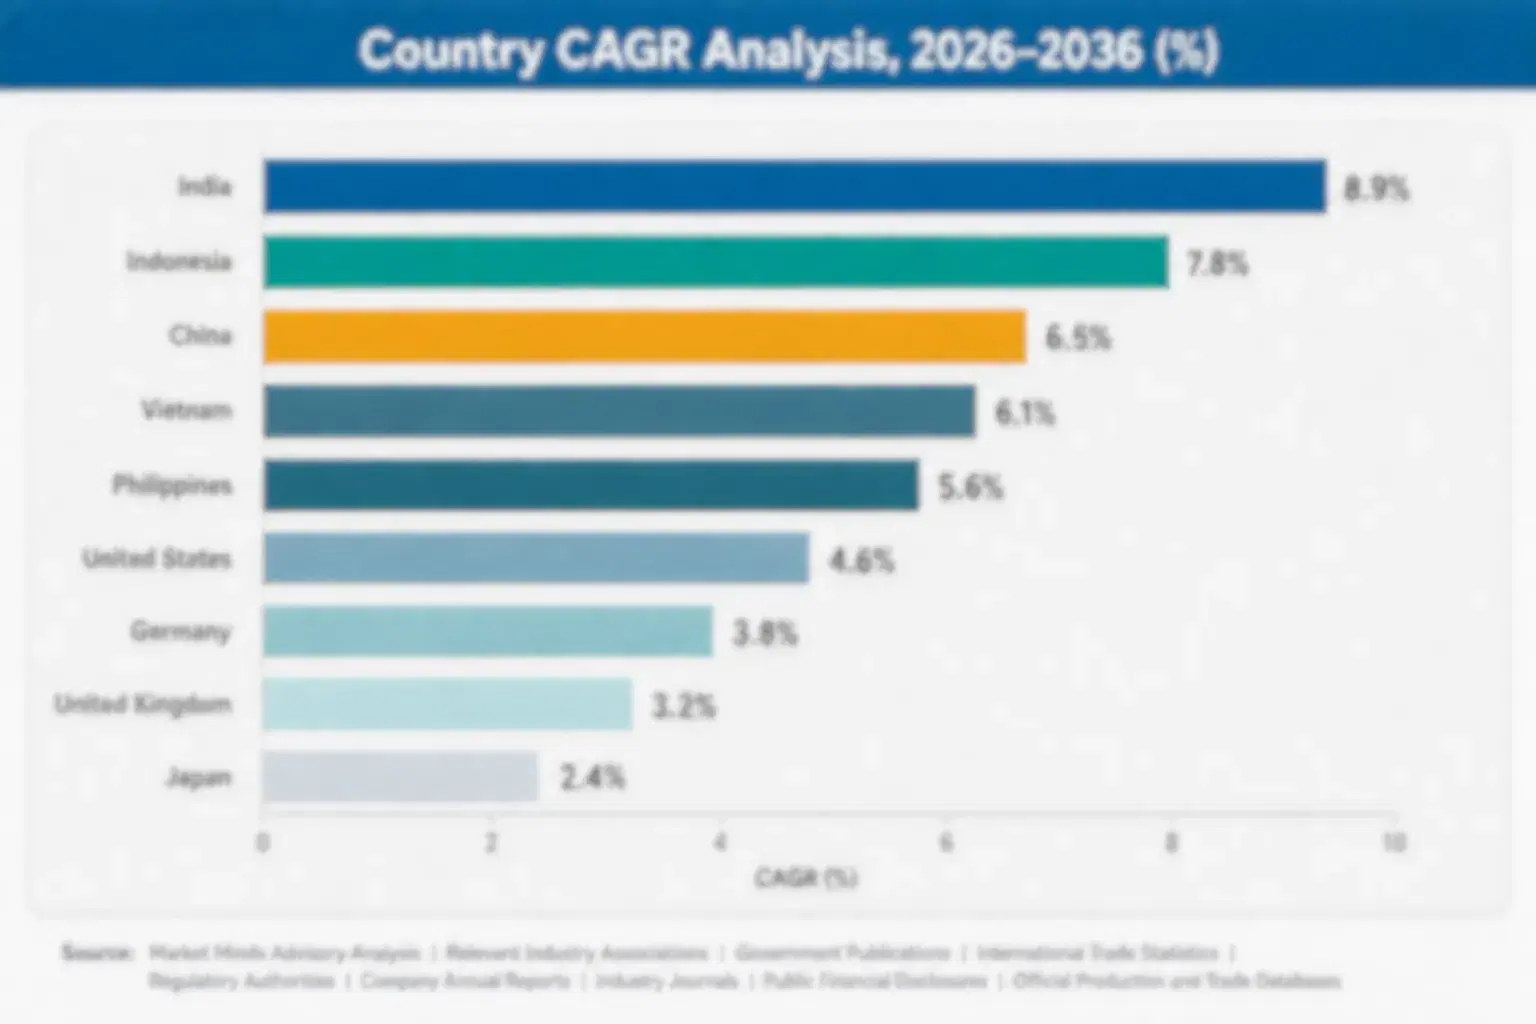
damaged-starch-analyzer-market-country-cagr-analysis-1790038085218

Four Margin Routes for Damaged Starch Analyzer Suppliers

Margin in damaged starch analysis comes from inline systems, calibration and software contracts, consumable pull-through and cost control on electronics rather than benchtop unit sales alone. The routes below apply to specialist instrument makers and analytical groups, and each can start inside one planning cycle, with measures in gross margin points and cost per unit.

Scaling Inline Near-Infrared Systems With Validated Calibration Models

Large mills want results in seconds, so suppliers that scale inline near-infrared systems with calibration models validated against amperometric and enzymatic reference methods win sales worth 10% to 18% of revenue at gross margins of 45% to 62%. Development costs $2 million to $10 million. Suppliers should share validation data, offer pilot installations and train mill staff, since unproven models lose accounts. Management should assign one owner to each programme from the start. Early results also help persuade sceptical buyers. Costs are recovered faster in larger groups. Payback runs about three years.
Market Impact: inline systems add sales worth 10-18% of revenue

Bundling Cloud Software and Calibration Contracts With Every Installed Analyzer

Installed analyzers drift, and mills must prove control, so suppliers that bundle software, calibration and certificate export with annual contracts lift service revenue by 20% to 35% and protect margins worth 6% to 10% of profit. Programmes cost $1 million to $5 million. Suppliers should price contracts by fleet, secure data privacy and integrate with mill systems, since poor integration causes cancellations. Early results also help persuade sceptical buyers. Costs are recovered faster in larger groups. Payback runs about three years. Management should assign one owner to each programme from the start.
Market Impact: service bundles lift recurring revenue by 20-35% yearly

Growing Enzymatic Kit Pull-Through in Research and Reference Laboratories

Reference laboratories calibrate other instruments against enzymatic methods, so suppliers that secure standard status and grow kit pull-through in breeding and mill laboratories lift consumable volume by 10% to 20% at gross margins of 50% to 65%. Programmes cost $0.5 million to $3 million. Suppliers should support ring trials, hold batch consistency and publish method notes, since one poor batch damages credibility. Costs are recovered faster in larger groups. Payback runs about three years. Management should assign one owner to each programme from the start. Early results also help persuade sceptical buyers.
Market Impact: kit pull-through lifts consumable volume by 10-20% yearly

Redesigning Instrument Electronics and Dual Sourcing Critical Sensor Components

Electronics make up about 32% of cost, so suppliers that redesign boards around common parts and dual source sensors and optics cut component cost swings by 20% to 35% and protect margins worth 5% to 8% of profit. Programmes cost $1 million to $6 million. Suppliers should keep spare stock, qualify second sources early and document changes for customers, since silent changes disturb calibration. Payback runs about three years. Management should assign one owner to each programme from the start. Early results also help persuade sceptical buyers. Costs are recovered faster in larger groups.
Market Impact: redesign cuts component cost swings by 20-35% yearly

Who Controls the Margin Pool

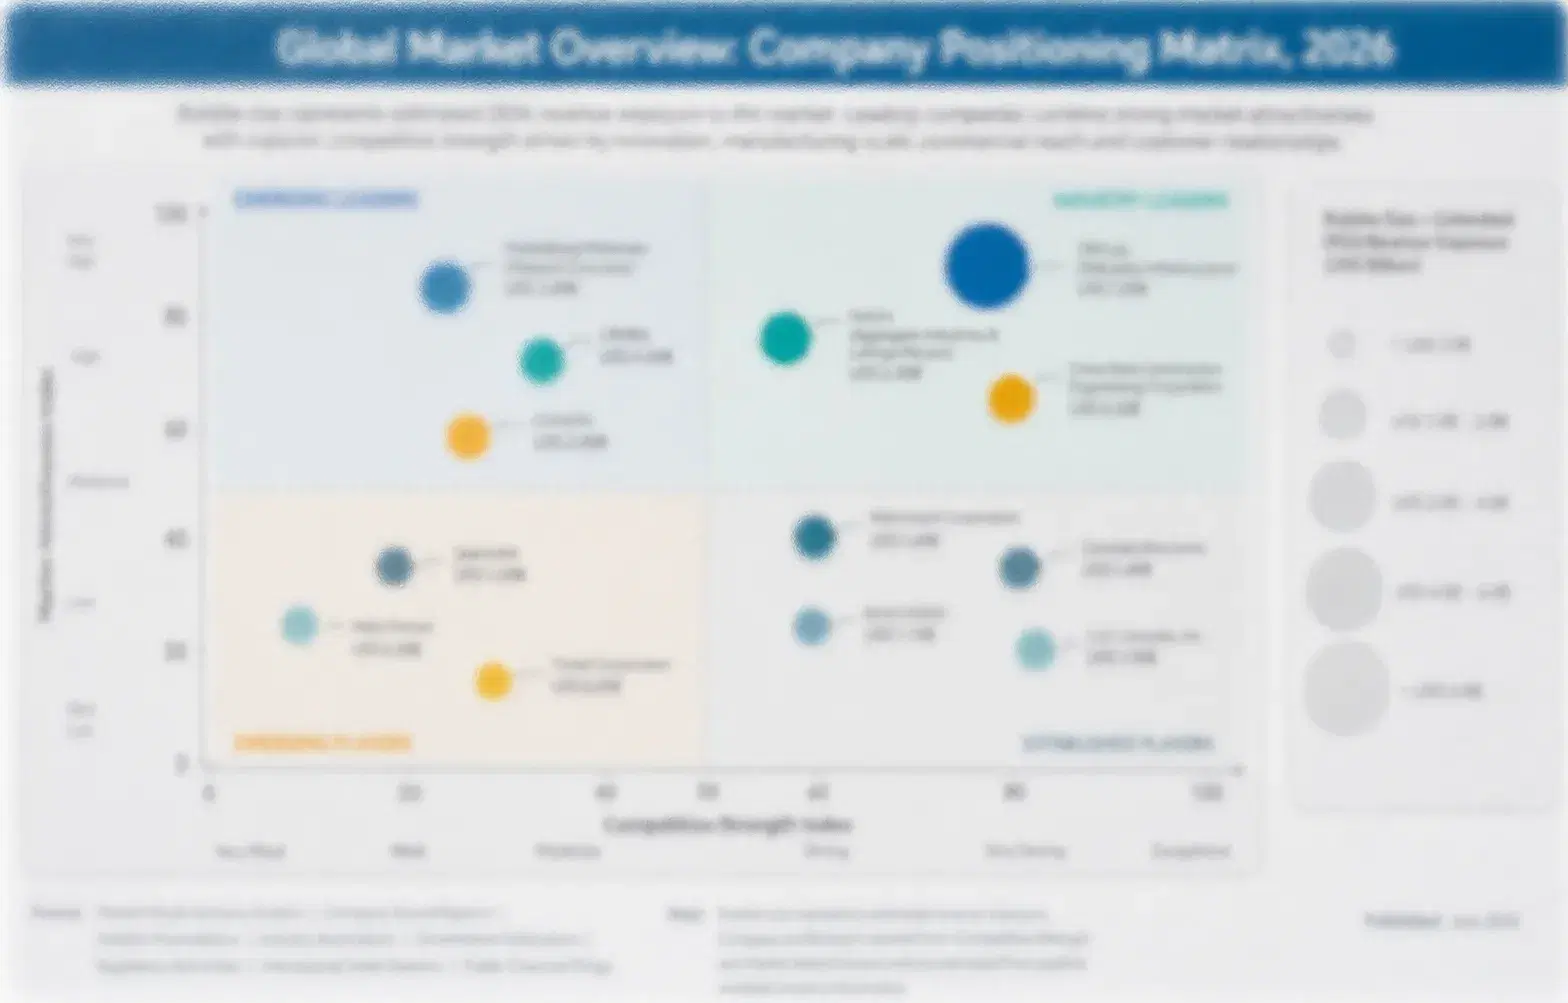
The damaged starch analyzer market is moderately concentrated, with a CR5 of 46%, because a few cereal instrument specialists and broad analytical groups hold most installed bases while local makers and enzyme kit suppliers serve niches. This assessment measures participants on estimated damaged starch analyzer revenue, held constant across all players. FOSS and KPM Analytics lead through installed bases and service reach, Brabender, Bruker and Buhler follow, and the gap between the leader and the fifth player is moderate.
Competition runs on four dimensions today: method accuracy against reference standards, service response, price per unit and consumable cost, and inline capability. Global groups win on service networks and sensor technology, specialists win on cereal know-how and standard status, and kit suppliers win on reference credibility. Buyers compare agreement with reference methods, service response and total cost.

Emerging pressure comes from inline near-infrared systems displacing benchtop sampling, from software bundles that lock in installed fleets and from Asian makers offering low-cost units. Rankings shift where a supplier validates inline models, wins mill group contracts or builds service in growth markets, and consolidation continues as small makers face component and software costs.
damaged-starch-analyzer-market-company-positioning-matrix-1790038085489

Competitive Moat and Risk Dimensions

FOSS

Moat: Global Service and Sensor Depth

FOSS is a Danish analytical instrument group serving grain, flour, dairy and feed customers with near-infrared and other analyzers sold through direct sales and distributors in many countries. Its sensor expertise, calibration libraries and service network give it strong access to large mills and food groups, and its scale supports investment in inline products and software.
FOSS

Risk: Broad Focus and Inline Competition

FOSS serves many industries, so damaged starch analyzers are a small part of its business and investment competes with larger categories. Specialists compete on method accuracy and price, component costs squeeze margins, and rule changes can shift demand quickly. Investors expect steady returns and careful capital use.
KPM ANALYTICS

Moat: Cereal Method Credibility

KPM Analytics is a United States analytical instrument group whose Chopin Technologies brand, based in France, supplies flour and dough testing instruments including amperometric starch damage analyzers used in mills and bakeries worldwide. Its cereal method credibility, installed base and service network give it strong access to laboratories, and its brand supports consumable and calibration revenue.
KPM ANALYTICS

Risk: Narrow Focus and Ownership Changes

KPM Analytics depends on cereal and food testing, so mill investment cycles hit the whole business, and ownership changes can shift priorities and costs. Inline competitors and low-cost Asian makers pressure prices, component costs squeeze margins, and rule changes can shift demand quickly. Investors expect steady returns.

Players Tracked

Prominent Players

FOSS
KPM Analytics
Brabender
Bruker
Buhler

Other Key Players

Megazyme
Perten Instruments
Kett Electric Laboratory
Zeltex
Next Instruments
Thermo Fisher Scientific
Mettler Toledo
Metrohm
Shimadzu
Agilent Technologies
Anton Paar
Dickey-john
Unity Scientific
Hach
Bastak Instruments

Recent Developments

JANUARY 2026

Instrument Maker Launches Inline Near-Infrared Starch Damage Sensor for Roller Mill Flour Streams

An instrument maker launched an inline near-infrared starch damage sensor for roller mill flour streams, according to company communications. It is a product launch, not an acquisition, and it tests inline demand. The sensor uses calibrated spectral models. Sales terms were not disclosed. Rollout follows customer reviews.
Signal: Confirms instrument makers are widening inline lines because mills want damaged starch results in seconds, not hours.
FEBRUARY 2026

Analytical Group Expands Instrument Assembly Capacity in Europe to Serve Cereal and Flour Testing Demand

An analytical group expanded instrument assembly capacity in Europe to serve cereal and flour testing demand, according to company communications. It is an organic capacity expansion, not an acquisition, and it tests supply readiness. The site adds assembly lines. Financial terms were not disclosed. Rollout follows customer reviews.
Signal: Shows makers are adding assembly capacity because component supply has stabilised and mill orders are recovering steadily.
MARCH 2026

Standards Body Announces Review of Reference Methods for Starch Damage Measurement in Flour

A standards body announced a review of reference methods for starch damage measurement in flour, according to public announcements. It is a standards action, not a commercial deal, and it tests method alignment. The review covers amperometric and enzymatic methods. Timing of any revision remains open.
Signal: Indicates standards bodies are revisiting reference methods because instrument agreement decides flour approval between mills and bakeries.

Electronics, Optics and Enzyme Cost Exposure

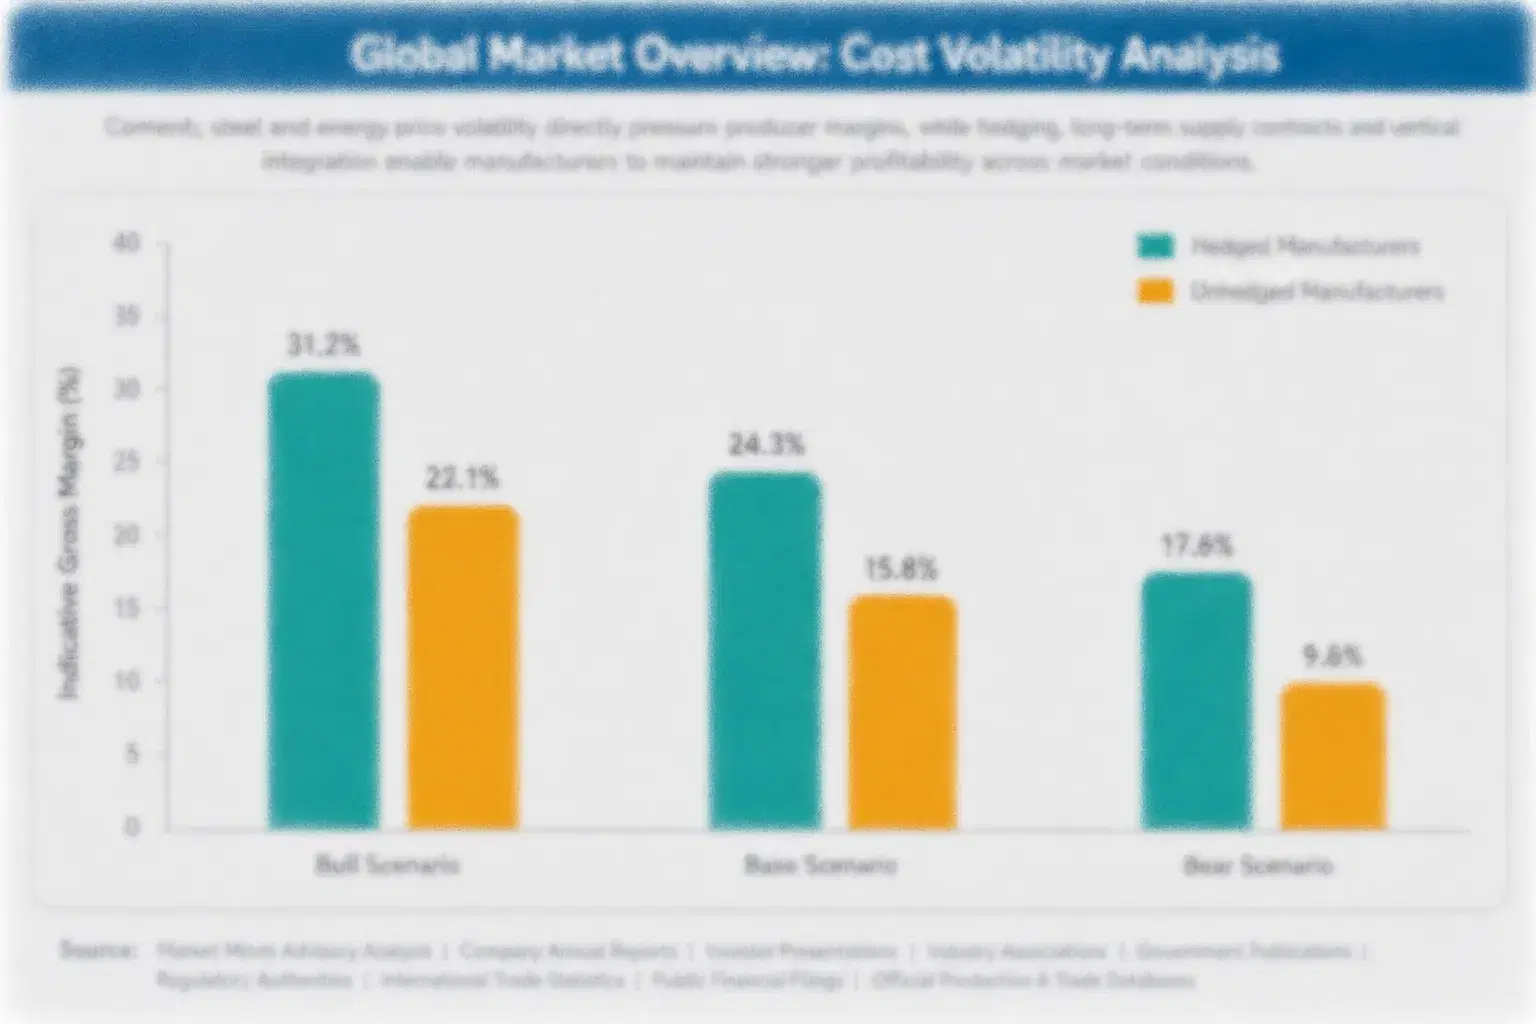
Sensors, boards and optics account for roughly 32% of manufacturing cost, precision machined housings and mechanics about 16%, enzymes and reagents about 8% in kit lines, assembly labour about 18%, software and calibration development about 12%, and logistics about 14%. Semiconductors come from Taiwan, South Korea and China, optics from Germany and Japan, and enzymes from a few specialist biotechnology producers. Small makers carry the heaviest exposure.
The clearest recent shock came in 2021 and 2022. SEMI data show semiconductor lead times stretching toward 40 weeks, Bruker's 2022 annual report describes supply chain constraints and higher component costs, and IEA data show energy costs spiking, which lifted machining and freight costs. Makers absorbed part of the increase, raised prices slowly and delayed deliveries, which compressed margins. Some relief came in 2024 as lead times normalised.

The disadvantage falls on small makers without dual sourcing, purchasing scale or design flexibility, because they pay spot prices and wait longest for parts. Exposure varies by player type: global groups hold purchasing power and inventory, specialists depend on a few components, and kit suppliers depend on enzyme batches. Pricing power decides who absorbs the shock.
damaged-starch-analyzer-market-cost-volatility-analysis-1790038085781

Dual Sourcing and Common Component Board Redesign

Makers qualify second sources for sensors and boards and redesign instruments around common parts to cut component cost swings of 20% to 35% per year. The main challenge is validation time and calibration drift, so makers test new parts early. Procurement teams monitor lead times each week against plans, and managers review sources every year. Engineers sign off first.

Buffer Inventory and Forward Component Orders

Makers hold buffer stock of critical sensors and place forward orders to shorten delivery delays by 30% to 50%. The main challenge is working capital of $2 million to $15 million, so makers prioritise long-lead parts. Reviews occur every quarter, and finance managers approve each order. Planners check weekly stock reports against confirmed customer orders and forecasts.

Modular Instrument Platforms Across Product Lines

Makers build shared platforms for benchtop and inline units to cut engineering and part cost by 8% to 15% and speed launches. The main challenge is design compromise across products, so makers test platforms with lead customers first. Results are reviewed each year, and audits confirm standards. Managers approve each platform and record results.

Portfolio Architecture for Margin Defence

Margins run from moderate returns on basic benchtop analyzers to strong returns on inline systems, calibration contracts and enzyme reagents sold with reference credibility and service. Three tiers separate volume products, premium certified products and next-generation solutions, and each draws on different sensor technology, service reach and laboratory relationships in a concentrated market. Margin gaps between tiers run to 24 points.
The tension between volume and premium is sharp. Basic benchtop units and rapid tests fill factory capacity at modest prices and face component swings, while inline systems and service contracts earn higher margins on smaller volumes and depend on calibration data, installed reach and mill trust. Suppliers that run only volume suffer when parts costs rise, while premium-only suppliers struggle to reach small mills.

High-value pools concentrate in inline and near-infrared analyzers and in calibration, service and software contracts, sold to large mills, industrial bakeries and reference laboratories. They gather where buyers pay for fast results, audit records and method agreement, not for hardware alone. Enzymatic kits add a recurring pool, and strong suppliers hold more than one, though each needs different skills. Buyers reward proof.

Volume / Commodity-Adjacent

Basic benchtop analyzers and colorimetric rapid test systems sold on price per unit to small mills and bakeries through distributors. Buyers focus on cost and availability, orders follow budget cycles, and differentiation is limited by shared methods and simple hardware.
Gross Margin: 30%-44%

Premium / Certified

Amperometric analyzers with validated methods, reference agreement and calibration services sold to large mills and bakeries. Buyers value proof of accuracy, repeatability and service response, and contracts run for one or more years with regular calibration audits.
Gross Margin: 42%-58%

Sustainability / Regulatory / Next-Generation

Inline near-infrared systems, connected software and enzymatic reference kits sold to mill groups, industrial bakeries and reference laboratories. Sales depend on calibration models, method standards and data integration across sites, and suppliers must show reliable service reach and clean validation records.
Gross Margin: 50%-68%
damaged-starch-analyzer-market-portfolio-architecture-1790038086067

High-value Sub-segments and Strategic Watch-out

Inline and Near-Infrared Analyzers

Inline and near-infrared analyzers combine the fastest growth with the strongest pricing, since large mills accept gross margins of 45% to 62% for results in seconds and tighter roll control. Calibration models, sensor durability and service reach form the entry barrier, and suppliers with credible validation data lead.
Gross Margin: 45%-62%

Enzymatic Assay Kits and Reagents

Enzymatic assay kits and reagents deliver solid growth with premium pricing, since laboratories support gross margins of 50% to 65% for reference-grade results. Enzyme purity and method validation limit competition, though research budgets add risk. Reviews occur each season. Laboratories renew orders each year. Mills renew contracts each year.
Gross Margin: 50%-65%

Benchtop Amperometric Analyzers

Benchtop amperometric analyzers are the volume core, with value growing about 4.4% a year. Component cost, long instrument life and price competition decide profit, and specialist makers and analytical groups hold most sales. Mills replace units slowly and negotiate prices through distributors and competing quotes.
Gross Margin: 36%-52%

Colorimetric and Rapid Test Systems

Colorimetric and rapid test systems are the strategic watch-out, since growth of about 3.8% a year trails the leaders, accuracy against reference methods is weaker and low-cost makers compete on price. Suppliers should manage ranges selectively, avoid heavy capital and steer investment toward inline systems and services with clearer buyers.
Gross Margin: 30%-44%

Why Mills Keep Measuring Starch Damage

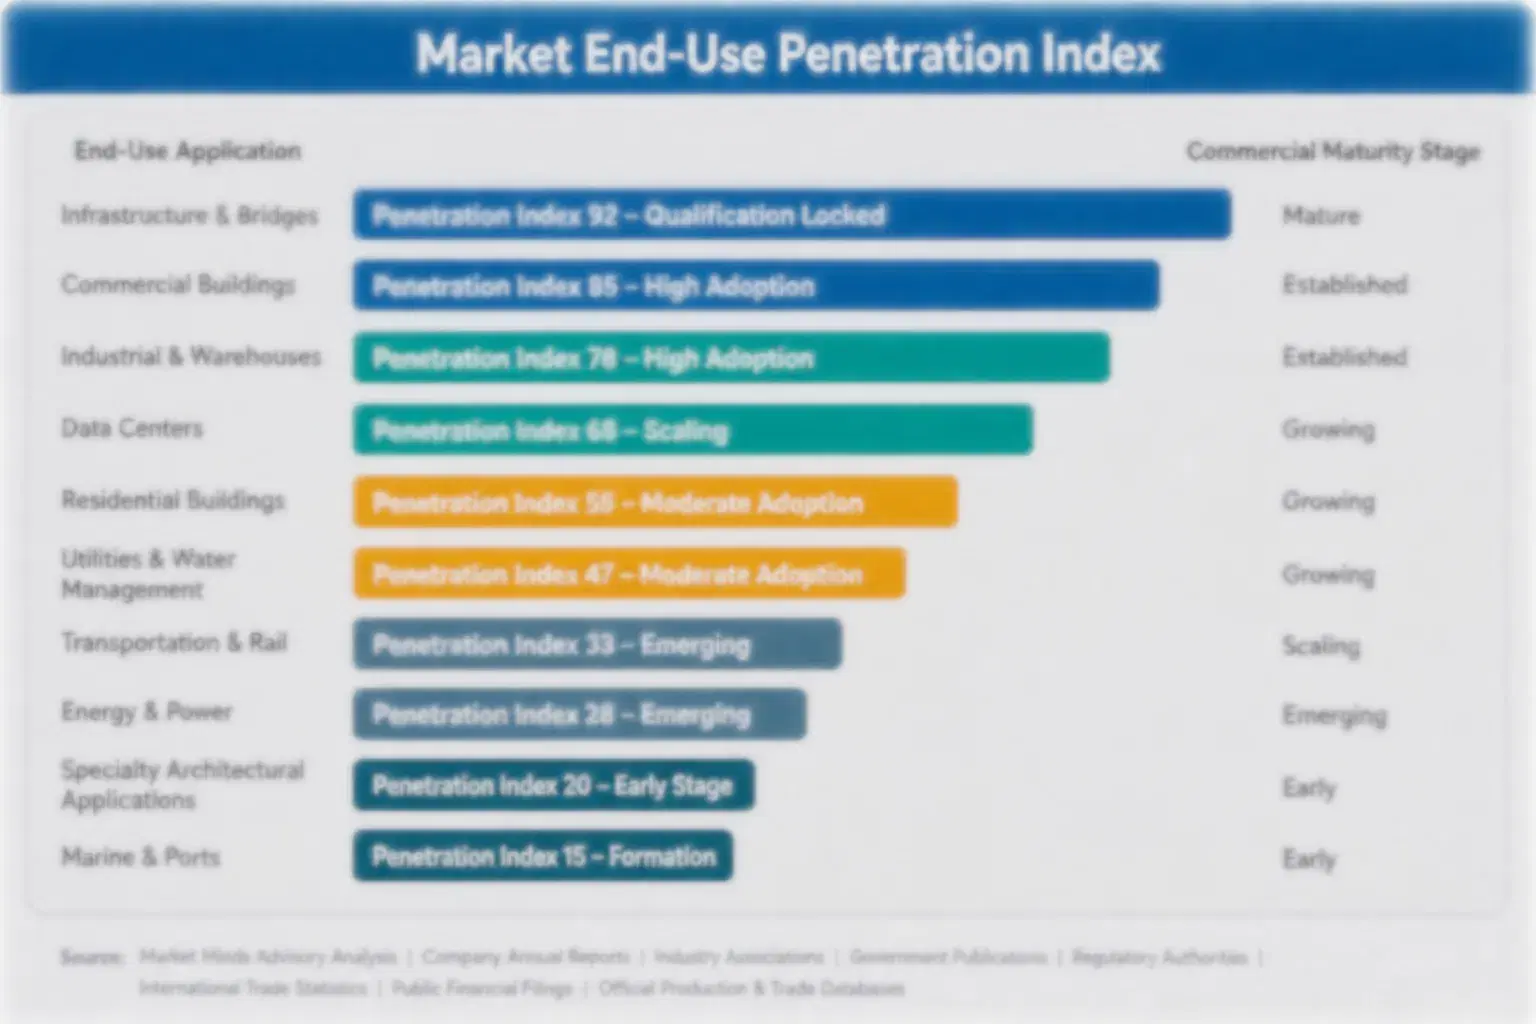
Analyzer demand behaves like an annuity attached to every installed unit. Once a mill qualifies an instrument, method and calibration routine, reagents, service and software renew each year, and switching means re-running months of comparison data against flour specifications. Contracts run around calibration schedules and audits, so suppliers with reliable service earn recurring revenue. Trust, once earned, takes years to lose. Habit protects the contract.
Adoption stickiness differs by end-use vertical. Industrial bakeries and noodle makers are the deepest, since damaged starch limits are written into flour specifications and audited. Large mills are moderately sticky, driven by contracts with bakeries and process control needs. Small mills are more fluid, buying on price and testing rarely, though customer complaints hold routine testing for several seasons. Millers reward reliability.

Buyer profiles are shifting between generations. Older millers trusted operator experience and occasional lab checks, while younger quality managers want continuous data, dashboards and audit-ready records, and compare suppliers on integration. Bakeries and retailers add a third group that sets specification limits. Suppliers that publish clear validation and calibration data win newer buyers. Replacement is easy for the supplier but costly for the mill.
damaged-starch-analyzer-market-end-use-penetration-index-1790038086354

MMA Verdict: Damaged Starch Analyzer Strategy

These are among the four positions where our research anticipates prominent divergence between winners and laggards over the coming forecast period. Each is grounded in the demand model, the regulatory perimeter, and the announced capacity pipeline.
01 / INLINE SENSING STRATEGY

Scale Inline Near-Infrared Systems Before Mill Groups Standardise Process Analyzer Suppliers

Large mills want results in seconds, and suppliers that scale inline near-infrared systems with calibration models validated against reference methods win sales worth 10% to 18% of revenue at gross margins of 45% to 62%. Suppliers should invest $2 million to $10 million, share validation data and offer pilot installations. Those that delay will lose mill groups over the next two years, while early movers hold higher prices, stronger margins and lasting presence across every annual contract review, audit and season.
02 / RECURRING REVENUE STRATEGY

Bundle Software and Calibration Contracts Before Mills Choose Independent Service Providers

Installed analyzers drift and mills must prove control, and suppliers that bundle software, calibration and certificate export with annual contracts lift service revenue by 20% to 35% and protect margins worth 6% to 10% of profit. Suppliers should invest $1 million to $5 million, price contracts by fleet and secure data privacy. Those that delay will lose fleets over the next two years, while early movers hold stronger mill ties, steady demand and better margins across every season, annual review and negotiation.
03 / REFERENCE KIT DISCIPLINE

Secure Enzymatic Reference Status Before Laboratories Standardise Alternative Calibration Methods

Reference laboratories calibrate other instruments against enzymatic methods, and suppliers that secure standard status and grow kit pull-through in breeding and mill laboratories lift consumable volume by 10% to 20% at gross margins of 50% to 65%. Suppliers should invest $0.5 million to $3 million, support ring trials and hold batch consistency. Those that delay will lose laboratories over the next two years, while early movers hold stronger loyalty, steadier revenue and better margins across every review, season and annual negotiation with major laboratories.
04 / COMPONENT RESILIENCE STRATEGY

Dual Source Sensors Before Component Shortages Erode Instrument Margins Again

Electronics make up about 32% of cost, and suppliers that redesign boards around common parts and dual source sensors and optics cut component cost swings by 20% to 35% and protect margins worth 5% to 8% of profit. Suppliers should invest $1 million to $6 million, keep spare stock and qualify second sources early. Those that delay will pay rising component bills over the next two years, while early movers hold lower costs and stronger margins across every production cycle and annual budget review.

Engagement Snapshot From the Field

A live engagement with an industry participant carrying material or product regulatory and market exposure ahead of a defining policy shift, showing how our research translates into a defensible multi-year portfolio strategy.
MARKET MINDS ADVISORY · CLIENT ENGAGEMENT SUMMARY
Damaged Starch Analyzer Producer Strategic Portfolio Review and Transition Roadmap 2026·Investment Scenario on Damaged Starch Analyzer Exposure Evaluation 2025-26
CLIENT PROFILE
The client is a mid-sized European cereal instrument maker with annual damaged starch analyzer revenue near $45 million (client-reported, unverified by MMA), selling benchtop analyzers, reagents and service to mills and bakeries in about 60 countries. About 70% of revenue came from benchtop units, component shortages had squeezed margins, and management wanted a plan to add inline systems and service contracts.
STRATEGIC CHALLENGE
Benchtop margins sat near 34% (client-reported, unverified by MMA), component cost had risen about 18% over two years and two large mill groups had asked for inline near-infrared systems with connected software and fleet service. Management had to decide whether to build inline sensors, partner with a sensor supplier or expand service, with limited capital and one plant. Customers wanted proposals.
MMA APPROACH
MMA analysed revenue, cost and installed base data across 45 product lines, interviewed 14 mill managers, bakery quality staff and instrument distributors, and ran a customer survey on inline systems, software and service across six countries. It modelled margin by product and customer size, compared building, partnering and service expansion by payback and execution risk, and tested each against component price scenarios.
KEY FINDINGS
  1. An inline near-infrared system would win sales worth about 10% of revenue at gross margins above 50% within three years (client-reported, unverified by MMA).
  2. Software and calibration contracts would lift recurring revenue by about 25% across two years of fleet coverage and better retention (client-reported, unverified by MMA).
  3. Enzymatic kit pull-through would lift consumable volume by about 12% across two years of laboratory programmes and steadier reagent margins (client-reported, unverified by MMA).
  4. Dual sourcing would cut component cost swings by about 25% across three years and two product lines and protect margins (client-reported, unverified by MMA).
CLIENT PROFILE
The client is a mid-sized European cereal instrument maker with annual damaged starch analyzer revenue near $45 million (client-reported, unverified by MMA), selling benchtop analyzers, reagents and service to mills and bakeries in about 60 countries. About 70% of revenue came from benchtop units, component shortages had squeezed margins, and management wanted a plan to add inline systems and service contracts.
STRATEGIC CHALLENGE
Benchtop margins sat near 34% (client-reported, unverified by MMA), component cost had risen about 18% over two years and two large mill groups had asked for inline near-infrared systems with connected software and fleet service. Management had to decide whether to build inline sensors, partner with a sensor supplier or expand service, with limited capital and one plant. Customers wanted proposals.
MMA APPROACH
MMA analysed revenue, cost and installed base data across 45 product lines, interviewed 14 mill managers, bakery quality staff and instrument distributors, and ran a customer survey on inline systems, software and service across six countries. It modelled margin by product and customer size, compared building, partnering and service expansion by payback and execution risk, and tested each against component price scenarios.
KEY FINDINGS
  1. An inline near-infrared system would win sales worth about 10% of revenue at gross margins above 50% within three years (client-reported, unverified by MMA).
  2. Software and calibration contracts would lift recurring revenue by about 25% across two years of fleet coverage and better retention (client-reported, unverified by MMA).
  3. Enzymatic kit pull-through would lift consumable volume by about 12% across two years of laboratory programmes and steadier reagent margins (client-reported, unverified by MMA).
  4. Dual sourcing would cut component cost swings by about 25% across three years and two product lines and protect margins (client-reported, unverified by MMA).
RECOMMENDED STRATEGY
Phase 1: Phase 1 (Months 1-9): Partner with a sensor supplier, pilot inline systems at three mills and bundle service contracts for existing customers each quarter, reviewing results. Phase 2: Phase 2 (Months 10-24): Launch inline systems widely, extend software to all installed fleets and retire the weakest low-margin benchtop variants with customer approval. Phase 3: Phase 3 (Months 25-42): Decide on owned sensor development using margin data, add dual sourcing across boards and expand service in two growth regions in stages.
OUTCOME
Within 42 months, inline systems, software and service reached 34% of revenue, blended margins rose by about six points and component cost swings fell by about 22% (client-reported, unverified by MMA). Two mill groups signed multi-year agreements, validation data supported new contracts, and connected service strengthened customer loyalty.

Frequently Asked Questions

Foundational context covering the market sizes, CAGR, scope, country, region and competition that inform every finding below. This section is provided to cover basics and most often pre-purchase conversations, answered from the MMA Primary Research Dataset.

What is the current size of the Damaged Starch Analyzer Market?

The global damaged starch analyzer market was valued at $0.3 billion in 2025 on a supplier revenue basis. Growth comes from mill capacity, inline sensing and tighter flour specifications, and faces component costs and long instrument lives.

How large will the Damaged Starch Analyzer Market be by 2036?

The market is projected to reach $0.54 billion by 2036, up from $0.32 billion in 2026. The increase of $0.22 billion reflects inline systems, software and Asian mill demand.

What is the CAGR for the Damaged Starch Analyzer Market 2026 to 2036?

The market is forecast to grow at a 5.5% CAGR from 2026 to 2036. The bull case reaches 6.8% and the bear case 4.2%, depending on inline adoption, mill investment and component supply.

Which segment is growing fastest?

Inline and Near-Infrared Analyzers is the fastest-growing segment at 7.7% CAGR, roughly 1.40 times the overall market rate. Enzymatic Assay Kits and Reagents follows at 6.6% CAGR, led by reference laboratory demand.

Who are the major companies in the Damaged Starch Analyzer Market?

Major companies include FOSS, KPM Analytics, Brabender, Bruker and Buhler. Megazyme, Perten Instruments, Kett Electric Laboratory, Zeltex and Thermo Fisher Scientific also hold meaningful positions in specific niches.

Which country is growing fastest?

India is growing fastest at about 8.2% CAGR, because roller mill capacity, packaged bread and biscuit growth and quality rules expand together. China and Vietnam follow through milling and noodle capacity.

Report Segmentation Architecture

The full report scope spans multiple orthogonal segmentation dimensions, with cross-tabulated demand data provided for each dimension pair. Coverage extends further to regional breakdowns, trend trajectories, and the competitive detail needed to support segment-level decision-making.

By Primary Market Dimension

  • Benchtop Amperometric Analyzers
  • Inline and Near-Infrared Analyzers
  • Enzymatic Assay Kits and Reagents
  • Colorimetric and Rapid Test Systems
  • Calibration, Service and Software

By End-Use Industry

  • Flour Mills
  • Industrial Bakeries
  • Pasta and Noodle Manufacturers
  • Research and Breeding Laboratories

By Commercial Dimension

  • Direct Sales
  • Distributor Networks
  • Service Contract Sales
  • Tender and Public Laboratory Sales
  • Online and Consumable Sales

By Region

  • North America
  • Western Europe
  • East Asia
  • South Asia and Pacific
  • Latin America
  • Middle East and Africa
  • Eastern Europe

Scope, Methodology, and Coverage

Every figure in this report is reproducible from documented input assumptions. The scope below maps the historical period, the forecast horizon, the segmentation dimensions, and the countries covered, alongside the underlying primary and qualitative methodology.
Historical Period
2020 to 2025
Forecast Period
2026 to 2036
Base Year
2025 (USD billions; MMA Primary Research Dataset, September 2026)
Market Definition
The market covers global supplier revenue from damaged starch analyzers, defined as instruments and consumables that measure mechanically damaged starch in flour and milled cereal products, in benchtop amperometric analyzers, inline and near-infrared analyzers, enzymatic assay kits and reagents, colorimetric and rapid test systems, and calibration, service and software, sold to flour mills, bakeries, food manufacturers and laboratories. It excludes general grain analyzers, rheology instruments, baking equipment and contract laboratory testing services.
Quantitative Units
USD billions (supplier revenue); thousand units for installed base references
Segmentation Dimensions
By Offering Type; By End-Use Industry; By Commercial Dimension; By Region
Regions Covered
North America, Western Europe, East Asia, South Asia and Pacific, Latin America, Middle East and Africa, Eastern Europe
Countries Covered
United States, Canada, Mexico, Germany, France, Italy, United Kingdom, Netherlands, Denmark, Turkey, China, Japan, South Korea, India, Australia, Vietnam, Brazil, Argentina, Chile, Egypt, Saudi Arabia, Nigeria, South Africa, Poland, Russia, Ukraine, Romania, and additional markets relevant to this sector
Key Companies Profiled
FOSS, KPM Analytics, Brabender, Bruker, Buhler, Megazyme, Perten Instruments, Kett Electric Laboratory, Zeltex, Next Instruments, Thermo Fisher Scientific, Mettler Toledo, Metrohm, Shimadzu, Agilent Technologies, Anton Paar, Dickey-john, Unity Scientific, Hach, Bastak Instruments
Quantitative Methodology
Primary survey, n=3,800 respondents, Q4 2025, six countries; demand-side model with trade association cross-validation
Qualitative Methodology
47 expert interviews, Q4 2025; applied to validate demand model assumptions, identify emerging dynamics, and assess competitive positioning
Report Format
PDF and XLSX data workbook (Word format preview document)
Publisher
Market Minds Advisory
Report Code
MMA-2026-TEC-338
Published
September 2026
Contact
sales@marketmindsadvisory.com | www.marketmindsadvisory.com

Purchase the full Damaged Starch Analyzer Market Report (2026 to 2036).

The full report delivers a detailed assessment of the global damaged starch analyzer market through 2036, covering offering type, end-use industry, channel and regional forecasts, competitive benchmarking of leading instrument makers and analytical groups, and input cost analysis. It combines MMA primary research, including a six-country survey of 3,800 respondents and 47 expert interviews, with public statistical and company data. Analysts also model component, energy and enzyme scenarios. Clients receive segment margin ranges, installed base maps and a case study on growth strategy. Buyer negotiation frameworks are also included.
Ten-year offering type and end-use demand forecasts
Electronics, optics and enzyme cost tracking
Competitive benchmarking of leading analyzer suppliers
Milling standards and reference method tracker
Regional comparative analysis and forecasts included
Quarterly primary survey data update access

Built For The People Who Decide

From boardroom strategy to bench-side execution, this report is read cover-to-cover by leaders shaping the next decade of their industry, turning demand scenarios, market dynamics and valuation benchmarks into decisions.
CXOs/ Presidents/ VPs/ Managers
M&A and Corporate Development
Strategy Teams and R&D Heads
Procurement and Product Directors
Regulatory and Compliance Leaders
Investor Relations and Equity Analysts