Market Minds Advisory
Currency Exchange Bureau Software Market

Currency Exchange Bureau Software Market: Currency Exchange Bureau Software Market: Transaction Systems, Compliance Screening and Cash Inventory Control, 2026 to 2036

Nobody buys this software to serve customers faster. They buy it because a supervisor will otherwise close the branch, and the cheapest till system on the market cannot survive an inspection.

Lead Analyst

Published

September 2026

Make Smarter Decisions with Customized Research Insights

Request a free sample report and evaluate market opportunities, growth trends, and competitive dynamics relevant to your business needs.

2025 MARKET VALUE$0.4BMarket Size 2025
2036 FORECAST VALUE$1.0BBase Case , 2026 to 2036
CAGR 2026 TO 20369.6 %Bull 10.8% / Bear 8.4%
INCREMENTAL OPPORTUNITY$0.6BNet 10- year value creation
EXPANSION MULTIPLE2.50x2036 value over 2026 base
Strategic Levers
M&A Pipeline
Regional Outlook
Country Rankings
Competitive Intelligence
Segmental Deep-dive
Call-Us : 91 93563 13602

Executive Snapshot and Market Trajectory.

Compliance now absorbs 41% of what a currency exchange operator spends on software, and the reason is straightforward. Supervisors treat cash currency exchange as high risk for laundering, so the licence depends on demonstrable screening and record keeping. Cheap till systems fail the first inspection.
Compliance screening and reporting grows at 14.4%, half again the market rate of 9.6%, and no other function comes close. Online ordering with branch collection follows behind it, now carrying 23% of transactions. Middle East and Africa holds 22% of contracted spend, far above what regional economic size would suggest, because Gulf exchange houses are among the largest and most heavily supervised operators anywhere. The purchase is defensive and urgent.
The vendor field is fragmented, with five holding 39% between them and dozens of local suppliers serving single jurisdictions. What almost none of them address properly is cash inventory, where roughly 18% of currency sits beyond expected branch demand. A bureau earns on the spread and loses it holding the wrong notes in the wrong place. Inventory is where the money actually goes, and almost no vendor forecasts it by branch and denomination properly.
Market Definition
This market covers software used by licensed currency exchange bureaux and money changing operators, including transaction and till management, rate management and margin control, compliance screening and regulatory reporting, cash and vault inventory management, online ordering and collection platforms, and multi-branch consolidation and analytics. It excludes cross-border payment and remittance processing platforms, retail banking core systems, wholesale foreign exchange trading software, and physical cash handling hardware.
Base Year Value
$0.4B in 2025 (MMA Primary Research Dataset, September 2026)
Forecast Period
2026 to 2036, eleven discrete annual values
CAGR
9.6% base case. Bull 10.8%. Bear 8.4%.
Fastest Growth Segment
Compliance Screening And Reporting: 14.4% CAGR
Fastest Growth Country
United Arab Emirates: 13.4% CAGR
Fastest Growth Region
South Asia and Pacific: 11.6% CAGR
Largest Region
Middle East and Africa: 22% of 2025 global value
Market Leaders
Fexco, Currency Exchange International, Temenos, ACI Worldwide, and Oracle Financial Services lead the field. Source: MMA Primary Research Dataset, July 2026.
Primary Survey
n=3,800 procurement and R&D decision-makers, Q4 2025, six countries
Methodology
Demand-side build-up, cross-validated against public data, 47 expert interviews

Currency Exchange Bureau Software Market Forecast Scenarios

currency-exchange-bureau-software-market-size-forecast-scenario-1790007891416
Growth between 2020 and 2025 recovered from a near total stop. Travel currency exchange collapsed during the pandemic period and a significant number of smaller bureaux closed permanently, while the survivors emerged into a supervisory environment that had tightened considerably in the meantime. Historical growth of 8.3% blends that collapse, a strong travel recovery, and a compliance obligation that arrived regardless of transaction volumes.
The base case at 9.6% rests on three mechanisms. Supervisory expectations for screening, record keeping, and reporting continue rising across most jurisdictions, and satisfying them manually is no longer possible at any scale. Online ordering with branch collection keeps taking share from walk-in trade, which requires platform capability smaller operators do not have. And consolidation among bureaux creates multi-branch groups whose reporting and inventory requirements exceed what single-site systems handle.
The bull case at 10.8% turns on supervisors requiring transaction level reporting rather than periodic summaries in a major jurisdiction, which would oblige every licensed operator to replace systems built for aggregate returns. The bear case at 8.4% is card substitution: travellers increasingly carry multi-currency cards, and if cash exchange volumes decline faster than expected the smallest operators exit rather than upgrade anything.

Licences Buy Software, Efficiency Does Not

The purchase decision in this market is defensive and almost always urgent. Supervisors classify cash currency exchange as high risk for money laundering, and a bureau licence depends on demonstrating screening against sanctions lists, retaining transaction records in an inspectable form, and filing reports on a defined schedule. Compliance functions absorb 41% of software spending as a direct result. None of it makes the business more profitable.
TOP FIVE CONCENTRATION39%Share of contracted spend held by the leading vendors
AVERAGE BRANCH COUNT34Branches operated by a typical licensed bureau customer
COMPLIANCE SHARE OF SPEND41%Portion of software budget devoted to screening and regulatory reporting
IDLE CASH HOLDING18%Currency inventory sitting beyond expected demand at branches
MEDIAN CONTRACT VALUEUSD 62,000Annual subscription paid by a typical multi-branch operator
DIGITAL ORDER SHARE23%Transactions originating online for collection at a branch
That is not where a bureau makes money, which creates a persistent tension. Revenue comes from the spread between buy and sell rates, and the largest hidden cost is cash sitting in the wrong branch. Around 18% of currency inventory exceeds expected local demand, tying up working capital and requiring physical transfers that carry insurance and security cost nobody prices properly. Rate errors cost far less than misplaced notes do.
Almost no vendor addresses that inventory problem seriously. Systems record what a branch holds and very few forecast what it will need, so managers rebalance on experience and habit. An operator running 34 branches across a city is making dozens of inventory judgements weekly with no analytical support at all, and the money lost there exceeds anything a rate engine recovers.
"We asked twelve bureau operators what their software actually saved them. Nine talked about passing inspections and three could not answer. Not one mentioned cash. The largest controllable cost in the business is sitting in a safe somewhere, and the industry has decided that is a management problem rather than a software one."
Practice Director, Financial Services Technology · MMA Technology Practice · September 2026

Market Trends

Supervisory Expectations Rise Faster Than Manual Capacity

Screening against sanctions and politically exposed person lists, retaining inspectable records, and filing structured reports have all moved from good practice to licence conditions across most jurisdictions. A bureau handling a few hundred transactions a day cannot meet those obligations with spreadsheets and a paper file, and inspectors have stopped accepting that it might. Compliance grows at 14.4% on that shift alone. The purchase is triggered by an inspection finding far more often than by any planning cycle, which makes demand urgent, unbudgeted, and relatively price insensitive. Inspectors stopped accepting spreadsheets some time ago.
Market Impact: Drives 13.4% growth in Emirates

Online Ordering Takes Share From Walk-In Currency Trade

Travellers increasingly order currency online and collect it at a branch or airport counter, which secures a better rate for the customer and a committed transaction for the operator. Around 23% of transactions now originate this way. The operational consequence is significant: the branch must hold specific currency against a specific collection time, which turns an inventory guess into a known requirement. Operators without platform capability lose this trade entirely to larger competitors and to banks, since the customer decides before leaving home. The customer decides before leaving home, which removes any chance to compete at the counter.
Market Impact: Averages 34 branches per operator

Market Opportunities and Growth Drivers

Gulf Exchange Houses Operate At Institutional Scale

Exchange houses across the Gulf run branch networks in the hundreds, handle remittance volumes comparable with mid-sized banks, and are supervised accordingly by central banks that inspect thoroughly and frequently. Growth in the United Arab Emirates reaches 13.4%, the fastest of any country covered. These operators buy institutional grade systems with integration, reporting, and screening depth that a European travel money bureau would never require, and their contract values run several times the global median as a direct consequence. European travel money bureaux require nothing comparable. Contract values run several times the global median.
Market Impact: Idles 18% of inventory

Consolidation Creates Multi-Branch Group Reporting Requirements

Bureau operators are consolidating as compliance cost per branch rises and smaller independents find the obligations uneconomic, which produces groups running 34 branches on average where three separate businesses once operated. Group level reporting, consolidated screening, and centralised rate control all exceed what single-site systems were built to handle. That converts an acquisition into a system replacement in most cases, and the replacement decision is made by a compliance officer rather than by a branch manager. Compliance cost per branch is what makes independent operation uneconomic in the first place, and the acquirer inherits every system the seller ran.
Market Impact: Cuts walk-in trade below 77%

Market Restraints and Challenges

Cash Inventory Consumes Capital Nobody Manages Analytically

Roughly 18% of currency inventory sits beyond expected branch demand, and the root cause is that vendors record holdings without forecasting requirements, leaving managers to rebalance on experience. Commercially this ties up working capital, generates physical transfers with insurance and security cost, and exposes operators to rate movement on stock they did not need. Participants are beginning to respond with demand forecasting by branch and currency, collection order visibility feeding inventory planning, and transfer optimisation across branch networks, though adoption remains very limited. Adoption of any of it remains very limited.
Market Impact: Absorbs 41% of software spend

Card Substitution Erodes The Underlying Transaction Base

Multi-currency travel cards and contactless acceptance abroad have reduced how much physical currency travellers carry, and the root cause is convenience rather than price. Commercially this shrinks the walk-in trade that funded smaller bureaux, drives closures among single-site operators, and concentrates the remaining market in fewer larger groups. Participants respond by moving toward remittance and payment services alongside exchange, by serving corridors where cash remains dominant, and by targeting the consolidating groups rather than the independents disappearing beneath them. Consolidating groups are what remains worth selling to. Independents are disappearing beneath them.
Market Impact: Covers 23% of transactions
3 additional market trends, 4 additional growth drivers, and 2 additional restraints and challenges are covered in the full report. Contact sales@marketmindsadvisory.com to access the complete intelligence.

Segment CAGR and Growth Architecture

Segmentation follows software function. Six categories cover the market: transaction and till management, rate management and margin control, compliance screening and regulatory reporting, cash and vault inventory management, online ordering and collection platforms, and multi-branch consolidation and analytics. Compliance now outspends every other function individually. Inventory management is the least developed of the six by some distance.
currency-exchange-bureau-software-market-market-share-analysis-1790007891949

Compliance Screening And Reporting

Compliance grows at 14.4%, half again the market rate of 9.6%, and it is the only function whose purchase is genuinely non-negotiable. Screening against sanctions and politically exposed person lists, retaining records an inspector can examine, and filing structured returns are licence conditions rather than operational preferences. The trigger is usually an inspection finding rather than any planning cycle, which makes demand urgent, unbudgeted, and comparatively insensitive to price. Vendors who can evidence acceptance by a specific national supervisor win against technically superior competitors who cannot, because the buyer is purchasing regulatory certainty rather than software capability. Regulatory certainty is the product being purchased. Technical comparison decides very little here.
CAGR 14.4%

Online Ordering And Collection Platforms

Online ordering grows at 12.7% and now carries roughly 23% of transactions, as travellers reserve currency before leaving home and collect at a branch or airport counter. For the operator this converts a walk-in guess into a committed order with a known collection time and a known currency requirement, which is genuinely valuable if the inventory system uses it. Most do not. Operators without platform capability lose this trade permanently, since the customer's decision is made before any branch is visited, and the competitors taking it are larger groups and banks with established online presence. Banks compete for the same reservations. Larger groups take the trade permanently. Most systems waste the order information entirely.
CAGR 12.7%
Full segment breakdown across 6 segments available in the complete report.

Regional Architecture and Country Demand Map

Regional shares follow physical currency exchange volume and supervisory intensity rather than economic size, which produces figures well outside the standard bands. Read the table as a map of where physical cash still changes hands in volume. Card-dominant economies generate far less demand than their wealth implies.

Middle East and Africa

At 22% this region sits far above the standard band, and the justification is that Gulf exchange houses are the largest and most heavily supervised operators of their kind anywhere. Branch networks run into the hundreds, remittance volumes rival mid-sized banks, and central bank inspection is frequent and thorough, which produces institutional grade software requirements and contract values several times the global median. Emirates growth of 13.4% leads every country covered. African demand follows a different pattern entirely, concentrated in formalising money changer sectors where licensing regimes have tightened considerably in recent years. Licensing regimes across Africa have tightened considerably, which is formalising a sector that previously operated informally. Inspection is frequent.
Share: 22% | CAGR: 9.9% (2026 to 2036)

Western Europe

Travel money is the defining application here, concentrated in airports, tourist districts, and transport hubs, and the sector has consolidated sharply as compliance cost per branch made independent operation uneconomic. Supervisory expectations are demanding and well documented, which favours vendors who can evidence acceptance by specific national authorities. Growth of 8.1% is the slowest of the seven regions, held down by card substitution reducing physical currency demand faster here than almost anywhere else. Remaining operators are larger, better capitalised, and buying more capable systems than the fragmented sector they replaced. Remaining operators are larger and better capitalised than the fragmented sector they replaced. Card substitution bites hardest in this region of the seven.
Share: 21% | CAGR: 8.1% (2026 to 2036)
Regional intelligence for 5 additional markets available in the complete report: South Asia and Pacific, East Asia, North America, Latin America, Eastern Europe. Contact sales@marketmindsadvisory.com.
currency-exchange-bureau-software-market-country-cagr-analysis-1790007892517

How Vendors Win Bureau Accounts

Four commercial moves separate vendors growing in this market from those competing on features nobody is buying. Each recognises that the purchase is triggered by supervision rather than by ambition, and that the buyer is usually a compliance officer working to a deadline somebody else set for them. Feature comparison rarely enters it. Deadlines drive everything.

Evidence Acceptance By Named National Supervisors

A bureau facing an inspection finding is buying regulatory certainty rather than software, and the most persuasive thing a vendor can offer is a list of operators in that jurisdiction who passed inspection using the system. Vendors who assemble and publish that evidence win against technically stronger competitors roughly 3.2 times more often. The work is documentation and reference management rather than engineering, and it is jurisdiction specific, which means it must be repeated in every market a vendor wants to serve. References do not transfer across borders, so the exercise repeats in every market.
Market Impact: Wins 3.2 times more competitive vendor selections overall

Forecast Currency Demand By Branch And Denomination

Around 18% of inventory sits beyond expected demand, tying up working capital and generating transfers with real insurance and security cost that operators absorb without measuring. Vendors adding demand forecasting by branch, currency, and denomination report customers releasing 20% to 30% of idle holdings within a year. That saving frequently exceeds the entire software subscription, which converts a compliance purchase into an investment case and makes the renewal conversation considerably easier. Transfers carry insurance and security cost that operators absorb without measuring. Rate movement on unwanted stock adds more. Renewal becomes straightforward.
Market Impact: Releases 20% to 30% of idle currency holdings

Target Consolidating Groups Not Independent Branches

Compliance cost per branch is driving independent operators out of the market and into acquisition by larger groups, and those groups average 34 branches with reporting requirements that single-site systems cannot meet. Vendors selling to acquirers convert 2.8 times more contract value per sales cycle than those pursuing independents, because every acquisition triggers another system migration. The acquirer's compliance officer makes the decision once and applies it across every branch bought afterwards. One decision then applies across every branch the acquirer buys afterwards, which compounds the value considerably. Independents are not worth pursuing.
Market Impact: Converts 2.8 times more contract value per cycle

Connect Collection Orders Into Inventory Planning

Roughly 23% of transactions now arrive as online orders with a known currency, amount, and collection time, which is precisely the information a branch needs to hold the right notes. Most systems treat ordering and inventory as separate modules and waste it entirely. Vendors linking the two report collection fulfilment failures falling by more than half, and fulfilment failure is the single complaint that loses an operator a customer permanently, since the traveller is leaving the country regardless. The traveller is leaving the country regardless, so a failed collection is a customer lost permanently.
Market Impact: Halves collection failures across 23% of all orders

Who Controls the Margin Pool

This is a fragmented field by financial software standards. Five vendors hold 39% of contracted spend, measured consistently on that basis across all participants, and beneath them sit dozens of local suppliers serving single jurisdictions with systems built around one supervisor's reporting format. The gap between the leader and the fifth is narrow, and no participant holds a position that resembles dominance in more than a few markets. Local reporting formats fragment the field considerably.
Competition currently turns on three things: evidenced acceptance by the relevant national supervisor, ability to serve multi-branch groups formed through consolidation, and online ordering capability that smaller operators cannot build. Transaction handling functionality differentiates very little, since every credible system does it adequately and has for years. Every credible system has handled transactions adequately for years.

Pressure comes from two directions. Compliance specialists are entering from the wider financial crime software market with screening depth bureau vendors cannot match. Meanwhile banking platform providers are reaching consolidating groups that have outgrown specialist systems. Rankings will shift toward vendors holding supervisory evidence across several jurisdictions, which is the only asset that travels. Supervisory evidence is the only asset that travels between markets.
currency-exchange-bureau-software-market-company-positioning-matrix-1790007893044

Competitive Moat and Risk Dimensions

FEXCO

Moat: Operator Heritage And Supervisory Evidence

Running currency exchange operations directly as well as supplying software produces an understanding of branch economics and inspection reality that pure software vendors rarely match. That heritage also generates supervisory references across several jurisdictions, which is the evidence buyers facing an inspection finding actually want to see before committing.
FEXCO

Risk: Competing With Own Customers

Supplying software to operators while competing against some of them in the same markets creates a conflict that larger prospects raise during evaluation and occasionally act on. Independent vendors use it directly, and the objection is difficult to answer without either exiting operations or accepting a narrower addressable customer base.
TEMENOS

Moat: Institutional Platform Depth

Banking platform capability suits Gulf exchange houses and consolidating groups whose scale, remittance activity, and supervisory treatment increasingly resemble a mid-sized bank rather than a retail bureau. Those customers carry contract values several times the market median and require integration depth that specialist bureau systems were never built to provide.
TEMENOS

Risk: Cost Structure Against Specialists

Most licensed operators are small, run modest branch counts, and buy at price points a banking platform cost structure cannot serve profitably. That leaves the great majority of the customer population addressable only by specialists and local suppliers, confining the company to the upper end of a market that is itself not large.

Players Tracked

Prominent Players

Fexco
Currency Exchange International
Temenos
ACI Worldwide
Oracle Financial Services

Other Key Players

Finastra
Infosys Finacle
Tata Consultancy Services
Nucleus Software
Newgen Software
ComplyAdvantage
Napier AI
NICE Actimize
LexisNexis Risk Solutions
GBG
Fenergo
Comtrex
Global Reach
Ebury
Sopra Banking Software

Recent Developments

FEBRUARY 2026

Napier AI Signs Screening Supply Agreement With Gulf Exchange Group

Napier AI entered a supply agreement providing transaction monitoring and sanctions screening across a Gulf exchange group's branch network, replacing capability the group's existing bureau system could not evidence adequately during central bank inspection. Adverse media checking now runs across the whole branch network. Deployment completes shortly.
Signal: Financial crime specialists are entering bureau accounts on screening depth that incumbent systems simply cannot match.
SEPTEMBER 2025

Fexco Awarded Software Contract For Airport Bureau Network

Fexco was selected to supply transaction, rate, and compliance systems across an airport currency exchange network, with collection order fulfilment linked directly to branch inventory planning rather than handled as a separate module. Branch level currency forecasting forms part of the delivered scope. Concession terms run several years.
Signal: Linking online orders to inventory planning is becoming a specified requirement rather than an optional feature.
MAY 2025

GBG Acquires Transaction Monitoring Specialist For Money Services

GBG completed an acquisition of a transaction monitoring company focused on money services businesses, adding capability aimed at licensed operators whose supervisory obligations have risen faster than their existing systems were designed to handle. The acquired product already served licensed operators across several jurisdictions. Integration is already underway.
Signal: Compliance capability is being acquired because bureau vendors cannot build screening depth anywhere near quickly enough.

What Serving These Customers Costs

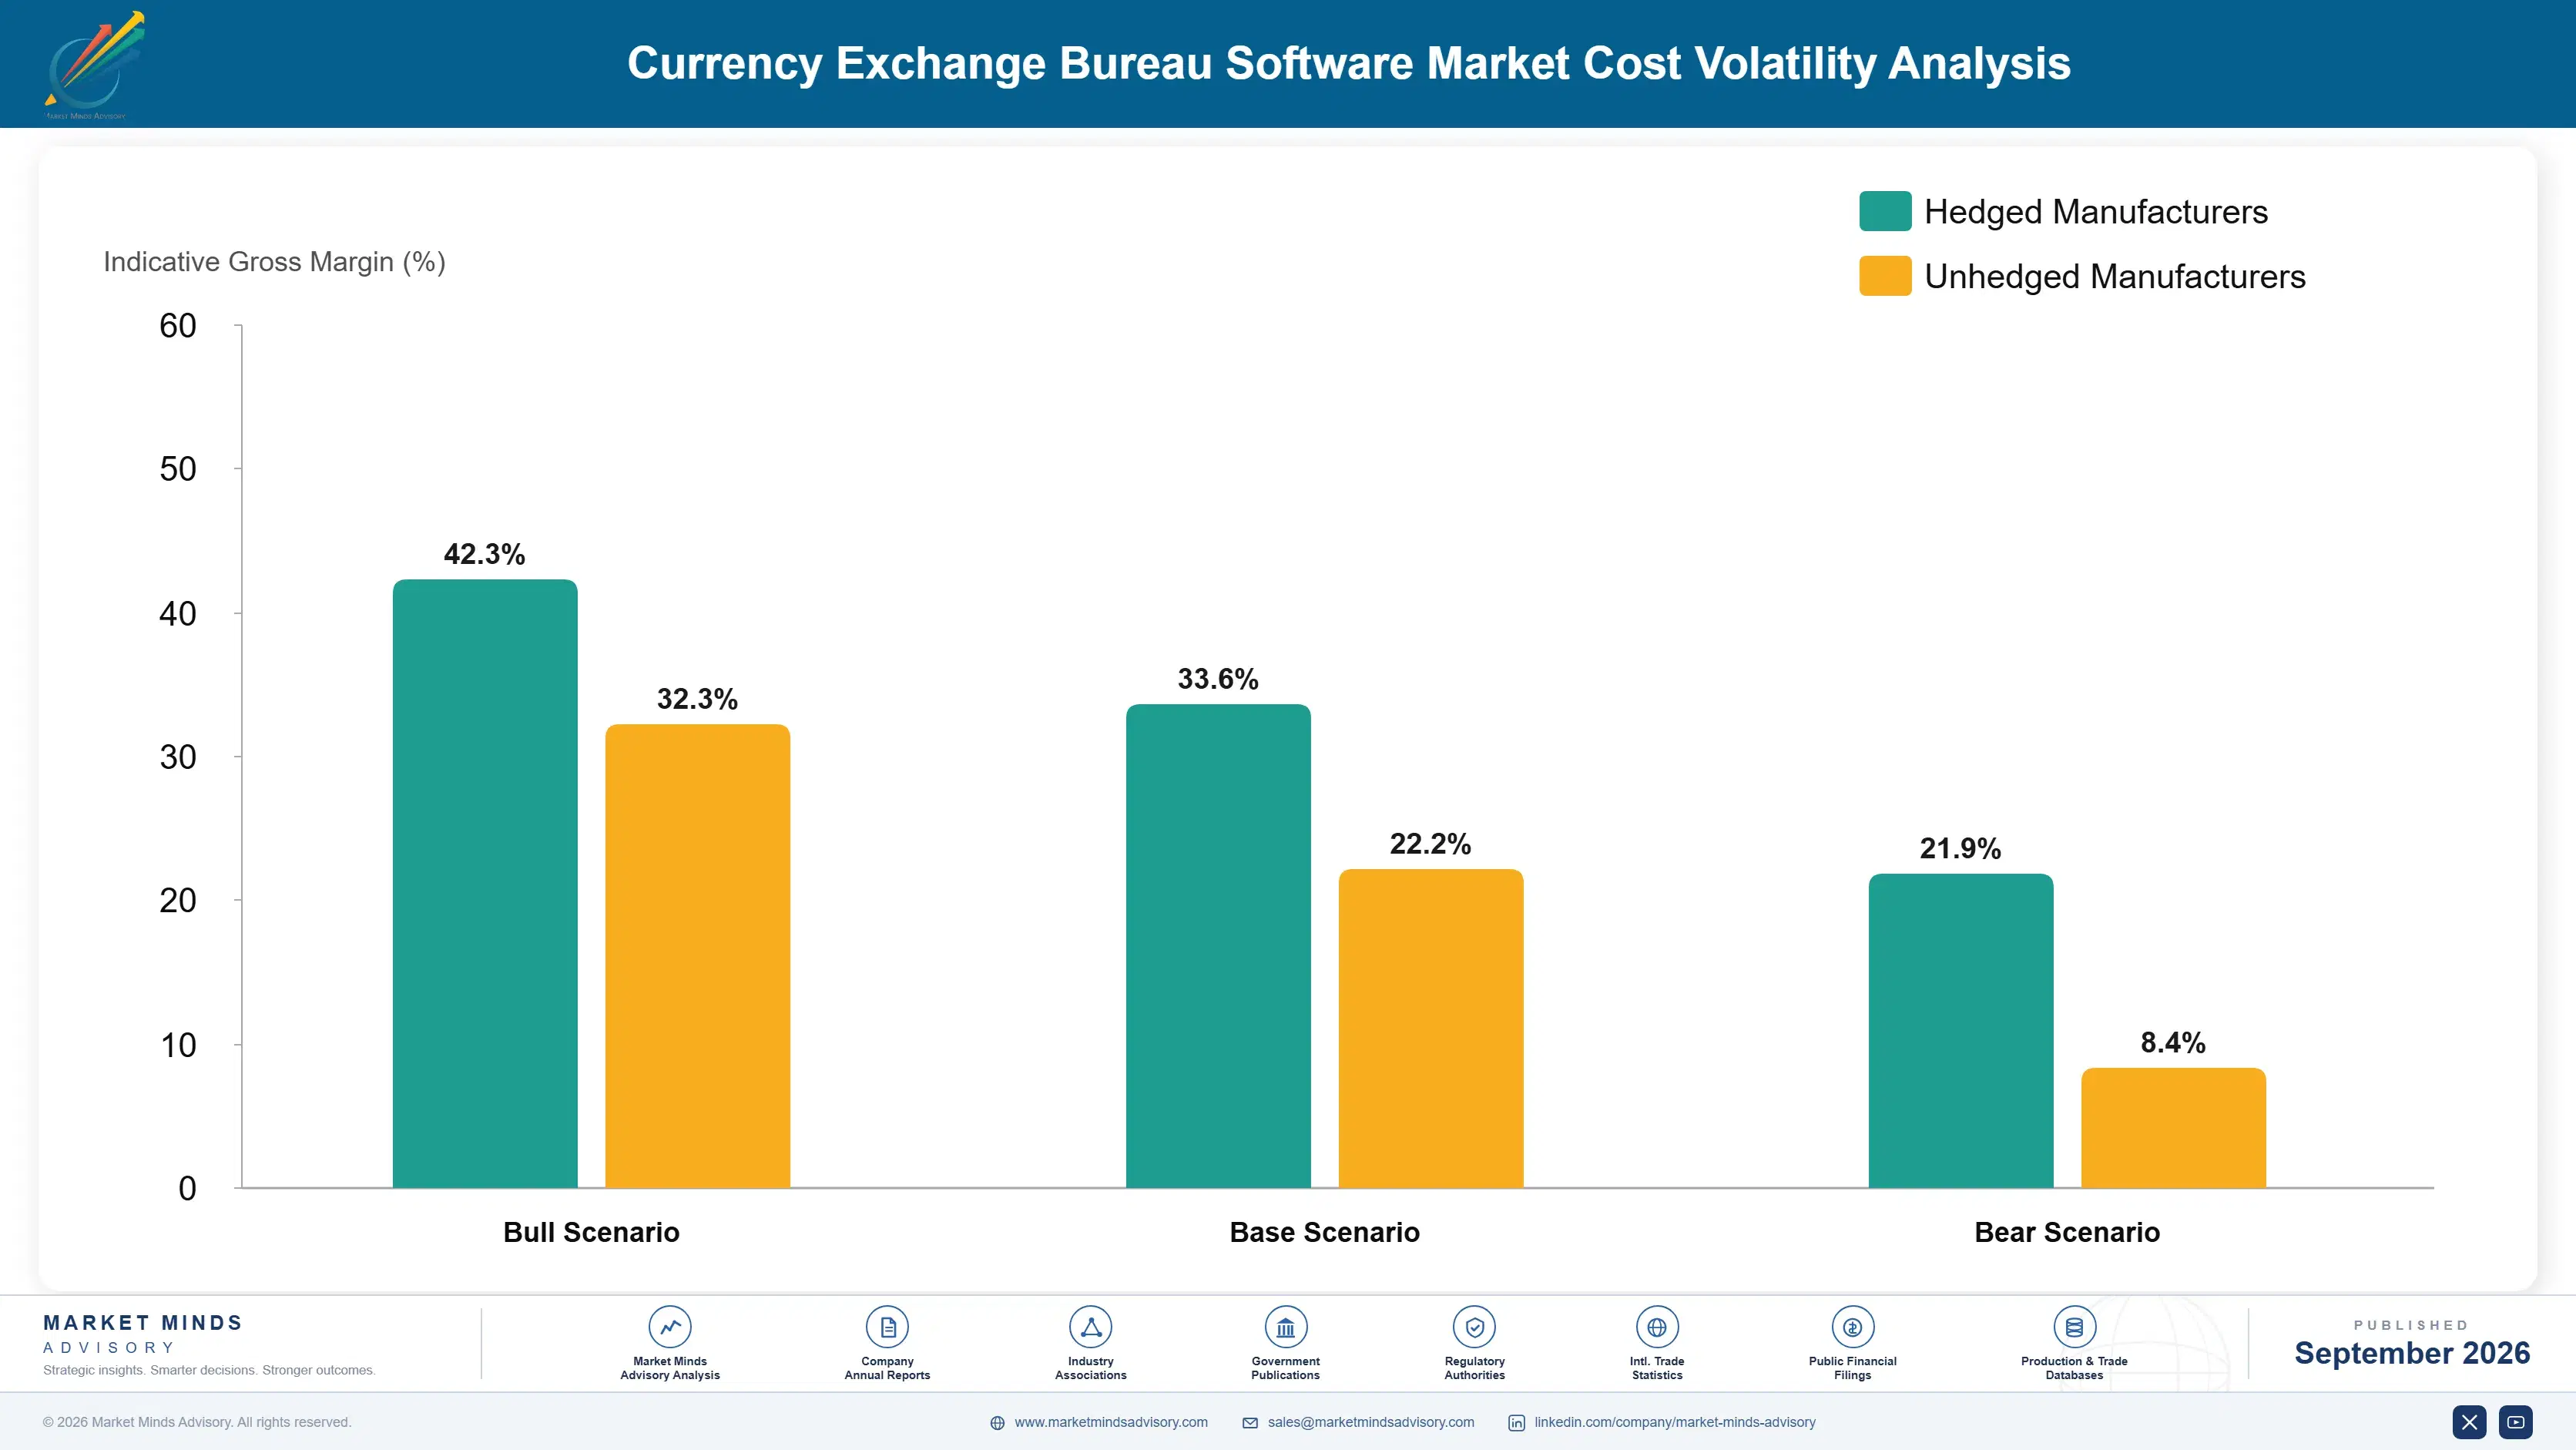
Three inputs dominate vendor cost. Software development and maintenance runs 30% to 38% of cost of goods sold, with a substantial share consumed by jurisdiction specific reporting formats. Sanctions, politically exposed person, and adverse media list licensing takes 20% to 27%. Implementation and ongoing support adds a further 22% to 29%, which is high because customers are small and rarely have any internal technical capability at all.
Screening list licensing costs rose materially through 2024 and 2025 as data providers repriced against expanding sanctions programmes, and several vendors described the resulting gross margin pressure in their annual reports for those years. Fixed-fee subscriptions signed before the movement absorbed it in full, and pass-through arrangements for list data have since become considerably more common across new contracts. Data providers hold considerable pricing power here.

The competitive disadvantage mechanism runs through jurisdiction coverage rather than through product. Every supervisor specifies its own reporting format, and a vendor serving eight markets maintains eight sets of reporting logic against customers who each use one. Exposure varies by vendor type. Local suppliers build once for one regime and price accordingly. Multi-market vendors carry the full maintenance burden and cannot always recover it in fragmented markets.
currency-exchange-bureau-software-market-cost-volatility-analysis-1790007893243

Pass Screening List Licensing Through At Cost

Sanctions and adverse media data is repriced by providers with considerable pricing power and no interest in vendor margin. Structuring subscriptions so list licensing passes through at cost removes an exposure nobody can forecast, and customers accept it readily because the underlying obligation is theirs rather than the vendor's. The underlying obligation belongs to the customer.

Build Reporting Logic As Configurable Templates

Each supervisor specifies its own return format, and hard coding them multiplies maintenance with every market entered. Template driven reporting lets a new jurisdiction be configured rather than developed, and vendors who invested report entering new markets at a fraction of the previous engineering cost and elapsed time. Market entry cost falls sharply. Configuration replaces development.

Deliver Implementation Through Certified Local Partners

Customers are small, technically unsupported, and geographically scattered, which makes direct implementation expensive per contract. Certified local partners handle deployment and first line support at cost levels vendors cannot match directly, while certification preserves enough quality control to protect supervisory references that took years to build. Supervisory references took years to build. Certification protects them.

Portfolio Architecture for Margin Defence

Margin follows how close the function sits to the licence. Transaction and till handling is close to commodity, since every credible system does it adequately and local suppliers price it very low. Rate and inventory management earn moderately. Compliance screening and supervisory reporting earn most, because the buyer is purchasing continued permission to operate and will not shop that decision on price. Nobody shops a licence decision on price.
The tension between volume and premium runs through customer size. The great majority of licensed operators are small, buy modest systems, and cost as much to implement and support as a large group does, which makes them unprofitable for any vendor with an institutional cost structure. Larger consolidating groups pay properly but are few, and every vendor is chasing the same ones. Every vendor is chasing the same few groups.

High-value pools concentrate where scale and supervision meet: Gulf exchange houses operating like mid-sized banks, consolidating European and Indian groups running dozens of branches, and Latin American operators under supervisory attention. These share a buyer for whom a failed inspection threatens the whole business. Where the operator runs two branches and files quarterly, the local supplier is sufficient.

Volume / Commodity-Adjacent

Transaction and till handling, basic rate display, and single-site operation. Every credible system does this adequately and local suppliers price it extremely low in most jurisdictions. The nine-point range reflects wide variation in implementation cost between direct and partner delivery models.
Gross Margin: 32% to 41%

Premium / Certified

Multi-branch consolidation, rate and margin control, and online ordering with collection. Consolidating groups need capability single-site systems cannot provide. The nine-point range separates vendors with configurable reporting templates from those maintaining hard coded logic per jurisdiction.
Gross Margin: 54% to 63%

Sustainability / Regulatory / Next-Generation

Compliance screening, supervisory reporting, and evidenced acceptance by named national authorities. The buyer is purchasing continued permission to operate rather than software capability. The eleven-point range reflects how differently vendors price regulatory certainty across jurisdictions with varying enforcement intensity.
Gross Margin: 64% to 75%
currency-exchange-bureau-software-market-portfolio-architecture-1790007893742

High-value Sub-segments and Strategic Watch-out

Supervisory Compliance And Screening

Highest value and fastest growth at 14.4%, absorbing 41% of software spend because the licence depends on it. Purchases are triggered by inspection findings rather than planning cycles. The ten-point range reflects differing enforcement intensity and therefore differing urgency across supervisory jurisdictions. Urgency suppresses price sensitivity.
Gross Margin: 66% to 76%

Institutional Gulf Exchange Houses

High value, with branch networks in the hundreds and supervisory treatment resembling mid-sized banks. Contract values run several times the global median. The ten-point range separates vendors with banking platform depth from bureau specialists reaching upward into requirements they were not designed for. Integration depth is required.
Gross Margin: 60% to 70%

Online Ordering And Collection

Growing at 12.7% and carrying roughly 23% of transactions, converting walk-in guesswork into committed orders with known currency requirements. Most systems waste that information entirely. Fulfilment failure is the complaint that loses a customer permanently, since travellers depart regardless. Ordering and inventory rarely connect. Integration is rare.
Gross Margin: 52% to 61%

Single-Site Independent Operators

The strategic watch-out. Small operators cost as much to implement and support as large groups while paying a fraction as much, and card substitution is driving them toward closure or acquisition. The twelve-point range reflects the gap between partner-delivered and directly implemented service models. Economics rarely work.
Gross Margin: 26% to 38%

Why These Contracts Persist

Renewal here rests on regulatory dependency rather than on satisfaction, which produces stability that is real but unflattering. Once a system holds the transaction records an inspector examines and generates the returns a supervisor expects, replacing it means rebuilding an evidence trail nobody wants to disturb. Operators complain about their software constantly and change it rarely, and the two facts are not in tension.
Commitment depth varies sharply by operator scale. Gulf exchange houses and consolidating groups embed deeply, because integration, reporting history, and supervisory familiarity all attach to the specific system in use. Small independents are far less committed, buying from whichever local supplier is cheapest and switching without much difficulty. Airport concession operators sit between the two, constrained more by concession terms than by technology.

The buyer profile has shifted decisively toward compliance. Branch operations managers once selected systems on transaction speed and ease of use, and they still express opinions. Compliance officers and, in larger groups, risk committees now make the decision, and they ask about supervisory acceptance, audit trails, and screening coverage. Vendors selling on till speed are addressing whoever will eventually complain rather than whoever signs.
currency-exchange-bureau-software-market-end-use-penetration-index-1790007894240

Where This Market Rewards

These are among the four positions where our research anticipates prominent divergence between winners and laggards over the coming forecast period. Each is grounded in the demand model, the regulatory perimeter, and the announced capacity pipeline.
01 / SUPERVISORY REFERENCE BUILDING

Buyers purchase permission, not software capability

Compliance absorbs 41% of what operators spend on software, and the purchase is usually triggered by an inspection finding rather than by any planning cycle, which makes the buyer urgent and comparatively insensitive to price. What persuades them is a list of operators in their own jurisdiction who passed inspection on the system. Vendors assembling that evidence win roughly 3.2 times more often than technically stronger competitors who cannot produce it, and the exercise must be repeated market by market.
02 / INVENTORY ECONOMICS ATTENTION

The largest controllable cost sits in the safe

Roughly 18% of currency inventory exceeds expected branch demand, tying up working capital and generating physical transfers whose insurance and security cost operators absorb without ever measuring it. Vendors adding demand forecasting by branch, currency, and denomination report customers releasing 20% to 30% of idle holdings within a year. That saving frequently exceeds the whole subscription, which turns a grudging compliance purchase into a defensible investment case, which is the easiest renewal conversation available in this category anybody has in this category.
03 / CONSOLIDATOR ACCOUNT TARGETING

Every acquisition triggers another system migration

Compliance cost per branch is pushing independent operators out of the market and into acquisition by groups now averaging 34 branches, whose consolidated reporting and screening requirements exceed anything single-site systems were built to handle. Vendors selling to acquirers convert 2.8 times more contract value per sales cycle than those pursuing independents. The acquirer's compliance officer decides once and applies that decision across every branch bought afterwards, which compounds the value of winning that single relationship over several years of acquisitions.
04 / ORDER INVENTORY INTEGRATION

Collection orders already contain the inventory answer

About 23% of transactions arrive as online orders carrying a known currency, amount, and collection time, which is exactly what a branch needs to hold the right notes on the right day. Most systems treat ordering and inventory as separate modules and discard that information entirely. Vendors linking the two halve collection fulfilment failures, and fulfilment failure loses a customer permanently because the traveller is leaving the country regardless, and no branch apology recovers them at any price or apology.

Engagement Snapshot From the Field

A live engagement with an industry participant carrying material or product regulatory and market exposure ahead of a defining policy shift, showing how our research translates into a defensible multi-year portfolio strategy.
MARKET MINDS ADVISORY · CLIENT ENGAGEMENT SUMMARY
Currency Exchange Bureau Software Producer Strategic Portfolio Review and Transition Roadmap 2026·Investment Scenario on Currency Exchange Bureau Software Exposure Evaluation 2025-26
CLIENT PROFILE
A regional currency exchange and remittance group operating 118 branches across three Gulf markets, with annual transaction value above USD 9 billion (client-reported, unverified by MMA). The group had grown through four acquisitions in six years and operated three separate bureau systems inherited from those transactions, with consolidated reporting assembled manually each quarter. No inventory analysis had ever been performed.
STRATEGIC CHALLENGE
A central bank inspection had raised findings on screening consistency across the three systems and on the time required to produce transaction level records. Separately, treasury had flagged that currency holdings across the network exceeded requirements substantially, though nobody could quantify by how much or in which branches. Treasury could not locate the excess holdings.
MMA APPROACH
MMA assessed screening coverage and reporting capability across the three inherited systems against the supervisor's documented expectations, measured currency holdings by branch and denomination against actual demand over eighteen months, and evaluated replacement vendors on supervisory references within the group's specific markets. Reporting production times were measured against the supervisor's documented expectation, and inventory was compared with observed branch demand.
KEY FINDINGS
  1. Screening coverage differed materially across the three systems, and only one applied adverse media checks at all, which was the finding the inspection had actually identified.
  2. Currency holdings exceeded measured demand by 24% across the network, concentrated in denominations that branch managers held from habit rather than from any observed requirement.
  3. Producing transaction level records for the inspection had taken eleven working days, against a supervisory expectation the group had understood to be five.
  4. Only two of six candidate vendors could name operators in these specific markets who had passed inspection using their system, which narrowed selection decisively.
CLIENT PROFILE
A regional currency exchange and remittance group operating 118 branches across three Gulf markets, with annual transaction value above USD 9 billion (client-reported, unverified by MMA). The group had grown through four acquisitions in six years and operated three separate bureau systems inherited from those transactions, with consolidated reporting assembled manually each quarter. No inventory analysis had ever been performed.
STRATEGIC CHALLENGE
A central bank inspection had raised findings on screening consistency across the three systems and on the time required to produce transaction level records. Separately, treasury had flagged that currency holdings across the network exceeded requirements substantially, though nobody could quantify by how much or in which branches. Treasury could not locate the excess holdings.
MMA APPROACH
MMA assessed screening coverage and reporting capability across the three inherited systems against the supervisor's documented expectations, measured currency holdings by branch and denomination against actual demand over eighteen months, and evaluated replacement vendors on supervisory references within the group's specific markets. Reporting production times were measured against the supervisor's documented expectation, and inventory was compared with observed branch demand.
KEY FINDINGS
  1. Screening coverage differed materially across the three systems, and only one applied adverse media checks at all, which was the finding the inspection had actually identified.
  2. Currency holdings exceeded measured demand by 24% across the network, concentrated in denominations that branch managers held from habit rather than from any observed requirement.
  3. Producing transaction level records for the inspection had taken eleven working days, against a supervisory expectation the group had understood to be five.
  4. Only two of six candidate vendors could name operators in these specific markets who had passed inspection using their system, which narrowed selection decisively.
RECOMMENDED STRATEGY
Phase 1: Phase one: consolidate onto a single system selected on supervisory references within these markets rather than on functional comparison across the wider candidate field. Phase 2: Phase two: implement demand forecasting by branch and denomination, releasing the excess holdings that treasury had identified but could not previously locate. Phase 3: Phase three: connect the online collection ordering channel directly into branch inventory planning, replacing the manual reconciliation currently performed daily.
OUTCOME
The follow-up inspection closed both findings, and transaction level record production fell from eleven working days to under two (client-reported, unverified by MMA). Currency holdings reduced 21% across the network, releasing working capital that exceeded the entire implementation cost. Collection fulfilment failures fell by roughly two thirds.

Frequently Asked Questions

Foundational context covering the market sizes, CAGR, scope, country, region and competition that inform every finding below. This section is provided to cover basics and most often pre-purchase conversations, answered from the MMA Primary Research Dataset.

What is the current size of the Currency Exchange Bureau Software Market?

The market was worth USD 0.4 billion in 2025 and remains near USD 0.4 billion in 2026. Value covers software contracted by licensed currency exchange and money changing operators.

How large will the Currency Exchange Bureau Software Market be by 2036?

MMA forecasts USD 1.0 billion by 2036, an increase of USD 0.6 billion across the forecast period. That represents 2.50 times the 2026 base of USD 0.4 billion.

What is the CAGR for the Currency Exchange Bureau Software Market 2026 to 2036?

The base case compound annual growth rate is 9.6%, with a bull case at 10.8% and a bear case at 8.4%. Historical growth from 2020 to 2025 ran at 8.3%.

Which segment is growing fastest?

Compliance screening and regulatory reporting grows at 14.4%, half again the market rate of 9.6%. It absorbs 41% of software spend because operating licences depend on it.

Who are the major companies in the Currency Exchange Bureau Software Market?

Fexco, Currency Exchange International, Temenos, ACI Worldwide, and Oracle Financial Services lead, holding 39% of contracted spend. Dozens of local suppliers serve single jurisdictions beneath them.

Which country is growing fastest?

The United Arab Emirates grows at 13.4%, on exchange houses running branch networks in the hundreds under frequent and thorough central bank inspection. Contract values run well above median.

Report Segmentation Architecture

The full report scope spans multiple orthogonal segmentation dimensions, with cross-tabulated demand data provided for each dimension pair. Coverage extends further to regional breakdowns, trend trajectories, and the competitive detail needed to support segment-level decision-making.

By Software Function

  • Transaction and Till Management
  • Rate Management and Margin Control
  • Compliance Screening and Regulatory Reporting
  • Cash and Vault Inventory Management
  • Online Ordering and Collection Platforms
  • Multi-Branch Consolidation and Analytics

By End-Use Industry

  • Independent Currency Exchange Bureaux
  • Gulf Exchange and Remittance Houses
  • Airport and Travel Retail Concessions
  • Bank Owned Exchange Subsidiaries
  • Hotel and Hospitality Exchange Desks
  • Cross-Border Trade and Commercial Exchange

By Commercial Dimension

  • Direct Vendor Subscription
  • Certified Implementation Partner Delivered
  • Bank Platform Bundled Module
  • Local Supplier Perpetual Licence
  • Managed Compliance Service
  • Concession Operator Group Contract

By Region

  • Middle East and Africa
  • Western Europe
  • South Asia and Pacific
  • East Asia
  • North America
  • Latin America
  • Eastern Europe

Scope, Methodology, and Coverage

Every figure in this report is reproducible from documented input assumptions. The scope below maps the historical period, the forecast horizon, the segmentation dimensions, and the countries covered, alongside the underlying primary and qualitative methodology.
Historical Period
2020 to 2025
Forecast Period
2026 to 2036
Base Year
2025 (USD billions; MMA Primary Research Dataset, September 2026)
Market Definition
This market covers software used by licensed currency exchange bureaux and money changing operators, including transaction and till management, rate management and margin control, compliance screening and regulatory reporting, cash and vault inventory management, online ordering and collection platforms, and multi-branch consolidation and analytics. It excludes cross-border payment and remittance processing platforms, retail banking core systems, wholesale foreign exchange trading software, and physical cash handling hardware.
Quantitative Units
USD billions, contracted software value
Segmentation Dimensions
Software function, end-use industry, commercial dimension, region
Regions Covered
Middle East and Africa, Western Europe, South Asia and Pacific, East Asia, North America, Latin America, Eastern Europe
Countries Covered
United Arab Emirates, Saudi Arabia, Qatar, Kuwait, Bahrain, Egypt, Kenya, South Africa, United Kingdom, Ireland, Germany, France, Spain, Italy, Switzerland, India, Singapore, Malaysia, Australia, Japan, South Korea, Taiwan, United States, Canada, Mexico, Brazil, Argentina, Poland, Turkey, Romania
Key Companies Profiled
Fexco, Currency Exchange International, Temenos, ACI Worldwide, Oracle Financial Services, Finastra, Infosys Finacle, Tata Consultancy Services, Nucleus Software, Newgen Software, ComplyAdvantage, Napier AI, NICE Actimize, LexisNexis Risk Solutions, GBG, Fenergo, Comtrex, Global Reach, Ebury, Sopra Banking Software
Quantitative Methodology
Primary survey, n=3,800 respondents, Q4 2025, six countries; demand-side model with trade association cross-validation
Qualitative Methodology
47 expert interviews, Q4 2025; applied to validate demand model assumptions, identify emerging dynamics, and assess competitive positioning
Report Format
PDF and XLSX data workbook (Word format preview document)
Publisher
Market Minds Advisory
Report Code
MMA-2026-TEC-541
Published
September 2026
Contact
sales@marketmindsadvisory.com | www.marketmindsadvisory.com

Purchase the full Currency Exchange Bureau Software Market Report (2026 to 2036).

The full report sizes the currency exchange bureau software market across six functions, seven regions, and thirty countries, with forecasts to 2036 under base, bull, and bear cases. It examines why supervisory obligation rather than efficiency drives every significant purchase, what the unmanaged cash inventory problem costs operators, and how consolidation is reshaping the customer population. Competitive analysis covers twenty participants evaluated consistently on contracted spend, with detailed treatment of jurisdiction specific reporting burden and financial crime specialist entry. Cost structure, margin architecture by function, and regional supervisory drivers are analysed in full. Primary research includes 3,800 survey responses and 47 expert interviews.
Six software functions sized and forecast separately
Twenty participants evaluated on contracted software spend
Regional supervisory and volume drivers across seven geographies
Margin architecture by function and operator scale
Cash inventory efficiency analysis with measured branch data
Supervisory reference and inspection outcome benchmarking

Built For The People Who Decide

From boardroom strategy to bench-side execution, this report is read cover-to-cover by leaders shaping the next decade of their industry, turning demand scenarios, market dynamics and valuation benchmarks into decisions.
CXOs/ Presidents/ VPs/ Managers
M&A and Corporate Development
Strategy Teams and R&D Heads
Procurement and Product Directors
Regulatory and Compliance Leaders
Investor Relations and Equity Analysts