Market Minds Advisory
Cup Fill and Seal Machine Market

Cup Fill and Seal Machine Market: Aseptic Growth, Material Change Retooling, and the Aftermarket That Pays the Bills

Machine builders sell a line once every eighteen years and survive on the aftermarket in between, which is why packaging material change matters far more to them than any dairy consumption forecast.

Lead Analyst

Bilal Shaikh

Published

September 2026

Make Smarter Decisions with Customized Research Insights

Request a free sample report and evaluate market opportunities, growth trends, and competitive dynamics relevant to your business needs.

2025 MARKET VALUE$3.2BMarket Size 2025
2036 FORECAST VALUE$5.8BBase Case , 2026 to 2036
CAGR 2026 TO 20365.6 %Bull 6.8% / Bear 4.4%
INCREMENTAL OPPORTUNITY$2.5BNet 10- year value creation
EXPANSION MULTIPLE1.72x2036 value over 2026 base
Strategic Levers
M&A Pipeline
Regional Outlook
Country Rankings
Competitive Intelligence
Segmental Deep-dive
Call-Us : 91 93563 13602

Executive Snapshot and Market Trajectory

A cup filling line lasts around eighteen years, which means a builder sells to the same customer roughly twice in a career. Everything commercially interesting therefore happens between those two sales, in parts, service, upgrades, and format retooling. Builders who understand that run very different businesses.
Commercial power sits with builders who own the aftermarket and the changeover tooling rather than with anyone able to assemble a filling turret. Aseptic systems grow fastest at 9.6%, roughly 1.71 times the market, pulled by ambient dairy and dessert products that need no cold chain. East Asia holds 28% of global value, carried by Chinese dairy capacity and by a domestic machine building industry that now exports.
Concentration is moderate at roughly 38% for the top five, and European builders hold the technically demanding end while Chinese competitors take standard rotary work. Packaging material change is the retooling driver: every move toward mono-material, paper-based, or aluminium-free lidding requires new sealing tools and temperature profiles. Changeovers average 42 minutes. Cutting that number matters more to a plant manager than any nominal filling rate. Regulation is what forces the retooling, not brand preference.
Market Definition
The market comprises machines that fill and heat-seal pre-formed or in-line thermoformed cups and tubs, covering linear inline fillers, rotary fillers, form-fill-seal integrated systems, aseptic cup fill and seal systems, and modular robotic cell systems. Value is measured at machine builder level including aftermarket parts and service. Pouch and sachet machines, bottle and can filling lines, cup and lidding materials, secondary packaging and palletising equipment, and standalone thermoformers fall outside scope.
Base Year Value
$3.2B in 2025 (MMA Primary Research Dataset, August 2026)
Forecast Period
2026 to 2036, eleven discrete annual values
CAGR
5.6% base case. Bull 6.8%. Bear 4.4%.
Fastest Growth Segment
Aseptic Cup Fill and Seal Systems: 9.6% CAGR
Fastest Growth Country
India: 8.6% CAGR
Fastest Growth Region
South Asia and Pacific: 7.8% CAGR
Largest Region
East Asia: 28% of 2025 global value
Market Leaders
Syntegon Technology, IMA Group, GEA Group, Trepko Group, and ILLIG Maschinenbau lead on cup fill and seal machine revenue. Source: company annual reports and MMA Analysis, July 2026.
Primary Survey
n=3,800 procurement and R&D decision-makers, Q4 2025, six countries
Methodology
Demand-side build-up, cross-validated against public data, 47 expert interviews

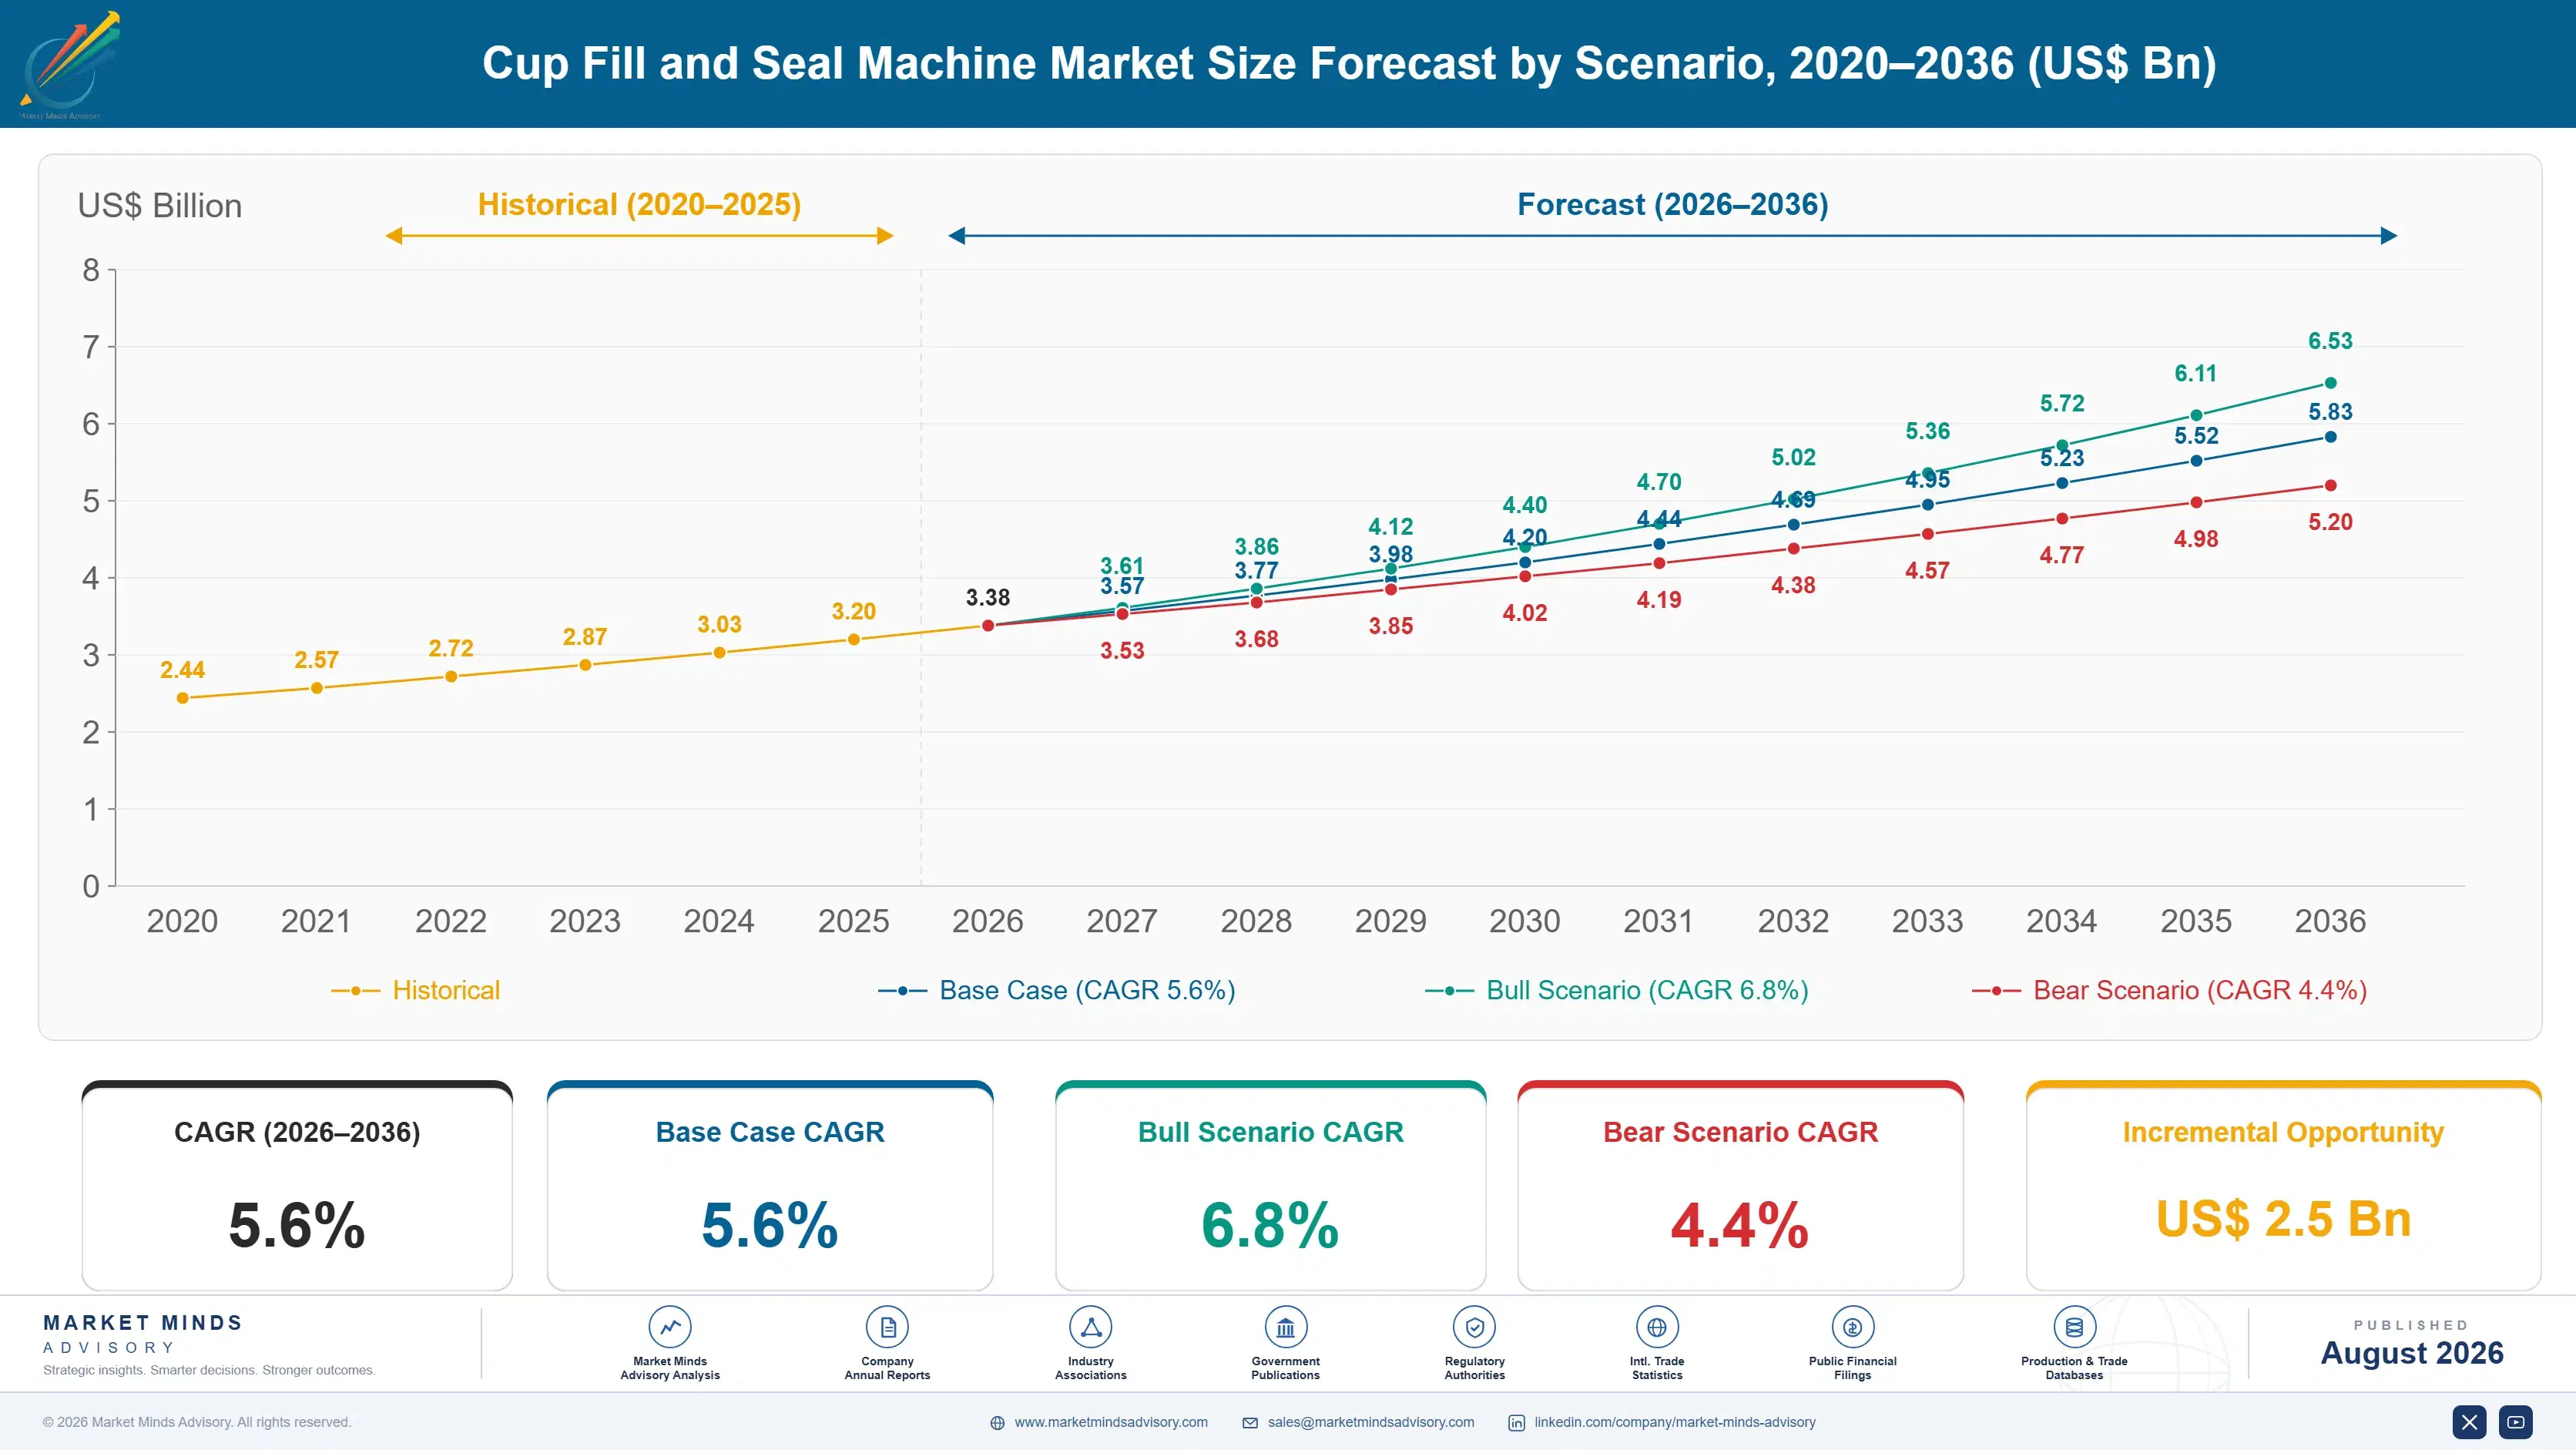
Cup Fill and Seal Machine Market Forecast Scenarios

cup-fill-and-seal-machine-market-size-forecast-scenario-1787549069470
Between 2020 and 2025 order patterns were unusually erratic. Food manufacturers deferred capital projects through the pandemic and then ordered heavily as retail demand recovered, while steel and electronic component costs rose enough to move machine prices sharply. Packaging material regulation began forcing retooling toward the end of the period. The 4.5% historical growth conceals a deferral and a catch-up rather than any settled trend.
The 5.6% base case rests on three mechanisms. Packaging material change forces retooling on a regulatory timetable, because mono-material cups, paper-based structures, and aluminium-free lidding all seal differently and existing tooling cannot handle them. Aseptic capacity keeps expanding across Asia and Latin America where cold chain remains expensive and ambient dairy sells well. And food plant labour scarcity pushes automation content per line steadily upward. Each raises order value per line rather than the number of lines sold.
The 6.8% bull case assumes packaging regulation tightens on schedule and aseptic adoption continues broadening beyond dairy into desserts and plant-based products. The 4.4% bear case reflects food manufacturers deferring capital during margin pressure, slower regulatory implementation, and Chinese builders compressing pricing on standard rotary configurations. Regulatory pace, not food demand, separates the two cases here.

Selling Once a Generation, Earning Every Year

Three things set the commercial shape of this market. Installed base ownership comes first, because a builder who holds the service contract sees every upgrade opportunity for eighteen years while competitors see none. Packaging material comes second, since the cup and the lid determine sealing temperature, tool geometry, and often whether existing equipment can run the format at all. Labour availability comes third and is pushing automation content upward everywhere.
TOP-FIVE CONCENTRATION38%Share of global machine shipments held by leading builders
AVERAGE MACHINE PRICEUSD 620,000Typical mid-range rotary line delivered and fully commissioned
AFTERMARKET REVENUE SHARE34%Portion of builder revenue from parts, service, and upgrades
MACHINE SERVICE LIFE18 yearsTypical operating life before a filling line is replaced
STEEL COST SHARE27%Stainless steel input within total machine manufacturing cost
AVERAGE CHANGEOVER TIME42 minutesTime to switch between cup formats on a line
The aftermarket point is underappreciated outside the industry. Parts, service, and upgrades supply 34% of builder revenue at margins well above new equipment, and the relationship is close to unassailable while the machine runs. Builders who sell through agents without service coverage hand that annuity to somebody else entirely. Building direct coverage costs technicians and parts inventory rather than manufacturing capital.
Material change is the disruption nobody planned for. Regulation pushing away from multilayer plastics and aluminium lidding toward mono-material and paper-based structures sounds like a converter problem, and it lands squarely on the machine. Paper seals at different temperatures, mono-material polypropylene warps differently, and tooling designed for aluminium foil simply does not work. Every reformulation becomes a retooling order.
"Ask a dairy plant manager what keeps them awake and they will not say filling speed. They will say the eleven minutes they lose on every format change and the fact that the new recyclable lid seals about as reliably as wet paper. Solve either problem properly and you can charge whatever you like."
Practice Director, Packaging Machinery and Food Processing Equipment · MMA Packaging Machinery Practice · August 2026

Market Trends

Packaging Material Change Forces Retooling Across Installed Lines

Mono-material polypropylene cups, paper-based structures, and aluminium-free lidding all seal at different temperatures and pressures than the multilayer formats they replace, and tooling designed for foil frequently cannot produce a reliable seal at all. European packaging regulation is driving the change on a published timetable rather than leaving it to brand preference. For builders this converts an eighteen-year replacement cycle into a stream of retooling and upgrade orders arriving far sooner. Builders holding the service relationship capture that work almost automatically, and those without it watch competitors retool their machines.
Market Impact: Changeover averages 42 minutes
Aseptic Filling Expands Where Cold Chain Stays Expensive

Ambient dairy, desserts, and plant-based products in sealed cups need no refrigerated distribution, which matters enormously in markets where cold chain is unreliable or costly to build. Aseptic cup systems grow at 9.6%, well ahead of the market, and adoption has spread from dairy into desserts, baby food, and plant-based categories. The machines cost considerably more, run slower, and demand sterile room discipline that many plants lack. That difficulty is precisely what protects the margins, since only a handful of builders can deliver validated aseptic performance reliably. Only a handful of builders qualify at all.
Market Impact: Raises order value above 25%

Market Opportunities and Growth Drivers

Product Range Proliferation Makes Changeover Time Commercially Decisive

Retail assortments have expanded relentlessly, and a dairy plant that once ran three cup formats now runs a dozen with shorter batches between each. Changeover averages 42 minutes, and every minute is lost production on an asset running close to capacity. Modular tooling, servo-driven format adjustment, and robotic handling cells all attack that number, and builders quoting a demonstrably faster changeover win specifications on that basis alone. This is now the single metric plant managers scrutinise hardest, ahead of nominal filling speed which rarely limits real output. Nominal speed rarely limits real output anyway.
Market Impact: Cycles run 18 years or longer

Food Plant Labour Scarcity Raises Automation Content Per Line

Recruiting and retaining production staff has become genuinely difficult across European, North American, and increasingly Asian food manufacturing, and wage inflation has outpaced general industrial pay in several markets. Automated cup denesting, lid placement, tray loading, and end-of-line handling all remove positions that plants struggle to fill anyway. Builders responding with integrated automation rather than bare filling machines raise the value of each order substantially. The purchasing argument has shifted from payback on labour cost toward simply being able to run the line at all. Plants are buying the ability to operate rather than a payback calculation.
Market Impact: Standard line prices down 18%

Market Restraints and Challenges

Eighteen Year Replacement Cycles Make New Machine Demand Lumpy

A well-maintained filling line runs for eighteen years or more, which means new machine demand in any given year depends on installation waves from nearly two decades earlier. The root cause is engineering quality: stainless steel machinery in a food plant genuinely lasts, and food manufacturers have every incentive to run assets until they cannot. That produces order books that swing violently with capital cycles. Builders mitigate through aftermarket revenue, upgrade and retrofit programmes, and service contracts that smooth income between equipment sales considerably. Retrofit programmes have become the practical answer.
Market Impact: Retooling arrives before 18 years

Chinese Builders Compress Pricing on Standard Configurations

Standard rotary cup fillers for non-aseptic dairy and dessert applications are well-understood machines, and Chinese builders now produce them competently at prices European competitors cannot approach. The root cause is that the technology matured: what was once precision engineering is now a solved problem with available components. Price erosion is real at the standard end and has not reached aseptic or high-speed applications. Builders mitigate by moving upward into aseptic, automation integration, and service, and by conceding the standard segment rather than defending it unprofitably. Retreating upmarket is the standard response now.
Market Impact: Aseptic systems grow at 9.6%
4 additional market trends, 3 additional growth drivers, and 2 additional restraints and challenges are covered in the full report. Contact sales@marketmindsadvisory.com to access the complete intelligence.

Segment CAGR and Growth Architecture

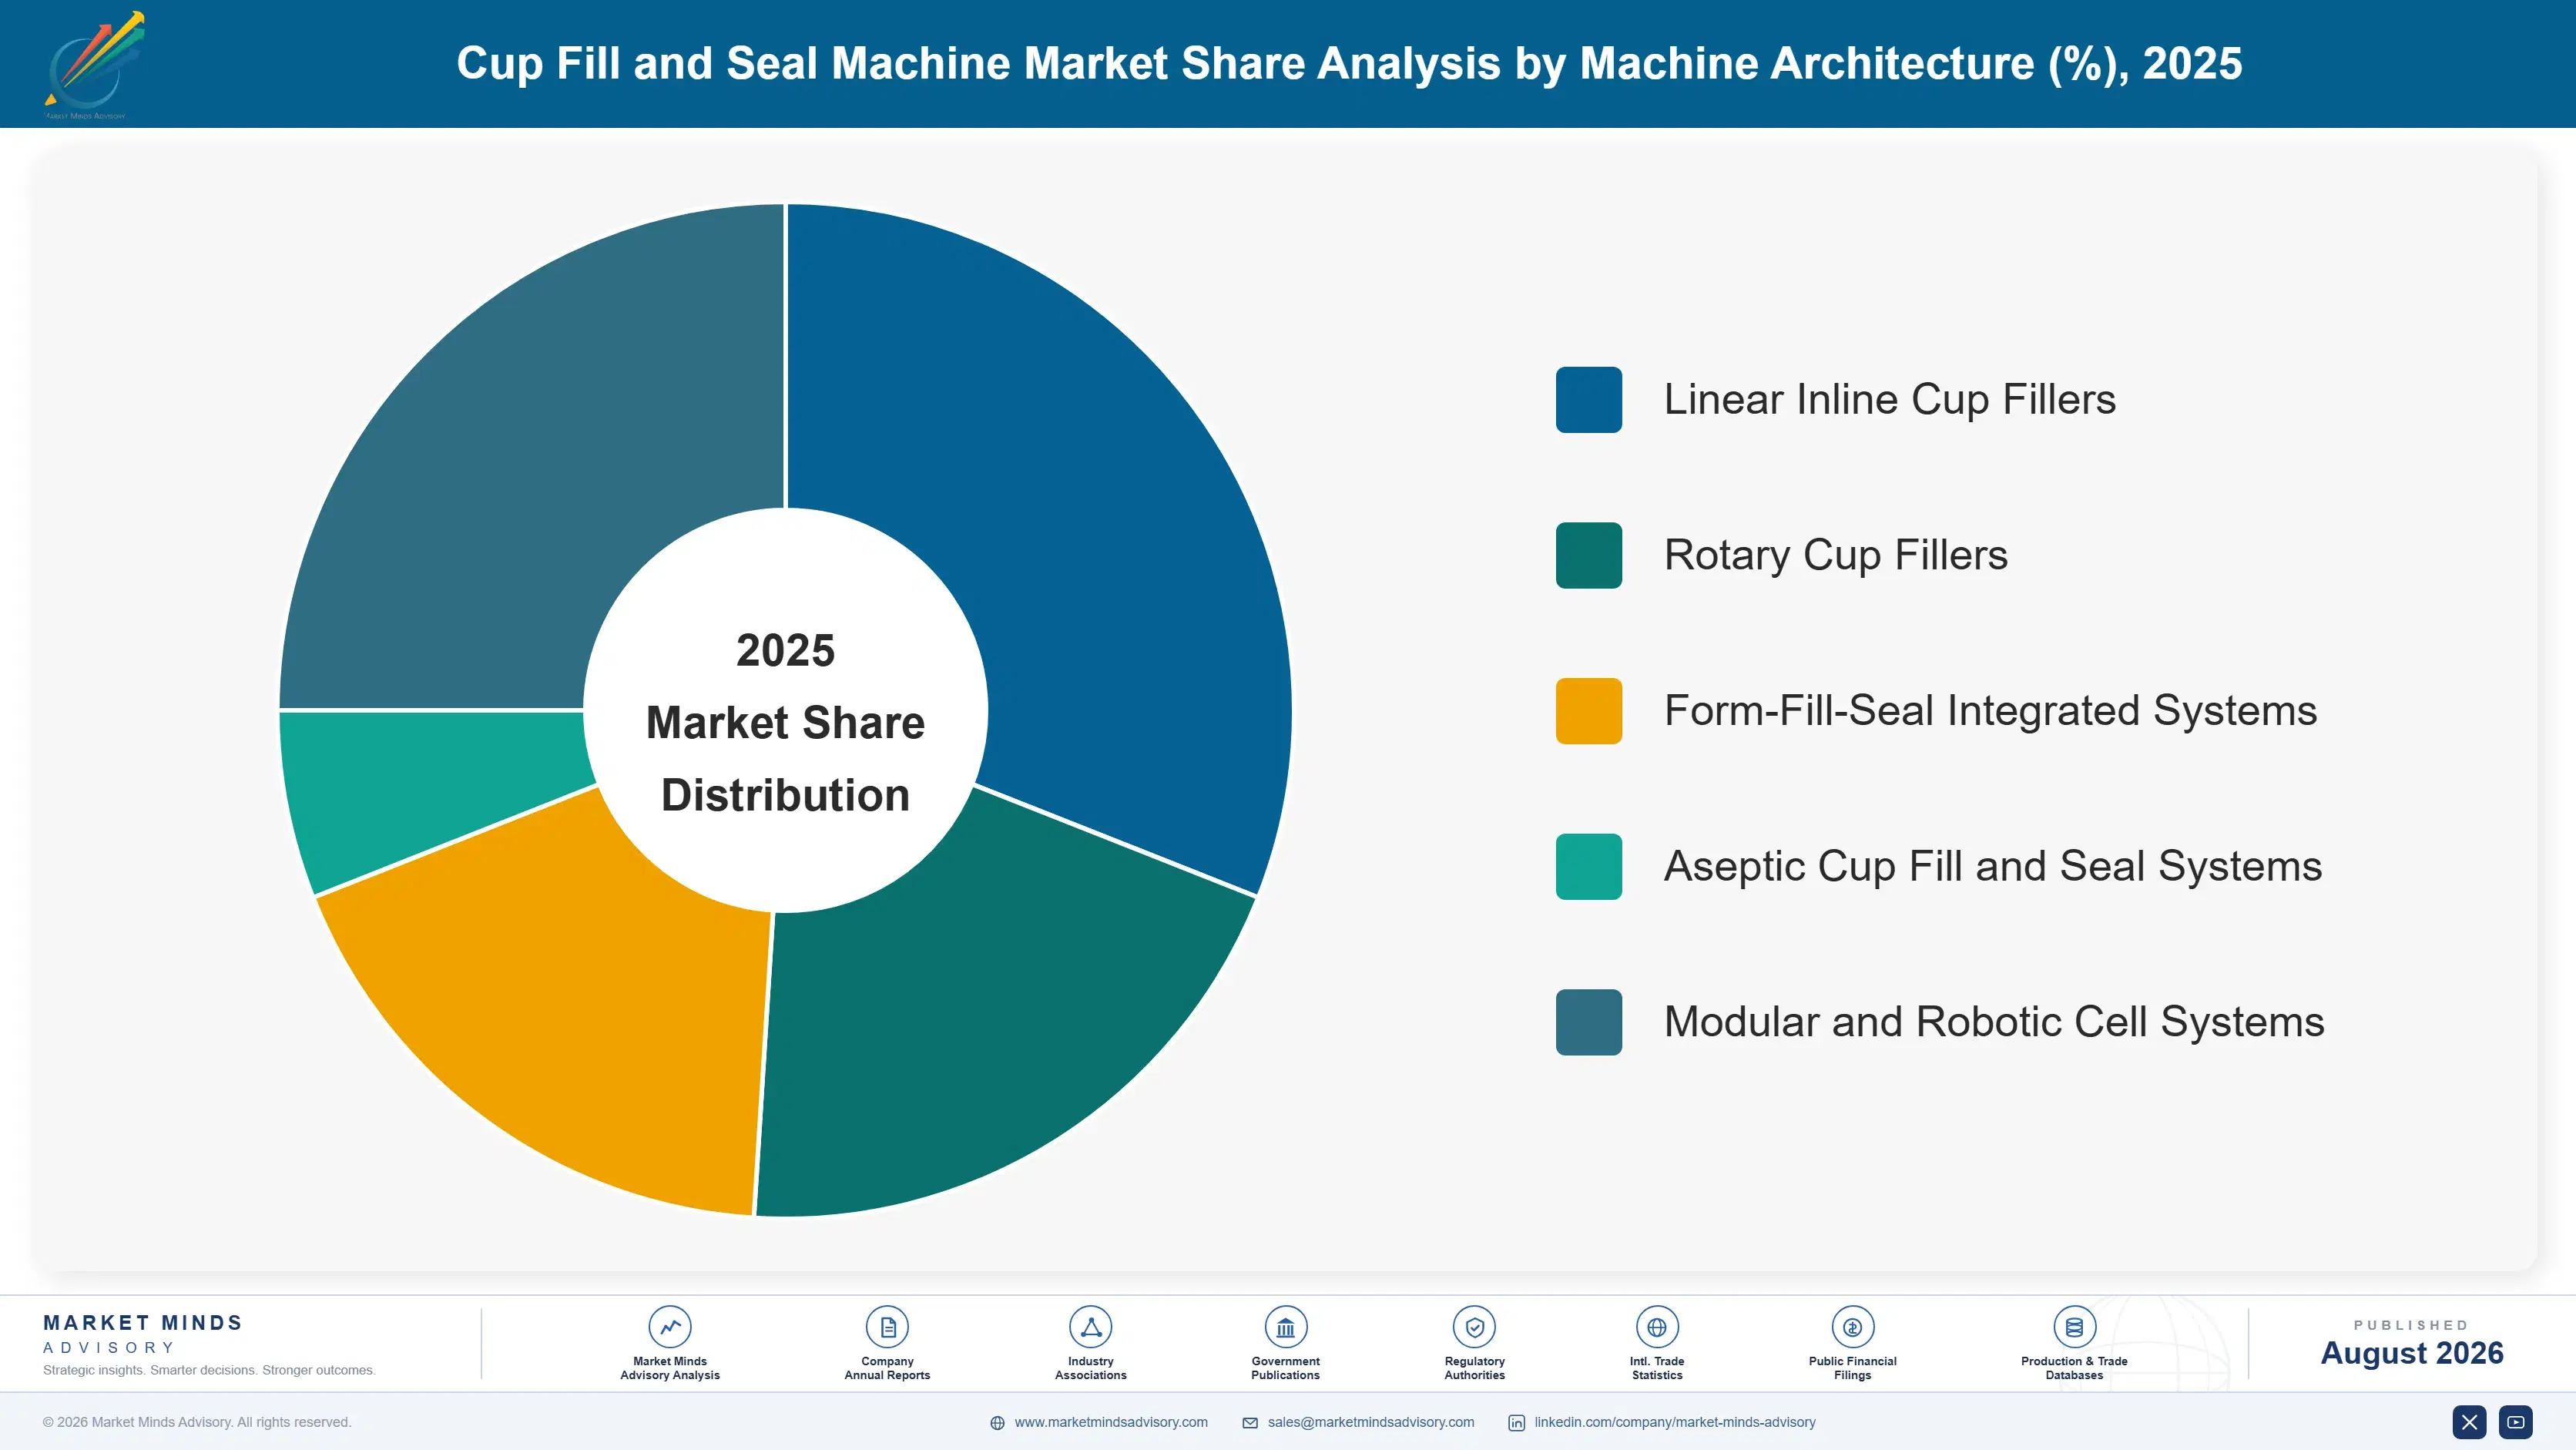
Segmentation follows machine architecture, because the configuration determines achievable speed, hygiene class, format flexibility, footprint, and capital cost. Five architectures cover commercial supply, and they compete only at the boundaries, since a plant needing aseptic performance or extreme format flexibility has no realistic alternative to the configuration built for it. Capital cost varies by a factor of three across them.
cup-fill-and-seal-machine-market-market-share-analysis-1787549070005

Aseptic Cup Fill and Seal Systems

The fastest-growing architecture at 9.6%, roughly 1.71 times the market, and the most technically demanding to deliver. Sterilising cups and lidding, holding a sterile filling zone, and validating the whole process to a shelf-stable standard requires engineering that most builders cannot supply credibly. The payoff for the food manufacturer is ambient distribution, which removes refrigerated logistics cost entirely and opens retail channels that chilled products cannot reach. Adoption has spread from dairy into desserts, baby food, and plant-based categories. Machines cost two to three times a chilled equivalent and run more slowly, and validation support after installation is a substantial ongoing service relationship. Validation support after installation is a substantial ongoing relationship in its own right.
CAGR 9.6%

Modular and Robotic Cell Systems

Second fastest at 8.4%, and the answer to format proliferation rather than to volume. Instead of a fixed turret sized for one cup geometry, robotic cells handle denesting, filling, and sealing with tooling that changes in minutes and software that reconfigures without mechanical adjustment. Changeover falls well below the 42-minute average, which matters more than nominal speed in plants running a dozen formats. The trade-off is throughput: these systems rarely match a dedicated rotary line at full rate. They suit contract packers, premium dessert producers, and any plant where batch sizes have shrunk faster than the equipment was designed to accommodate. Contract packers and premium dessert producers are the natural buyers here.
CAGR 8.4%
Full segment breakdown across 5 segments available in the complete report.

Regional Architecture and Country Demand Map

Regional shares reflect dairy and chilled food manufacturing capacity alongside where machines are built. European builders hold the technically demanding end globally, while Asian capacity growth and domestic machine building together move the consumption balance eastward. Service coverage explains most of the competitive variation between them.

North America

Large-format dairy and dessert production dominates, with plant scale and line speeds among the highest anywhere and correspondingly high capital values per installation. Labour scarcity has been the most powerful purchasing argument in recent years, and automated denesting, lidding, and end-of-line handling now appear in specifications that would previously have quoted a bare filler. Cold chain infrastructure is good, which has slowed aseptic adoption relative to Asia. Packaging material regulation moves at state level rather than federally, producing a patchwork that delays the retooling wave visible in Europe. European builders hold most of the high-speed positions through local service organisations. Growth of 5.4% reflects replacement and automation upgrade rather than capacity expansion.
Share: 23% | CAGR: 5.4% (2026 to 2036)

Western Europe

Both the largest concentration of machine building expertise and a mature, slow-growing consumption market, which makes this region strategically important and commercially unexciting at the same time. German, Italian, and Danish builders including Syntegon, IMA, ILLIG, and Trepko supply the technically demanding end worldwide from here. Packaging regulation is the most advanced anywhere and is driving genuine retooling demand as mono-material and paper-based cups displace multilayer formats. Dairy consumption is flat and plant consolidation continues, so new capacity is rare. Energy and labour costs weigh on manufacturing competitiveness against Asian builders. Growth of 4.0% is the slowest in the report and comes almost entirely from retooling and upgrades rather than new lines.
Share: 24% | CAGR: 4.0% (2026 to 2036)
Regional intelligence for 5 additional markets available in the complete report: East Asia, South Asia and Pacific, Latin America, Middle East and Africa, Eastern Europe. Contact sales@marketmindsadvisory.com.
cup-fill-and-seal-machine-market-country-cagr-analysis-1787549070527

Four Moves That Change the Economics

Advantage here comes from installed base ownership, changeover performance, and aseptic capability rather than from filling accuracy, which every credible builder achieves. Four moves are worth capital and management attention across the forecast period, and two of them convert a lumpy equipment business into something closer to recurring revenue. The other two attack problems that plant managers already care about.

Own the service contract on every machine sold

A builder holding the service relationship sees every upgrade, retooling, and replacement opportunity across an eighteen-year life, while one selling through agents sees none of them. Aftermarket already supplies 34% of industry revenue at margins 15 to 25 percentage points above new equipment. Building direct service coverage costs technicians, spare parts inventory, and regional presence rather than manufacturing capital. The material change retooling wave makes this urgent rather than merely desirable, because whoever holds the service contract will capture that work almost automatically. The retooling wave makes it urgent rather than merely sensible.
Market Impact: Earns 15 to 25 points above equipment margin

Compete explicitly on machine changeover time

Plant managers running a dozen cup formats lose more output to the 42-minute average changeover than to any filling speed limitation, yet builders still quote nominal rates in their proposals. Modular tooling and servo format adjustment can cut changeover below fifteen minutes, which returns 4 to 7% of annual line capacity to a plant running short batches. Quoting that number, backed by a witnessed demonstration, wins specifications outright against competitors quoting cans per minute. It requires engineering investment in format tooling rather than in the filling turret itself. Format tooling engineering, not turret design, delivers it.
Market Impact: Returns 4 to 7% of annual line capacity

Build validated aseptic capability while the field stays narrow

Aseptic systems grow at 9.6% and command two to three times the price of chilled equivalents, and only a handful of builders can deliver validated sterile performance that a food manufacturer will accept. The difficulty is the barrier: sterile zone engineering, validation protocols, and post-installation support take years to develop credibly. Entering later, once ambient dairy has scaled across Asia and Latin America, means competing against builders with a decade of validated references. The investment is engineering and validation expertise rather than manufacturing capacity. Validated references are what customers actually check.
Market Impact: Commands 2 to 3 times chilled system pricing

Sell retooling ahead of the packaging regulation deadline

Mono-material and paper-based cups seal differently, and food manufacturers frequently discover that only when a brand team commits to a material change with a launch date attached. Builders who approach the installed base early with tested tooling for the new formats convert a compliance panic into a planned upgrade order worth 8 to 15% of original machine value. Arriving after the brand has committed means quoting against a deadline with no leverage. The work is technical selling into the existing base rather than any new product development. Timing decides whether it is a planned upgrade or a panic.
Market Impact: Worth 8 to 15% of original machine value

Who Controls the Margin Pool

Concentration is moderate: the top five hold roughly 38% of global cup fill and seal machine revenue, and technical positioning rather than scale separates them. Syntegon leads on breadth across dairy and pharmaceutical-grade filling with strong aseptic credentials. IMA competes through an acquired portfolio spanning several specialist builders, while GEA brings process and filling integration, Trepko holds deep dairy specialisation, and ILLIG anchors the thermoform-fill-seal end.
Competitive activity runs on three fronts. Aseptic capability is the first, because it is the fastest-growing segment and the field able to deliver it credibly is small. Service network density is the second, and it decides who captures the aftermarket that supplies a third of industry revenue. Changeover performance is the third, and it is increasingly what plant managers actually evaluate.

Pressure is building from two directions. Chinese builders competing competently on standard rotary configurations have compressed pricing at the volume end and are working upward. And packaging material change is opening retooling opportunities that any builder with tested tooling can pursue, including into competitors' installed bases. Retooling in particular lets any builder with tested tooling approach a competitor's installed base with a legitimate technical reason to be there.
cup-fill-and-seal-machine-market-company-positioning-matrix-1787549071053

Competitive Moat and Risk Dimensions

SYNTEGON TECHNOLOGY

Moat: Aseptic engineering and validation depth

Sterile filling expertise carried over from pharmaceutical equipment gives Syntegon validation capability that food-only builders struggle to match, and food manufacturers buying ambient shelf stability are buying that validation rather than the machine. The reference base of successfully validated installations compounds, because every food safety team asks who else runs the system.
SYNTEGON TECHNOLOGY

Risk: Cost base against Asian competition

German engineering and manufacturing costs sit well above Chinese equivalents on machines where the technology has matured, and the standard rotary segment has already moved on price. Defending share there is unprofitable, which forces continual retreat upmarket into segments that are smaller and where competitors are also concentrating their own investment.
IMA GROUP

Moat: Acquired specialist portfolio breadth

Assembling several specialist builders under one group gives IMA coverage across dairy, dessert, and food formats that no single-brand competitor matches, and it lets the group offer a plant almost any configuration without conceding the enquiry. Cross-selling service across the combined installed base multiplies the aftermarket opportunity considerably.
IMA GROUP

Risk: Integration across acquired brands

Multiple acquired brands carry separate engineering platforms, spare parts systems, and service organisations, and rationalising them without disrupting customer relationships is slow work. Customers notice inconsistent service response and parts availability during integration, and specialist competitors target precisely those accounts while the consolidation continues. Parts availability complaints surface first and damage the relationship fastest.

Players Tracked

Prominent Players

Syntegon Technology
IMA Group
GEA Group
Trepko Group
ILLIG Maschinenbau

Other Key Players

Waldner Holding
ERCA
Arcil
SEALPAC
MULTIVAC
Coesia
Tetra Pak
SIG Group
Serac Group
Hassia-Redatron
Nichrome Packaging Solutions
Sacmi
Marel
Jiangsu Newamstar Packaging Machinery
Ampack

Recent Developments

MARCH 2025

Syntegon extends aseptic cup platform capacity

Additional manufacturing and validation capacity for aseptic cup filling entered service, responding to ambient dairy demand across Asian and Latin American markets. Validation support after installation rather than machine delivery alone has become the constraint on how quickly these systems can be commissioned. Commissioning queues had lengthened.
Signal: Validation capacity, and not manufacturing capacity, is what now limits how fast aseptic systems reach production
JUNE 2025

Builder launches rapid changeover tooling system

A format tooling system aimed at cutting changeover below fifteen minutes was introduced for existing rotary platforms, sold as a retrofit to the installed base rather than only on new machines. Plants running a dozen cup formats were the stated target for the upgrade. Retrofit pricing was set deliberately low.
Signal: Retrofit selling into the installed base is becoming as commercially important as winning new machine orders
SEPTEMBER 2025

Dairy group retools lines for mono-material cups

A European dairy processor completed retooling across several filling lines to run mono-material polypropylene cups with paper-based lidding, replacing multilayer formats ahead of packaging regulation deadlines. Sealing parameters required substantial redevelopment before production quality was consistently acceptable. Several tooling iterations were required before the seal held reliably in production.
Signal: Material change is landing on the machine rather than the converter, and sealing reliability is the real problem

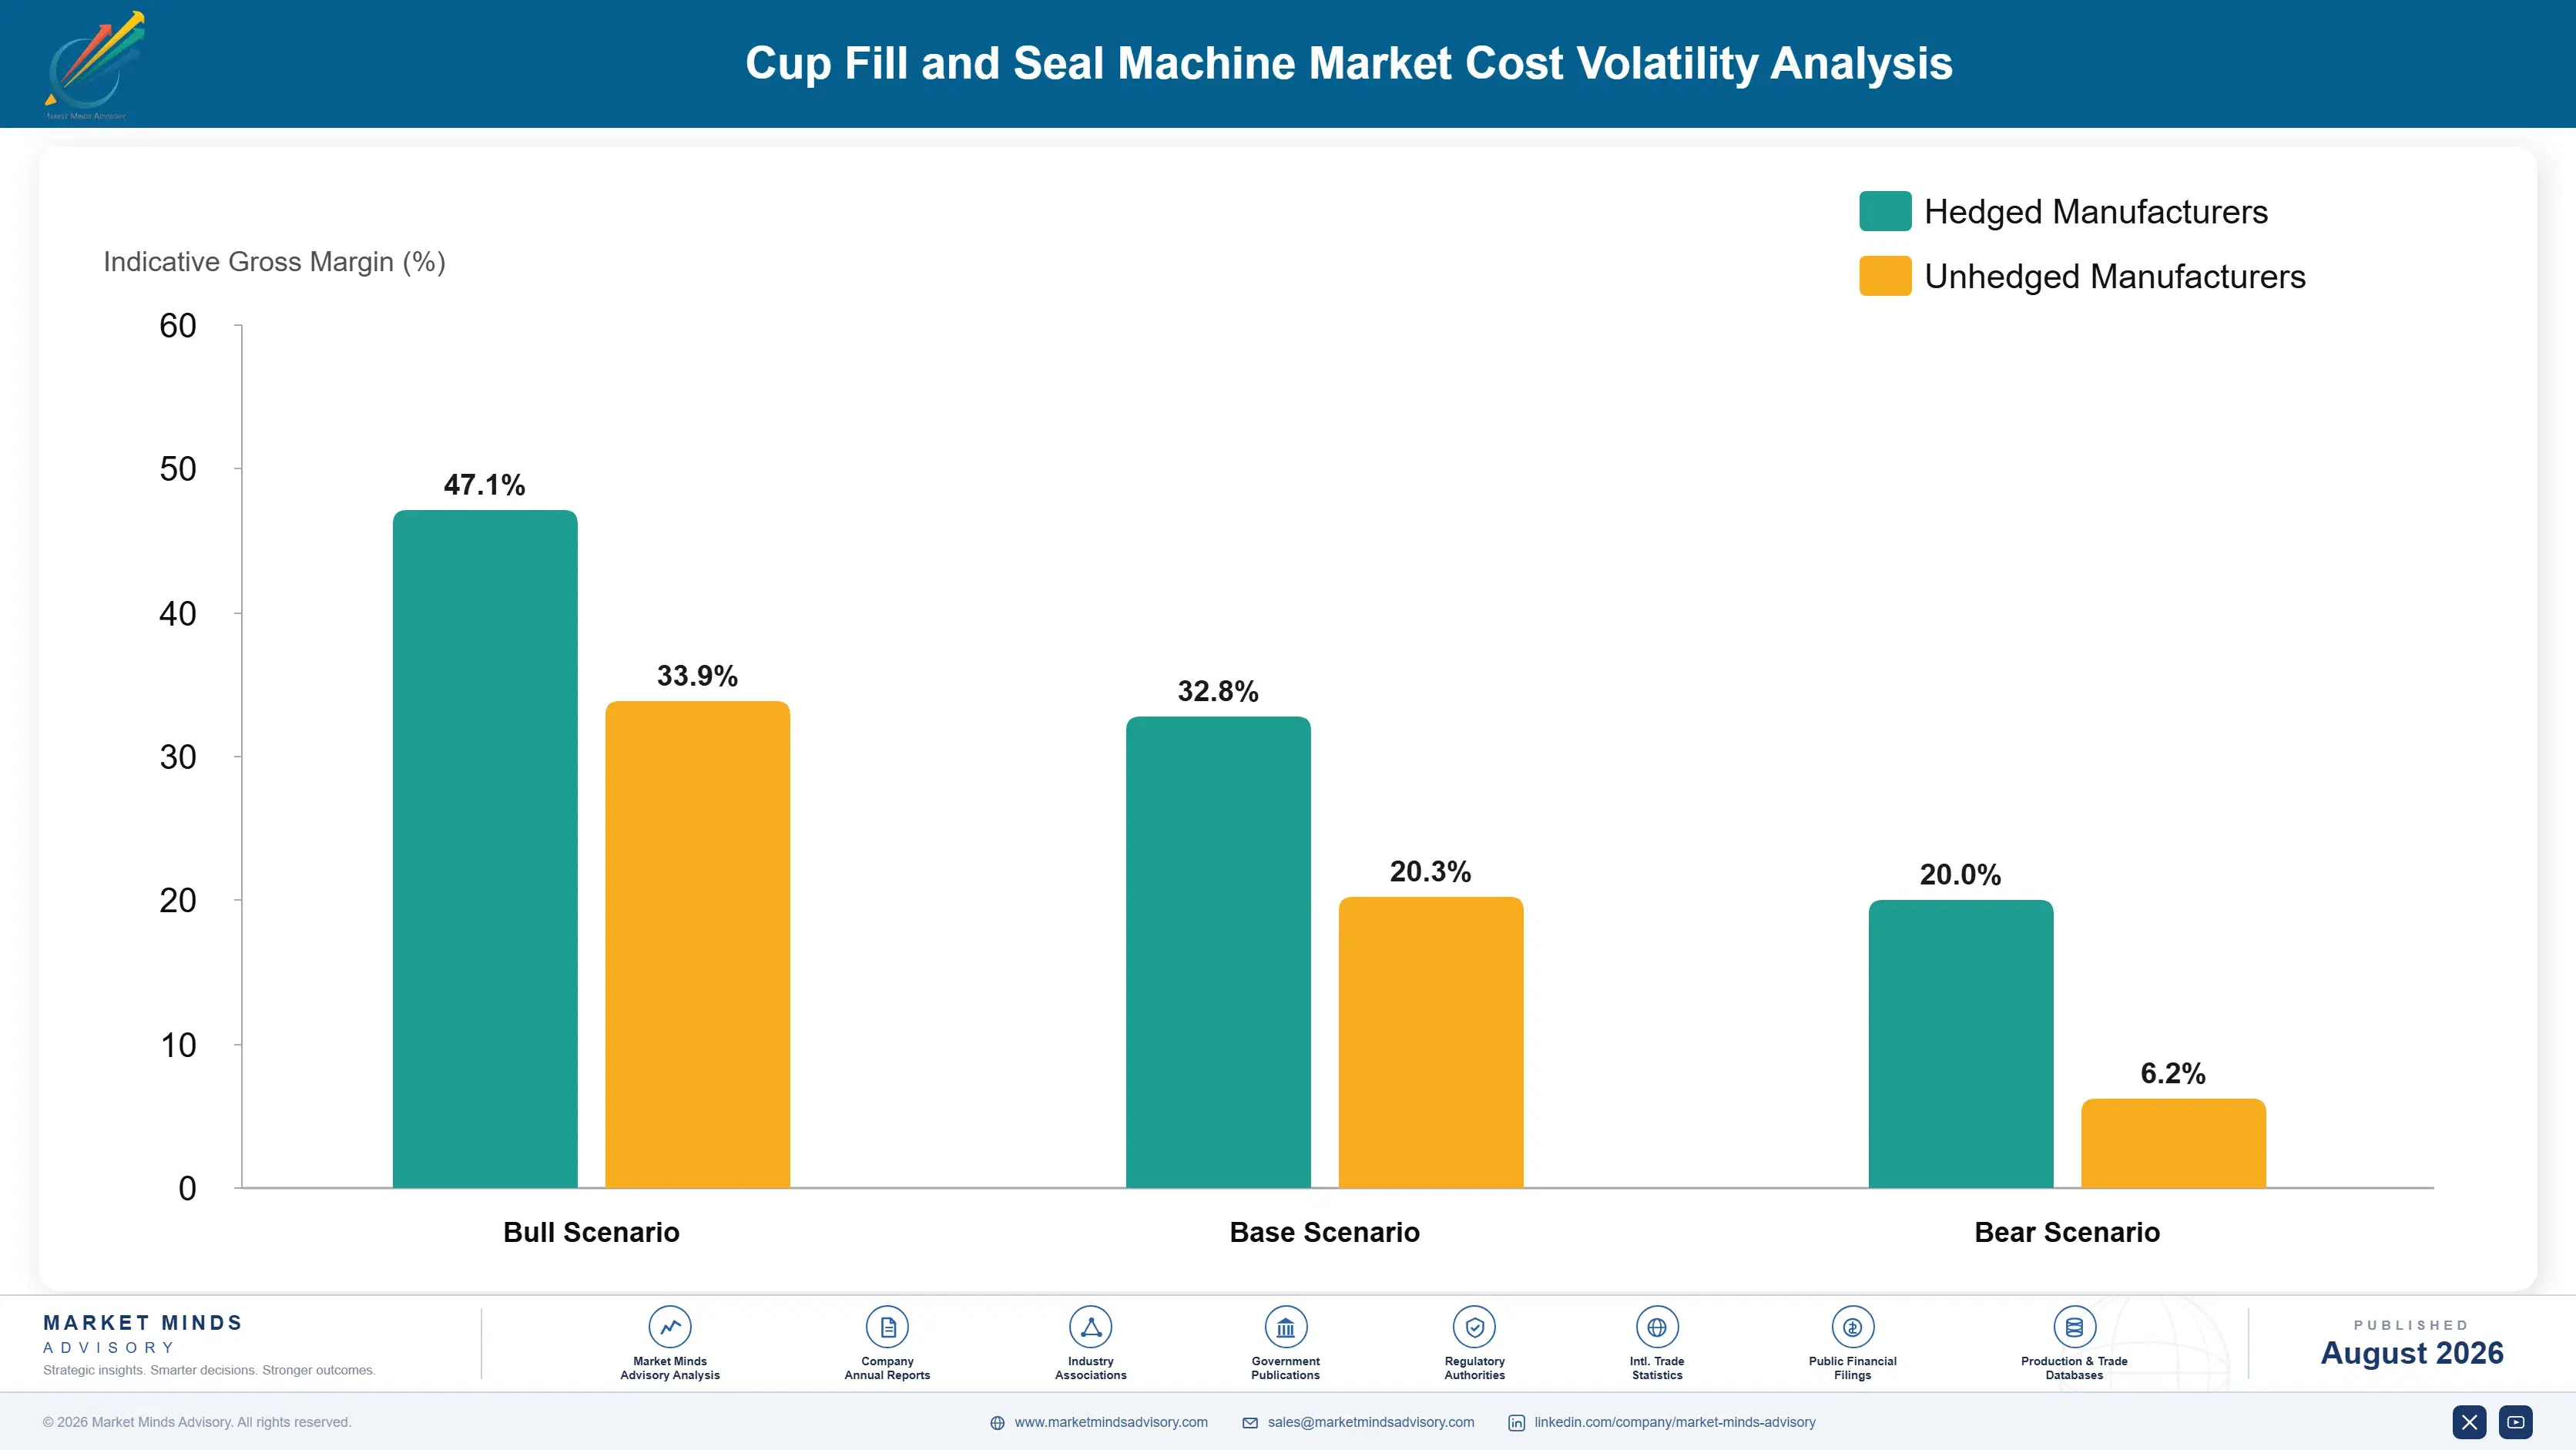
What Sets the Cost Base

Stainless steel accounts for roughly 27% of machine manufacturing cost, since food contact and washdown requirements rule out cheaper alternatives across most of the structure. Servo drives, controls, and electronics contribute a further 24%, a share that has risen steadily as automation content increased. Bought-in components including pumps, valves, and filling nozzles take 16%. Assembly, engineering, commissioning, and validation absorb the remainder.
The 2021 and 2022 period exposed the electronics dependency badly. Servo drive and controller lead times extended well beyond a year, stainless steel prices moved sharply, and builders reallocated components between orders rather than miss key customer deadlines. GEA and IMA both referenced supply chain disruption and input cost inflation across their reporting for those years. Machines quoted at fixed prices a year before delivery absorbed the increases, and several builders repriced where contracts allowed.

Exposure divides on order book structure rather than on scale. Builders quoting fixed prices a year ahead of delivery carry input risk that indexed contracts pass through, and capital equipment customers resist indexation more firmly than consumable buyers do. European builders carry higher labour and energy cost than Asian competitors. Aseptic systems carry a further exposure, since validated components cannot be substituted quickly.
cup-fill-and-seal-machine-market-cost-volatility-analysis-1787549071248

Index long lead time orders to steel and component benchmarks

Machines quoted twelve to eighteen months before delivery left builders absorbing the full input increase during the last cycle. Indexing to published stainless steel and component benchmarks shifts that risk toward buyers better placed to carry it within a project budget. Capital equipment customers resist firmly, and resistance eases noticeably in the period following any severe input cost cycle.

Standardise control platforms across the whole machine range

Electronics and controls are 24% of cost and were the binding constraint during the component shortage. Running one control platform across every machine family raises volume per part number, improves supply priority with drive suppliers, and cuts engineering time on each project. The cost is losing some optimisation at the extremes of the range.

Qualify second sources for validated aseptic components

Sterile filling systems use valves, filters, and seals qualified within a validation package, and substituting them requires revalidation that customers will not accept casually. That makes the supplier base narrow in exactly the fastest-growing segment. Qualifying alternatives inside the validation envelope costs engineering time before any shortage arrives, and builders who deferred it lost delivery slots during the last disruption.

Portfolio Architecture for Margin Defence

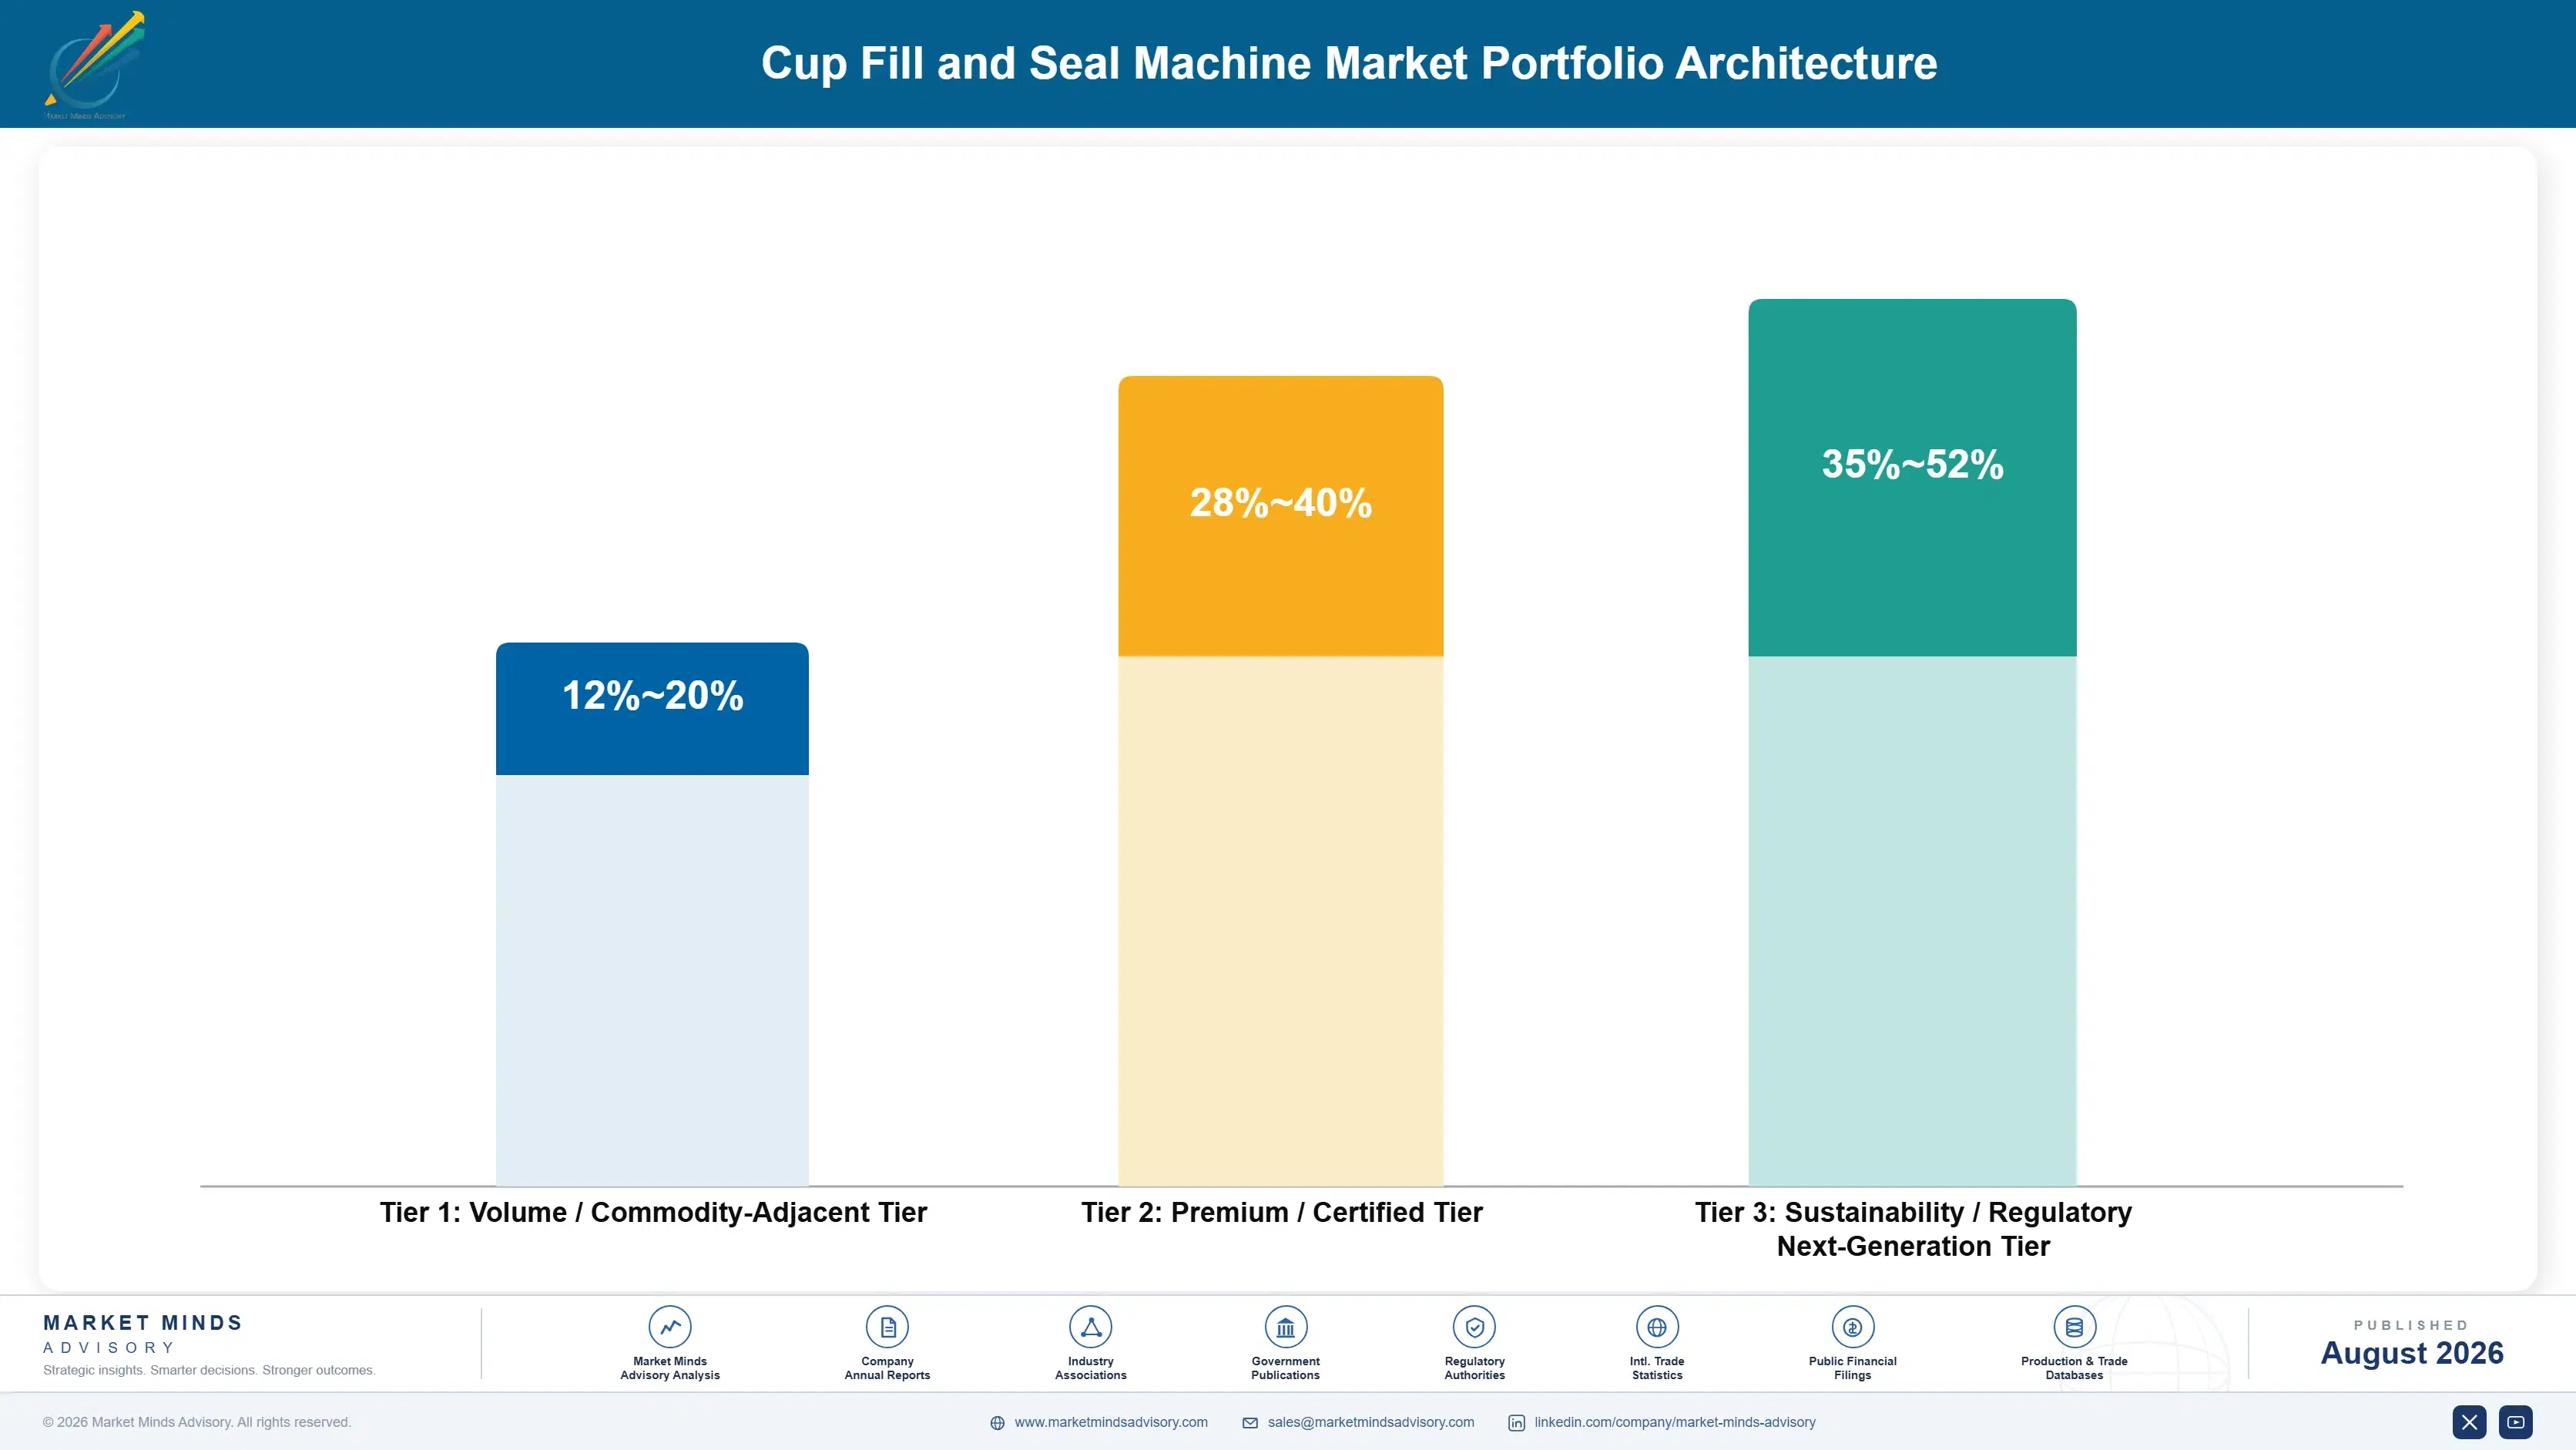
Margin follows technical difficulty and service attachment rather than machine size. Standard rotary fillers for chilled dairy earn low to mid teens gross margin against Chinese competition, because the technology matured and buyers compare delivered price and lead time. Aseptic systems and integrated automation earn considerably more, since validation capability and engineering depth limit the field to builders who invested years before the demand arrived.
The volume and premium tension shows in service economics rather than in factory loading. Regional service coverage is expensive and only pays above a certain installed base density, so builders take standard machine orders they barely profit from in order to build the population that supports profitable service. That logic breaks when a competitor wins enough of the local base to run better coverage at lower cost.

High-value pools concentrate in three places: aseptic systems, aftermarket parts and service on the installed base, and retooling driven by packaging material change. Each is defended by validation capability, incumbency, or technical knowledge rather than by price. Price competition arrives only when a competitor builds validated capability, displaces the service incumbent, or develops equivalent tooling knowledge.

Volume / Commodity-Adjacent Tier

Standard linear and rotary cup fillers for chilled dairy and dessert applications sold on delivered price and lead time. Competes directly against Chinese builders. The range reflects large differences in labour and component sourcing cost.
Gross Margin: 12%-20%

Premium / Certified Tier

Aseptic systems and integrated automation lines sold with validation support and commissioning commitments. The customer purchases shelf stability and running reliability rather than a machine, and switching builders means revalidating everything.
Gross Margin: 28%-40%

Sustainability / Regulatory / Next-Generation Tier

Retooling for mono-material and paper-based formats, rapid changeover systems, and connected monitoring services. Regulation and format proliferation drive adoption. The range is wide because retrofit pricing varies enormously by machine age.
Gross Margin: 35%-52%
cup-fill-and-seal-machine-market-portfolio-architecture-1787549071757

High-value Sub-segments and Strategic Watch-out

Aftermarket Parts and Service

The steadiest and most profitable revenue in this industry, supplying 34% of the total at margins well above new equipment. Incumbency on the service contract is close to unassailable while the machine runs. Build direct coverage rather than using agents. Agents will take this annuity if allowed to.
Gross Margin: 38%-52%

Aseptic Filling Systems

The fastest-growing architecture at 9.6% and the hardest to deliver credibly, which keeps the competitive field narrow. Food manufacturers buy validated shelf stability rather than equipment. Ambient distribution economics drive adoption across Asia and Latin America. Validated references decide who gets shortlisted. Build the capability early.
Gross Margin: 30%-42%

Material Change Retooling

Packaging regulation is converting an eighteen-year replacement cycle into near-term upgrade orders worth a meaningful share of original machine value. Approach the installed base with tested tooling before brands commit to launch dates and lose all leverage. Timing is everything in this particular opportunity. Move now.
Gross Margin: 36%-50%

Standard Rotary Machine Supply

The strategic watch-out. Chinese builders now produce these competently at prices European competitors cannot match, and the technology has genuinely matured. It builds installed base for service, and that is the only reason to keep it. Price it for installed base building, nothing more. Nothing else.
Gross Margin: 12%-19%

How Demand Actually Reaches Builders

The annuity is the aftermarket, and it is unusually strong. A filling line runs eighteen years, needs parts continuously, and generates upgrade and retooling work throughout, which together supply 34% of industry revenue at premium margins. Incumbency on that service relationship is close to unassailable while the machine operates, because a plant will not risk unfamiliar technicians on an asset whose downtime costs thousands per hour. New machine orders, by contrast, arrive in waves that follow capital cycles nobody controls.
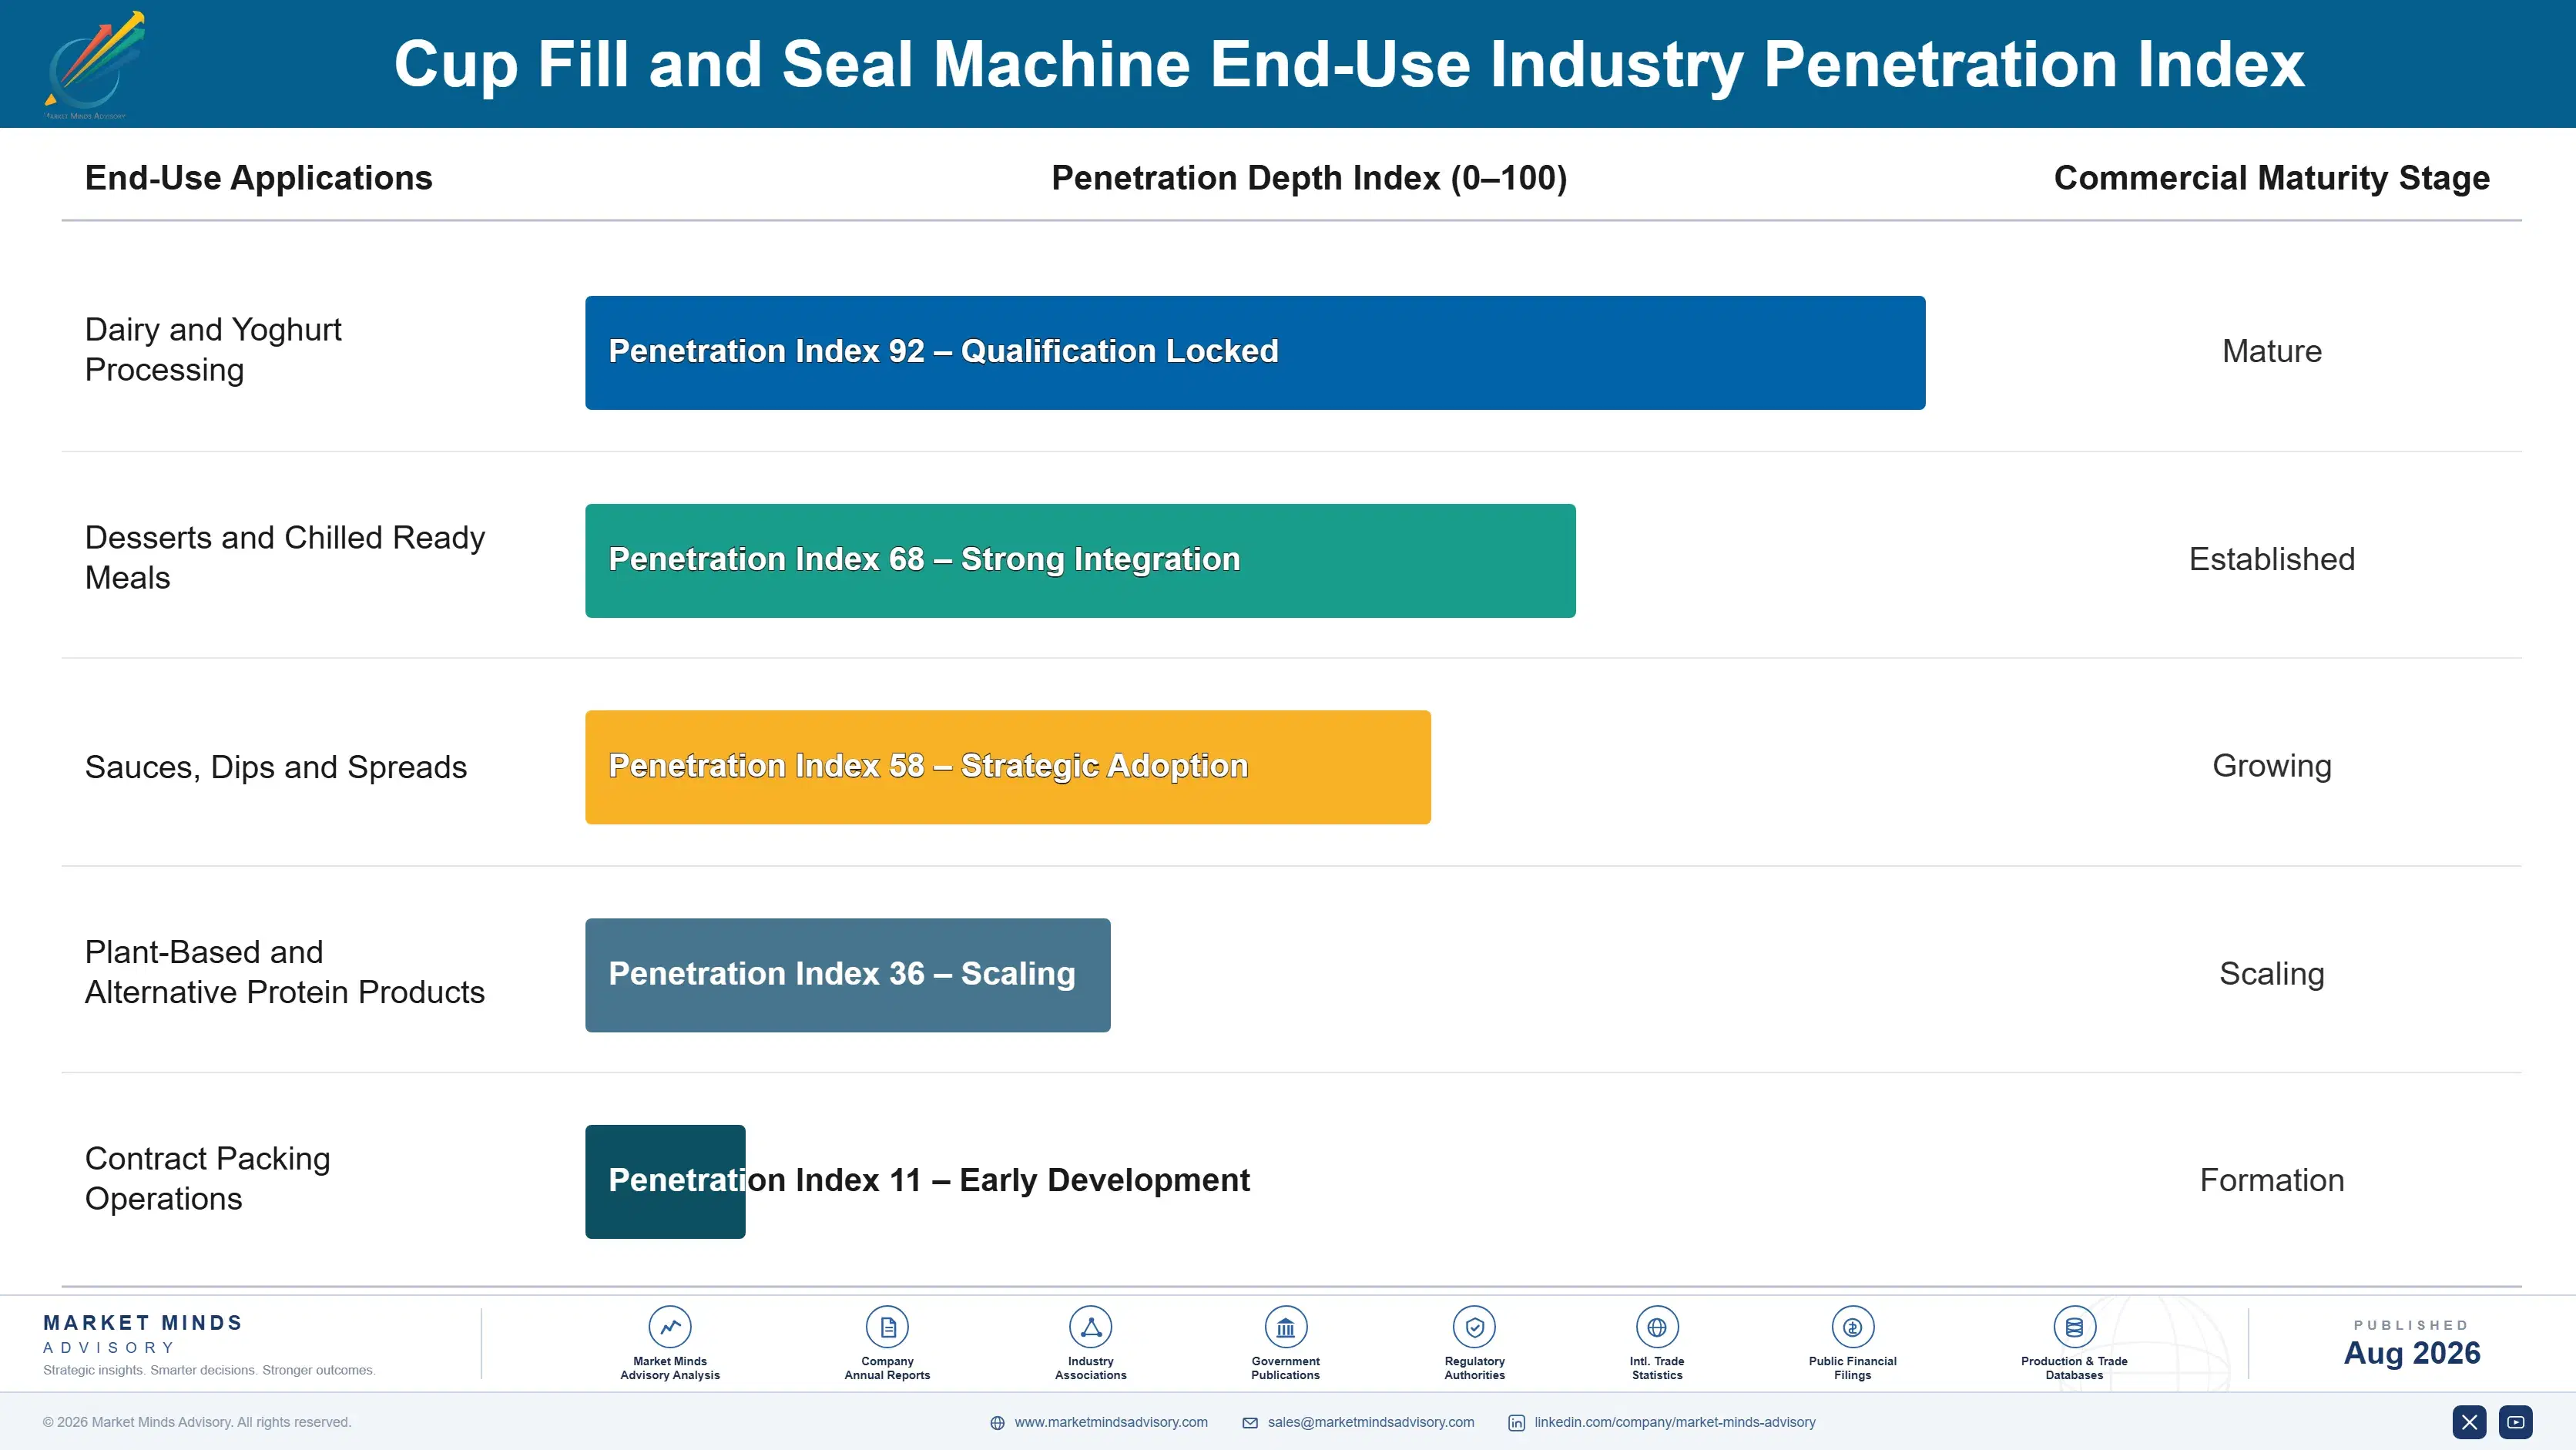
Adoption depth varies sharply by customer type. Large multinational dairy groups standardise builders across sites and run global framework agreements, which makes each win enormous. Regional dairy processors buy on total cost and service proximity. Contract packers value format flexibility above everything because their business is short runs. Emerging market processors buy on capital cost and increasingly choose Chinese equipment.

The buyer has shifted toward plant engineering and operations rather than central procurement. Those teams evaluate changeover time and service response, not nominal filling speed. A builder whose technician can reach the plant within four hours will beat one quoting a lower price from three countries away, and that calculation grows more decisive as maintenance teams shrink.
cup-fill-and-seal-machine-market-end-use-penetration-index-1787549072247

Where the Money Sits

These are among the four positions where our research anticipates prominent divergence between winners and laggards over the coming forecast period. Each is grounded in the demand model, the regulatory perimeter, and the announced capacity pipeline.
01 / SERVICE CONTRACT OWNERSHIP

Own the aftermarket, because the machine sale is nearly incidental

Parts, service, and upgrades supply 34% of industry revenue at margins 15 to 25 percentage points above new equipment, and the relationship reliably holds for the full eighteen years that the machine runs. A builder selling through agents without service coverage hands that entire annuity to somebody else at the moment of delivery. The packaging material retooling wave makes this urgent rather than merely sensible, because whoever holds the service contract on a machine will capture that upgrade work almost automatically.
02 / CHANGEOVER PERFORMANCE SELLING

Quote minutes lost, because nobody cares about nominal speed

Plants running a dozen cup formats lose far more annual output to the 42-minute average changeover than to any filling rate limitation, yet proposals still lead with cups per minute. Modular tooling and servo format adjustment can cut that below fifteen minutes and return 4 to 7% of annual line capacity to the customer. Quoting that figure with a witnessed demonstration behind it wins specifications outright, and it requires format tooling engineering rather than any work on the filling turret.
03 / ASEPTIC CAPABILITY BUILD

Develop validated aseptic now, while the field stays narrow

Aseptic systems grow at 9.6% and they command two to three times the pricing of chilled equivalents, and only a handful of builders can deliver the validated sterile performance that a food safety team will actually accept. Sterile zone engineering, validation protocols, and post-installation support take years to develop into credible references that customers can check. Entering later, after ambient dairy has already scaled across Asia and Latin America, means competing against builders holding a decade of successful validated installations behind them.
04 / RETOOLING SALES TIMING

Reach the installed base before brand teams fix launch dates

Mono-material and paper-based cups seal differently, and food manufacturers usually discover that only after a brand team has committed to a material change with a launch date already announced. Builders arriving early with properly tested tooling convert a looming compliance problem into a planned upgrade order worth 8 to 15% of the original machine value. Arriving afterwards means quoting into a panic with a deadline and no leverage, which sounds profitable on paper and reliably damages the customer relationship instead.

Engagement Snapshot From the Field

A live engagement with an industry participant carrying material or product regulatory and market exposure ahead of a defining policy shift, showing how our research translates into a defensible multi-year portfolio strategy.
MARKET MINDS ADVISORY · CLIENT ENGAGEMENT SUMMARY
Cup Fill and Seal Machine Producer Strategic Portfolio Review and Transition Roadmap 2026·Investment Scenario on Cup Fill and Seal Machine Exposure Evaluation 2025-26
CLIENT PROFILE
A European builder of cup filling and sealing machines selling into dairy and dessert processors across Europe, the Middle East, and Latin America, with revenue near EUR 84 million (client-reported, unverified by MMA). Roughly three quarters of international sales went through agents, and the business held direct service coverage in only its two home markets.
STRATEGIC CHALLENGE
New machine margins had compressed for four years as Chinese builders took standard rotary orders, while aftermarket revenue sat at 21% against an industry norm well above thirty. Management needed to know whether building direct service coverage was economically justified, and how to respond to packaging regulation deadlines approaching across its European customer base.
MMA APPROACH
MMA mapped the installed base by machine age, region, and service arrangement, modelled returns on direct service coverage against agent commission structures, and sized the retooling opportunity created by packaging material deadlines. Forty-seven expert interviews with plant engineers, maintenance managers, and procurement leads established what actually drives service supplier choice.
KEY FINDINGS
  1. Agents captured the majority of parts revenue on machines the client had built, and in several markets were supplying competitor components into the client's own installed base.
  2. Aftermarket gross margin ran 22 percentage points above new equipment, and the client's low attachment rate explained most of the gap against better performing competitors.
  3. Roughly 40% of the European installed base would need sealing tool changes before packaging deadlines, and no competitor had yet approached those plants with tested tooling.
  4. Plant engineers rated service response time above every other supplier attribute including price, and consistently could not name who had actually built their existing machines.
CLIENT PROFILE
A European builder of cup filling and sealing machines selling into dairy and dessert processors across Europe, the Middle East, and Latin America, with revenue near EUR 84 million (client-reported, unverified by MMA). Roughly three quarters of international sales went through agents, and the business held direct service coverage in only its two home markets.
STRATEGIC CHALLENGE
New machine margins had compressed for four years as Chinese builders took standard rotary orders, while aftermarket revenue sat at 21% against an industry norm well above thirty. Management needed to know whether building direct service coverage was economically justified, and how to respond to packaging regulation deadlines approaching across its European customer base.
MMA APPROACH
MMA mapped the installed base by machine age, region, and service arrangement, modelled returns on direct service coverage against agent commission structures, and sized the retooling opportunity created by packaging material deadlines. Forty-seven expert interviews with plant engineers, maintenance managers, and procurement leads established what actually drives service supplier choice.
KEY FINDINGS
  1. Agents captured the majority of parts revenue on machines the client had built, and in several markets were supplying competitor components into the client's own installed base.
  2. Aftermarket gross margin ran 22 percentage points above new equipment, and the client's low attachment rate explained most of the gap against better performing competitors.
  3. Roughly 40% of the European installed base would need sealing tool changes before packaging deadlines, and no competitor had yet approached those plants with tested tooling.
  4. Plant engineers rated service response time above every other supplier attribute including price, and consistently could not name who had actually built their existing machines.
RECOMMENDED STRATEGY
Phase 1: Phase one: establish direct service and parts operations in the three markets holding the largest installed base, replacing agent arrangements where contracts permit. Phase 2: Phase two: develop and validate sealing tooling for mono-material and paper-based formats, then approach the installed base ahead of packaging regulation deadlines. Phase 3: Phase three: concede standard rotary configurations on price and redirect engineering toward changeover performance and integrated automation content. Concede the standard segment deliberately.
OUTCOME
The client opened direct service operations in three markets within a year and raised aftermarket revenue from 21% to 33% of the total across two years. Retooling orders reached EUR 11 million ahead of the first regulatory deadline, and blended gross margin improved 5.6 percentage points (client-reported, unverified by MMA).

Frequently Asked Questions

Foundational context covering the market sizes, CAGR, scope, country, region and competition that inform every finding below. This section is provided to cover basics and most often pre-purchase conversations, answered from the MMA Primary Research Dataset.

What is the current size of the Cup Fill and Seal Machine Market?

The market was valued at USD 3.2 billion in 2025, rising to an estimated USD 3.38 billion in 2026. East Asia holds the largest regional share at 28% of global value.

How large will the Cup Fill and Seal Machine Market be by 2036?

MMA forecasts USD 5.83 billion by 2036 under the base case, an expansion multiple of 1.72 times the 2026 value. That represents USD 2.45 billion of incremental value across the forecast period.

What is the CAGR for the Cup Fill and Seal Machine Market 2026 to 2036?

The base case CAGR is 5.6%, with a bull case of 6.8% and a bear case of 4.4%. The spread reflects uncertainty over food manufacturer capital spending and packaging regulation timing.

Which segment is growing fastest?

Aseptic cup fill and seal systems grow fastest at 9.6%, roughly 1.71 times the market rate. Modular and robotic cell systems follow at 8.4%, answering format proliferation rather than volume.

Who are the major companies in the Cup Fill and Seal Machine Market?

Syntegon Technology, IMA Group, GEA Group, Trepko Group, and ILLIG Maschinenbau lead on machine revenue. The top five hold roughly 38% of global value, separated by technical positioning.

Which country is growing fastest?

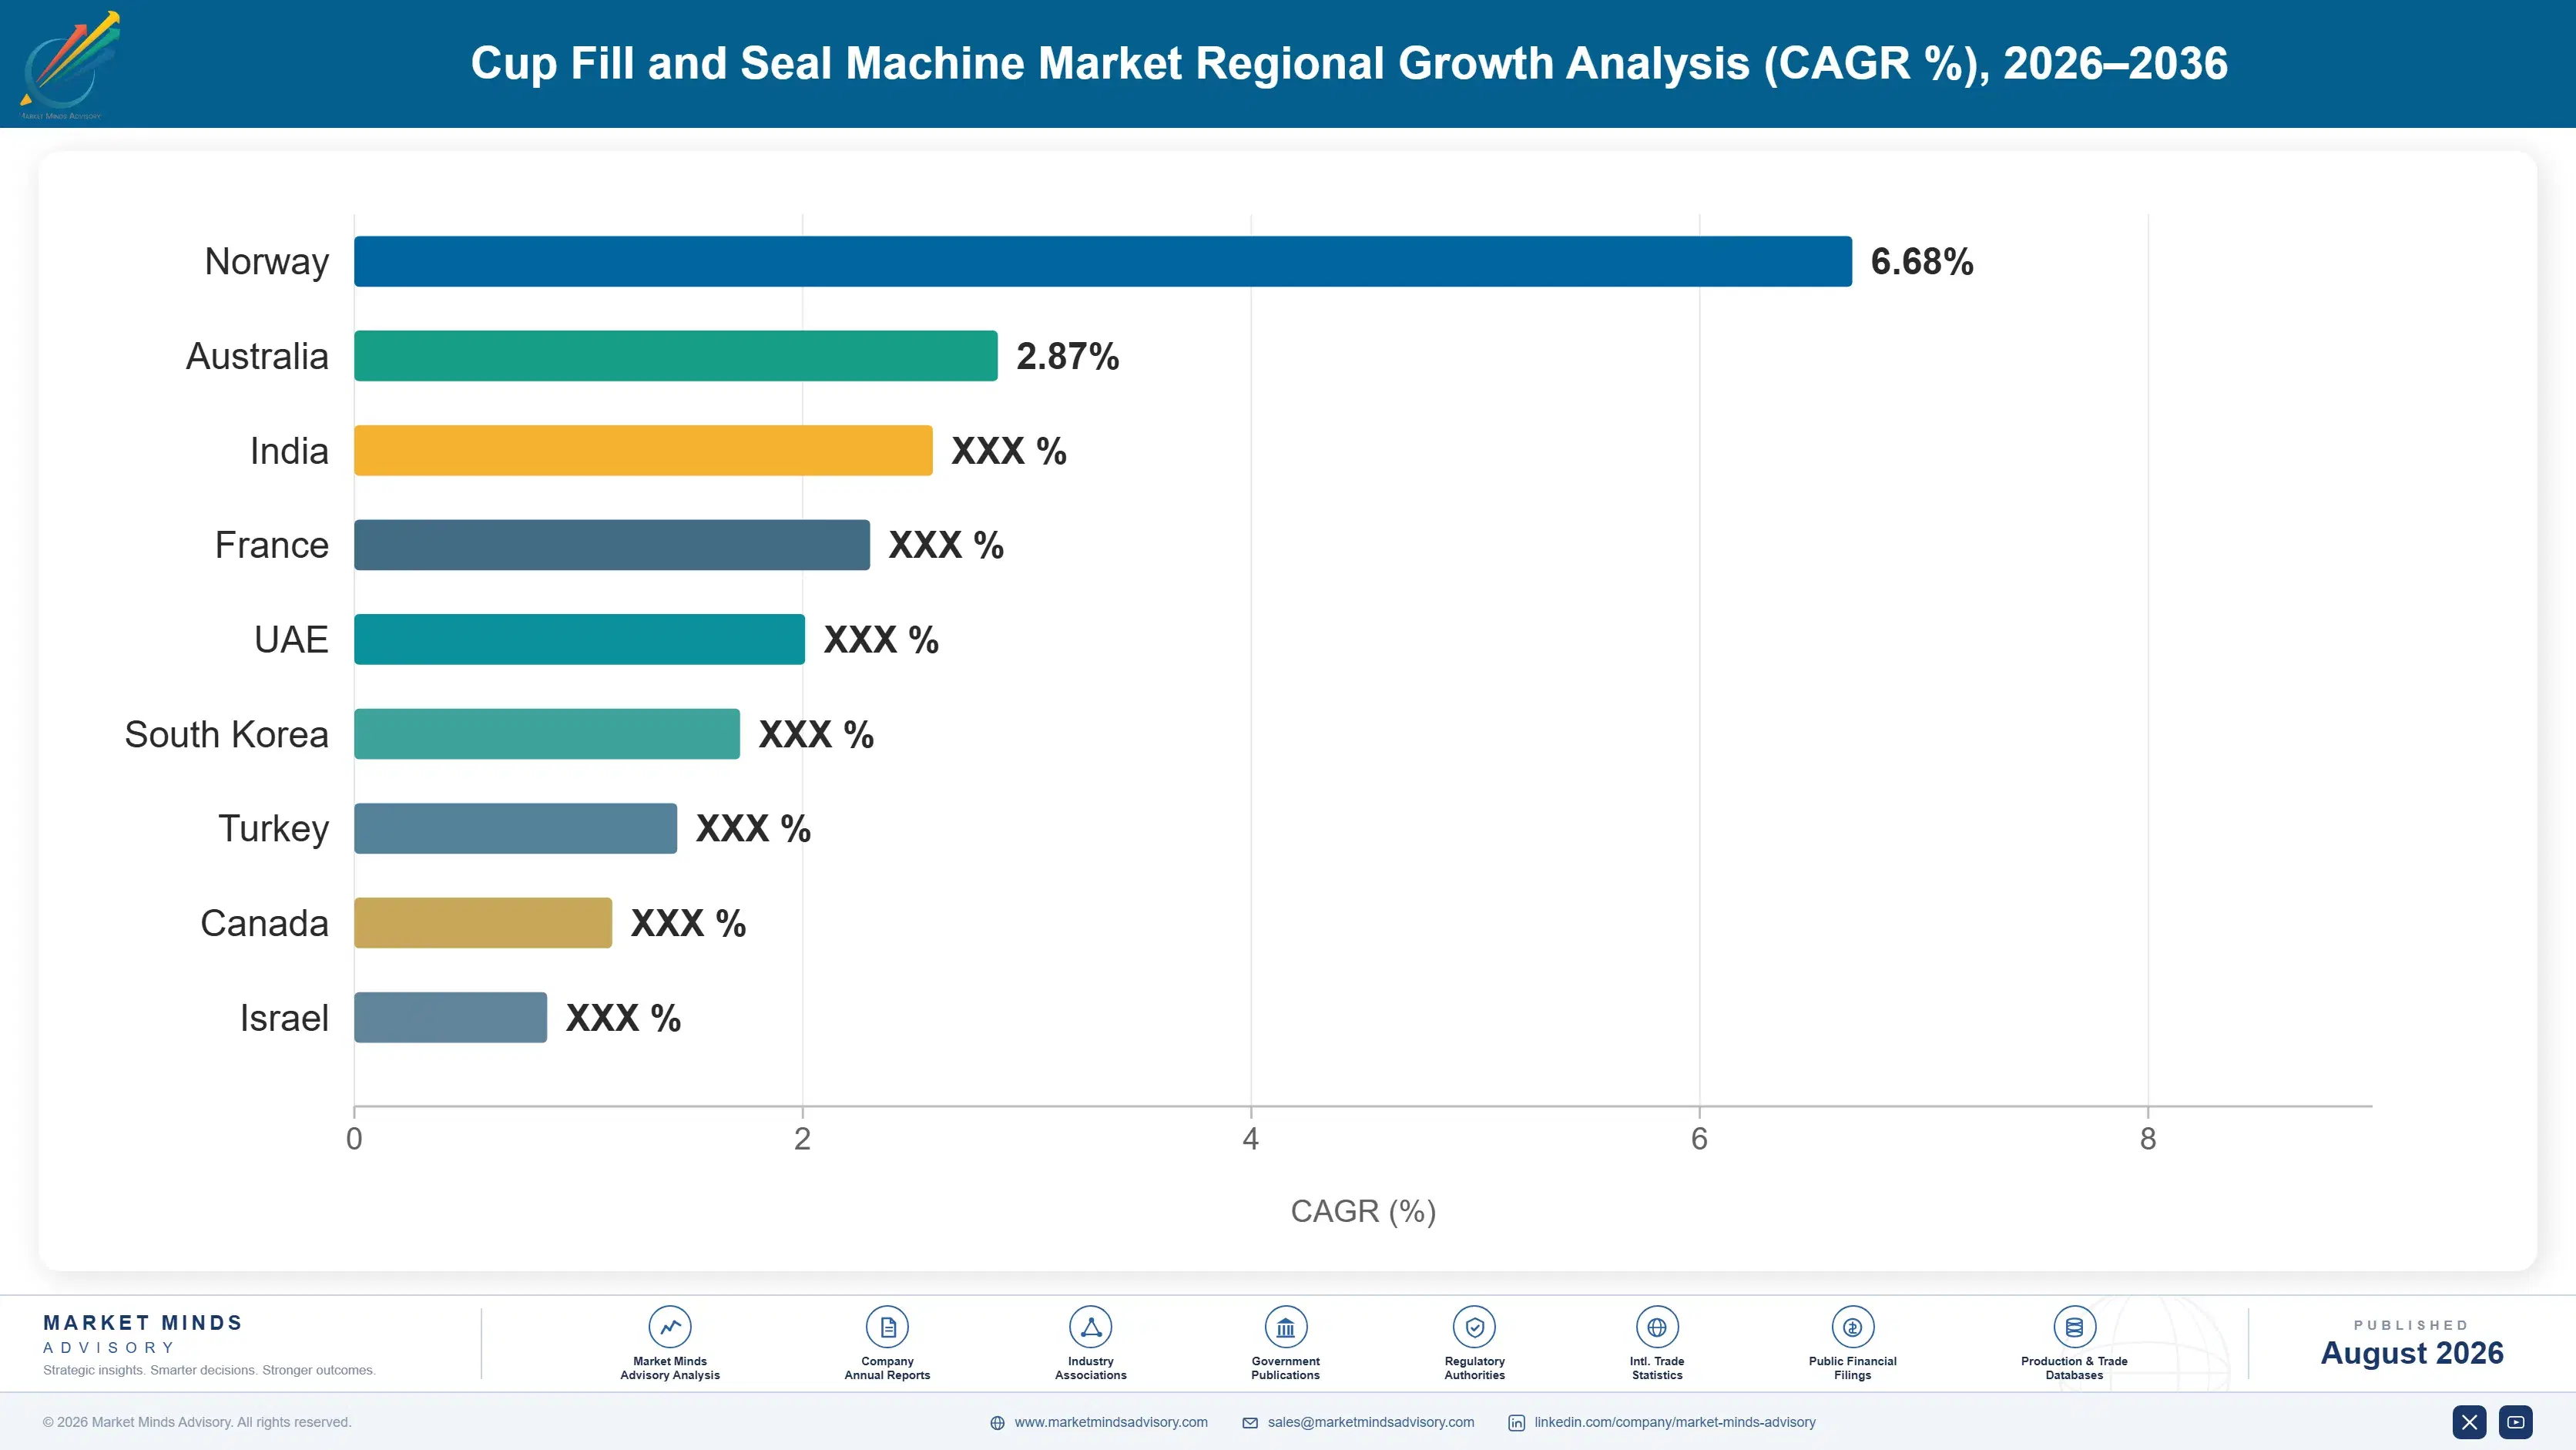
India grows fastest at 8.6%, driven by organised dairy processing taking share from unorganised supply. Expensive and patchy cold chain makes aseptic filling commercially attractive rather than merely optional.

Report Segmentation Architecture

The full report scope spans multiple orthogonal segmentation dimensions, with cross-tabulated demand data provided for each dimension pair. Coverage extends further to regional breakdowns, trend trajectories, and the competitive detail needed to support segment-level decision-making.

By Machine Architecture

  • Linear Inline Cup Fillers
  • Rotary Cup Fillers
  • Form-Fill-Seal Integrated Systems
  • Aseptic Cup Fill and Seal Systems
  • Modular and Robotic Cell Systems

By End-Use Industry

  • Dairy and Yoghurt Processing
  • Desserts and Chilled Ready Meals
  • Sauces, Dips and Spreads
  • Plant-Based and Alternative Protein Products
  • Contract Packing Operations

By Sales Model

  • Direct Manufacturer Supply
  • Agent and Distributor Channel
  • Framework Agreement Supply
  • Aftermarket Parts and Service
  • Retrofit and Upgrade Programmes

By Region

  • North America
  • Western Europe
  • East Asia
  • South Asia and Pacific
  • Latin America
  • Middle East and Africa
  • Eastern Europe

Scope, Methodology, and Coverage

Every figure in this report is reproducible from documented input assumptions. The scope below maps the historical period, the forecast horizon, the segmentation dimensions, and the countries covered, alongside the underlying primary and qualitative methodology.
Historical Period
2020 to 2025
Forecast Period
2026 to 2036
Base Year
2025 (USD billions; MMA Primary Research Dataset, August 2026)
Market Definition
The market comprises machines that fill and heat-seal pre-formed or in-line thermoformed cups and tubs for food and beverage products, covering linear inline fillers, rotary fillers, form-fill-seal integrated systems, aseptic cup fill and seal systems, and modular robotic cell systems. Value is measured at machine builder level and includes aftermarket parts, service, and retrofit revenue. Pouch and sachet machines, bottle and can filling lines, cup and lidding materials, secondary packaging and palletising equipment, and standalone thermoforming machines fall outside scope.
Quantitative Units
USD billions (current prices); machines shipped annually; USD per machine by architecture and capacity class
Segmentation Dimensions
By Machine Architecture; By End-Use Industry; By Sales Model; By Region
Regions Covered
North America, Western Europe, East Asia, South Asia and Pacific, Latin America, Middle East and Africa, Eastern Europe
Countries Covered
United States, Canada, Mexico, Germany, Italy, France, Denmark, Netherlands, United Kingdom, Spain, Poland, Czechia, Romania, China, Japan, South Korea, India, Australia, Indonesia, Thailand, Vietnam, Brazil, Argentina, Colombia, Saudi Arabia, United Arab Emirates, Egypt, South Africa
Key Companies Profiled
Syntegon Technology, IMA Group, GEA Group, Trepko Group, ILLIG Maschinenbau, Waldner Holding, ERCA, Arcil, SEALPAC, MULTIVAC, Coesia, Tetra Pak, SIG Group, Serac Group, Hassia-Redatron, Nichrome Packaging Solutions, Sacmi, Marel, Jiangsu Newamstar Packaging Machinery, Ampack
Quantitative Methodology
Primary survey, n=3,800 respondents, Q4 2025, six countries; demand-side model with trade association cross-validation
Qualitative Methodology
47 expert interviews, Q4 2025; applied to validate demand model assumptions, identify emerging dynamics, and assess competitive positioning
Report Format
PDF and XLSX data workbook (Word format preview document)
Publisher
Market Minds Advisory
Report Code
MMA-2026-PAC-118
Published
August 2026
Contact
sales@marketmindsadvisory.com | www.marketmindsadvisory.com

Purchase the full Cup Fill and Seal Machine Market Report (2026 to 2036).

The full report sizes cup fill and seal machine demand across five architectures, five end-use categories, and seven regions with 2026 to 2036 forecasts under base, bull, and bear cases. It separates new machine orders from aftermarket and retrofit revenue, which behave as entirely different businesses with different margins and cycles. Competitive profiles cover twenty builders assessed consistently on machine revenue, aseptic capability, and service network density. Cost analysis traces stainless steel, servo drive, and control component exposure through recent supply disruption. Commercial guidance addresses service contract ownership, changeover performance selling, aseptic capability build, and retooling sales timing.
Five machine architectures sized separately by region
Aftermarket and retrofit revenue separated from new machines
Packaging material deadlines mapped to retooling demand
Aseptic validation capability assessed across twenty builders
Changeover performance benchmarked by machine architecture
Chinese builder price positioning tracked across export markets

Built For The People Who Decide

From boardroom strategy to bench-side execution, this report is read cover-to-cover by leaders shaping the next decade of their industry, turning demand scenarios, market dynamics and valuation benchmarks into decisions.
CXOs/ Presidents/ VPs/ Managers
M&A and Corporate Development
Strategy Teams and R&D Heads
Procurement and Product Directors
Regulatory and Compliance Leaders
Investor Relations and Equity Analysts