Market Minds Advisory
Crossfit Apparel Market

Crossfit Apparel Market: Crossfit Apparel Market: Garments Die Of Abrasion And The Industry Sells Moisture Management, While The Shoe Suits Neither Lifting Nor Running, 2026 to 2036

Around 64% of garment failures come from abrasion and about 3% of products publish any abrasion figure. Fit accounts for 27% of returns in a population that does not fit standard blocks.

Lead Analyst

Published

September 2026

Make Smarter Decisions with Customized Research Insights

Request a free sample report and evaluate market opportunities, growth trends, and competitive dynamics relevant to your business needs.

2025 MARKET VALUE$2.9BMarket Size 2025
2036 FORECAST VALUE$6.6BBase Case , 2026 to 2036
CAGR 2026 TO 20367.8 %Bull 9.0% / Bear 6.6%
INCREMENTAL OPPORTUNITY$3.5BNet 10- year value creation
EXPANSION MULTIPLE2.13x2036 value over 2026 base
Strategic Levers
M&A Pipeline
Regional Outlook
Country Rankings
Competitive Intelligence
Segmental Deep-dive
Call-Us : 91 93563 13602

Executive Snapshot and Market Trajectory.

Garments in this category die of abrasion. Rope climbs, burpees on rubber, barbell knurling against the thigh, and box jumps wear fabric through, and about 64% of failures trace to that. The industry sells moisture management, which is an endurance running problem. It is not what ends a garment.
Grip and hand protection grows at 11.7%, half again the market rate of 7.8%, because it is the one product a participant genuinely cannot train without once the volume rises. Supportive sleeves and compression follow at 10.2%. Competition and team kit grows slowest of the six categories at 5.2%, on a participant base that is broadening rather than intensifying. Grips replace on a wear cycle measured in months.
North America holds 31% of demand because the methodology originated there and affiliate density remains highest, with Brazilian growth of 12.4% leading every market covered. Only around 3% of products publish a measured abrasion figure, so a genuinely durable garment competes on fabric names against one that is not. Fit accounts for about 27% of returns, because trained athletes carry shoulder and quadriceps proportions that standard apparel blocks were never drafted around at all.
Market Definition
This market covers performance apparel, footwear, and worn protective equipment designed for high-intensity functional fitness training, including performance training tops, abrasion-reinforced bottoms, flat-sole cross-training footwear, grip and hand protection, supportive sleeves and compression, and competition and team kit. It excludes general athleisure and lifestyle activewear, running-specific apparel and footwear, weightlifting belts and hard equipment, gym equipment, and licensed spectator merchandise.
Base Year Value
$2.9B in 2025 (MMA Primary Research Dataset, September 2026)
Forecast Period
2026 to 2036, eleven discrete annual values
CAGR
7.8% base case. Bull 9.0%. Bear 6.6%.
Fastest Growth Segment
Grip And Hand Protection: 11.7% CAGR
Fastest Growth Country
Brazil: 12.4% CAGR
Fastest Growth Region
South Asia and Pacific: 9.8% CAGR
Largest Region
North America: 31% of 2025 global value
Market Leaders
Nike, Reebok, NOBULL, Rogue Fitness, and Under Armour lead the field. Source: MMA Primary Research Dataset, July 2026.
Primary Survey
n=3,800 procurement and R&D decision-makers, Q4 2025, six countries
Methodology
Demand-side build-up, cross-validated against public data, 47 expert interviews

Crossfit Apparel Market Forecast Scenarios

crossfit-apparel-market-size-forecast-scenario-1790019197212
Growth from 2020 to 2025 ran at 6.7% and its channel mix shifted more than its rate. Affiliate gym distribution weakened as the branded methodology fragmented, while direct online and specialist retail absorbed the volume. Participation broadened toward general functional fitness training rather than competitive intent, which changed what people bought without reducing how much they bought.
The base case at 7.8% rests on three mechanisms. Grip and protective equipment keeps growing because participants reaching moderate training volume cannot avoid buying it. Latin American and Asian participation keeps expanding, with Brazilian growth at 12.4% leading every country covered. And abrasion-reinforced bottoms keep taking share as buyers who have destroyed two pairs of leggings on a rope start reading construction rather than fabric names. None of the three assumes the affiliate network stabilises during the period.
The bull case at 9.0% depends on measured abrasion data becoming a published specification, which would let genuinely durable construction command a price it currently cannot. The bear case at 6.6% is channel: about 38% of category revenue still moves through affiliate gyms, and that base is fragmenting faster than direct channels are replacing it in several markets.

What Actually Destroys The Kit

Functional fitness destroys clothing through friction rather than through sweat. A rope climb drags fabric across the inside of a calf under body weight, a barbell knurl grinds against the front of a thigh through every clean, and burpees push a shirt across rubber flooring dozens of times a session. Around 64% of garment failures in this category trace to abrasion. Almost every product in it is marketed on moisture management.
TOP FIVE CONCENTRATION34%Share of category revenue held by the leading brands
ABRASION DATA DISCLOSURE3%Products publishing measured abrasion resistance rather than fabric names
ABRASION FAILURE SHARE64%Garment failures caused by abrasion rather than moisture or seams
FIT RETURN RATE27%Returns citing fit rather than any performance or quality issue
AFFILIATE CHANNEL DEPENDENCE38%Category revenue moving through affiliate gym and box channels
FOOTWEAR DROP COMPROMISE4 mmTypical heel drop serving neither lifting nor distance running well
Moisture management is an endurance problem borrowed from running, where the garment is loaded lightly and continuously rather than aggressively and intermittently. It matters here, but it is not what ends a garment's life. About 3% of products publish a measured abrasion figure, so a brand that engineered durability competes against one that printed a fabric name.
The footwear sits on a similar compromise. A four millimetre heel drop is too much for a squat, where a flat or slightly raised heel serves better, and too little for anyone running more than a short distance. The shoe is sold as doing everything, and people who take that literally get shin splints. Seam placement matters more than fabric and gets discussed even less.
"This industry sells moisture management to people whose clothes die of abrasion, and sells a do-everything shoe to people who then run five kilometres in it. Almost nobody publishes an abrasion figure, so the brands that actually build durable kit cannot charge for it."
Practice Director, Sporting Goods and Performance Apparel · MMA Consumer Apparel and Sporting Goods Practice · September 2026

Market Trends

Protective Equipment Grows On Unavoidable Need

Grip and hand protection grows at 11.7% and supportive sleeves at 10.2%, both faster than any garment category, because a participant reaching moderate training volume cannot continue without them. Torn hands stop training entirely, which makes grips a necessity purchase rather than a preference one. That also makes the segment resistant to the discretionary spending pressure that affects apparel, and it repeats on a wear cycle measured in months rather than years. Brands built on apparel alone are missing the most reliable revenue in the category. That recurring element is also the most reliable revenue anywhere in the category.
Market Impact: Country grows at 12.4%
Buyers Start Reading Construction Rather Than Fabric

Abrasion-reinforced bottoms grow at 8.9% against performance training tops at 6.1%, and the reason is experience. A participant who has worn through two pairs of leggings on rope climbs stops reading fabric names and starts looking at where the reinforcement panels sit and how the seams are placed. That buyer is small in number and disproportionately influential in the communities where this category forms its demand. Brands publishing construction detail reach them and brands publishing fabric marketing do not. Reinforcement panel placement and flatlock seam position decide whether a garment survives a rope climb.
Market Impact: Competition kit grows 5.2%

Market Opportunities and Growth Drivers

Brazilian Functional Fitness Density Drives Growth

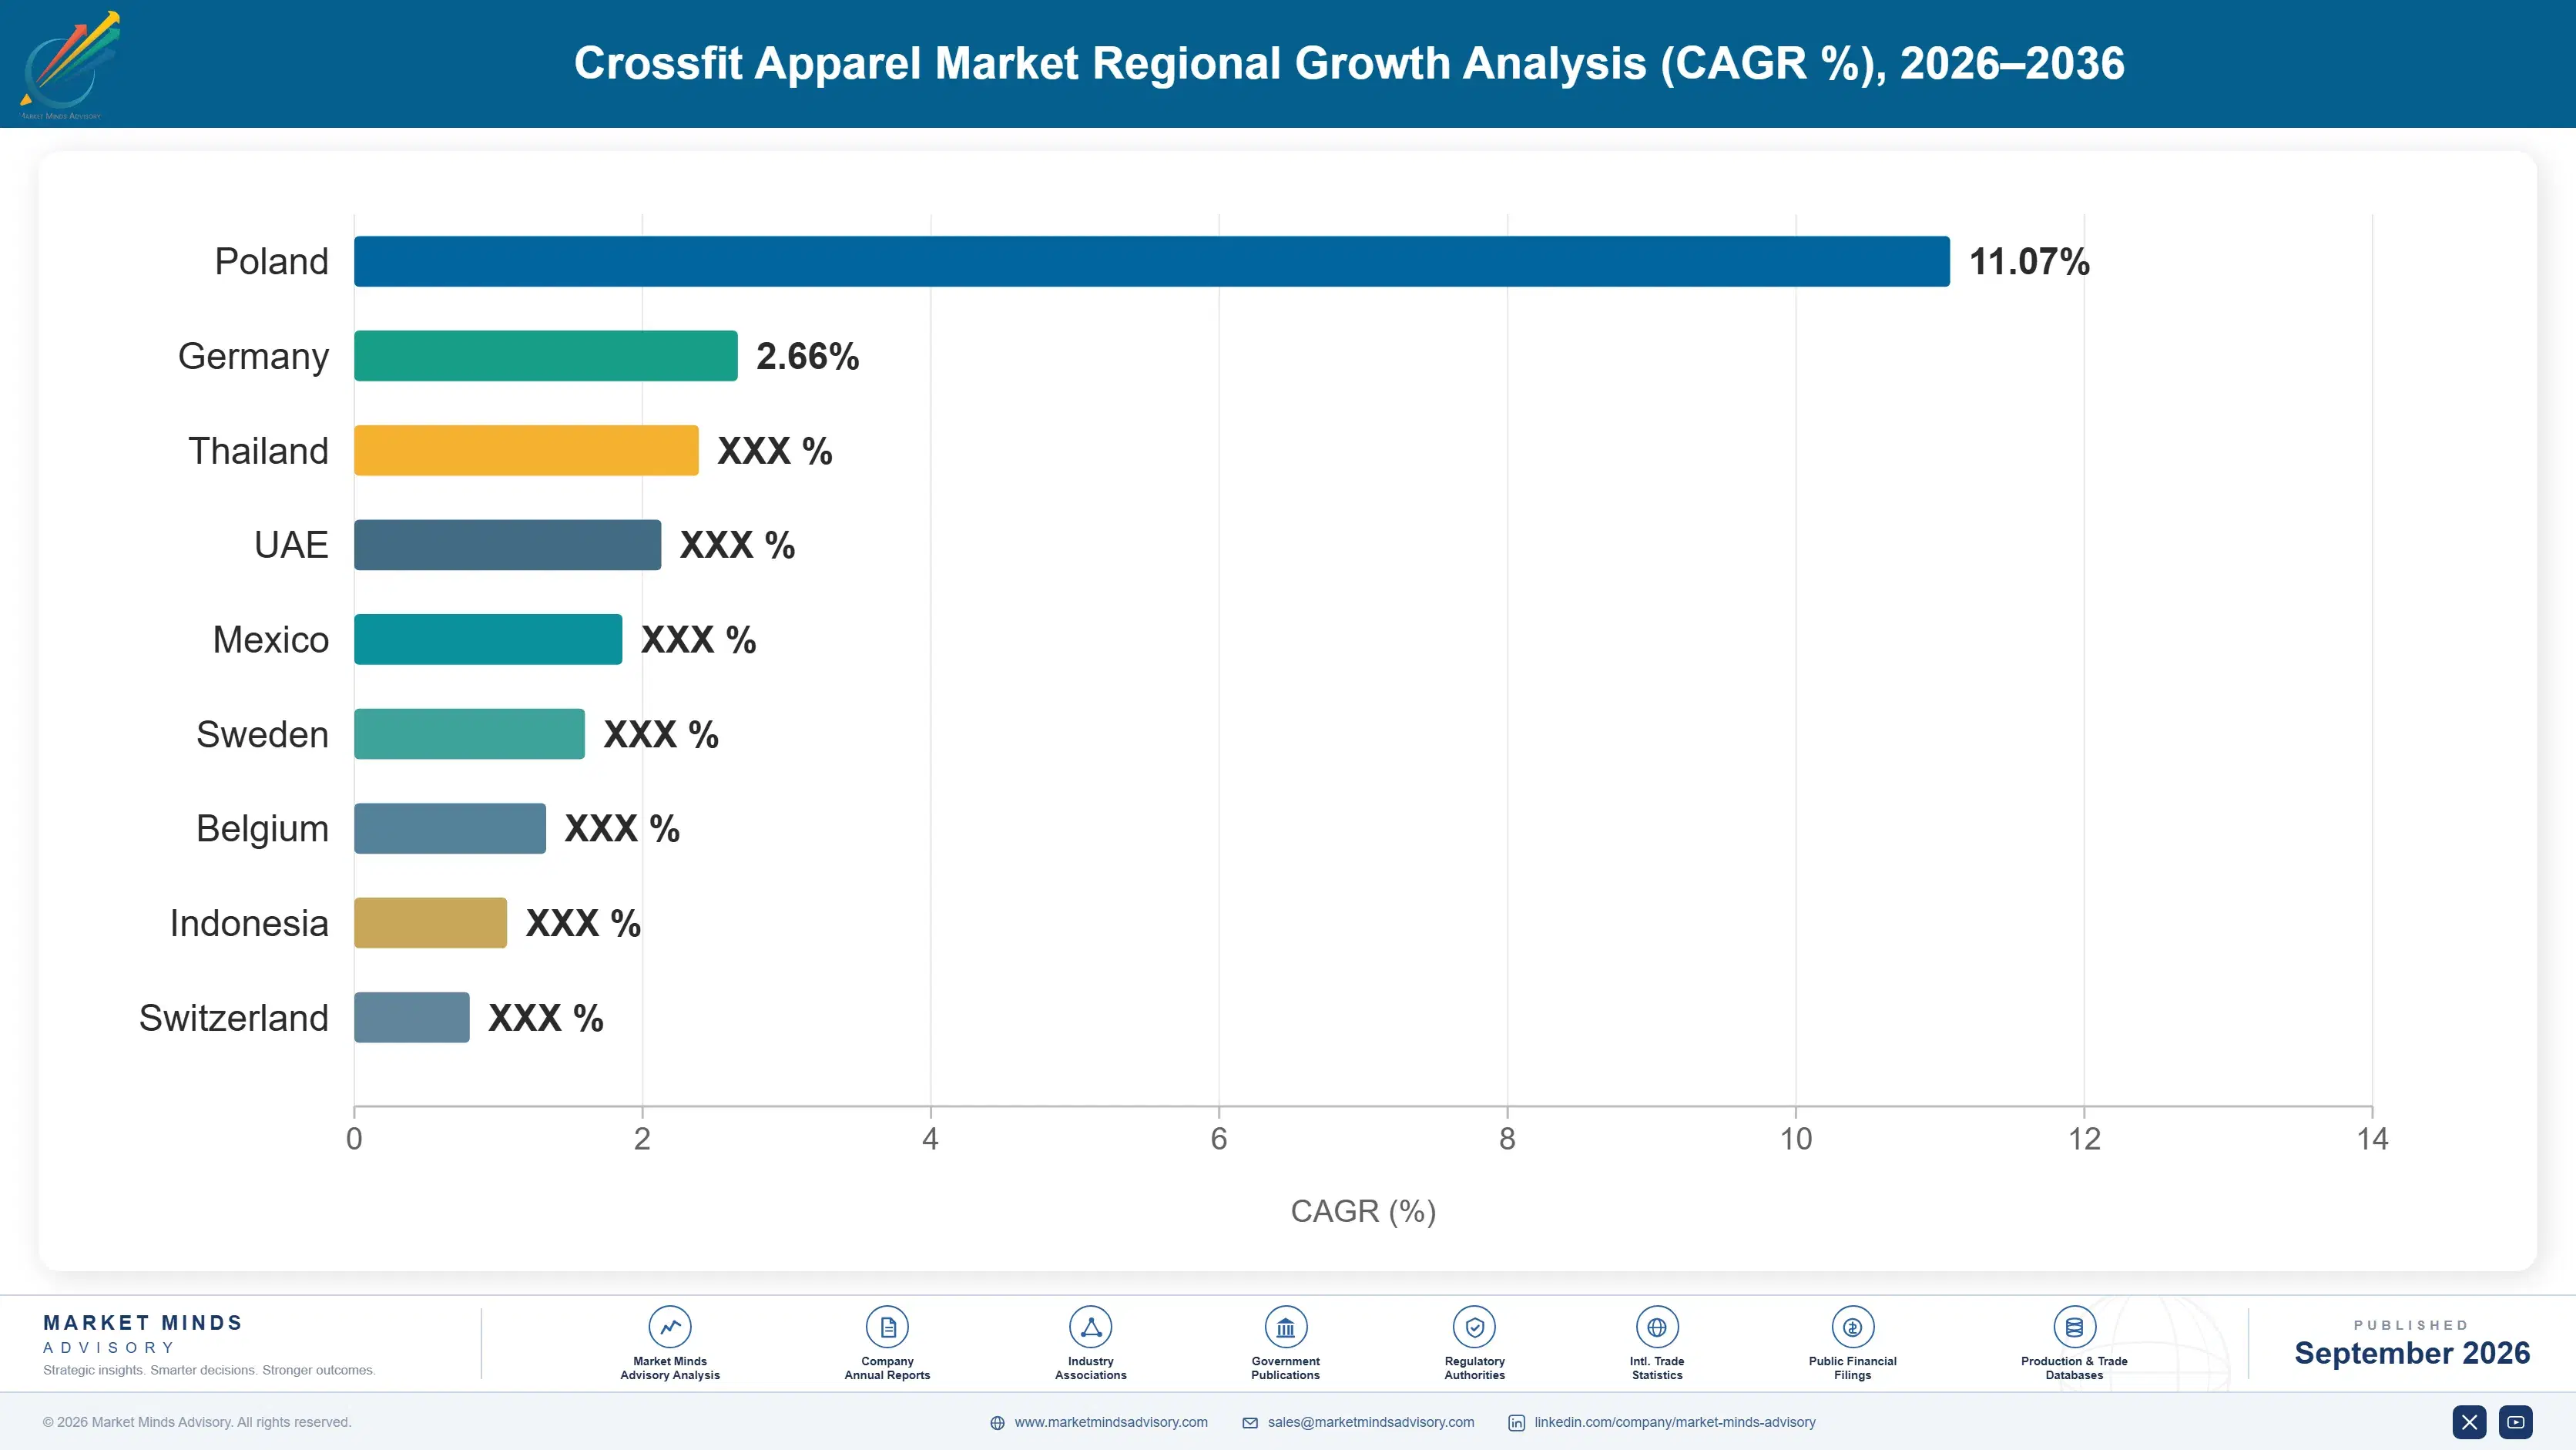
Brazil grows at 12.4%, faster than any country covered, on functional fitness gym density among the highest anywhere and a training culture that treats the discipline as mainstream rather than niche. Latin America holds 12% of world demand, well above its share of comparable apparel categories. Participation there skews younger and trains more frequently, which raises replacement rates on abrasion-limited garments considerably. Local manufacture supplies part of the mass tier while premium product is imported at high landed cost. Grip and protective equipment sells disproportionately well there for the same reason.
Market Impact: Only 3% publish figures

Broadening Participation Changes What Actually Sells

Participation has broadened from competitive intent toward general functional fitness training, which raises the number of buyers while lowering average training volume per buyer. That shifts demand from competition kit, growing slowest at 5.2%, toward everyday training garments and protective equipment. It also means fewer buyers experience the abrasion failures that teach construction literacy, which slows the shift toward durability-led purchasing. The two effects work against each other and roughly cancel across the forecast period. Brands positioned entirely around competitive intent address a shrinking share of a growing category. That identity is hard to unwind.
Market Impact: Fit causes 27% returns

Market Restraints and Challenges

Nobody Publishes The Number That Decides Durability

Around 3% of products publish a measured abrasion figure while 64% of failures trace to abrasion, and the root cause is that no standard requires it and fabric names market more easily than test results. Commercially this caps what genuinely durable construction can charge, since a buyer cannot distinguish it before purchase. Brands respond by publishing measured abrasion cycles, by showing reinforcement panel placement in product imagery, and by warranting garments against wear-through rather than only against defect. Warranting against wear-through rather than only against defect is the version that a buyer notices.
Market Impact: Grips grow at 11.7%

The Population Does Not Fit Standard Blocks

Fit accounts for about 27% of returns, and the root cause is that trained functional fitness athletes carry shoulder-to-waist and quadriceps-to-waist ratios that standard apparel blocks were never drafted around. Commercially this is expensive twice over, in return handling and in lost customers who conclude the brand is not for them. Brands respond by drafting sport-specific blocks, by publishing measured garment dimensions rather than size letters, and by offering separate cuts for different body proportions. Publishing measured garment dimensions rather than size letters costs nothing and resolves most of the guesswork a buyer currently does before ordering.
Market Impact: Bottoms grow at 8.9%
4 additional market trends, 3 additional growth drivers, and 2 additional restraints and challenges are covered in the full report. Contact sales@marketmindsadvisory.com to access the complete intelligence.

Segment CAGR and Growth Architecture

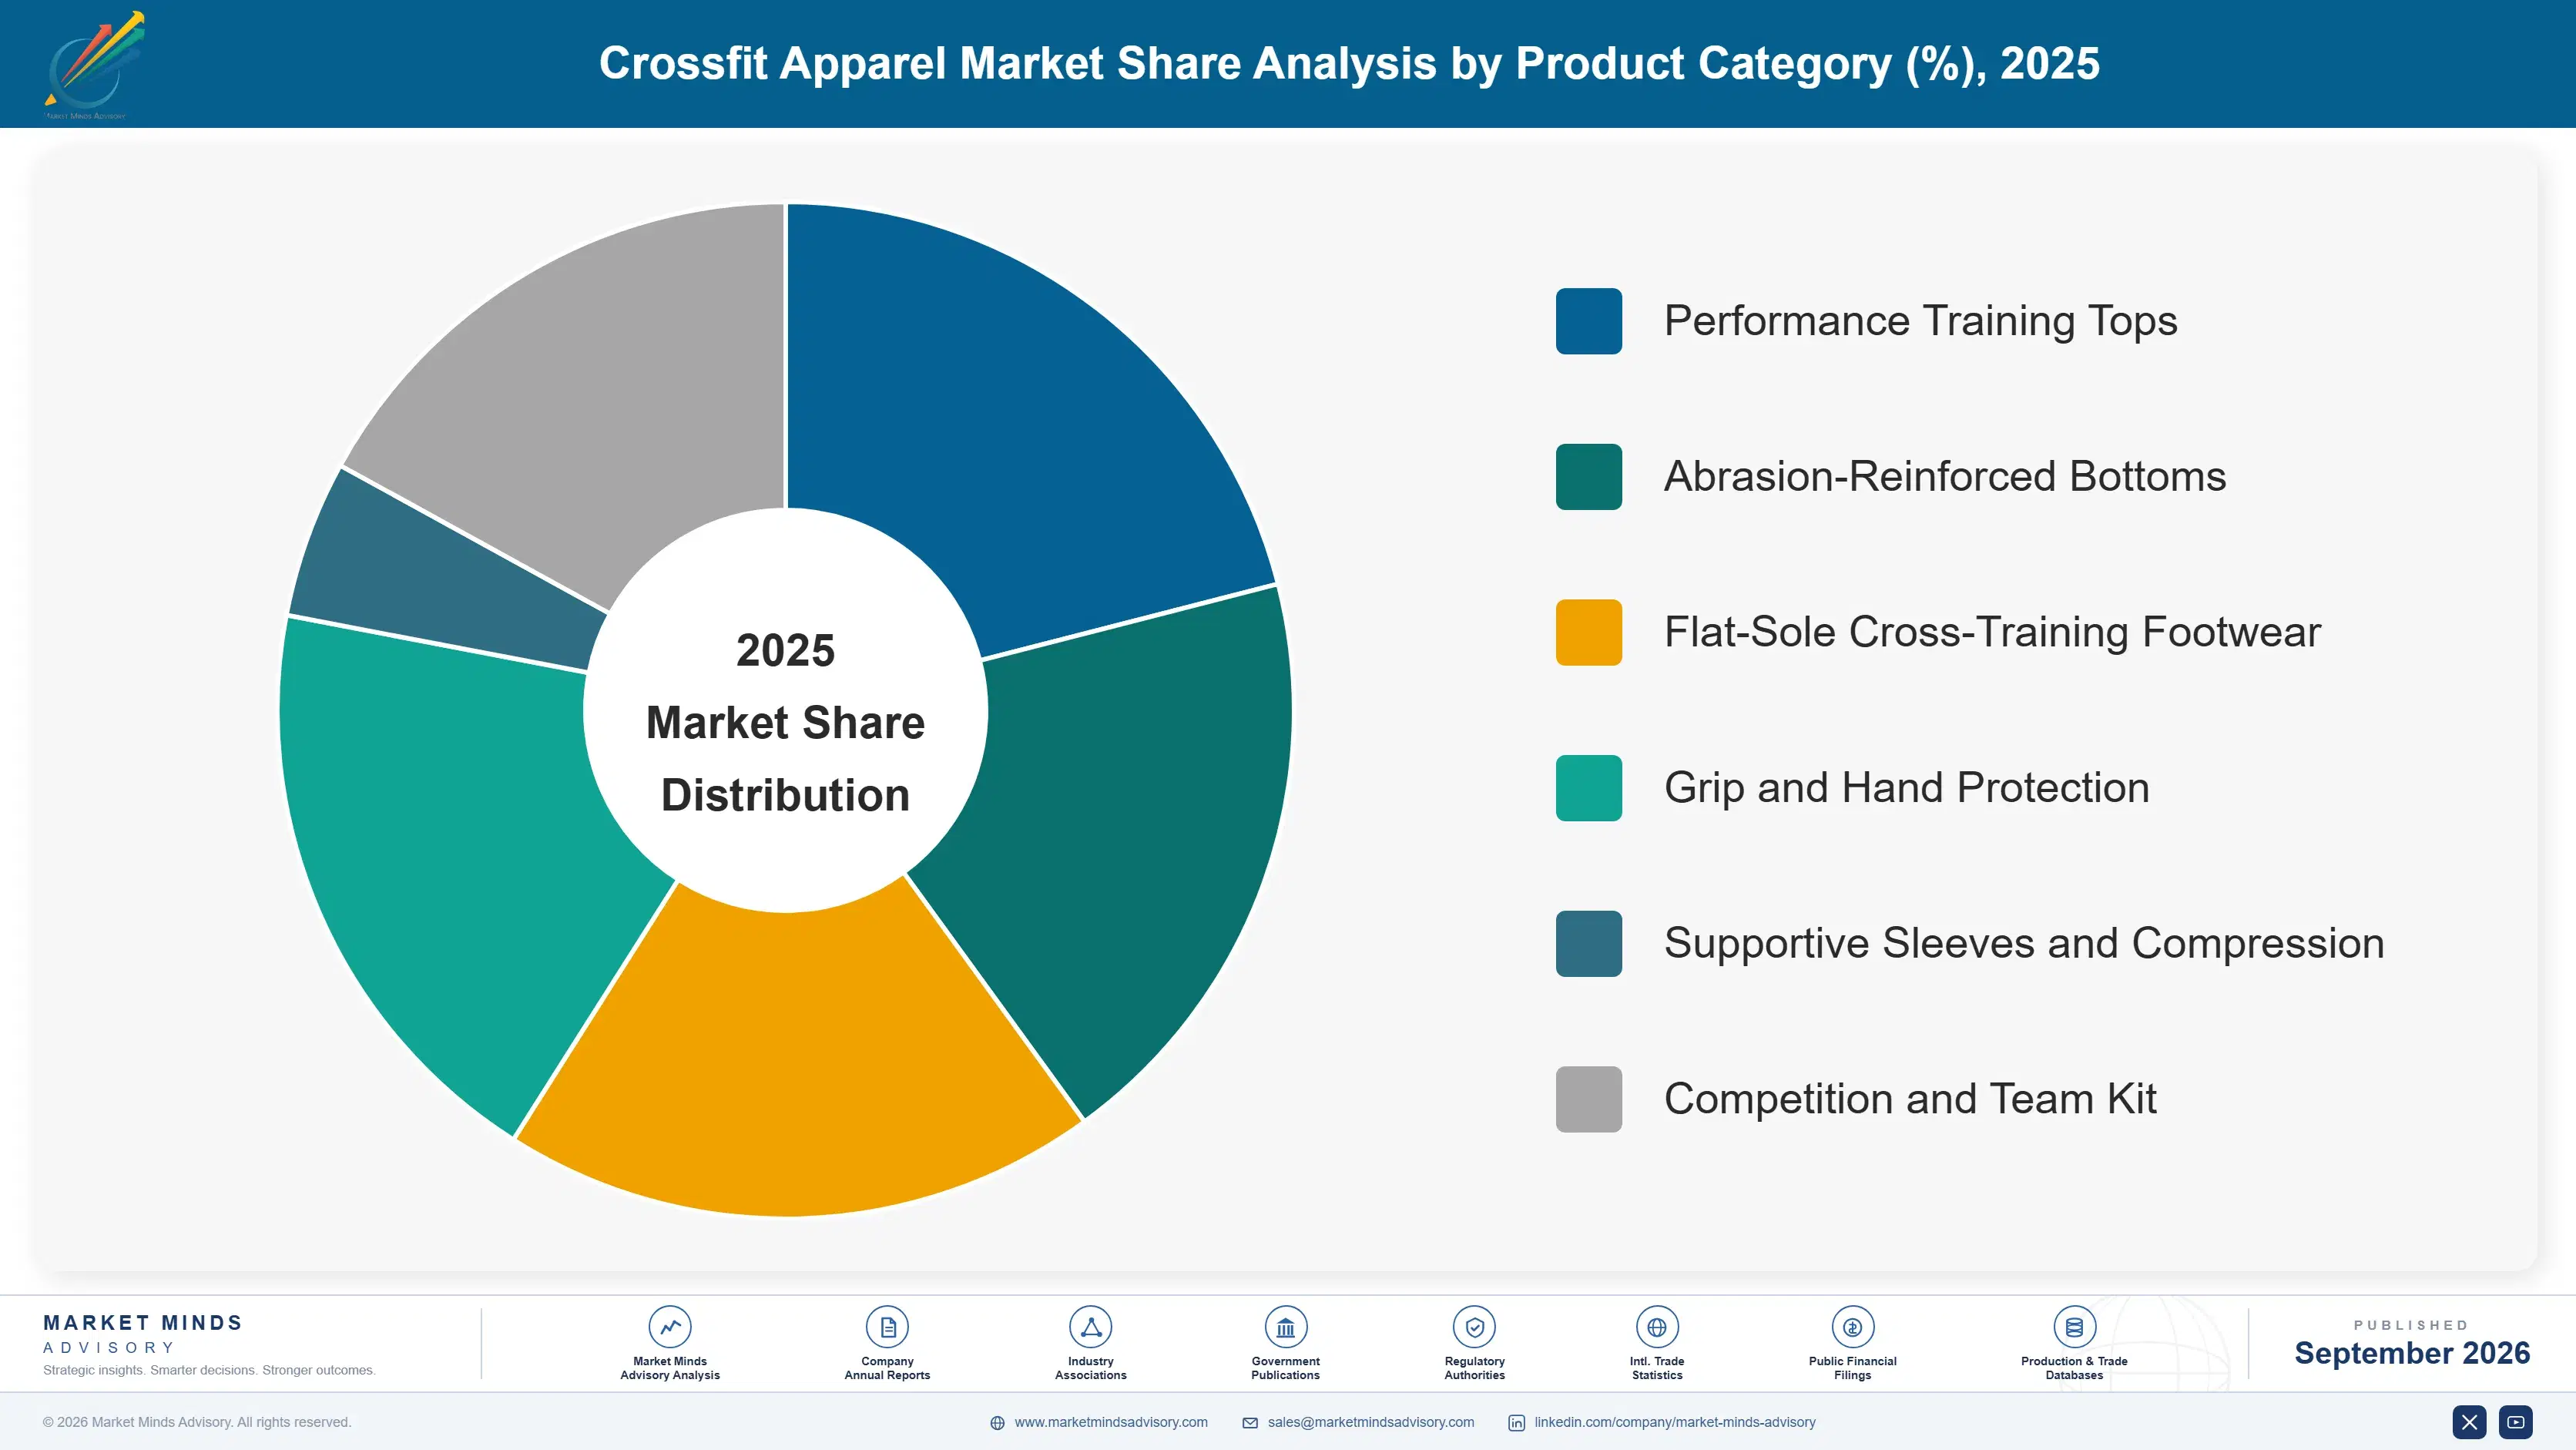
Segmentation follows product category across six groups: performance training tops, abrasion-reinforced bottoms, flat-sole cross-training footwear, grip and hand protection, supportive sleeves and compression, and competition and team kit. Participant intensity, price tier, and distribution channel are treated as separate dimensions rather than folded into this hierarchy. General athleisure, running apparel, and hard equipment fall outside the defined scope entirely.
crossfit-apparel-market-market-share-analysis-1790019197754

Grip And Hand Protection

Grip and hand protection grows at 11.7%, half again the market rate of 7.8%, on a need that becomes unavoidable rather than optional once training volume rises. Torn hands stop a participant training entirely, which makes grips a necessity purchase and largely immune to the discretionary pressure that affects apparel. Replacement runs on a wear cycle measured in months rather than years, giving the segment recurring revenue that garment categories cannot match. Material and construction differences between leather, synthetic, and carbon grip products are real and measurable, and unusually for this category buyers discuss them openly and in detail. Apparel-led brands consistently underbuild this line, and it is the most reliable revenue here.
CAGR 11.7%

Supportive Sleeves And Compression

Supportive sleeves and compression grow at 10.2% on knee, elbow, and wrist support that participants adopt as loading increases and joints start complaining. Neoprene thickness, stitching construction, and closure design determine both support and durability, and unlike apparel fabric these are specifications a buyer can compare directly. The segment sits between equipment and apparel commercially, sold through the same channels as grips and bought on the same reasoning. Replacement runs faster than garments because compression degrades measurably with washing and use. Sizing is also less contentious here than in apparel, which reduces return exposure considerably. Buyers compare thickness and stitching directly, which is unusual in this category and makes the segment reward genuine construction rather than marketing.
CAGR 10.2%
Full segment breakdown across 6 segments available in the complete report.

Regional Architecture and Country Demand Map

Regional shares reflect where functional fitness apparel is purchased rather than where it is manufactured. Two regions sit outside the standard bands, for reasons named in their own paragraphs and summarised below for operator review. Participation intensity and channel structure vary sharply between them, and each paragraph names the mechanism.

North America

The training methodology originated here and affiliate gym density remains the highest anywhere, which is a straightforward reason for the regional lead rather than a default assumption about consumer markets. Growth of 7.2% runs a little under the world rate. Affiliate channel dependence is highest here at well above the world figure, which makes the fragmentation of that network a regional exposure rather than a general one. Specialist direct brands have absorbed much of the displaced volume. Competition participation is proportionally larger than anywhere else covered. Specialist direct brands have absorbed much of the volume displaced by affiliate fragmentation, and they reach the experienced buyers who read construction rather than fabric marketing.
Share: 31% | CAGR: 7.2% (2026 to 2036)

Western Europe

Functional fitness gym density in Spain, the Nordics, and the Netherlands is among the highest anywhere and participation is well established rather than emerging. Growth of 6.3% is the slowest of the seven regions on a mature base. European textile labelling rules require fibre composition disclosure but say nothing about abrasion performance, which leaves the gap this category cares about unaddressed. Direct online channels are stronger here than affiliate distribution. Local specialist brands hold meaningful share against the global sportswear groups. Spanish and Nordic participation is unusually intense per participant, which raises replacement rates on abrasion-limited garments well above what the regional share suggests. Direct channels dominate. Affiliate distribution is comparatively weak across the region.
Share: 24% | CAGR: 6.3% (2026 to 2036)
Regional intelligence for 5 additional markets available in the complete report: East Asia, Latin America, South Asia and Pacific, Middle East and Africa, Eastern Europe. Contact sales@marketmindsadvisory.com.
crossfit-apparel-market-country-cagr-analysis-1790019198283

Where These Brands Build Position

Four commercial moves matter in a category that markets the wrong failure mode, sells a compromise shoe as a solution, and drafts garments for a population that does not exist. Each publishes or measures something the field currently leaves to a customer's second purchase to discover. None of the four requires a new fabric to be developed.

Publish Measured Abrasion Cycles Per Garment

Around 3% of products publish a measured abrasion figure while 64% of failures trace to abrasion, which means genuinely durable construction competes against fabric marketing on equal terms. Brands publishing measured cycles alongside reinforcement panel placement report price realisation 2.6 times higher than fabric-name equivalents. The test is standard textile laboratory work costing very little per style. Its absence is why durability engineering in this category currently earns nothing at all. Warranting against wear-through rather than only against manufacturing defect makes the claim land with a buyer who has already destroyed two pairs.
Market Impact: Raises achieved price realisation to 2.6 times higher

Draft Blocks For The Actual Body Proportions

Fit accounts for about 27% of returns because trained functional fitness athletes carry shoulder-to-waist and quadriceps-to-waist ratios that standard apparel blocks were never drafted around. Brands developing sport-specific blocks and publishing measured garment dimensions report return rates 3.1 times lower alongside materially better retention. A customer who cannot find a fit concludes the brand is not for them rather than that the size was wrong, which loses them permanently. Publishing measured garment dimensions rather than size letters costs nothing at all and removes most of the guesswork before an order is placed.
Market Impact: Cuts product return rates 3.1 times lower overall

Build The Protective Equipment Line Deliberately

Grip and hand protection grows at 11.7% and supportive sleeves at 10.2%, both on need that becomes unavoidable rather than optional once training volume rises. Brands holding protective lines alongside apparel report revenue per customer 2.4 times higher, because grips replace on a wear cycle measured in months while garments last years. That recurring element is also largely immune to the discretionary pressure that hits apparel spending during weak consumer periods. Material and construction differences between leather, synthetic, and carbon grips are real, measurable, and discussed openly by buyers in a way apparel fabric never is.
Market Impact: Raises revenue per customer to 2.4 times higher

Reduce Affiliate Channel Dependence Before It Falls

About 38% of category revenue still moves through affiliate gyms, and that network is fragmenting faster than direct channels are replacing it in several markets. Brands building direct and specialist retail reach ahead of the decline report revenue volatility 1.9 times lower through channel disruption. The affiliate relationship is genuinely valuable while it lasts and it is not something a brand controls. Building the alternative early costs considerably less than replacing the channel afterwards. Community channels reach the experienced buyers who read construction, and they are reachable directly rather than only through a gym relationship a brand does not own.
Market Impact: Cuts revenue volatility to 1.9 times lower overall

Who Controls the Margin Pool

Concentration is low. Five brands hold 34% of category revenue, measured consistently on that basis across all participants, and the remainder spreads across global sportswear groups treating this as a sub-line, specialist functional fitness brands, protective equipment makers serving the same customer, and a long tail of direct-to-consumer entrants reaching buyers through training communities. The leader to challenger gap is wide in footwear and almost absent in garments.
Competition currently turns on three dimensions: durability construction and whether it is measured or merely asserted; sport-specific pattern drafting, which decides whether the garment fits the population buying it; and protective equipment capability, where the most reliable recurring revenue in the category sits. Price decides among newer participants, who still account for the large majority of units bought across every region covered.

Pressure builds from two directions at once. Affiliate gym distribution is fragmenting and taking a large share of revenue with it. Global sportswear groups treat the category as a sub-line and price accordingly. Rankings will shift toward brands holding published durability data and protective equipment lines rather than apparel breadth alone. Brands holding only moisture-marketed apparel are the most exposed here.
crossfit-apparel-market-company-positioning-matrix-1790019198815

Competitive Moat and Risk Dimensions

NIKE

Moat: Scale And Footwear Development

Footwear development capability and manufacturing scale let a single brand iterate outsole and midsole design faster than specialist competitors while absorbing the tooling cost across far larger volumes. Cross-training footwear is the most technically demanding part of this category and the hardest for a small brand to enter credibly.
NIKE

Risk: Category Treated As Sub-Line

Treating functional fitness as one line within a much larger athletic business produces development priorities shaped by running and basketball rather than by rope climbs and barbell abrasion. That leaves the durability and pattern problems this category actually has to specialist brands who take them seriously.
NOBULL

Moat: Community Credibility And Durability Focus

Credibility built inside training communities rather than through general sportswear marketing reaches the buyers who have destroyed kit and started reading construction. Those buyers are small in number, disproportionately influential in the channels this category depends on, and effectively unreachable through conventional advertising. Conventional advertising does not reach them at all.
NOBULL

Risk: Affiliate Channel Concentration

A position built inside affiliate gyms and competition culture carries exposure to a network that is fragmenting faster than direct channels are replacing it. That concentration is highest in North America, which is also where the brand's revenue is most heavily weighted at present. Building direct reach early costs less than replacing the channel later.

Players Tracked

Prominent Players

Nike
Reebok
NOBULL
Rogue Fitness
Under Armour

Other Key Players

Adidas
Lululemon Athletica
Puma
Gymshark
TYR Sport
Born Primitive
Bear KompleX
Rehband
Victory Grips
WOD Nation
PicSil
2POOD
Alphalete Athletics
Vuori
Ten Thousand

Recent Developments

MARCH 2026

NOBULL Publishes Measured Abrasion Cycles Across Its Training Range

NOBULL began publishing measured abrasion resistance cycles alongside reinforcement panel diagrams for every training garment. The disclosure puts a comparable durability figure where fabric names and moisture claims have carried the category's marketing. Wear-through warranty terms were introduced alongside the published figures across the whole range.
Signal: A measured figure lets durability engineering finally command a price. Durability engineering had been earning nothing until now.
SEPTEMBER 2025

Rogue Fitness Expands Grip And Protective Equipment Production

Rogue Fitness completed an organic expansion of grip and hand protection manufacturing, funded internally with no partner involved. Management cited recurring replacement demand on a wear cycle measured in months rather than any apparel growth. Capacity was added ahead of contracted demand rather than behind it.
Signal: Protective equipment is the recurring revenue apparel brands keep overlooking. Months-long replacement beats years-long replacement commercially.
MAY 2025

Under Armour Acquires Sport-Specific Pattern Drafting Business

Under Armour completed an acquisition of a pattern and fit development business specialising in athlete body proportions outside standard apparel blocks. The transaction was an outright acquisition rather than a joint venture or minority stake. Fit development staff transferred with the business under agreed terms.
Signal: Fit returns are being treated as a drafting problem rather than a sizing one. Drafting fixes what sizing charts describe.

What Training Kit Costs

Three cost groups dominate on the apparel side. Performance fabric and trim run 32% to 40% of cost of goods sold, and the eight-point range separates abrasion-engineered constructions from standard performance knits. Cut, make, and reinforcement labour take 26% to 34%, rising sharply where panel reinforcement and flatlock placement are specified properly. Branding, marketing allowance, and returns handling account for 22% to 30% across the range.
Synthetic performance fibre pricing moved through 2024 and 2025 on petrochemical feedstock and freight together, and United States Census Bureau trade data recorded the movements across the period. Several apparel groups described returns handling as the faster-rising cost line in their annual reports rather than materials. Leather and synthetic grip materials followed entirely separate cycles of their own. The three moved independently. Returns handling rose fastest of the three.

The competitive disadvantage mechanism runs through returns rather than through materials. A brand with fit returns near the category rate of 27% carries handling, restocking, and lost customer cost that a brand with properly drafted blocks does not, and that expense scales with revenue rather than falling with volume. Exposure varies by pattern development rather than scale, and fast-growing direct brands carry it most heavily.
crossfit-apparel-market-cost-volatility-analysis-1790019199013

Invest In Pattern Drafting Before Fabric Development

Fit returns cost handling, restocking, and the customer, while fabric upgrades rarely change a purchase decision a buyer cannot evaluate before wearing the garment. Pattern development for the actual body proportions of this population moves the largest avoidable cost line in the category and does so permanently rather than per season. It is the largest avoidable cost here.

Specify Abrasion Performance In Sourcing Briefs

Abrasion resistance is a measurable textile property that costs very little to test and almost nothing to specify, yet sourcing briefs in this category routinely name fabric compositions instead. Writing measured cycles into the brief produces garments that survive the use case and gives the brand a figure worth publishing afterwards. Sourcing briefs here name compositions instead of performance.

Contract Synthetic Fibre Against Petrochemical Cycles

Performance synthetic fibre pricing follows petrochemical feedstock and freight at volumes this category cannot influence in any direction. Contracting against those cycles rather than against seasonal buying calendars removes most of the exposure and secures allocation through the periods when larger apparel buyers are competing. Seasonal buying calendars and petrochemical cycles never align usefully.

Portfolio Architecture for Margin Defence

Margin follows measurable difference and recurring purchase rather than fabric marketing. Basic training tops compete close to commodity terms against general activewear the customer could buy anywhere. Competition and team kit earns modestly on association. Abrasion-engineered bottoms earn well where construction is published, and protective equipment earns most, because it replaces on a wear cycle measured in months rather than years.
The tension between volume and premium runs through whether the buyer has broken anything yet. A newer participant comparing two pairs of leggings sees similar fabric claims and a price difference, and price decides. A participant on their third pair, who knows exactly where rope climbs wear through and what a properly placed flatlock seam does, is buying construction and pays substantially more for a brand that shows it.

High-value pools concentrate in grip and protective equipment with its months-long replacement cycle, in abrasion-engineered garments with published measurement, and in sport-specific fits that reduce the 27% of returns attributed to fit. Where the product is a training top sold on moisture management, general activewear brands compete directly and hold both scale and distribution advantages.

Volume / Commodity-Adjacent

Basic training tops and entry bottoms sold on moisture management and fabric names at accessible price points. The twelve-point range reflects sourcing position and channel cost rather than any construction difference a buyer could evaluate before wearing it.
Gross Margin: 38% to 50%

Premium / Certified

Cross-training footwear and competition kit where tooling, outsole development, and brand association carry genuine cost and credibility. The twelve-point range separates real footwear development capability from general athletic shoes repositioned for the category.
Gross Margin: 54% to 66%

Sustainability / Regulatory / Next-Generation

Abrasion-engineered garments with published measurement, sport-specific drafted fits, and protective equipment lines. The fourteen-point range reflects pattern and durability development depth, neither of which can be assembled in a single season.
Gross Margin: 70% to 84%
crossfit-apparel-market-portfolio-architecture-1790019199517

High-value Sub-segments and Strategic Watch-out

Grip And Protective Equipment Lines

Highest value in the category because replacement runs on a wear cycle measured in months rather than years. The fourteen-point range reflects material and construction depth, which buyers here discuss openly and compare in unusual detail. Apparel-led brands consistently underbuild this line almost without exception.
Gross Margin: 72% to 86%

Published Abrasion Garment Ranges

High value where a measured figure lets durability engineering command a price it currently cannot obtain anywhere. The fourteen-point range reflects construction depth against brands printing fabric names and moisture claims instead. The test costs very little and almost nobody runs it. That is the opening.
Gross Margin: 62% to 76%

Sport-Specific Drafted Fits

Volume core addressing the 27% of returns attributed to fit in a population standard blocks were never drafted around. The twelve-point range reflects pattern development investment, which pays permanently rather than per season. A customer who cannot find a fit leaves the brand permanently rather than temporarily.
Gross Margin: 54% to 66%

Moisture-Marketed Training Tops

The strategic watch-out. Sold on the wrong failure mode against general activewear brands holding scale and distribution advantages. The twelve-point range reflects sourcing and channel position, with nothing else defending the volume. Abrasion rather than moisture is what actually ends these garments in every case.
Gross Margin: 36% to 48%

How This Demand Repeats

Replacement runs on wear rather than on season, which is unusual in apparel and commercially favourable. Garments fail through abrasion at rates set by training frequency, so a participant training five times a week replaces bottoms several times faster than one training twice. That ties revenue to activity rather than to fashion cycles, and it means the most engaged customers are also the most valuable by a wide margin.
Protective equipment repeats faster still and on a genuinely different basis. Grips wear through in months under regular use, sleeves lose compression measurably with washing, and neither purchase is discretionary once a participant has torn a hand or aggravated a knee. That recurring element is the most reliable revenue in the category and the part apparel-led brands most consistently underbuild.

The buyer profile changes with tenure rather than with demographics. A newer participant buys on appearance and fabric claims, and a participant on their third pair of bottoms buys on reinforcement placement and seam construction. The second group is small, growing, and disproportionately influential inside the communities where this category forms demand, and brands publishing construction detail are the only ones reaching them.
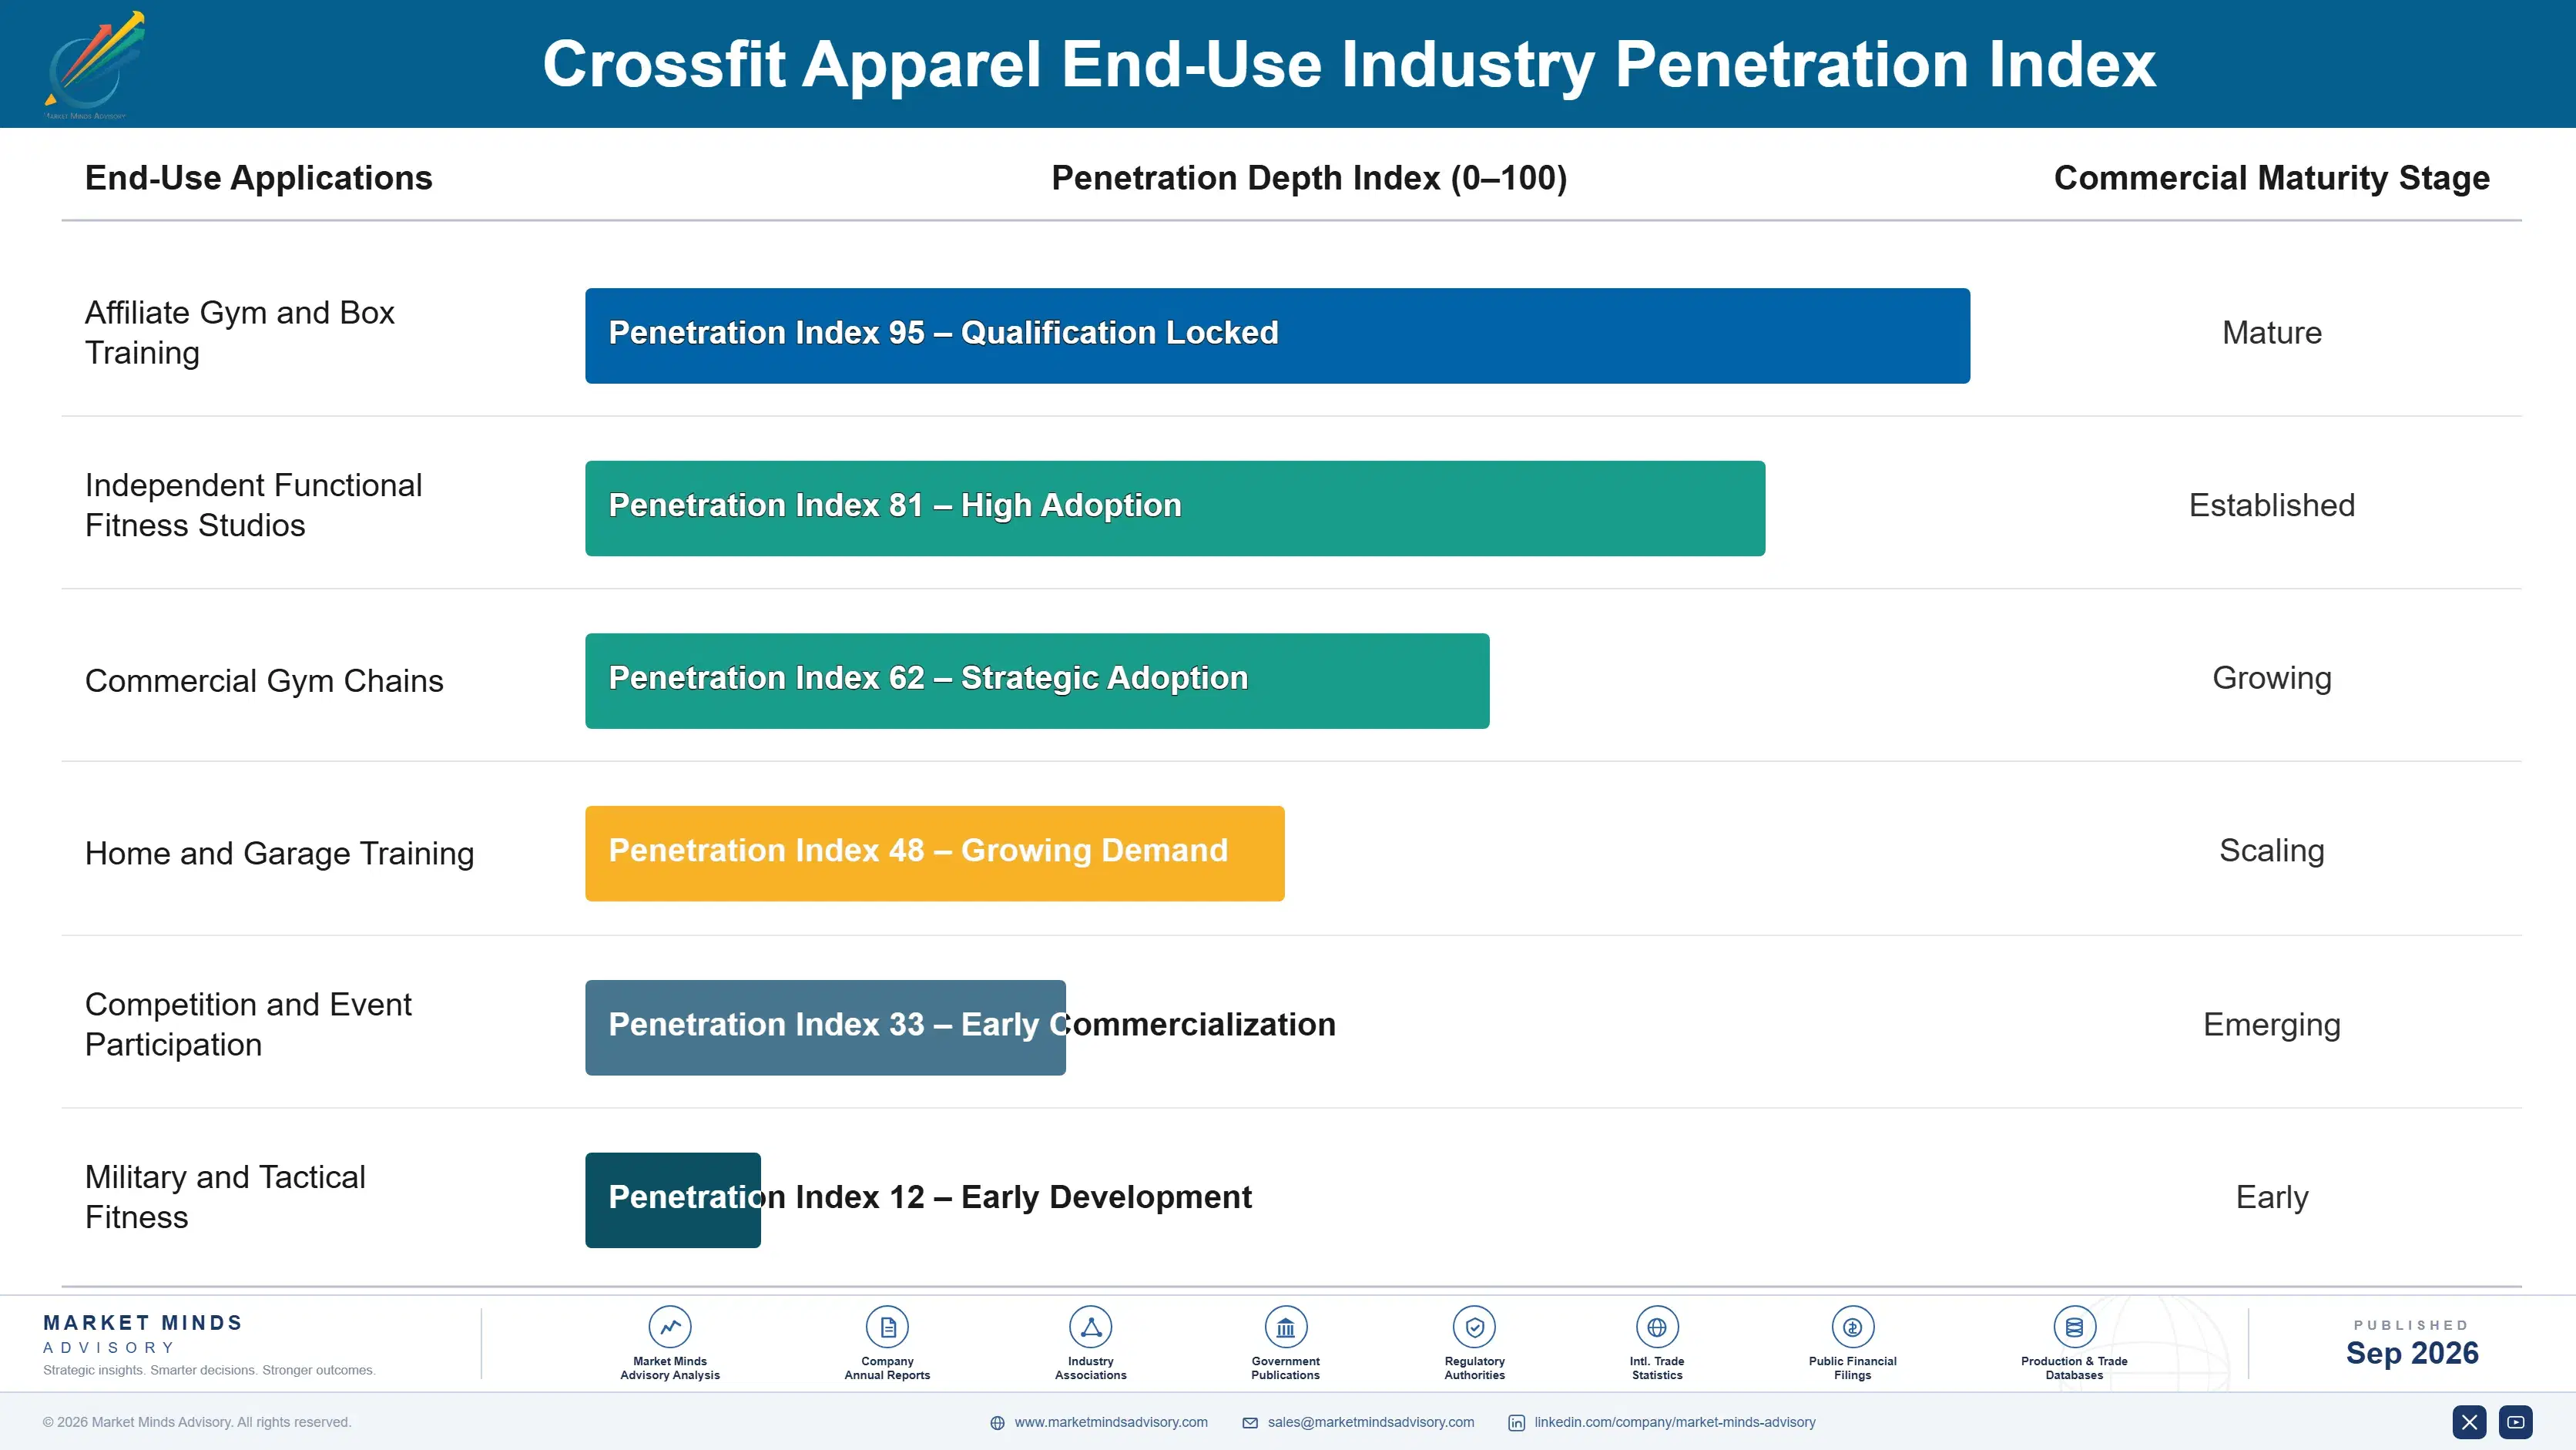
crossfit-apparel-market-end-use-penetration-index-1790019200011

Where This Market Rewards

These are among the four positions where our research anticipates prominent divergence between winners and laggards over the coming forecast period. Each is grounded in the demand model, the regulatory perimeter, and the announced capacity pipeline.
01 / ABRASION MEASUREMENT PUBLISHING

Clothes die of friction, not sweat

Around 64% of garment failures in this category trace to abrasion while only about 3% of products publish a measured abrasion figure of any kind. Brands publishing measured cycles alongside reinforcement panel placement report price realisation 2.6 times higher than fabric-name equivalents achieve. The test is standard textile laboratory work costing very little per style, and its absence is precisely why durability engineering currently earns nothing, and warranting against wear-through rather than mere defect is what makes the claim land properly.
02 / SPORT-SPECIFIC PATTERN DRAFTING

Standard blocks fit nobody here

Fit accounts for about 27% of returns because trained functional fitness athletes carry shoulder-to-waist and quadriceps-to-waist ratios that standard apparel blocks were never drafted around at all. Brands developing sport-specific blocks and publishing measured garment dimensions report return rates 3.1 times lower alongside materially better retention. A customer who cannot find a fit concludes the brand is not for them, which loses them permanently rather than temporarily, and publishing measured garment dimensions rather than size letters costs nothing at all.
03 / PROTECTIVE EQUIPMENT BUILDING

Grips replace in months not years

Grip and hand protection grows at 11.7% and supportive sleeves at 10.2%, both on need that becomes unavoidable rather than optional once a participant's training volume rises. Brands holding protective lines alongside apparel report revenue per customer 2.4 times higher, because grips replace on a months-long wear cycle while garments last years. That recurring element is also largely immune to discretionary spending pressure in weak periods, and construction differences between grip materials are discussed openly by buyers in this category.
04 / CHANNEL DEPENDENCE REDUCTION

The affiliate base is fragmenting

About 38% of category revenue still moves through affiliate gyms, and that network is fragmenting faster than direct channels are replacing it across several important markets. Brands building direct and specialist retail reach ahead of the decline report revenue volatility 1.9 times lower through channel disruption. The affiliate relationship is genuinely valuable while it lasts, and it is not something any apparel brand actually controls, and building the alternative early costs considerably less than replacing that channel after it has gone.

Engagement Snapshot From the Field

A live engagement with an industry participant carrying material or product regulatory and market exposure ahead of a defining policy shift, showing how our research translates into a defensible multi-year portfolio strategy.
MARKET MINDS ADVISORY · CLIENT ENGAGEMENT SUMMARY
Crossfit Apparel Producer Strategic Portfolio Review and Transition Roadmap 2026·Investment Scenario on Crossfit Apparel Exposure Evaluation 2025-26
CLIENT PROFILE
A functional fitness apparel brand with revenue near USD 68 million (client-reported, unverified by MMA) across North America, Western Europe, and Brazil. Return rates had risen for three consecutive years while repeat purchase fell, and the development team had allocated the next season's budget to new fabric technology. No return had ever been coded by measured cause. Fabric had been the default answer for three seasons.
STRATEGIC CHALLENGE
Returns were coded broadly as quality issues without separating fit from durability, and nobody had established which of the two was actually driving the increase. The proposed fabric investment addressed moisture management, which no return in the sample had mentioned at any point. Fit and durability were being treated as a single quality signal.
MMA APPROACH
MMA recoded two years of returns by measured cause, surveyed lapsed customers on why they had stopped buying, ran abrasion testing on the brand's garments against six competitor benchmarks, and measured body dimensions across a sample of active customers against the brand's size blocks. Customer measurements were taken directly rather than inferred from returned sizes, so the block comparison held.
KEY FINDINGS
  1. Fit accounted for the large majority of returns and had risen steadily, while moisture management appeared in none of the coded return reasons across the whole sample.
  2. Customer body measurements diverged substantially from the brand's blocks at shoulder and quadriceps relative to waist, which explained the fit pattern precisely.
  3. Abrasion testing placed the brand's bottoms mid-field against benchmarks despite marketing that implied superior durability to all of them. Two benchmarks tested materially better.
  4. Lapsed customers cited wearing through bottoms at the rope climb contact point far more often than any fabric or moisture complaint. Nobody had asked them before.
CLIENT PROFILE
A functional fitness apparel brand with revenue near USD 68 million (client-reported, unverified by MMA) across North America, Western Europe, and Brazil. Return rates had risen for three consecutive years while repeat purchase fell, and the development team had allocated the next season's budget to new fabric technology. No return had ever been coded by measured cause. Fabric had been the default answer for three seasons.
STRATEGIC CHALLENGE
Returns were coded broadly as quality issues without separating fit from durability, and nobody had established which of the two was actually driving the increase. The proposed fabric investment addressed moisture management, which no return in the sample had mentioned at any point. Fit and durability were being treated as a single quality signal.
MMA APPROACH
MMA recoded two years of returns by measured cause, surveyed lapsed customers on why they had stopped buying, ran abrasion testing on the brand's garments against six competitor benchmarks, and measured body dimensions across a sample of active customers against the brand's size blocks. Customer measurements were taken directly rather than inferred from returned sizes, so the block comparison held.
KEY FINDINGS
  1. Fit accounted for the large majority of returns and had risen steadily, while moisture management appeared in none of the coded return reasons across the whole sample.
  2. Customer body measurements diverged substantially from the brand's blocks at shoulder and quadriceps relative to waist, which explained the fit pattern precisely.
  3. Abrasion testing placed the brand's bottoms mid-field against benchmarks despite marketing that implied superior durability to all of them. Two benchmarks tested materially better.
  4. Lapsed customers cited wearing through bottoms at the rope climb contact point far more often than any fabric or moisture complaint. Nobody had asked them before.
RECOMMENDED STRATEGY
Phase 1: Phase one: redirect the fabric budget into drafting sport-specific blocks from measured customer dimensions rather than from standard apparel sizing. Phase 2: Phase two: specify measured abrasion cycles in sourcing briefs and add reinforcement at the contact points customers actually wear through. Phase 3: Phase three: publish measured abrasion figures and garment dimensions rather than fabric names and size letters. Show reinforcement placement in product imagery.
OUTCOME
Return rates fell by roughly half within two seasons of the redrafted blocks shipping (client-reported, unverified by MMA). No new fabric was developed. Measured cause coding and published garment dimensions are now standard across the brand's entire range. Repeat purchase recovered above its level three seasons earlier within the year.

Frequently Asked Questions

Foundational context covering the market sizes, CAGR, scope, country, region and competition that inform every finding below. This section is provided to cover basics and most often pre-purchase conversations, answered from the MMA Primary Research Dataset.

What is the current size of the Crossfit Apparel Market?

The market was worth USD 2.9 billion in 2025 and stands at USD 3.1 billion in 2026. Value covers functional fitness apparel, footwear, and worn protective equipment at brand selling price.

How large will the Crossfit Apparel Market be by 2036?

MMA forecasts USD 6.6 billion by 2036, an increase of USD 3.5 billion across the forecast period. That represents 2.13 times the 2026 base of USD 3.1 billion.

What is the CAGR for the Crossfit Apparel Market 2026 to 2036?

The base case compound annual growth rate is 7.8%, with a bull case at 9.0% and a bear case at 6.6%. Historical growth from 2020 to 2025 ran at 6.7%.

Which segment is growing fastest?

Grip and hand protection grows at 11.7%, half again the market rate of 7.8%. Torn hands stop training, which makes it a necessity purchase rather than a preference.

Who are the major companies in the Crossfit Apparel Market?

Nike, Reebok, NOBULL, Rogue Fitness and Under Armour lead the field. Together they hold 34% of category revenue, with specialist and direct brands holding the remainder.

Which country is growing fastest?

Brazil grows at 12.4%, on functional fitness gym density among the highest anywhere and a training culture that treats the discipline as mainstream rather than niche.

Report Segmentation Architecture

The full report scope spans multiple orthogonal segmentation dimensions, with cross-tabulated demand data provided for each dimension pair. Coverage extends further to regional breakdowns, trend trajectories, and the competitive detail needed to support segment-level decision-making.

By Product Category

  • Performance Training Tops
  • Abrasion-Reinforced Bottoms
  • Flat-Sole Cross-Training Footwear
  • Grip and Hand Protection
  • Supportive Sleeves and Compression
  • Competition and Team Kit

By End-Use Industry

  • Affiliate Gym and Box Training
  • Independent Functional Fitness Studios
  • Commercial Gym Chains
  • Home and Garage Training
  • Competition and Event Participation
  • Military and Tactical Fitness

By Commercial Dimension

  • Affiliate Gym Retail
  • Direct to Consumer Online
  • Specialist Sporting Goods Retail
  • Multi-Brand Athletic Retail
  • Event and Competition Channels
  • Team and Bulk Kit Supply

By Region

  • North America
  • Western Europe
  • East Asia
  • Latin America
  • South Asia and Pacific
  • Middle East and Africa
  • Eastern Europe

Scope, Methodology, and Coverage

Every figure in this report is reproducible from documented input assumptions. The scope below maps the historical period, the forecast horizon, the segmentation dimensions, and the countries covered, alongside the underlying primary and qualitative methodology.
Historical Period
2020 to 2025
Forecast Period
2026 to 2036
Base Year
2025 (USD billions; MMA Primary Research Dataset, September 2026)
Market Definition
This market covers performance apparel, footwear, and worn protective equipment designed for high-intensity functional fitness training, across performance training tops, abrasion-reinforced bottoms, flat-sole cross-training footwear, grip and hand protection, supportive sleeves and compression, and competition and team kit. It excludes general athleisure and lifestyle activewear, running-specific apparel and footwear, weightlifting belts and hard equipment, gym equipment, and licensed spectator merchandise.
Quantitative Units
USD billions, revenue at brand selling price
Segmentation Dimensions
Product category, training setting, commercial dimension, region
Regions Covered
North America, Western Europe, East Asia, Latin America, South Asia and Pacific, Middle East and Africa, Eastern Europe
Countries Covered
United States, Canada, Mexico, Spain, United Kingdom, Germany, France, Italy, Netherlands, Sweden, Denmark, Poland, Czechia, China, Japan, South Korea, Taiwan, Brazil, Argentina, Colombia, Chile, Peru, India, Indonesia, Thailand, Australia, New Zealand, Saudi Arabia, United Arab Emirates, South Africa
Key Companies Profiled
Nike, Reebok, NOBULL, Rogue Fitness, Under Armour, Adidas, Lululemon Athletica, Puma, Gymshark, TYR Sport, Born Primitive, Bear KompleX, Rehband, Victory Grips, WOD Nation, PicSil, 2POOD, Alphalete Athletics, Vuori, Ten Thousand
Quantitative Methodology
Primary survey, n=3,800 respondents, Q4 2025, six countries; demand-side model with trade association cross-validation
Qualitative Methodology
47 expert interviews, Q4 2025; applied to validate demand model assumptions, identify emerging dynamics, and assess competitive positioning
Report Format
PDF and XLSX data workbook (Word format preview document)
Publisher
Market Minds Advisory
Report Code
MMA-2026-CON-671
Published
September 2026
Contact
sales@marketmindsadvisory.com | www.marketmindsadvisory.com

Purchase the full Crossfit Apparel Market Report (2026 to 2036).

The full report sizes the functional fitness apparel market across six product categories, seven regions, and thirty countries, with forecasts to 2036 under base, bull, and bear cases. It identifies abrasion rather than moisture as the dominant failure mode, measures how rarely abrasion data is published, and quantifies fit returns against the body proportions this population actually carries. Competitive analysis covers twenty participants evaluated consistently on category revenue, with detailed treatment of durability construction and protective equipment capability. Affiliate channel dependence and its fragmentation are analysed throughout. Primary research includes 3,800 survey responses and 47 expert interviews.
Six product categories sized and forecast separately
Twenty participants evaluated on category revenue consistently
Garment failures coded by measured cause rather than description
Abrasion data disclosure quantified across the whole field
Fit returns measured against actual customer body proportions
Affiliate channel dependence assessed by brand and region

Built For The People Who Decide

From boardroom strategy to bench-side execution, this report is read cover-to-cover by leaders shaping the next decade of their industry, turning demand scenarios, market dynamics and valuation benchmarks into decisions.
CXOs/ Presidents/ VPs/ Managers
M&A and Corporate Development
Strategy Teams and R&D Heads
Procurement and Product Directors
Regulatory and Compliance Leaders
Investor Relations and Equity Analysts