Market Minds Advisory
Cross-cloud Analytics Market

Cross-cloud Analytics Market: Cross-cloud Analytics Market. Multi-Cloud Governance Meets Unified Data Visibility Demand

Enterprise IT leaders running workloads across multiple cloud providers are pushing analytics vendors toward unified cost and performance visibility, forcing suppliers to balance integration depth against rising data egress and licensing costs.

Lead Analyst

Published

September 2026

Make Smarter Decisions with Customized Research Insights

Request a free sample report and evaluate market opportunities, growth trends, and competitive dynamics relevant to your business needs.

2025 MARKET VALUE$6.8BMarket Size 2025
2036 FORECAST VALUE$27.1BBase Case , 2026 to 2036
CAGR 2026 TO 203613.4 %Bull 14.7% / Bear 12.1%
INCREMENTAL OPPORTUNITY$19.4BNet 10- year value creation
EXPANSION MULTIPLE3.52x2036 value over 2026 base
Strategic Levers
M&A Pipeline
Regional Outlook
Country Rankings
Competitive Intelligence
Segmental Deep-dive
Call-Us : 91 93563 13602

Executive Snapshot and Market Trajectory.

Enterprises running workloads across two or more cloud providers are demanding unified analytics that a single-cloud dashboard cannot deliver, a gap most vendors underestimated only a few years ago. IT leaders managing separate dashboards per provider are now consolidating around unified platforms. Few predicted this shift moving so fast.
Unified multi-cloud cost governance platforms, which track spend and performance across providers in one interface, are pulling ahead of single-cloud native tools as enterprises confront runaway cloud spending. Adoption concentrates most heavily in North America and among enterprises managing workloads across three or more providers simultaneously. Vendors that can demonstrate proven multi-provider integration are winning enterprise contracts that single-cloud specialists cannot match. Certification of multi-provider compatibility increasingly shapes procurement decisions across the buyer base.
Competitive character is shifting from cloud-native monitoring tools toward independent cross-platform vendors, a shift that rewards suppliers with proven multi-provider integration over single-cloud specialists. Rising enterprise cloud spend and mandatory cost transparency mandates are both reinforcing demand even as data egress costs complicate cross-cloud data movement. Vendors slow to solve data egress friction risk losing ground to better-integrated competitors building native cross-cloud pipelines and dedicated cost governance tooling.
Market Definition
This market covers software platforms that aggregate cost, performance, and usage analytics across multiple public cloud providers into a single unified interface. It excludes single-cloud native monitoring tools and general-purpose business intelligence software.
Base Year Value
$6.8B in 2025 (MMA Primary Research Dataset, September 2026)
Forecast Period
2026 to 2036, eleven discrete annual values
CAGR
13.4% base case. Bull 14.7%. Bear 12.1%.
Fastest Growth Segment
Unified Multi-Cloud Cost Governance Platforms: 19.8% CAGR
Fastest Growth Country
India: 17.2% CAGR
Fastest Growth Region
South Asia and Pacific: 15.6% CAGR
Largest Region
North America: 32% of 2025 global value
Market Leaders
Datadog, CloudHealth by VMware, Flexera, Densify, Apptio. Source: MMA Analysis based on company annual reports.
Primary Survey
n=3,800 procurement and R&D decision-makers, Q4 2025, six countries
Methodology
Demand-side build-up, cross-validated against public data, 47 expert interviews

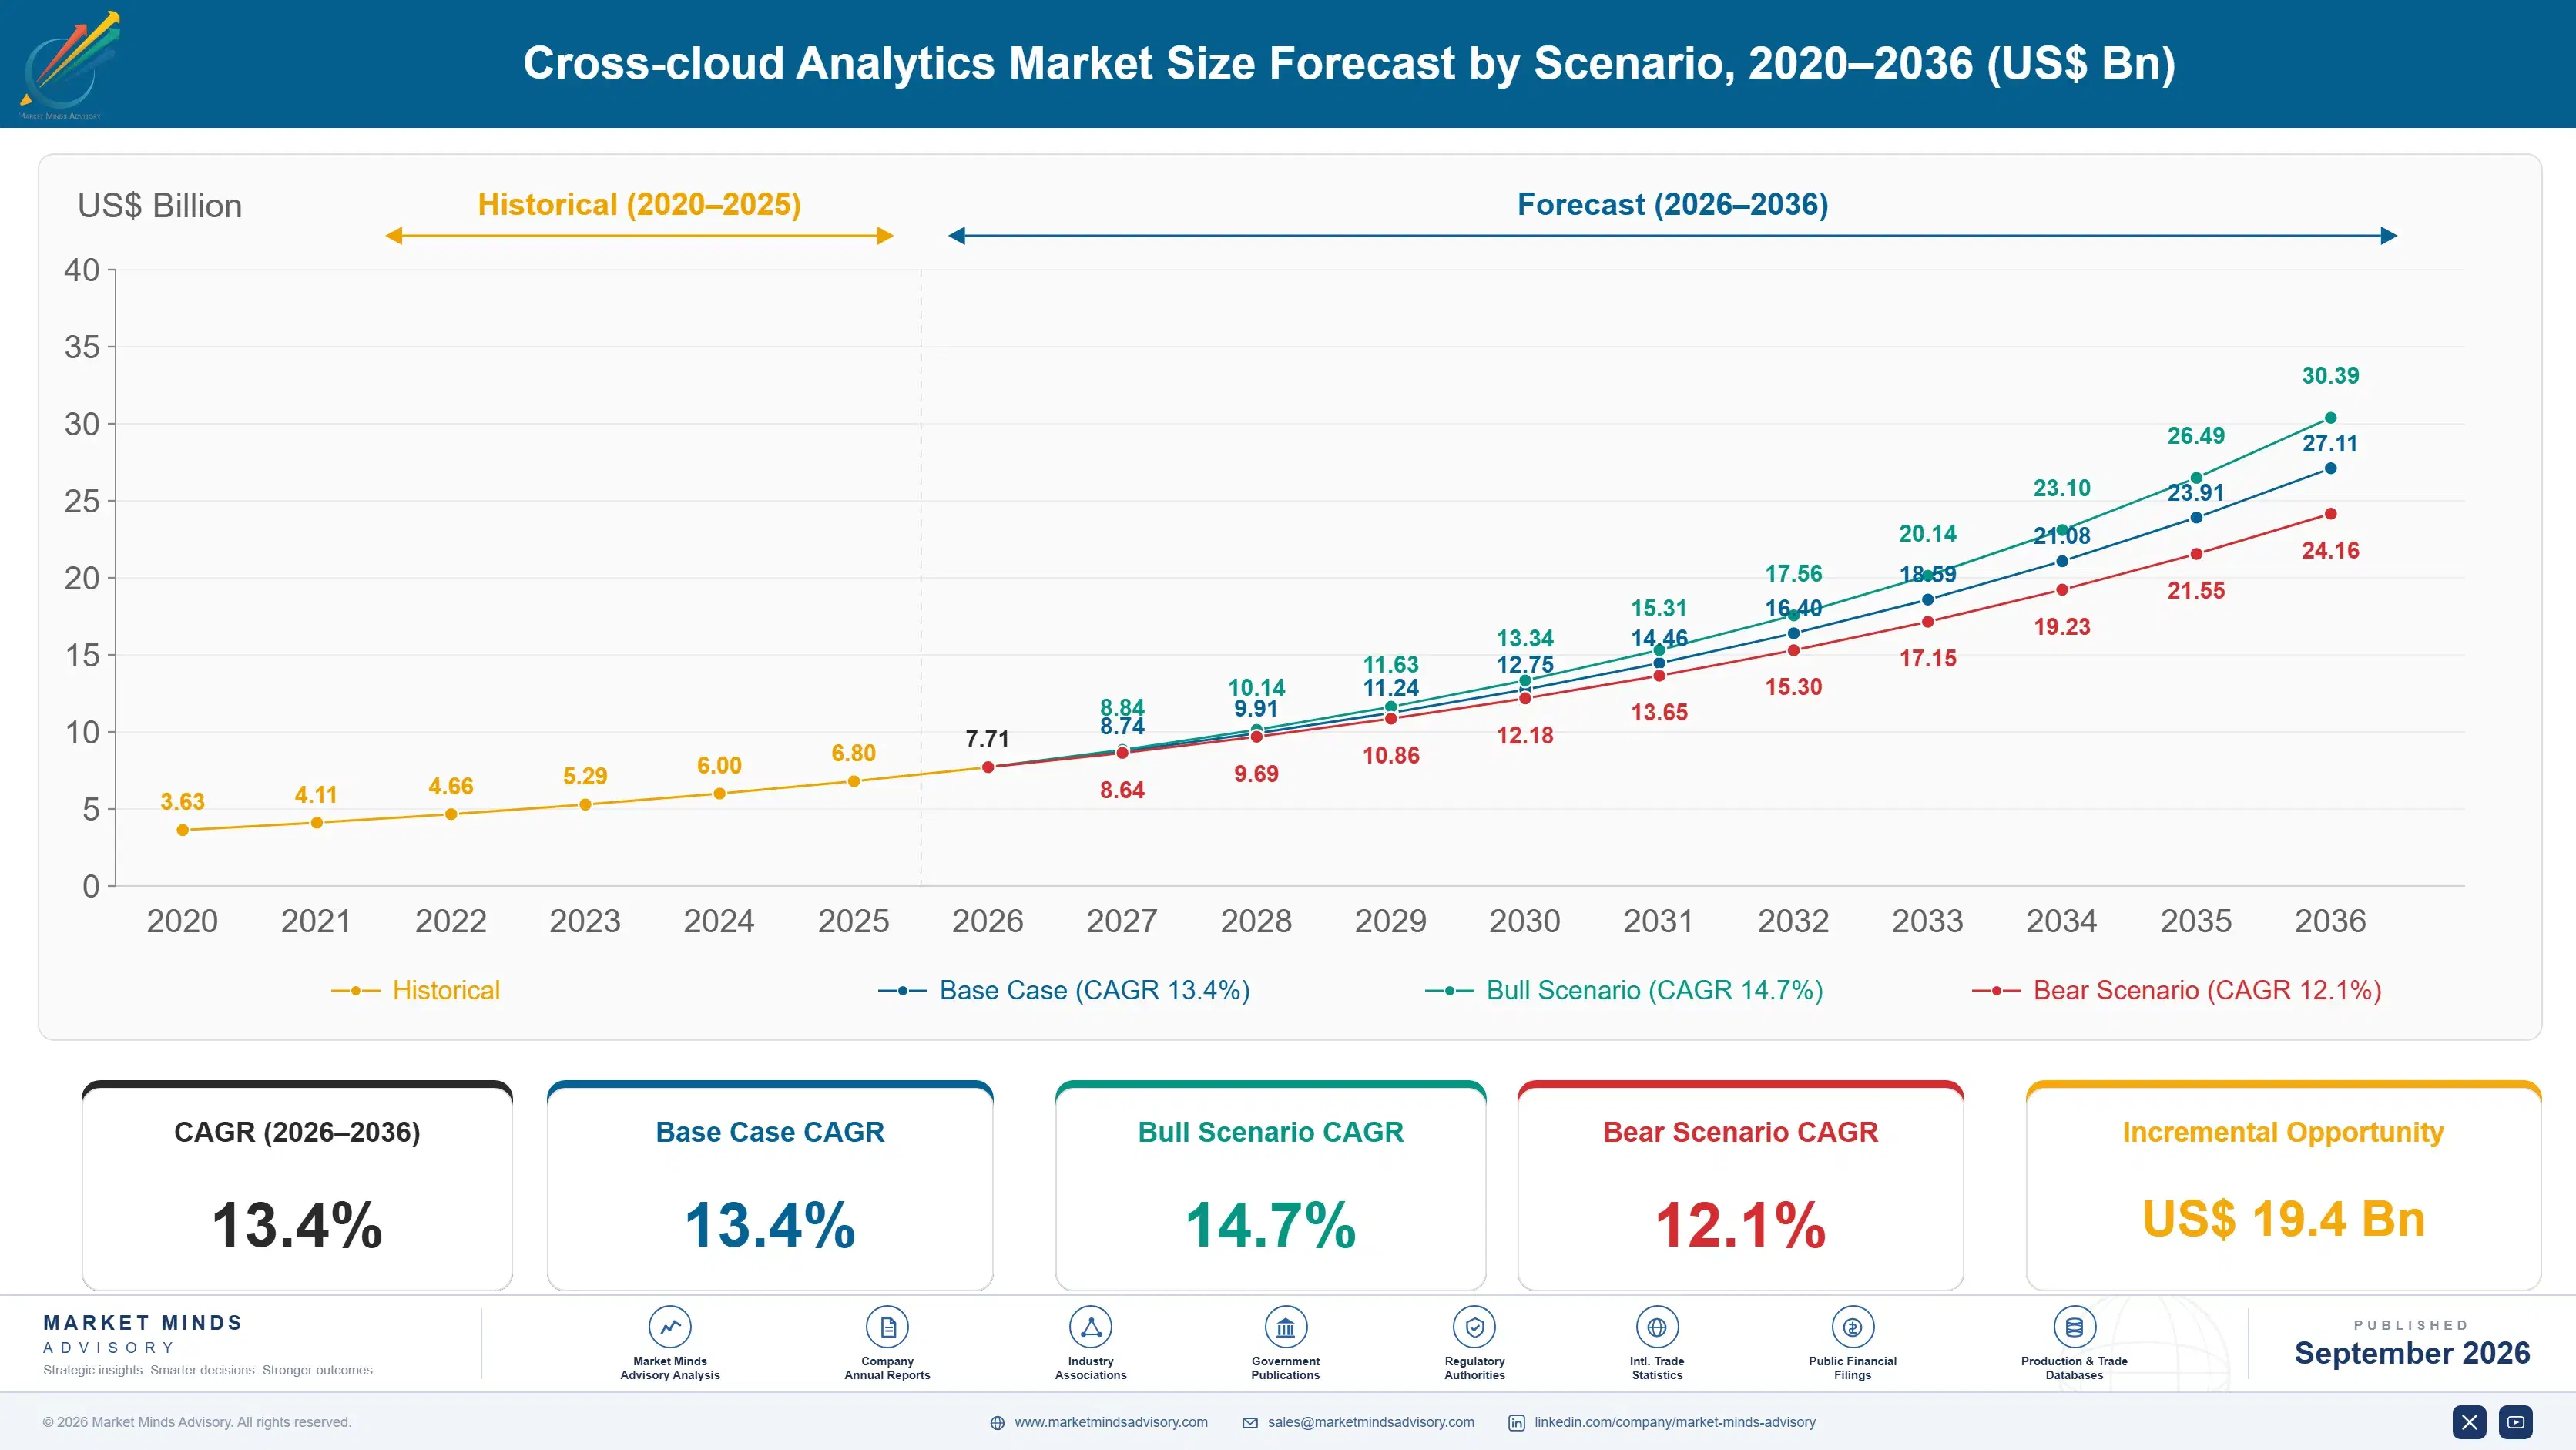
Cross-cloud Analytics Market Forecast Scenarios

cross-cloud-analytics-market-size-forecast-scenario-1788415599468
Cross-cloud analytics grew steadily between 2020 and 2025 as multi-cloud adoption expanded, though the historical growth rate of 12.4 percent understated a sharper acceleration that began once enterprises started treating cost governance as a board-level concern in the final two years. Vendors that entered the period selling single-cloud monitoring dashboards alone increasingly found enterprise buyers demanding unified, provider-agnostic visibility instead.
The base case rests on three commercial mechanisms: enterprises standardizing multi-cloud strategies rather than defaulting to a single provider, unified cost governance platforms proving measurable savings that justify subscription pricing, and mandatory cloud spend transparency mandates expanding the addressable enterprise customer base. Together these sustain strong double-digit growth through the forecast period. Vendors that fail on any one of these three fronts risk ceding share to faster-moving competitors within a single procurement cycle.
The bull case assumes faster-than-expected enterprise cloud spend growth pulls forward governance platform adoption across all major verticals simultaneously. The bear case centers on cloud providers building comparable native cross-platform tools themselves, which could slow independent vendor growth and push cost-conscious buyers back toward bundled provider tooling. Either scenario reshapes vendor investment priorities meaningfully within the next several years.

Where Multi-Cloud Complexity Meets Cost Governance

Cross-cloud analytics margin has historically compressed under heavy integration engineering costs, but vendors with proven multi-provider connectors now carry wider margin as switching costs favor established platforms. Enterprises increasingly negotiate multi-year subscription contracts rather than short-term pilot engagements. Vendors unable to make that integration investment risk being squeezed out by competitors offering broader provider coverage at comparable subscription pricing.
MARKET CONCENTRATIONCR5 46%Top five vendors control just under half the market
AVERAGE SUBSCRIPTION PRICE$20,000-$500,000/yearPrice varies by workload scale and provider count covered
LEADING DEPLOYMENT COUNTRYUSA 36% shareUnited States leads platform deployment volume among enterprises
MULTI-PROVIDER ADOPTION RATE58%Share of enterprises running workloads across multiple providers
COST SAVINGS REALIZATION RATE15-25%Typical cloud spend reduction reported after platform deployment
AVERAGE CONTRACT RENEWAL TERM2-3 yearsTypical enterprise subscription length before renewal decisions begin
Integration breadth across cloud providers has become the primary purchase criterion ahead of raw dashboard sophistication, since enterprises weigh provider coverage as heavily as analytical depth itself. Vendors investing in rapid new-provider connector development are winning multi-cloud enterprise contracts over specialists offering only two-provider coverage. That gap between broad-coverage leaders and narrow specialists widens further as enterprises standardize procurement around unified visibility requirements.
Large enterprises running three or more cloud providers dominate deployment volume, though mid-market companies are adopting cross-cloud analytics faster than any other segment tracked, driven by expanding cost scrutiny under tighter budgets. Government agencies migrating to multi-cloud architectures remain a smaller but steadily growing adjacent category. Vendors tailoring pricing tiers to these smaller enterprise budgets are capturing share that premium-only offerings cannot easily serve.
"Enterprises that treat cross-cloud analytics as a cost governance mandate rather than an optional dashboard upgrade are already ahead of competitors still comparing vendors on visual polish alone. The spend visibility gap it closes simply does not exist in single-cloud tools."
Director, Cloud Infrastructure and Enterprise Software Practice · MMA Technology Practice · September 2026

Market Trends

Unified Cost Governance Becomes Board-Level Priority

Enterprises are elevating cloud cost governance from an IT operations concern to a board-level financial discipline, a shift that happened faster than most vendors anticipated entering 2025 as cloud spending outpaced budget forecasts across most large organizations. Enterprises running unified governance platforms report cloud spend reduction of fifteen to twenty-five percent within the first year of deployment, a figure large enough to justify subscription pricing many times over. Vendors without a proven cost governance offering are increasingly excluded from enterprise procurement shortlists. Procurement teams increasingly name cost governance as a mandatory evaluation requirement.
Market Impact: cloud spend overruns average 20-30% yearly
Multi-Provider Enterprise Adoption Accelerates Steadily Worldwide

Enterprises running workloads across three or more cloud providers now represent a meaningfully larger share of the enterprise customer base than just a few years ago, a shift driven by deliberate vendor diversification strategies and mergers combining previously separate cloud estates. Fifty-eight percent of enterprises now run multi-provider architectures, up from a much smaller share only three years ago, pulling cross-cloud analytics demand along with it directly. This adoption wave is pulling forward vendor investment in broader provider connector development. Vendors with existing multi-provider connectors capture most of this wave, since procurement favors proven integration depth over new entrants.
Market Impact: tech mergers climbed 3 years running

Market Opportunities and Growth Drivers

Enterprise Cloud Spend Growth Outpaces Budgets

Enterprise cloud spending has grown faster than IT budget forecasts for several consecutive years, prompting finance leadership to demand the same cost visibility over cloud infrastructure that they already require over other major expense categories. Industry cloud spend surveys show enterprise cloud bills routinely exceeding initial budget projections by a wide margin, pushing chief financial officers to mandate governance tooling that individual cloud provider dashboards cannot provide. Vendors offering rapid cost anomaly detection are winning deals faster than those selling static reporting dashboards. Several regional banks have already begun deploying governance platforms in direct response to this budget overrun pressure.
Market Impact: egress fees add 10-18% to costs

Multi-Cloud Mergers Combine Separate Cloud Estates

Corporate mergers and acquisitions increasingly combine companies running different primary cloud providers, forcing the combined enterprise to manage genuinely heterogeneous infrastructure rather than migrating everything onto a single platform immediately. Deal activity data shows cross-border technology mergers rising steadily in recent years, each one potentially creating a multi-cloud estate that previously did not exist within either standalone company. Vendors with proven merger integration case studies are winning contracts fastest across this expanding category. Combined enterprises that deployed cross-cloud analytics early report smoother integration than peers still relying on separate provider dashboards.
Market Impact: native tools cover 40% of cases

Market Restraints and Challenges

Data Egress Costs Complicate Cross-Cloud Movement

Moving analytics data between cloud providers for unified processing triggers data egress charges that individual cloud vendors impose specifically to discourage workload portability, a cost that grows with the volume of cross-cloud data movement required. The root cause is that cloud providers have limited financial incentive to make cross-platform data movement cheap, since egress fees discourage customers from diversifying away from any single provider's platform. Vendors are mitigating this by processing analytics closer to the source data rather than centralizing raw data movement. Suppliers solving this cost problem gain a durable adoption advantage over competitors relying on centralized processing.
Market Impact: spend savings reach 15-25% yearly

Provider-Native Tools Compete on Bundled Pricing

Major cloud providers are expanding their own native cost management tools bundled into existing service agreements, pressuring independent cross-cloud vendors to justify a separate subscription for functionality partially available for free. The root cause traces to cloud providers wanting to keep customers within their own platform rather than encouraging genuine multi-cloud cost comparison and workload portability. Some vendors are mitigating this by emphasizing depth of cross-provider analysis that native tools simply cannot match by design. Vendors that establish this differentiation clearly are winning enterprise deals despite the free bundled alternative available to buyers.
Market Impact: multi-provider adoption reached 58% of enterprises
4 additional market trends, 3 additional growth drivers, and 2 additional restraints and challenges are covered in the full report. Contact sales@marketmindsadvisory.com to access the complete intelligence.

Segment CAGR and Growth Architecture

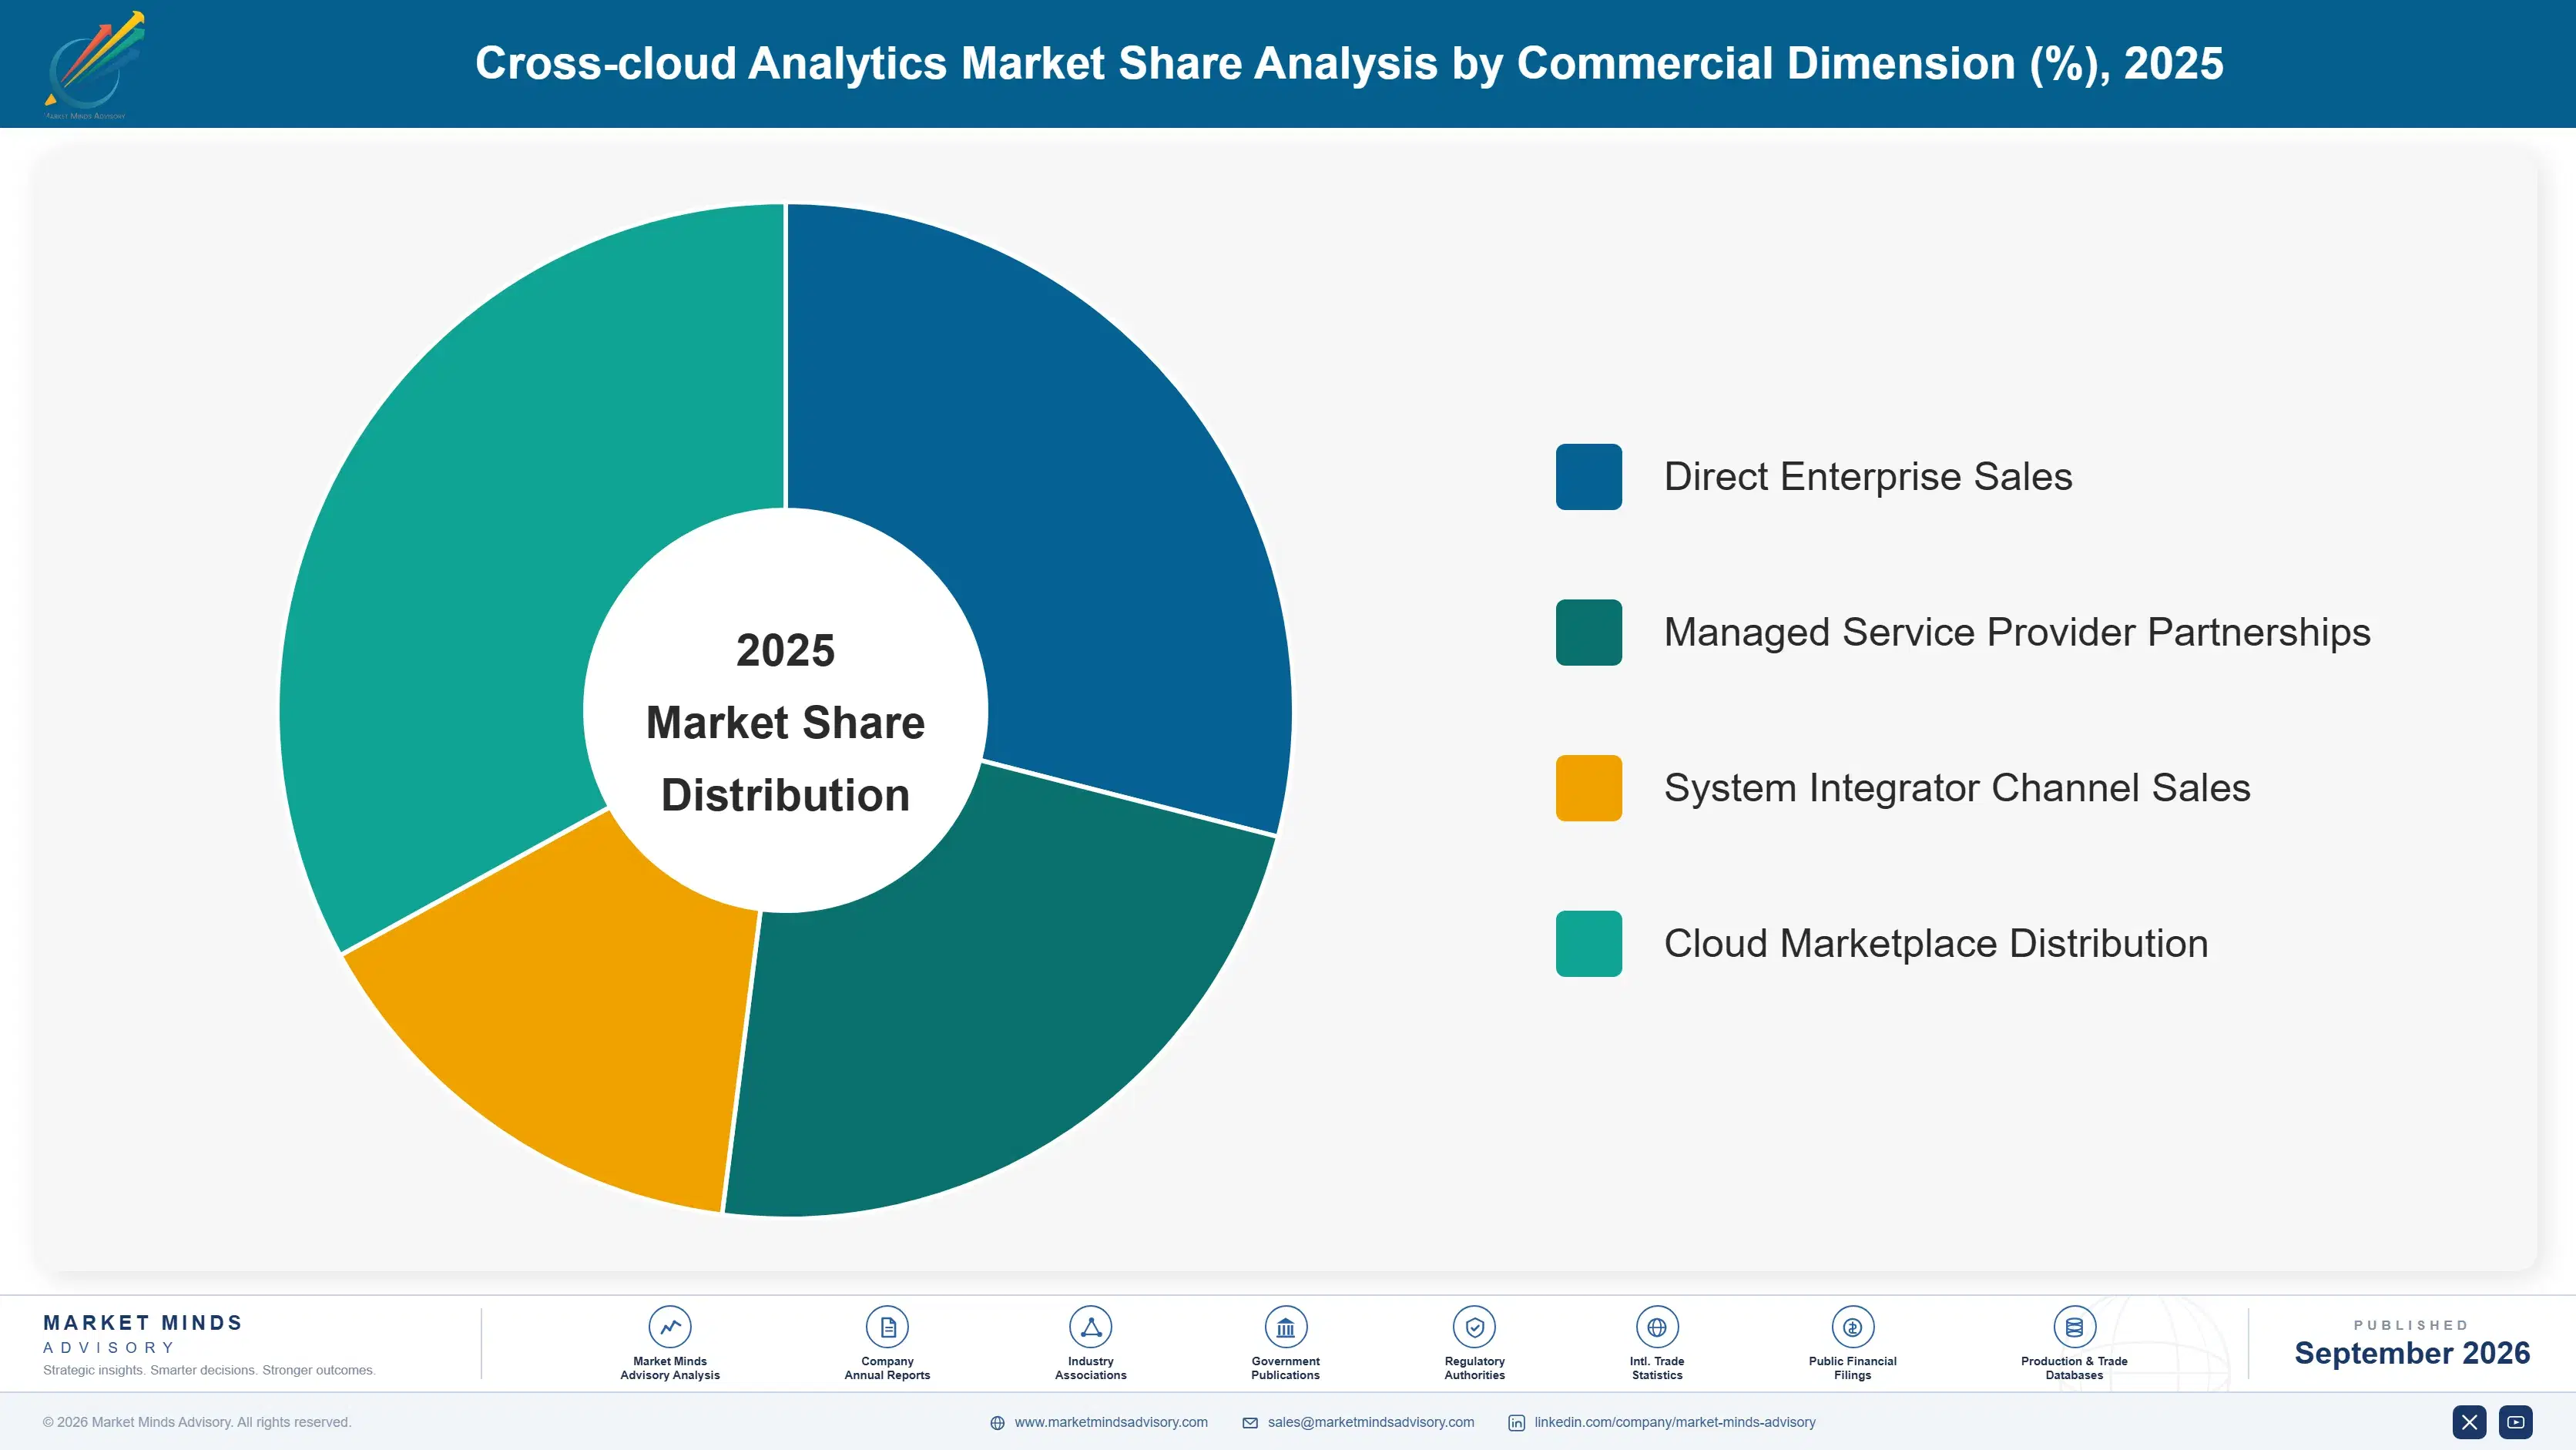
Cross-cloud analytics segments by platform capability and deployment model rather than by end-use industry, since a single enterprise customer typically combines multiple capability types across its own multi-cloud estate depending on workload complexity and governance maturity. Vendors treating platform capability and deployment model as separate purchasing decisions win more design-in contracts than those bundling both into one fixed configuration.
cross-cloud-analytics-market-market-share-analysis-1788415600000

Unified Multi-Cloud Cost Governance Platforms

Unified cost governance platforms aggregate spend, usage, and budget forecasting data across multiple cloud providers into a single dashboard, letting finance and IT teams track cross-cloud spending without reconciling separate provider bills manually. Enterprises deploying these platforms report cloud spend reduction of fifteen to twenty-five percent within the first year, a figure large enough to justify premium subscription pricing over free native tools. Adoption is accelerating fastest among enterprises running three or more cloud providers simultaneously. Vendors are also extending governance platforms with automated budget alerting, a use case that finance leadership specifically requested after early deployments focused only on historical reporting. Retailers of this technology increasingly value this addition as a genuine differentiator against competitors offering static reporting alone.
CAGR 19.8%

Cross-Cloud Performance Monitoring Platforms

Performance monitoring platforms track application latency, uptime, and resource utilization across multiple cloud providers, typically bundling alerting and root-cause analysis into a single unified interface. This segment represents the largest installed base by enterprise customer count, reflecting years of gradual adoption since multi-cloud architectures first became common, though unit growth now trails the faster-growing cost governance segment. Replacement cycles increasingly favor platforms with automated remediation capability. Government agencies outside pure enterprise use are adopting the same core monitoring platform, adapting configuration to compliance reporting rather than cost optimization needs. Replacement decisions increasingly hinge on remediation depth rather than sticker price alone across most procurement evaluations conducted. Buyers value this highly overall.
CAGR 14.9%
Full segment breakdown across 6 segments available in the complete report.

Regional Architecture and Country Demand Map

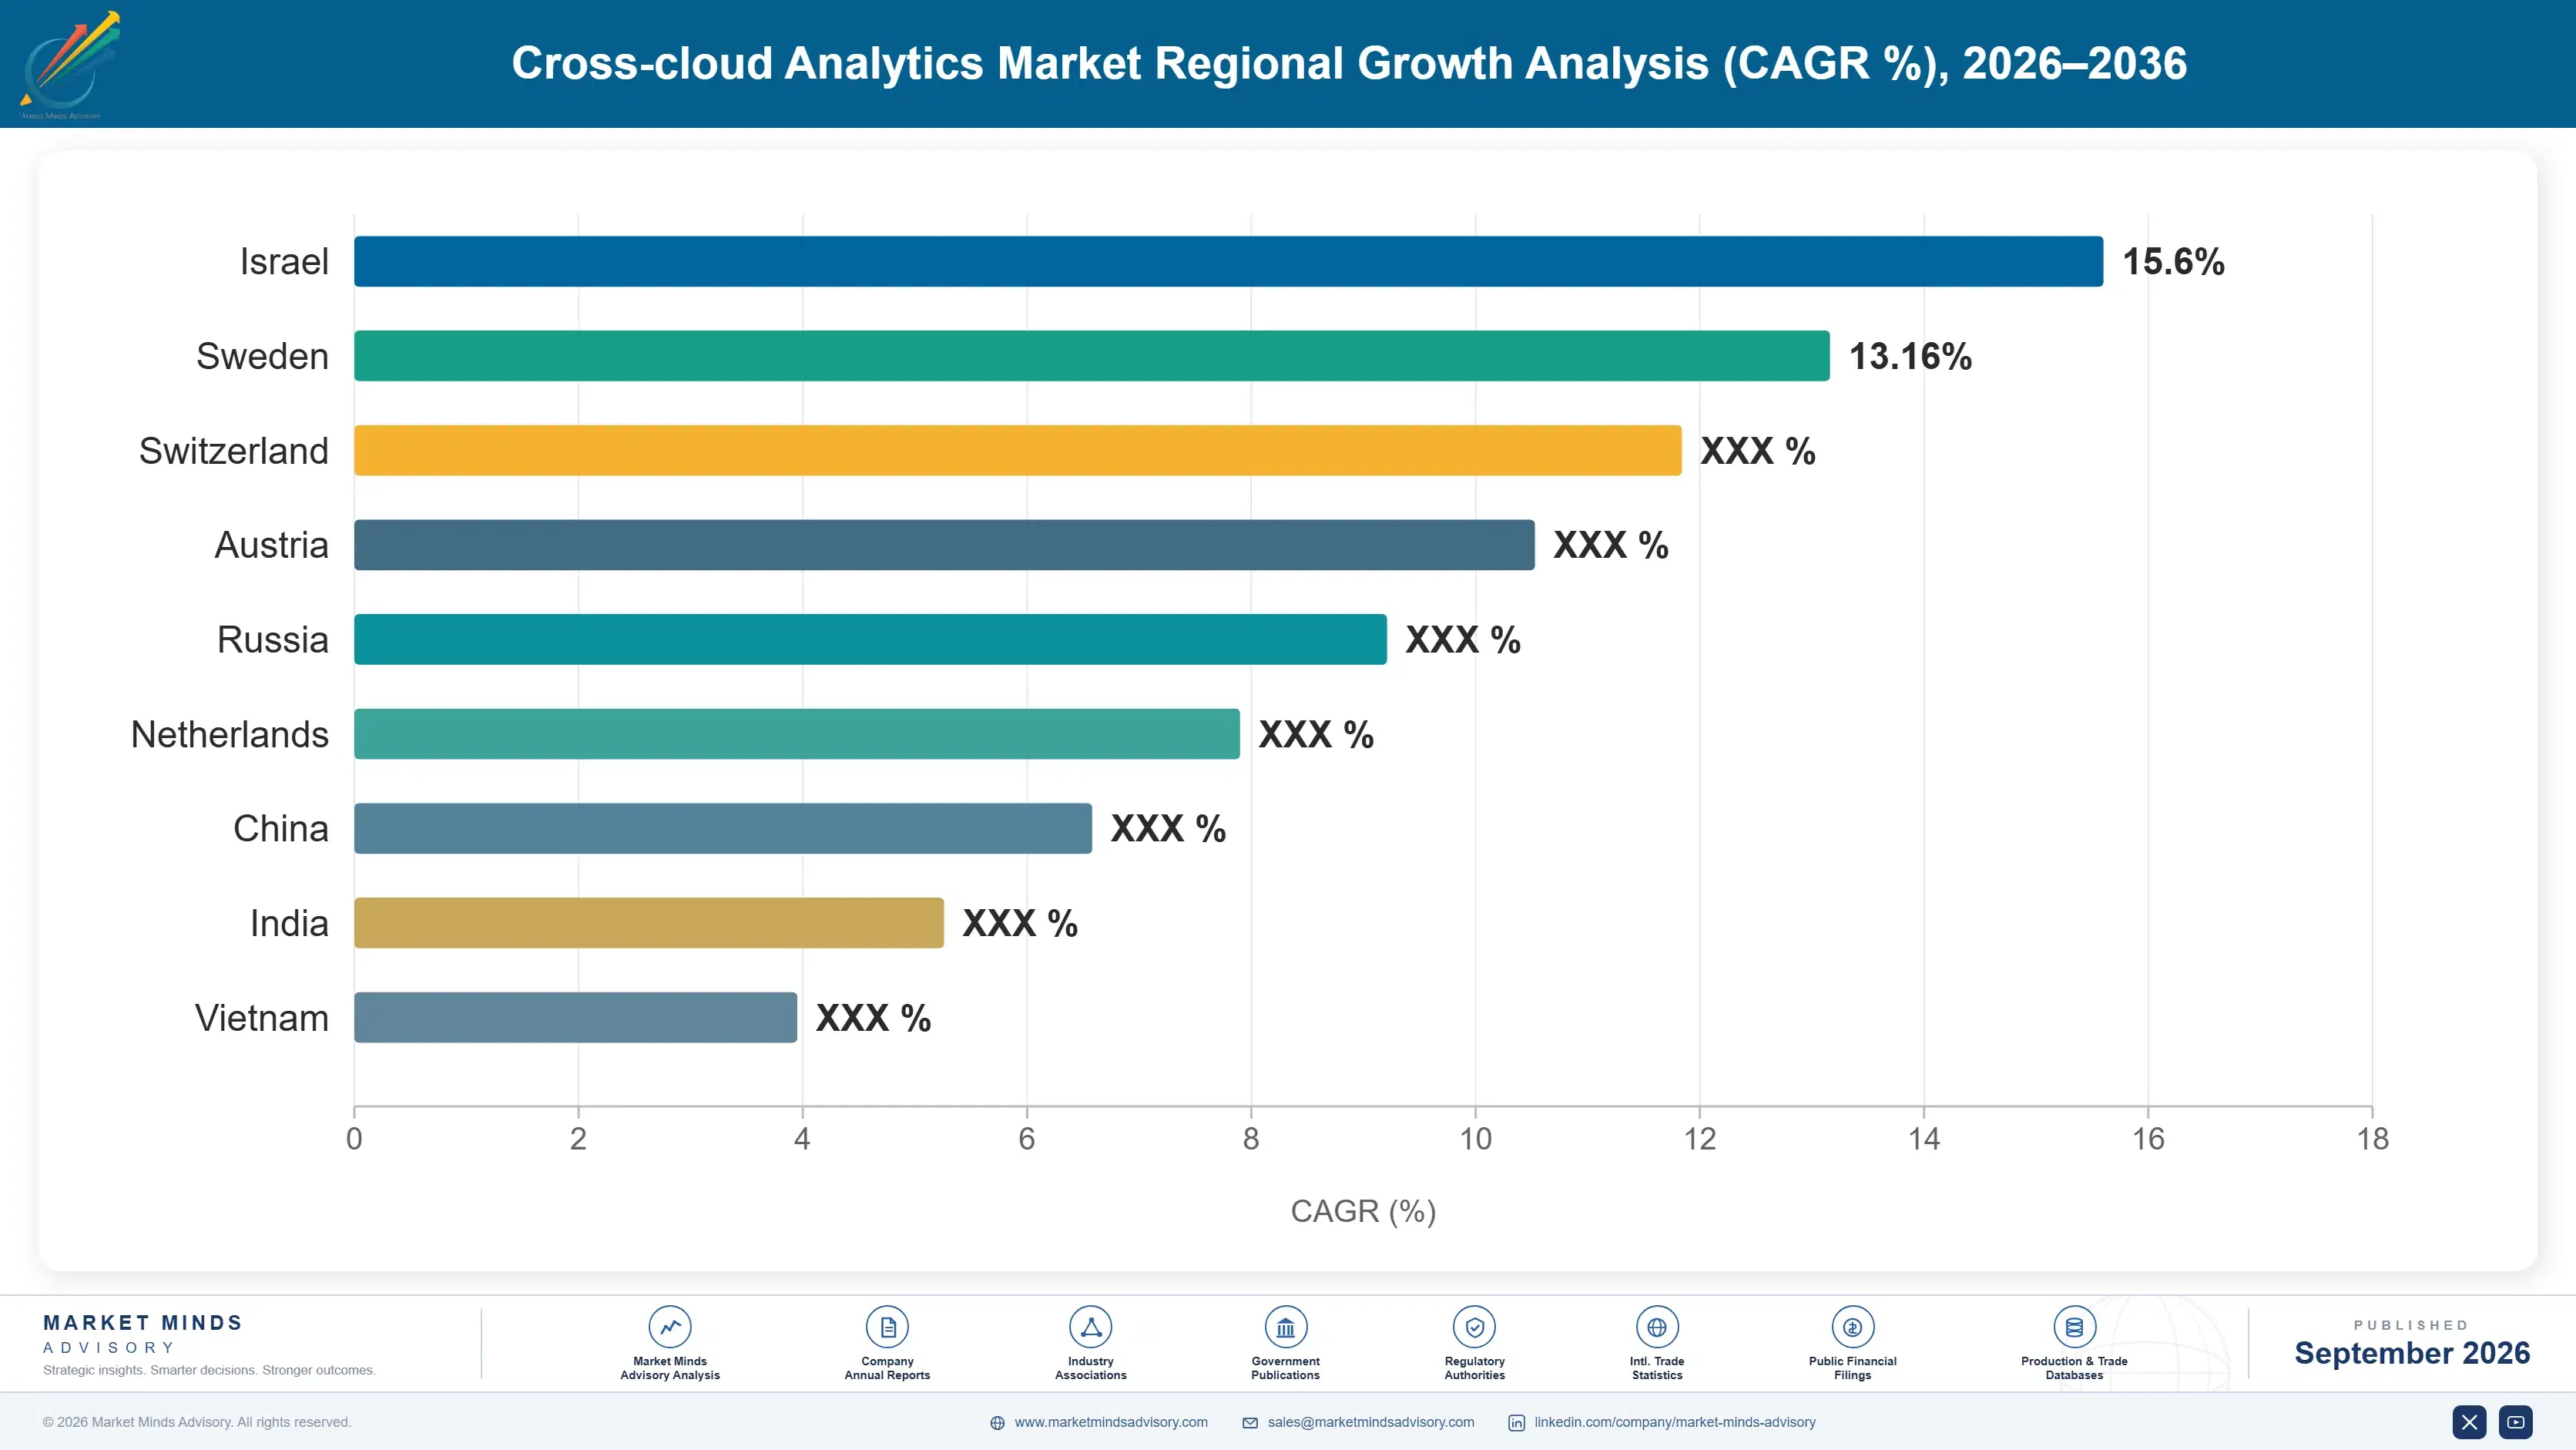
North America leads global adoption on the strength of its concentrated enterprise multi-cloud deployment base and mature cloud cost governance culture, while South Asia and Pacific posts the fastest regional growth as India's technology services sector scales analytics platform adoption quickly. Enterprise buyers everywhere are watching closely.

North America

United States enterprises anchor North American demand, with large financial services and technology companies running the most complex multi-cloud estates and the deepest cost governance requirements. Canadian enterprises are following a similar pattern at a smaller scale, often adopting the same vendor relationships established by their United States parent companies or regional peers. Mergers and acquisitions activity across the technology sector continues creating new multi-cloud estates that previously did not exist within either standalone company. Vendors report United States buyers negotiate contract terms around provider coverage breadth more heavily than around raw dashboard sophistication or visual polish. Contract renewal rates here run higher than in any other MMA-tracked region. Timing matters here.
Share: 32% | CAGR: 12.4% (2026 to 2036)

Western Europe

Germany and France's large enterprises are adopting cross-cloud analytics steadily, driven by data sovereignty requirements that push many organizations toward maintaining workloads across both domestic and international cloud providers. United Kingdom financial services firms contribute meaningful demand tied to regulatory reporting requirements that increasingly mandate cloud spend transparency. Regional growth trails the global average because much of the addressable enterprise market already completed initial multi-cloud governance rollouts during the prior product generation, leaving incremental upgrades as the dominant purchase pattern. Nordic enterprises are moving somewhat faster than their larger continental peers, citing smaller organizational bureaucracy as the reason for quicker adoption cycles. Expect deployment to accelerate as national regulators finalize spend transparency guidance.
Share: 21% | CAGR: 11.7% (2026 to 2036)
Regional intelligence for 5 additional markets available in the complete report: East Asia, South Asia and Pacific, Latin America, Middle East and Africa, Eastern Europe. Contact sales@marketmindsadvisory.com.
cross-cloud-analytics-market-country-cagr-analysis-1788415600505

Governance Depth Drives Enterprise Contract Value

Vendors that expand cost governance depth beyond basic reporting, bundle rapid multi-provider connector development, and diversify into merger integration services capture disproportionate margin as enterprise buyers standardize procurement around proven cross-cloud coverage breadth. Vendors slow to act cede share to faster-moving rivals within a single procurement cycle. First movers on each front are already pulling ahead noticeably.

Cost Governance Depth Expansion Program Strategy

Vendors expanding cost governance capability beyond basic spend reporting into automated budget alerting and anomaly detection win enterprise contracts that shallower reporting-only competitors cannot match on measurable savings claims. Datadog and Flexera have both invested heavily in governance depth, and enterprises deploying these platforms report cloud spend reduction of 15-25% within the first deployment year. This depth also raises switching costs once finance teams build budget processes around a specific vendor's alerting thresholds. Vendors without comparable governance depth are increasingly locked out of the largest enterprise procurement opportunities. Timing matters here.
Market Impact: governance-led deals close roughly 40% faster than average

Rapid Multi-Provider Connector Development Program Strategy

Vendors that build new cloud provider connectors within weeks rather than months capture enterprise deals that slower-integrating competitors lose during procurement evaluation windows. CloudHealth by VMware has structured its engineering roadmap around this rapid connector cadence, reporting new provider support shipped in 2-3 weeks versus the two-quarter timeline common among smaller specialist competitors. This speed advantage also locks in enterprises evaluating newly added regional cloud providers first. Vendors without this rapid connector cadence are ceding deals to competitors better equipped to support newly emerging regional providers. Timing matters as procurement windows close quickly.
Market Impact: connector development cut from months to 2 weeks

Merger Integration Services Diversification Program Strategy

Vendors diversifying into merger integration consulting services capture volume tied directly to combined enterprises inheriting genuinely heterogeneous multi-cloud estates from separate legacy companies. Apptio has expanded a dedicated merger integration practice separate from its core governance product, reporting engagement volume in this category up 3x faster than its standard subscription business over the past two years. This diversification also reduces vendor exposure to any single enterprise procurement cycle's timing. Vendors without a dedicated merger practice are ceding this fast-growing channel to competitors better suited to complex integration work. Timing matters as more mergers occur.
Market Impact: merger integration engagements up 3x since 2023 overall

Native Tool Differentiation Positioning Program Strategy

Vendors that clearly differentiate depth of cross-provider analysis against free bundled native cloud provider tools capture enterprise accounts that would otherwise default to the free alternative. Densify has built its commercial positioning specifically around analytical depth that native tools cannot replicate, reporting win rates roughly 30% higher in competitive evaluations against bundled provider offerings than industry benchmarks suggest. This positioning converts a persistent pricing objection into a genuine competitive advantage over free alternatives. Vendors slower to articulate this differentiation still lose deals to the free bundled alternative on price alone. Timing matters here.
Market Impact: differentiated positioning lifts win rates by roughly 30%

Who Controls the Margin Pool

Five vendors control forty-six percent of global cross-cloud analytics revenue on a subscription contract basis, with Datadog and CloudHealth by VMware holding the two largest positions. The gap between the leader and the nearest mid-tier challenger has widened as governance depth requirements rise faster than smaller vendors can absorb. That widening reflects how quickly governance depth has become the deciding factor in procurement decisions.
Current competitive activity centers on governance depth and rapid connector development rather than raw dashboard aesthetics, since enterprises treat measurable savings and coverage breadth as more consequential than visual polish. Several vendors have restructured commercial teams around finance stakeholder engagement over the past two years. Vendors slow to make this shift report weaker enterprise win rates than those that reoriented sales strategy earlier.

Emerging pressure comes from major cloud providers expanding native cost management tools bundled into existing agreements, a shift that could bypass independent vendors if enterprises accept partial free functionality. Rankings among the second tier remain fluid as smaller specialists pursue merger integration and mid-market niches the largest enterprise-focused players have been slower to prioritize. Traditional vendors are responding by deepening finance stakeholder relationships rather than competing on dashboard sophistication.
cross-cloud-analytics-market-company-positioning-matrix-1788415601028

Competitive Moat and Risk Dimensions

DATADOG

Moat: Broad Provider Integration Depth

Datadog holds the broadest cloud provider connector library across major and regional providers, built over years of continuous engineering investment that newer entrants cannot easily replicate quickly. That breadth lets the company serve nearly any multi-cloud combination a customer proposes without custom integration work. Few pure governance specialists can match this reach.
DATADOG

Risk: Premium Pricing Perception

The company's pricing sits meaningfully above budget-conscious competitors, creating friction with mid-market buyers weighing cost against the broader monitoring platform they may not fully need. Competitors offering narrower but cheaper governance-only tools can undercut on price for cost-sensitive procurement evaluations. Datadog has begun offering slimmer governance-only tiers to address this gap.
CLOUDHEALTH BY VMWARE

Moat: Enterprise Governance Track Record

CloudHealth built its reputation on enterprise-grade governance deployments across some of the largest known multi-cloud estates, a track record that newer commercial entrants cannot easily replicate with skeptical enterprise buyers. That pedigree carries particular weight with regulated industries evaluating vendors for compliance-sensitive multi-cloud reporting. That trust took years to build carefully.
CLOUDHEALTH BY VMWARE

Risk: Broadcom Ownership Uncertainty

VMware's acquisition by Broadcom has introduced uncertainty around long-term product investment priorities, prompting some enterprise customers to evaluate independent alternatives as a hedge against strategic shifts. Competitors are actively targeting CloudHealth's existing customer base during this ownership transition period. CloudHealth's leadership has publicly committed to continued investment to reassure the existing customer base.

Players Tracked

Prominent Players

Datadog
CloudHealth by VMware
Flexera
Densify
Apptio

Other Key Players

New Relic
Dynatrace
Splunk
Anodot
Nutanix Beam
CloudCheckr
Turbonomic
ServiceNow
Kubecost
Harness
Zesty
Spot by NetApp
Yotascale
CAST AI
Vantage

Recent Developments

MARCH 2026

Datadog Launches Automated Multi-Cloud Budget Alerting Feature

Datadog launched an automated budget alerting feature that notifies finance teams in real time when cloud spend across any tracked provider exceeds forecasted thresholds. The launch is an organic product expansion rather than an acquisition, aimed at strengthening the company's cost governance positioning against narrower specialist competitors.
Signal: Signals platform vendors are increasingly absorbing governance functionality once sold as standalone specialist products entirely industry-wide.
OCTOBER 2025

Flexera Acquires Merger Integration Consulting Startup

Flexera acquired a smaller merger integration consulting startup based in Boston, Massachusetts, adding dedicated multi-cloud estate consolidation expertise to its existing governance product line. The deal closed for an undisclosed sum and folds the acquired consulting team into Flexera's professional services division. Financial terms were not disclosed publicly.
Signal: Confirms merger integration services, not just software licensing alone, is becoming a meaningful revenue channel today.
JUNE 2025

Apptio Signs Multi-Year Contract With Global Financial Institution

Apptio signed a multi-year governance platform agreement with a major global financial institution to unify cost and performance analytics across the bank's five-provider cloud estate. The agreement is a supply and services commitment rather than an equity stake or joint venture, locking in recurring revenue through the contract term.
Signal: Shows large financial institutions increasingly standardizing on a single governance vendor across all global regions today.

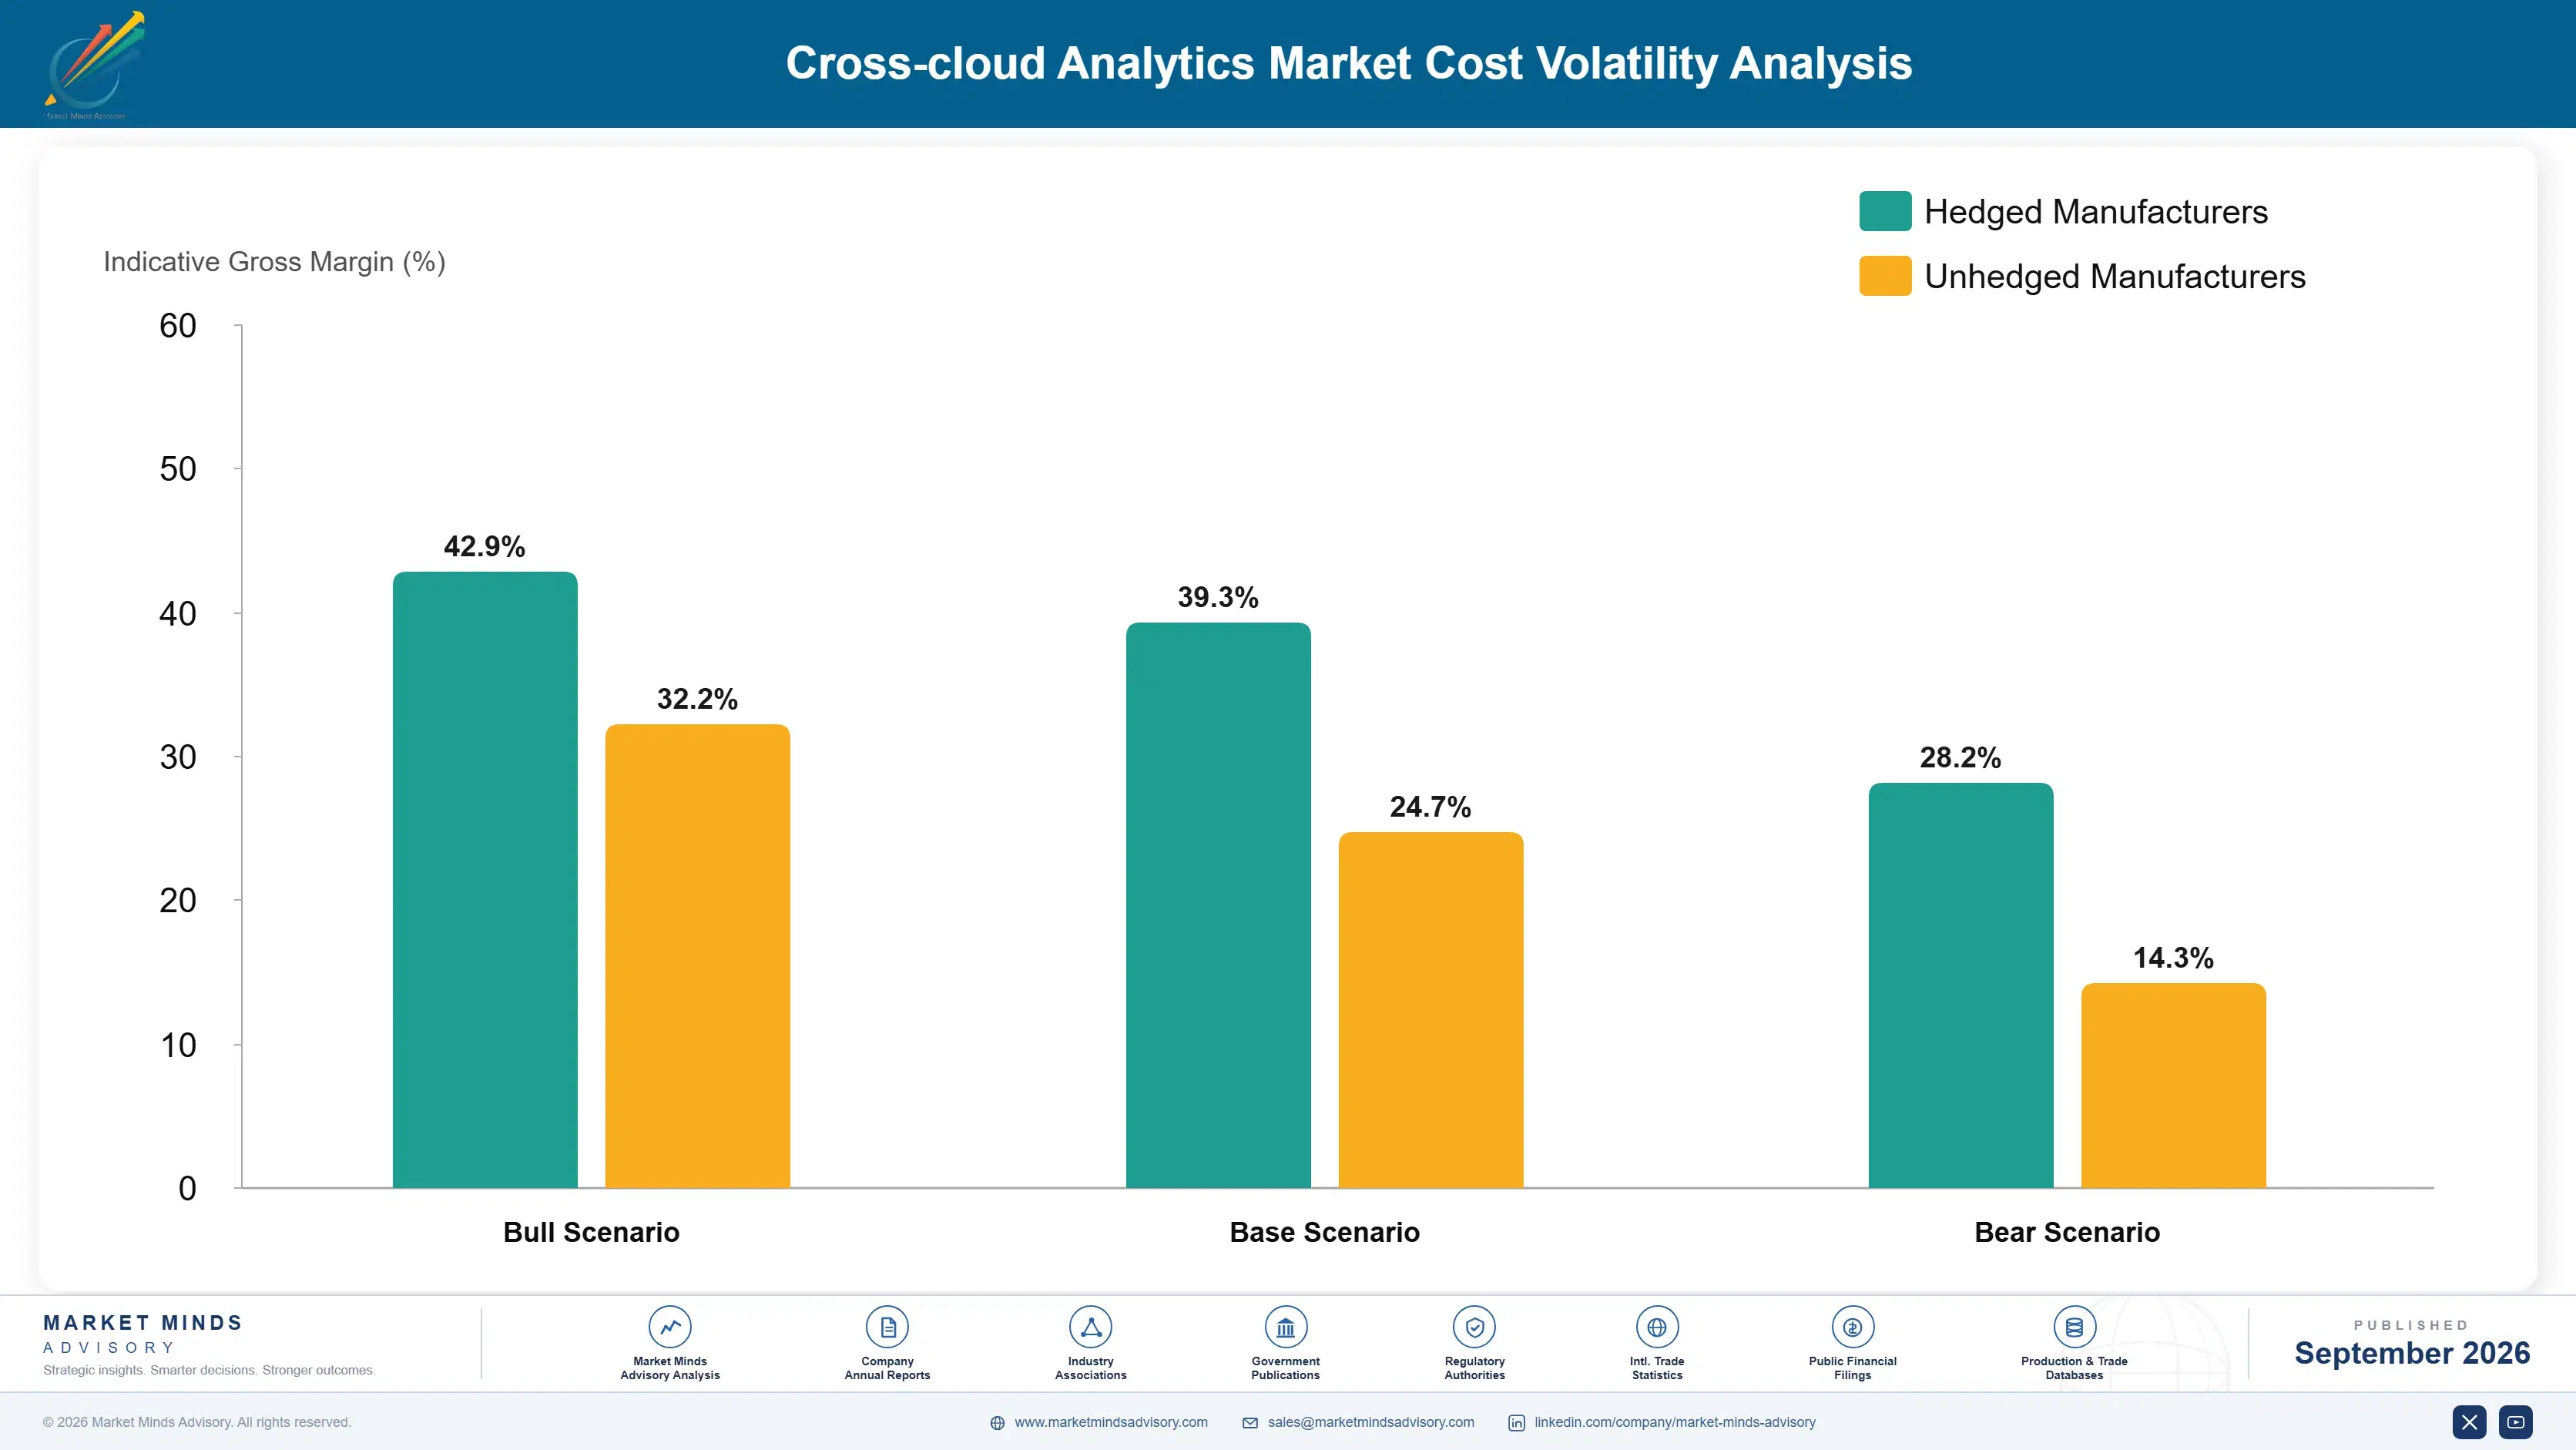
Data Egress and Talent Cost Exposure

Data egress fees and specialized cloud engineering talent together account for roughly thirty-five percent of a cross-cloud analytics vendor's cost of goods sold, with the remainder split between infrastructure hosting, software licensing, and support operations. Most egress fee structures originate from a handful of major cloud providers, concentrating meaningful upstream cost exposure outside vendor control.
Cloud data engineering salaries rose more than twenty percent within a single year during the 2023 to 2024 period, driven by a talent shortage that the National Institute of Standards and Technology's 2024 technology workforce report attributed to surging demand for multi-cloud integration expertise across the broader technology sector. Several vendors delayed planned hiring temporarily rather than absorbing the full compensation increase, slowing product roadmap delivery by roughly one fiscal quarter.

Smaller vendors without existing engineering talent pipelines face sharper margin compression during hiring surges than the top five, who typically maintain university partnership programs and internal training pipelines. This gap widens further for vendors dependent on passing through data egress costs directly, since they lack the negotiating leverage larger competitors use to secure better bulk pricing terms. Vendors slow to build such pipelines remain most exposed.
cross-cloud-analytics-market-cost-volatility-analysis-1788415601223

Data Processing Localization Strategy

Leading vendors now process analytics closer to the source data within each provider's own environment, reducing the volume of raw data requiring cross-provider egress transfer. This shields margin during volume spikes. Vendors without this localization capability have historically absorbed a larger share of egress costs directly into quarterly margin. This gap widens further during volume spikes.

University Partnership Talent Pipeline Programs

Vendors maintaining formal university partnerships that train engineering students specifically in multi-cloud integration concepts reduce dependence on the competitive open talent market. Smaller vendors rarely maintain such partnerships. Building that talent pipeline takes significant investment, keeping this advantage concentrated among the largest vendors currently. This gap should narrow gradually over time as programs mature.

Bulk Egress Pricing Negotiation Strategy

Several vendors have negotiated bulk egress pricing agreements directly with major cloud providers, passing a portion of the savings through to enterprise customers as a competitive differentiator. Adoption remains uneven across the vendor base. Vendors that negotiated earliest report meaningfully lower per-unit egress costs than competitors still paying standard published rates. This gap should narrow gradually.

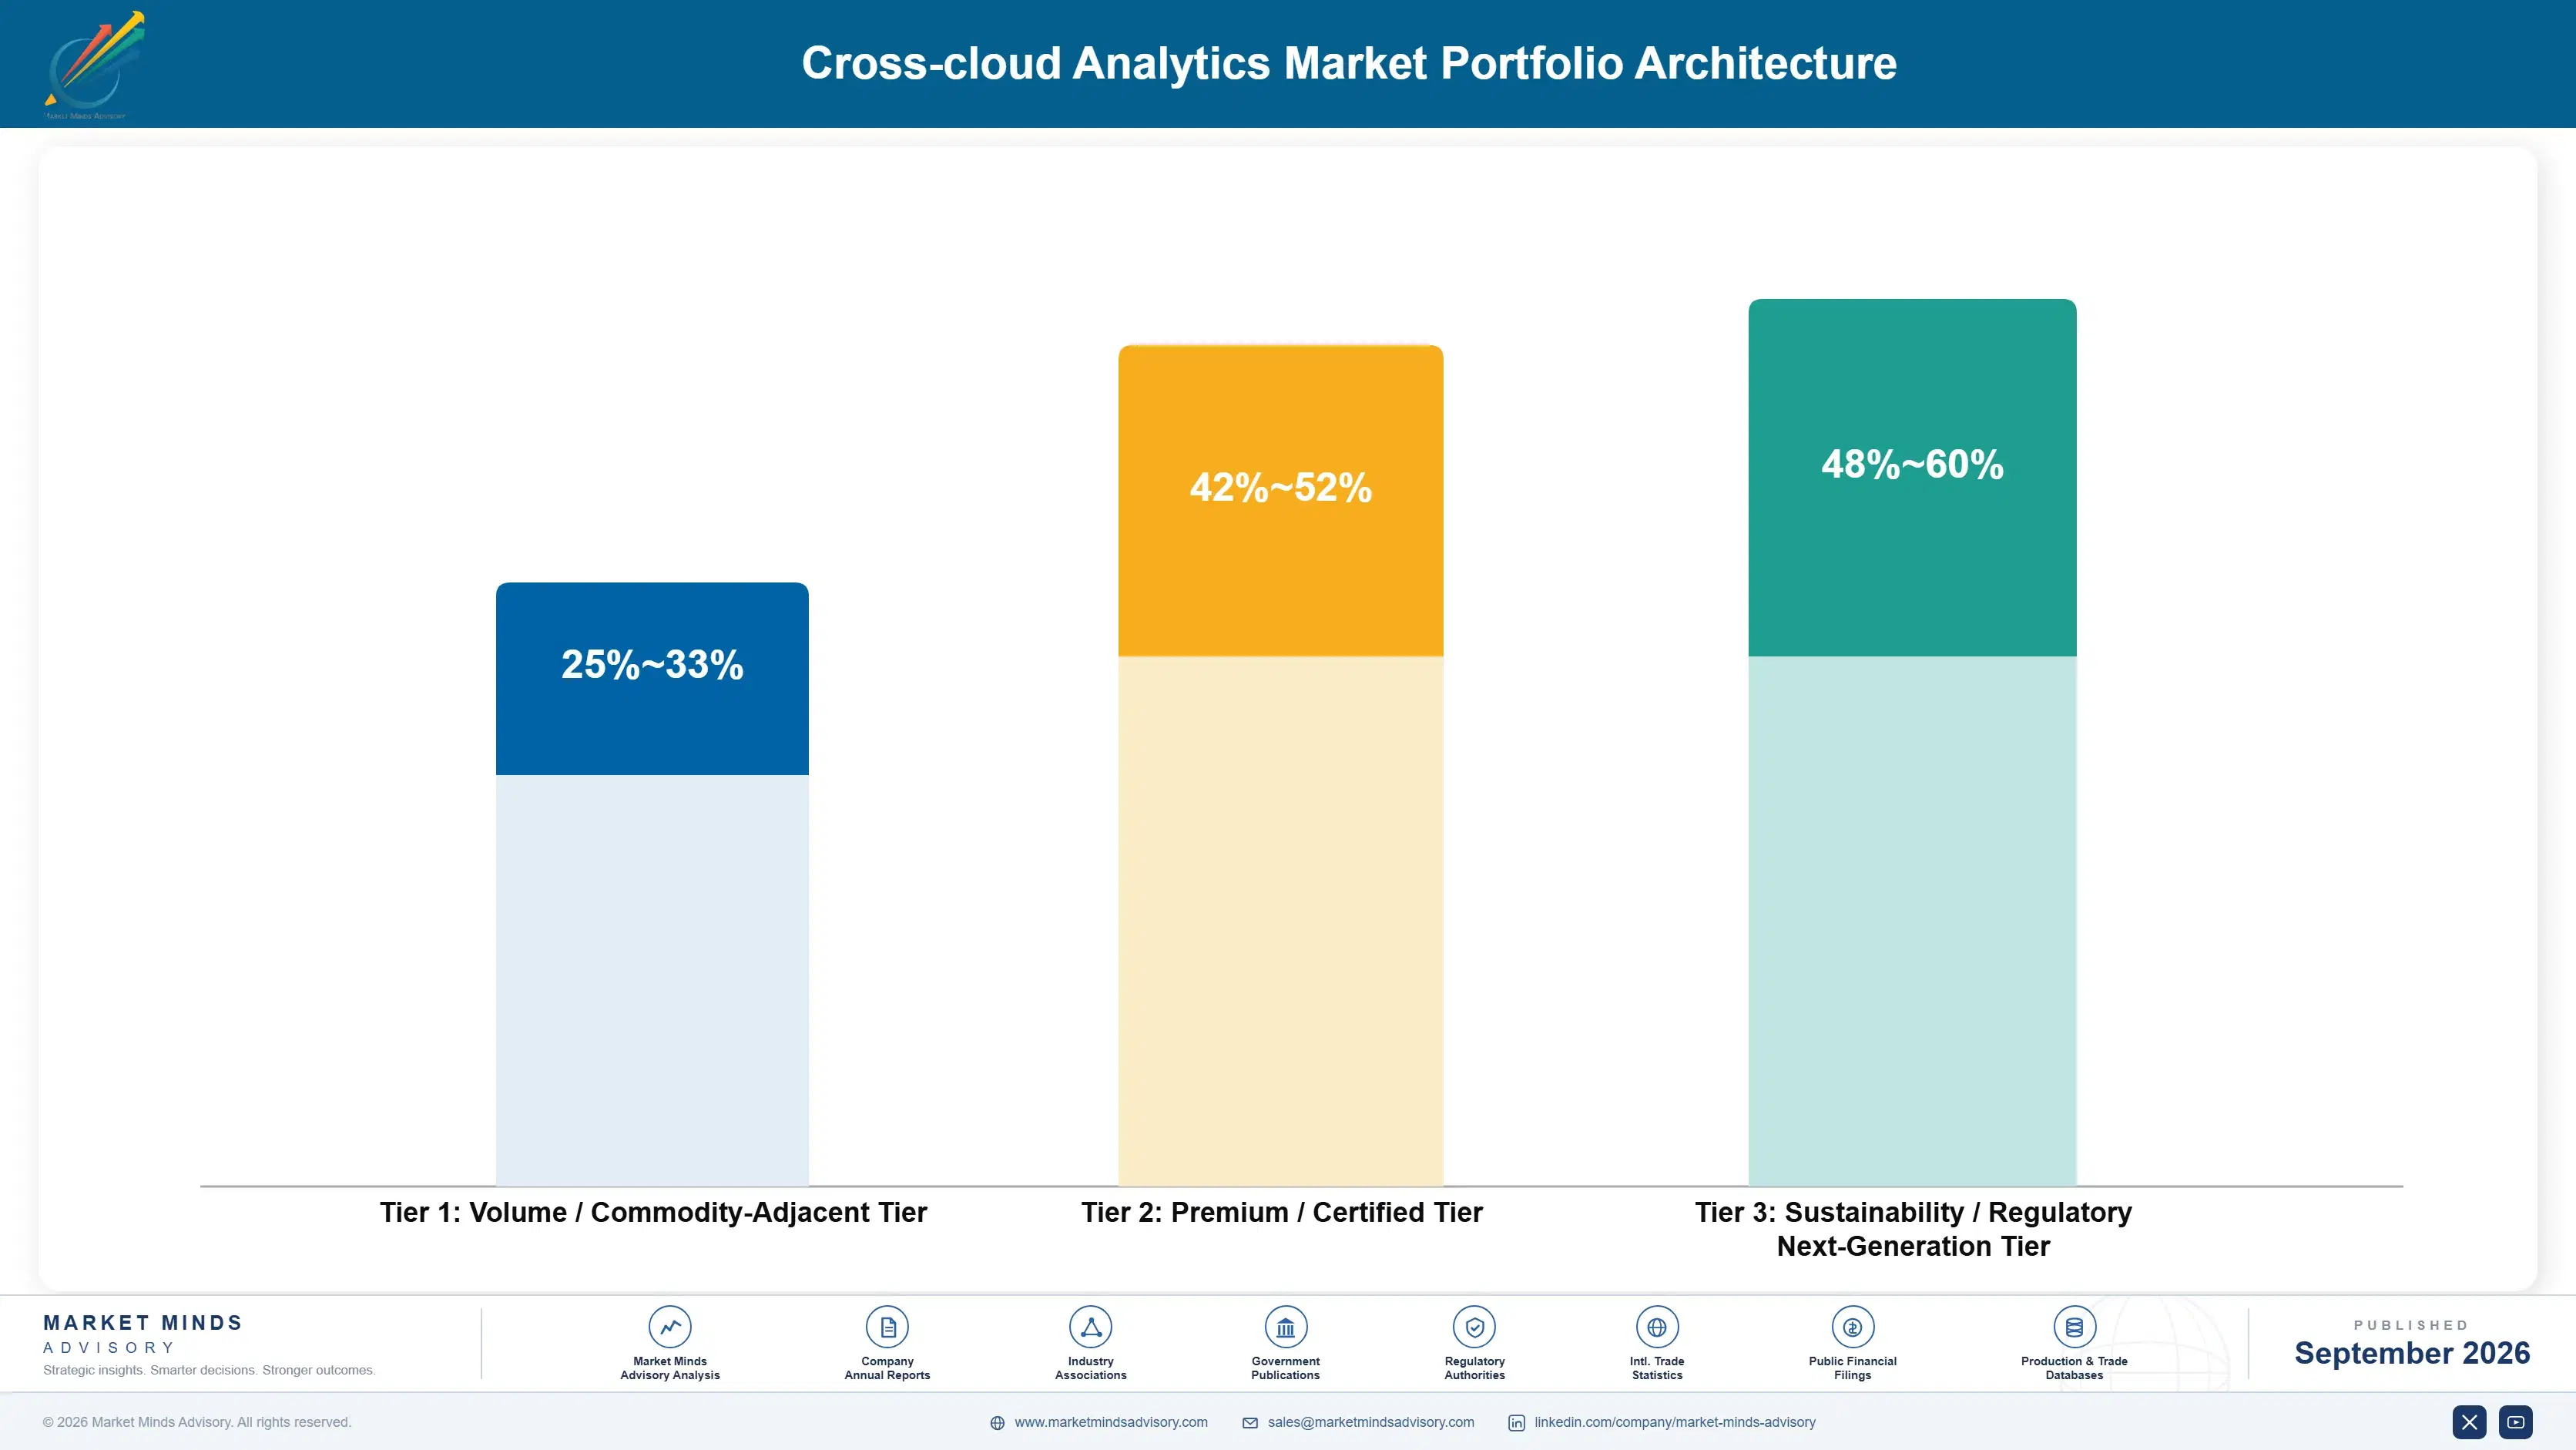
Portfolio Architecture for Margin Defence

Cross-cloud analytics margin economics split across three tiers, with basic monitoring competing on price while governance and merger integration services command materially wider gross margin. Basic monitoring still generates meaningful revenue from existing subscriptions even as new bookings concentrate increasingly in the higher tiers. That gap has widened as governance requirements tighten, making basic-only offerings a poor allocation for vendors with a credible upgrade path.
The tension between basic monitoring and governance is sharpest in large enterprise accounts, where a vendor's average contract value can differ meaningfully between a monitoring-only subscription and its governance-inclusive equivalent serving comparable infrastructure. Vendors chasing basic monitoring volume alone cede the margin pool to competitors willing to invest in governance depth. That gap has widened over the past several years as buyers weigh measurable savings more heavily than raw dashboard specifications.

High-value margin pools concentrate in governance platforms and merger integration consulting services, both requiring upfront engineering and expertise investment that smaller vendors frequently cannot justify against uncertain contract-win probability. This concentration is expected to deepen as enterprise cost scrutiny keeps intensifying. Vendors positioned early in both capture disproportionate revenue growth relative to unit volume growth across the decade ahead.

Volume / Commodity-Adjacent Tier

Basic performance monitoring subscriptions sold on price into mid-market enterprises, competing primarily on ease of setup rather than governance depth. Price pressure remains steady across this tier. Smaller specialist vendors dominate this segment given lower switching barriers among mid-market buyers.
Gross Margin: 25-33%

Premium / Certified Tier

Unified cost governance platforms sold at a durable premium, defended by measurable savings and switching costs competitors cannot easily replicate quickly across finance stakeholder relationships. Established vendors with proven governance depth hold this ground firmly against newer entrants.
Gross Margin: 42-52%

Sustainability / Regulatory / Next-Generation Tier

Emerging merger integration and compliance-driven governance services combining automated remediation with regulatory reporting, carrying the widest margins as early scaled volume remains constrained. Scale should follow as buyer confidence in automated remediation accuracy grows over coming years.
Gross Margin: 48-60%
cross-cloud-analytics-market-portfolio-architecture-1788415601720

High-value Sub-segments and Strategic Watch-out

High-value high-growth segment

Unified multi-cloud cost governance platforms sit at the intersection of premium margin and the fastest unit volume growth, as enterprises standardize around measurable savings platforms rather than legacy monitoring-only tools across new procurement decisions. This is the clearest growth vector across the entire forecast decade.
Gross Margin: 42-52%

High-value moderate-growth segment

Merger integration consulting services carry strong recurring margins tied to combined enterprise demand, though adoption grows more gradually as vendors build the specialized expertise needed to support complex multi-cloud consolidation engagements. Vendors treat this as a durable, if slower-building, opportunity worth continued investment. Vendors treat this as durable revenue.
Gross Margin: 38-48%

Volume core segment

Basic performance monitoring subscriptions remain the largest unit volume base across established mid-market enterprise accounts globally, sustaining steady if unremarkable margins as the category matures and price competition among established vendors intensifies broadly. Scale determines share here overall. Volume here funds the fixed cost base broadly across most vendor operations.
Gross Margin: 25-33%

Strategic watch-out segment

Major cloud providers expanding native cost management tools bundled into existing service agreements threaten to disintermediate independent vendors over the coming decade, particularly where cost-conscious enterprises accept partial free functionality over paid alternatives. This shift bears close monitoring through the forecast period. Established vendors are responding through acquisition.
Gross Margin: n/a

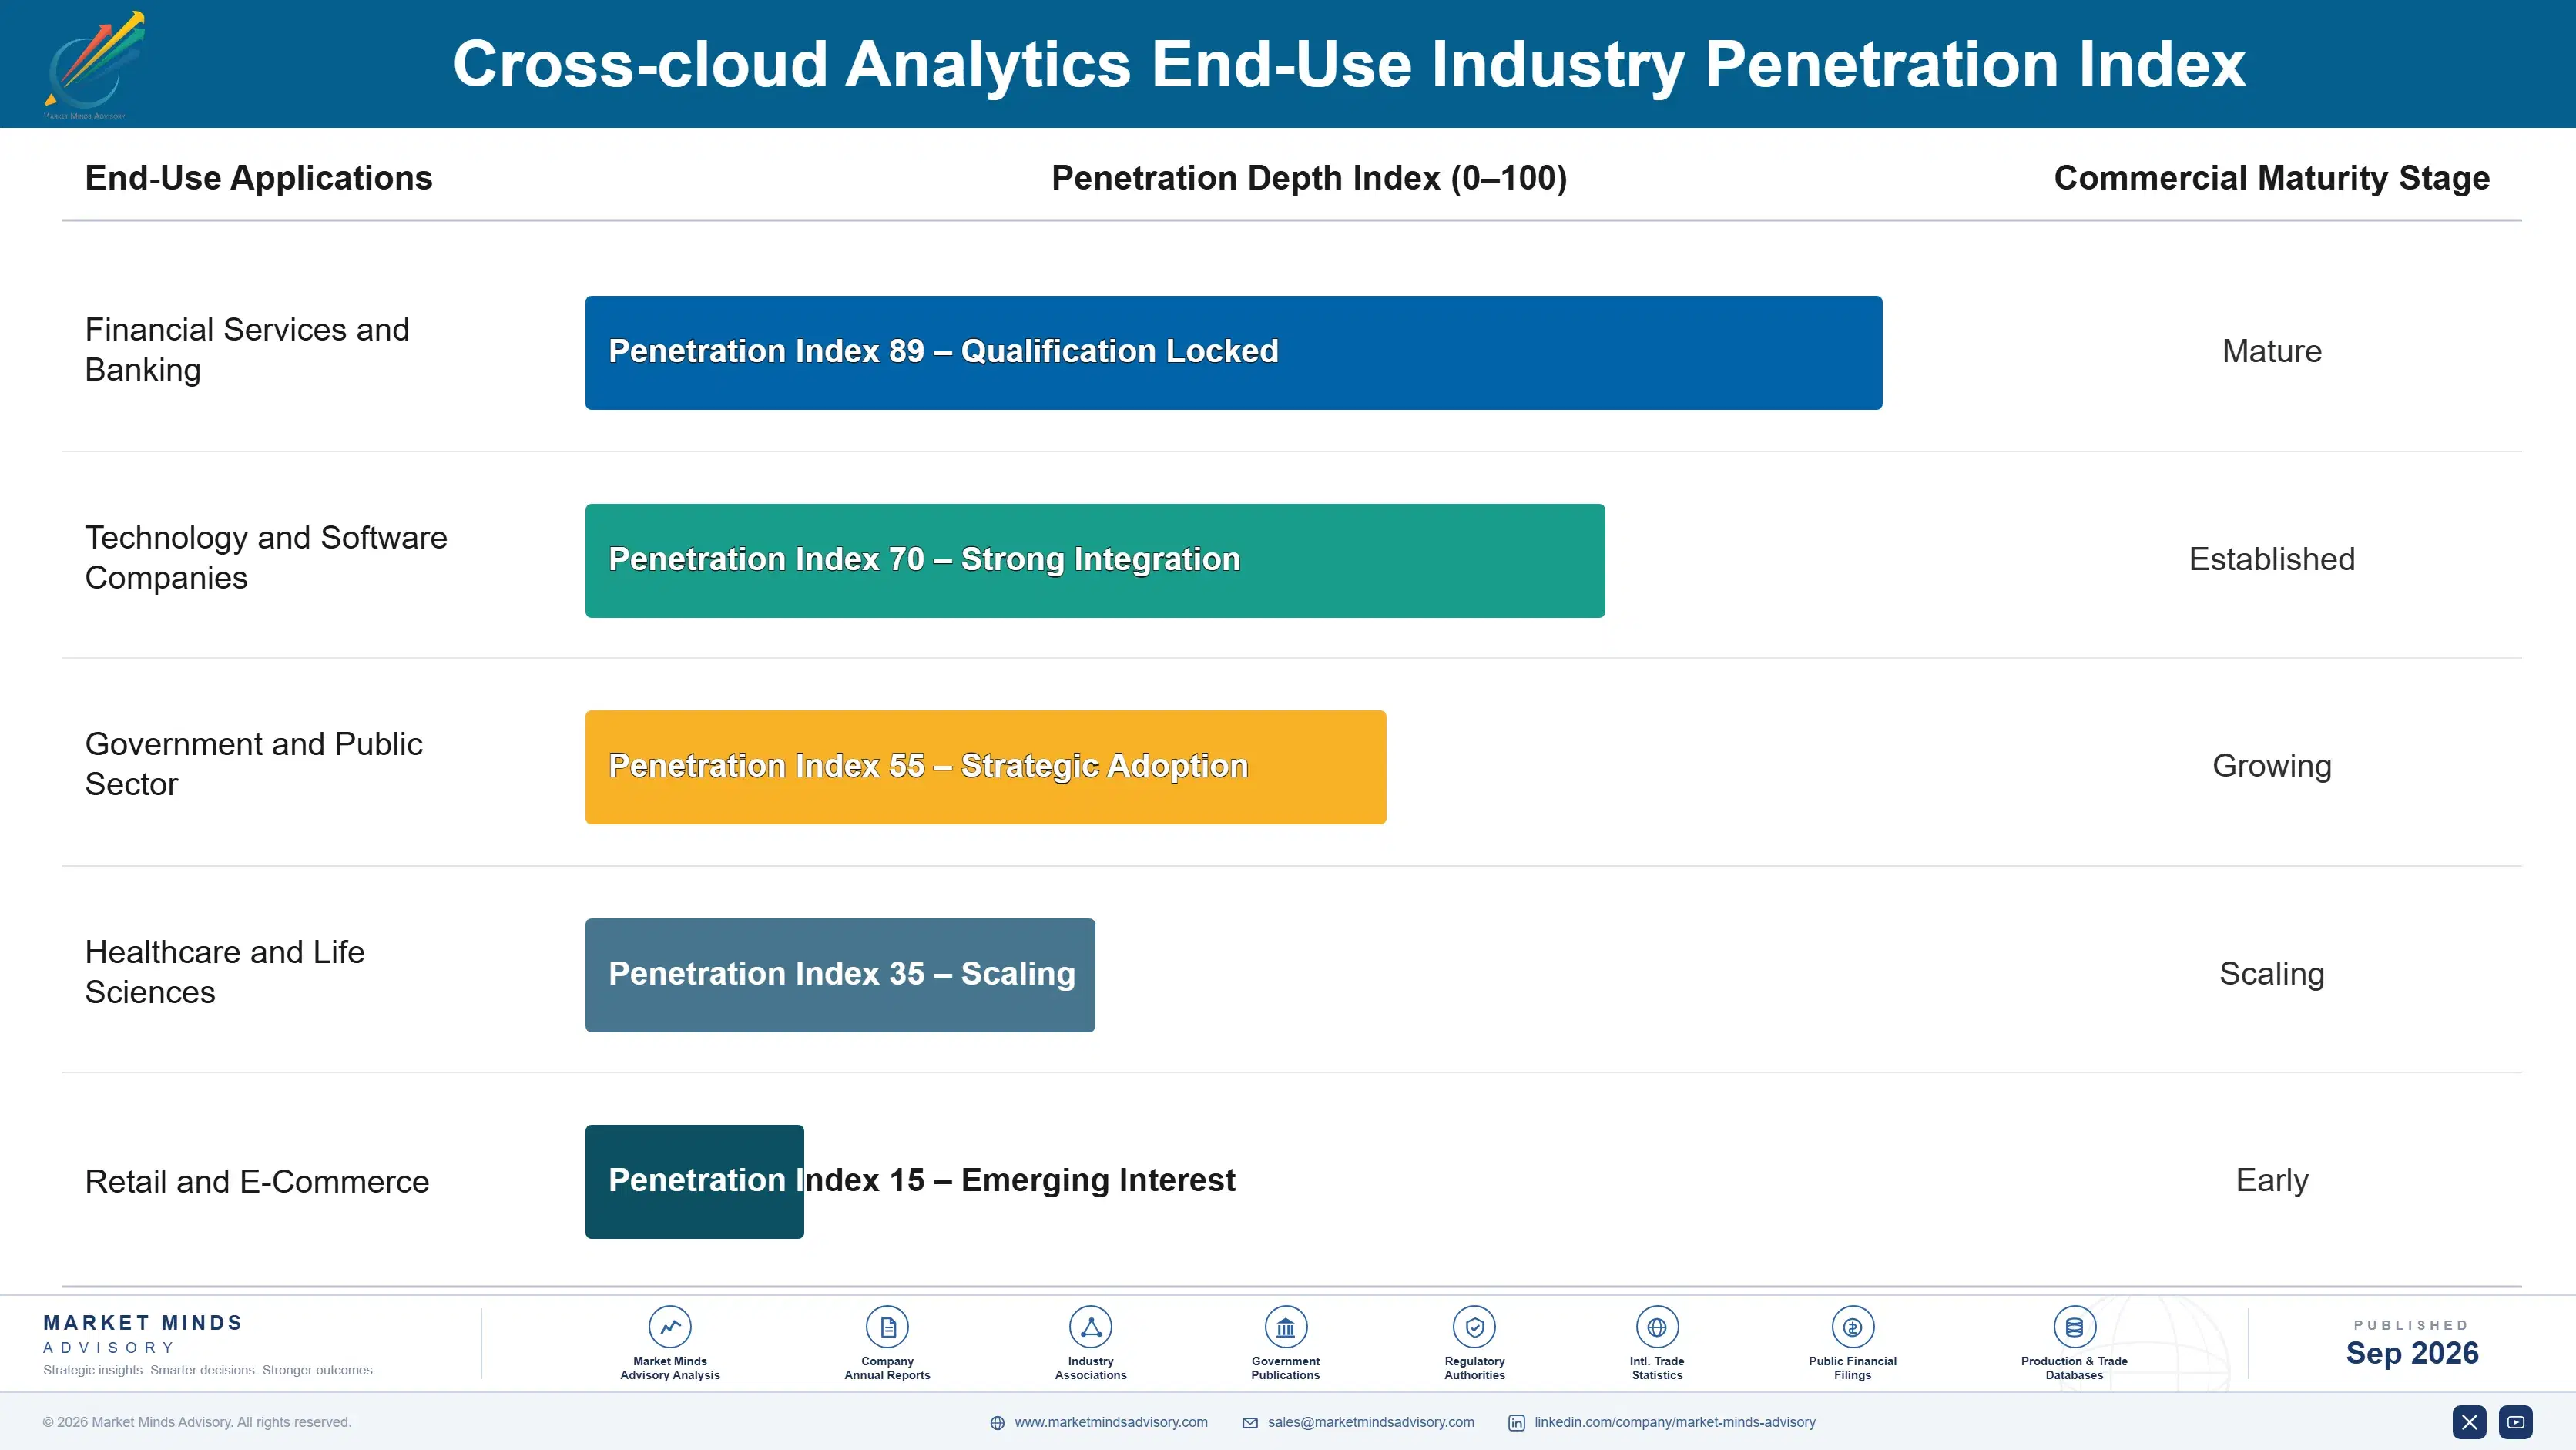
Contracts Behave Like Annuities

A cross-cloud analytics contract functions like an annuity rather than a single transaction, since enterprises rarely switch governance vendors once finance teams build budget processes around a specific platform's alerting thresholds and reporting formats. A single large enterprise contract can generate recurring subscription revenue across an entire multi-year budget cycle, turning one initial deployment into a durable, multi-year revenue stream for the winning vendor.
Adoption depth varies sharply by end-use vertical. Financial institutions embed governance relationships into multi-year contracts tied to regulatory reporting requirements, while technology companies treat deployment as a more standardized, engineering-driven rollout decision. Government agencies sit at an earlier adoption stage, favoring smaller pilot deployments for now. That spread explains why unit volume and margin diverge across these three verticals.

Buyer profiles are shifting generationally as well. A newer cohort of finance and IT leaders, trained on cloud cost accountability from early in their careers, increasingly defaults to unified governance platforms over legacy single-cloud dashboards. Older IT operations teams in established enterprise accounts still favor familiar per-provider tools, though retirement and workforce turnover are steadily closing that generational gap across the forecast decade.
cross-cloud-analytics-market-end-use-penetration-index-1788415602207

Where Vendors Should Focus

These are among the four positions where our research anticipates prominent divergence between winners and laggards over the coming forecast period. Each is grounded in the demand model, the regulatory perimeter, and the announced capacity pipeline.
01 / GOVERNANCE DEPTH INVESTMENT PRIORITY

Build governance depth before enterprises standardize requirements

Unified cost governance platforms already command the widest margins in the category, and that gap is widening as enterprises increasingly treat governance depth as essential to any new procurement decision rather than a discretionary upgrade layered on top. Vendors without proven governance depth risk exclusion from the fastest-growing enterprise procurement bids within the next several years, not just margin erosion, since contracts increasingly name measurable savings as a scoring criterion. Building that depth now, ahead of full market consolidation, converts a product investment into a lasting contract advantage.
02 / CONNECTOR DEVELOPMENT SPEED STRATEGY

Compress connector timelines before procurement windows close

Rapid multi-provider connector development increasingly determines which vendor wins an enterprise's evaluation, more so than raw dashboard sophistication in most competitive procurement reviews conducted today. Vendors that demonstrate proven fast connector cadence capture design wins that slower-integrating competitors cannot match, since enterprises lock vendor decisions early and rarely revisit a working governance choice. This advantage compounds as new regional cloud providers keep emerging across the forecast decade, rewarding whoever integrates fastest with the largest cumulative share of new enterprise wins.
03 / MERGER INTEGRATION SERVICES EXPANSION

Build merger integration expertise before combined enterprises standardize elsewhere

Merger integration consulting opens a qualified revenue channel that most product-only vendors have been slow to prioritize, leaving meaningful margin pools uncontested for whoever moves first into this specialty. Vendors that invest in dedicated merger integration expertise now capture combined enterprise volume that generic product vendors simply cannot bid on, since these engagements require specialized consolidation experience most generalist product vendors simply lack. That head start should compound steadily as corporate merger activity keeps generating new multi-cloud estates across every industry vertical worldwide.
04 / NATIVE TOOL RESPONSE STRATEGY

Differentiate against bundled tools before providers close the functionality gap

Major cloud providers expanding native cost management tools threaten to erode independent vendors' addressable market as bundled functionality improves and enterprises accept partial free alternatives over paid subscriptions. Vendors that clearly differentiate analytical depth now retain enterprise accounts rather than losing them entirely to free bundled tools that most enterprises already have direct access to today at no additional cost. Waiting until native tools fully close this functionality gap will make this positioning meaningfully harder, slower, and considerably more costly to establish.

Engagement Snapshot From the Field

A live engagement with an industry participant carrying material or product regulatory and market exposure ahead of a defining policy shift, showing how our research translates into a defensible multi-year portfolio strategy.
MARKET MINDS ADVISORY · CLIENT ENGAGEMENT SUMMARY
Cross-cloud Analytics Producer Strategic Portfolio Review and Transition Roadmap 2026·Investment Scenario on Cross-cloud Analytics Exposure Evaluation 2025-26
CLIENT PROFILE
The client is a global financial institution operating across three major cloud providers, with annual cloud infrastructure spending in the tens of millions of dollars (client-reported, unverified by MMA). The institution had historically managed spend through separate provider-native dashboards without unified governance. Rising cloud budget overruns prompted leadership to reconsider its governance technology roadmap. Business unit leaders lacked shared visibility into total spend.
STRATEGIC CHALLENGE
Recurring cloud budget overruns and fragmented visibility across providers forced the institution to reconsider its governance strategy within a compressed annual budget planning cycle. Management needed to decide whether to deploy a unified governance platform across the full multi-cloud estate, pilot it in a subset of business units first, or maintain existing provider-native dashboards despite the ongoing visibility gaps.
MMA APPROACH
MMA conducted structured interviews with the institution's chief financial officer and cloud infrastructure leadership alongside a benchmarking exercise against three peer financial institutions' governance platform deployments and vendor relationships across comparable multi-cloud estates. The engagement combined primary qualitative interviews with MMA's proprietary cross-cloud analytics market dataset to assess vendor claims, deployment costs, and realized savings under each rollout option.
KEY FINDINGS
  1. Unified governance deployment reduced cloud spend by roughly twenty percent compared to fragmented provider-native dashboards within the first year (client-reported, unverified by MMA).
  2. Peer financial institutions that piloted governance platforms before full rollout reported fewer budget reconciliation issues than those deploying across all business units immediately.
  3. Full institution-wide deployment would have required implementation investment the engagement estimated at ten months beyond the institution's current budget cycle timeline. Timing constraints made a phased approach the more practical path.
  4. Institutions that piloted deployment in highest-spend business units first captured most of the savings benefit at a fraction of full rollout cost.
CLIENT PROFILE
The client is a global financial institution operating across three major cloud providers, with annual cloud infrastructure spending in the tens of millions of dollars (client-reported, unverified by MMA). The institution had historically managed spend through separate provider-native dashboards without unified governance. Rising cloud budget overruns prompted leadership to reconsider its governance technology roadmap. Business unit leaders lacked shared visibility into total spend.
STRATEGIC CHALLENGE
Recurring cloud budget overruns and fragmented visibility across providers forced the institution to reconsider its governance strategy within a compressed annual budget planning cycle. Management needed to decide whether to deploy a unified governance platform across the full multi-cloud estate, pilot it in a subset of business units first, or maintain existing provider-native dashboards despite the ongoing visibility gaps.
MMA APPROACH
MMA conducted structured interviews with the institution's chief financial officer and cloud infrastructure leadership alongside a benchmarking exercise against three peer financial institutions' governance platform deployments and vendor relationships across comparable multi-cloud estates. The engagement combined primary qualitative interviews with MMA's proprietary cross-cloud analytics market dataset to assess vendor claims, deployment costs, and realized savings under each rollout option.
KEY FINDINGS
  1. Unified governance deployment reduced cloud spend by roughly twenty percent compared to fragmented provider-native dashboards within the first year (client-reported, unverified by MMA).
  2. Peer financial institutions that piloted governance platforms before full rollout reported fewer budget reconciliation issues than those deploying across all business units immediately.
  3. Full institution-wide deployment would have required implementation investment the engagement estimated at ten months beyond the institution's current budget cycle timeline. Timing constraints made a phased approach the more practical path.
  4. Institutions that piloted deployment in highest-spend business units first captured most of the savings benefit at a fraction of full rollout cost.
RECOMMENDED STRATEGY
Phase 1: Phase 1 (Months 1-3): Deploy unified governance across the three highest-spend business units identified through historical budget and cost review data. Phase 2: Phase 2 (Months 4-9): Evaluate pilot performance carefully and expand deployment to additional business units based on demonstrated savings outcomes achieved. Phase 3: Phase 3 (Months 10-15): Negotiate an institution-wide vendor agreement covering full multi-cloud estate coverage over the following fiscal budget cycle.
OUTCOME
Within fifteen months of implementation, the institution reported a reduction in overall cloud spend tied to unified governance deployment of approximately eighteen percent (client-reported, unverified by MMA). The phased approach demonstrated sufficient savings to justify expanded deployment, and the institution has since committed to a fully unified governance strategy across its entire multi-cloud estate.

Frequently Asked Questions

Foundational context covering the market sizes, CAGR, scope, country, region and competition that inform every finding below. This section is provided to cover basics and most often pre-purchase conversations, answered from the MMA Primary Research Dataset.

What is the current size of the Cross-cloud Analytics Market?

The Cross-cloud Analytics Market reached an estimated 6.8 billion dollars in 2025. Growth is driven by rising multi-cloud adoption and expanding enterprise cost governance requirements worldwide.

How large will the Cross-cloud Analytics Market be by 2036?

MMA projects the market will reach approximately 27.11 billion dollars by 2036 under the base case scenario. This represents more than three times the 2026 opening value over the ten year forecast window.

What is the CAGR for the Cross-cloud Analytics Market 2026 to 2036?

The base case compound annual growth rate is 13.4 percent across the forecast period. Bull and bear scenarios range from 14.7 percent to 12.1 percent depending on enterprise adoption pace.

Which segment is growing fastest?

Unified Multi-Cloud Cost Governance Platforms is the fastest growing segment, expanding at 19.8 percent annually. That is roughly 1.48 times the overall market growth rate through 2036.

Who are the major companies in the Cross-cloud Analytics Market?

Leading participants include Datadog, CloudHealth by VMware, Flexera, Densify, and Apptio, all continuing to expand platform coverage. Together these five companies hold a combined revenue share estimated near 46 percent.

Which country is growing fastest?

India is the fastest growing country market, supported by its expanding technology services sector managing multi-cloud infrastructure for Western enterprise clients. Demand is further reinforced by growing government digital transformation programs nationwide.

Report Segmentation Architecture

The full report scope spans multiple orthogonal segmentation dimensions, with cross-tabulated demand data provided for each dimension pair. Coverage extends further to regional breakdowns, trend trajectories, and the competitive detail needed to support segment-level decision-making.

By Primary Market Dimension

  • Unified Multi-Cloud Cost Governance Platforms
  • Cross-Cloud Performance Monitoring Platforms
  • Multi-Cloud Security Posture Analytics
  • Cross-Cloud Data Pipeline Observability
  • Automated Remediation and Optimization Tools
  • Merger Integration Consulting Services

By End-Use Industry

  • Financial Services and Banking
  • Technology and Software Companies
  • Government and Public Sector
  • Healthcare and Life Sciences
  • Retail and E-Commerce

By Commercial Dimension

  • Direct Enterprise Sales
  • Managed Service Provider Partnerships
  • System Integrator Channel Sales
  • Cloud Marketplace Distribution

By Region

  • North America
  • Western Europe
  • East Asia
  • South Asia and Pacific
  • Latin America
  • Middle East and Africa
  • Eastern Europe

Scope, Methodology, and Coverage

Every figure in this report is reproducible from documented input assumptions. The scope below maps the historical period, the forecast horizon, the segmentation dimensions, and the countries covered, alongside the underlying primary and qualitative methodology.
Historical Period
2020 to 2025
Forecast Period
2026 to 2036
Base Year
2025 (USD billions; MMA Primary Research Dataset, September 2026)
Market Definition
This market covers software platforms that aggregate cost, performance, and usage analytics across multiple public cloud providers into a single unified interface. It excludes single-cloud native monitoring tools and general-purpose business intelligence software.
Quantitative Units
USD billions (current prices); subscription contract value where noted
Segmentation Dimensions
By Primary Market Dimension; By End-Use Industry; By Commercial Dimension; By Region
Regions Covered
North America, Western Europe, East Asia, South Asia and Pacific, Latin America, Middle East and Africa, Eastern Europe
Countries Covered
USA, Canada, UK, Germany, France, Japan, South Korea, China, Taiwan, India, Australia, Brazil, Mexico, Argentina, UAE, Saudi Arabia, South Africa, Egypt, Poland, Czech Republic, Romania, Hungary, Slovakia, Netherlands, Italy, Spain, Sweden, Singapore, Vietnam, Indonesia, and additional markets relevant to this sector
Key Companies Profiled
Datadog, CloudHealth by VMware, Flexera, Densify, Apptio, New Relic, Dynatrace, Splunk, Anodot, Nutanix Beam, CloudCheckr, Turbonomic, ServiceNow, Kubecost, Harness, Zesty, Spot by NetApp, Yotascale, CAST AI, Vantage
Quantitative Methodology
Primary survey, n=3,800 respondents, Q4 2025, six countries; demand-side model with trade association cross-validation
Qualitative Methodology
47 expert interviews, Q4 2025; applied to validate demand model assumptions, identify emerging dynamics, and assess competitive positioning
Report Format
PDF and XLSX data workbook (Word format preview document)
Publisher
Market Minds Advisory
Report Code
MMA-2026-TEC-176
Published
September 2026
Contact
sales@marketmindsadvisory.com | www.marketmindsadvisory.com

Purchase the full Cross-cloud Analytics Market Report (2026 to 2036).

This report provides comprehensive analysis of the Cross-cloud Analytics Market, covering size, forecasts, segmentation, and regional dynamics through 2036. It examines competitive positioning among leading enterprise software vendors, input cost exposure across data egress fees and specialized engineering talent, and portfolio economics across volume, premium, and next-generation tiers. The analysis draws on primary survey data covering 3,800 respondents and 47 expert interviews conducted in the fourth quarter of 2025. Buyers receive a complete strategic view suitable for investment planning, procurement strategy, and competitive benchmarking decisions across the enterprise cloud value chain.
Full ten-year market and segment forecasts through 2036
Regional analysis across all seven MMA-tracked geographies
Competitive benchmarking of top five and fifteen additional players
Data egress and engineering talent cost exposure analysis
Revenue lever framework tied to quantified commercial impact
Anonymised financial institution case study with strategy phasing

Built For The People Who Decide

From boardroom strategy to bench-side execution, this report is read cover-to-cover by leaders shaping the next decade of their industry, turning demand scenarios, market dynamics and valuation benchmarks into decisions.
CXOs/ Presidents/ VPs/ Managers
M&A and Corporate Development
Strategy Teams and R&D Heads
Procurement and Product Directors
Regulatory and Compliance Leaders
Investor Relations and Equity Analysts