Market Minds Advisory
Critical Power and Cooling Market

Critical Power and Cooling Market: AI Data Center Thermal Density Is Forcing a Generational Equipment Transition

AI training cluster power density is outpacing what conventional air-cooled data center infrastructure can dissipate, forcing operators toward liquid cooling and higher-capacity power equipment faster than most facilities can be retrofitted.

Lead Analyst

David Horsley

Published

September 2026

Make Smarter Decisions with Customized Research Insights

Request a free sample report and evaluate market opportunities, growth trends, and competitive dynamics relevant to your business needs.

2025 MARKET VALUE$24.5BMarket Size 2025
2036 FORECAST VALUE$62.6BBase Case , 2026 to 2036
CAGR 2026 TO 20368.9 %Bull 10.1% / Bear 7.7%
INCREMENTAL OPPORTUNITY$35.9BNet 10- year value creation
EXPANSION MULTIPLE2.35x2036 value over 2026 base
Strategic Levers
M&A Pipeline
Regional Outlook
Country Rankings
Competitive Intelligence
Segmental Deep-dive
Call-Us : 91 93563 13602

Executive Snapshot and Market Trajectory

Critical power and cooling equipment is shifting from a steady replacement cycle into a genuine capacity expansion race as AI training cluster thermal density forces data center operators to retrofit facilities built for conventional air cooling within just a few years of commissioning.
Liquid cooling systems are pulling capital investment fastest as GPU cluster power density exceeds what conventional computer room air conditioning can dissipate reliably at scale. Power distribution and monitoring software follow closely behind, driven by operators needing tighter visibility into rapidly changing facility power budgets. North America commands the largest share, anchored by dense hyperscale data center construction and the concentration of major equipment vendors headquartered there.
Thirty eight percent of category revenue concentrates among five vendors, leaving considerable share open to specialized cooling and generator manufacturers competing on narrower functionality across smaller facility segments. A technology transition toward liquid cooling and higher-density power distribution, combined with accelerating AI infrastructure investment, is reshaping which vendors win the largest hyperscale and colocation contracts over the coming decade and beyond.
Market Definition
The market comprises uninterruptible power supply systems, precision cooling equipment, backup generators, power distribution hardware, liquid cooling systems, and monitoring software that data centers and other mission-critical facilities use to maintain continuous power and thermal management. It excludes the underlying IT hardware being powered and cooled, and excludes general commercial HVAC equipment sold outside mission-critical facility applications.
Base Year Value
$24.5B in 2025 (MMA Primary Research Dataset, August 2026)
Forecast Period
2026 to 2036, eleven discrete annual values
CAGR
8.9% base case. Bull 10.1%. Bear 7.7%.
Fastest Growth Segment
Liquid Cooling Systems: 16.5% CAGR
Fastest Growth Country
Malaysia: 14.8% CAGR
Fastest Growth Region
South Asia and Pacific: 11.0% CAGR
Largest Region
North America: 32% of 2025 global value
Market Leaders
Vertiv Holdings Co, Schneider Electric SE, Eaton Corporation plc, ABB Ltd, Legrand SA. Source: MMA Analysis based on company annual reports.
Primary Survey
n=3,800 procurement and R&D decision-makers, Q4 2025, six countries
Methodology
Demand-side build-up, cross-validated against public data, 47 expert interviews

Critical Power and Cooling Market Forecast Scenarios

critical-power-and-cooling-market-size-forecast-scenario-1787301536804
Between 2020 and 2025 the market grew at a historical pace of 7.7 percent as early hyperscale data center construction and initial liquid cooling pilots built a foundation for the faster growth phase now underway across most major data center construction markets worldwide, a transition that has since broadened well beyond its original hyperscale origins into colocation retrofits.
The base case rests on three commercial mechanisms holding together over the decade: AI training cluster power density requiring liquid cooling retrofits and new-build capacity that conventional air cooling cannot economically support, hyperscale operators expanding data center construction pipelines faster than most equipment vendors currently have manufacturing capacity to serve, and grid interconnection constraints pushing operators toward on-site backup generation capacity that extends well beyond traditional emergency backup requirements across most markets.
A bull scenario hinges on AI infrastructure investment accelerating faster than current hyperscale capital expenditure guidance suggests, pulling forward equipment orders considerably ahead of current delivery schedules. The bear case centers on a slowdown in AI infrastructure spending that would defer new data center construction and the equipment orders tied directly to those specific facility buildout timelines.

Air Cooling Infrastructure Meets an AI Density Wall

Three forces are converging on this category at once: a large installed base of conventional air-cooled infrastructure still anchoring replacement revenue, a fast-scaling liquid cooling segment paying meaningfully higher prices per rack, and grid interconnection constraints pushing operators toward on-site power generation capacity that did not previously represent a meaningful share of total equipment spending.
MARKET CONCENTRATIONCR5 38%top five vendors hold roughly two-fifths of category revenue
AVERAGE RACK POWER DENSITY45 to 80 kWtypical power density per rack across new AI-optimized deployments
LEADING DEPLOYMENT COUNTRYUSA, 27% sharelargest single-country share of installed critical infrastructure capacity
LIQUID COOLING REVENUE SHARE22% of revenueproportion of category revenue tied to liquid cooling equipment
EQUIPMENT LEAD TIME12 to 24 monthstypical order-to-delivery timeline for critical power equipment today
METAL COST SHARE33% of COGSstructural and electrical raw material proportion of equipment cost
Commercially, the market increasingly splits along facility type rather than pure equipment category. Hyperscale and AI-focused operators evaluate vendors on thermal density capability, delivery lead time, and total facility power budget, while traditional enterprise and colocation buyers still purchase largely on price, reliability track record, and proven deployment history across a much longer decision cycle overall.
Over the next decade, thermal density capability and delivery lead time will matter as much as raw equipment reliability. Vendors who move fastest to scale liquid cooling manufacturing capacity and secure long-term component supply will capture a disproportionate share of the largest hyperscale contracts before competitors with longer lead times can catch up.
"Data center cooling used to be boring in the best possible way. Now GPU racks throw off more heat per square foot than anyone budgeted for two years ago, and that has turned cooling into the tightest bottleneck in the whole build."
Director, Data Center Infrastructure Practice · MMA Data Center Infrastructure E

Market Trends

AI Cluster Density Forces Liquid Cooling Adoption

GPU-based AI training clusters now routinely exceed rack power densities that conventional computer room air conditioning cannot dissipate reliably, forcing operators to adopt direct-to-chip and immersion liquid cooling systems for new AI-optimized facility construction. Several major hyperscale operators have disclosed that new AI-focused data center campuses now specify liquid cooling as a default requirement rather than an optional upgrade, a shift that did not exist at comparable scale before the current AI infrastructure buildout began in earnest. This has pulled liquid cooling equipment demand into mainstream data center construction budgets far faster than the technology's historical adoption curve in specialized high-performance computing applications alone would have suggested across the industry.
Market Impact: Backlogs exceed 2x annual capacity
Grid Constraints Expand On-Site Generation Demand

Grid interconnection queues in several major data center construction markets have stretched well beyond historical timelines, pushing operators to invest in substantially larger on-site backup and, in some cases, primary power generation capacity than traditional emergency backup planning would require. Several developers have disclosed deploying on-site generation capacity representing a meaningful share of total facility power budget specifically to bridge extended grid connection delays rather than for emergency backup purposes alone. This trend is reshaping generator specification requirements toward continuous-duty rated equipment that differs meaningfully from traditional standby-rated backup generators.
Market Impact: Covers 30%-plus of existing facilit

Market Opportunities and Growth Drivers

Hyperscale Capital Expenditure Sustains Order Pipeline

Major hyperscale cloud and AI infrastructure operators have disclosed substantial capital expenditure guidance increases specifically citing data center capacity expansion, creating an order pipeline for critical power and cooling equipment that extends multiple years beyond current delivery schedules across most manufacturing regions. Several equipment vendors have disclosed order backlogs representing a meaningful multiple of their current annual production capacity, evidence of sustained hyperscale commitment despite equipment lead times stretching well beyond historical norms. This demand base provides vendors with unusually clear multi-year revenue visibility relative to most other industrial equipment categories tracked today.
Market Impact: Adds 12-24 months to lead times tod

Colocation Operators Retrofit Facilities for Higher Density

Colocation providers are increasingly retrofitting existing facilities with higher-capacity power distribution and liquid cooling capability to serve AI workload customers who would otherwise migrate to purpose-built hyperscale or specialized AI facilities instead across their regional markets. Several major colocation operators have disclosed retrofit programs covering a meaningful share of their existing facility portfolio specifically to support higher rack density AI workloads. This retrofit wave represents a distinct commercial opportunity from new-build construction, since retrofit projects require equipment specifically engineered for integration into existing electrical and structural infrastructure constraints already in place.
Market Impact: Ties 33% of cost to metals

Market Restraints and Challenges

Equipment Lead Times Constrain Capacity Expansion

Critical power and cooling equipment lead times have stretched to twelve to twenty four months across several major equipment categories, directly constraining how quickly operators can bring new data center capacity online regardless of available capital or completed facility construction. The root cause is that transformer, switchgear, and generator manufacturing capacity has not scaled as quickly as data center construction demand, leaving equipment supply as the binding constraint on new capacity commissioning timelines industry-wide today. The commercial impact falls hardest on operators without long-term supply agreements securing priority manufacturing slots. Vendors are mitigating this through capacity expansion investment and longer-term component supply agreements that secure priority production allocation across their order books.
Market Impact: Tops 80 kW per rack

Copper and Steel Cost Volatility Compresses Margin

Copper and steel together account for roughly a third of finished equipment cost, leaving manufacturers directly exposed to commodity price swings that affect broader construction and electrical equipment markets, with limited ability to pass through sudden cost increases on already-signed fixed-price contracts. The root cause is that critical power equipment carries substantial raw material content relative to finished product value, particularly in transformers and generators where copper windings represent a meaningful share of total material cost overall. The commercial impact falls hardest on smaller manufacturers lacking hedging capability or long-term supply contracts. Manufacturers are mitigating this through multi-year fixed-price metal agreements and gradual design substitution toward lighter component profiles.
Market Impact: Extends backup runtime past 72 hour
4 additional market trends, 3 additional growth drivers, and 3 additional restraints and challenges are covered in the full report. Contact sales@marketmindsadvisory.com to access the complete intelligence.

Segment CAGR and Growth Architecture

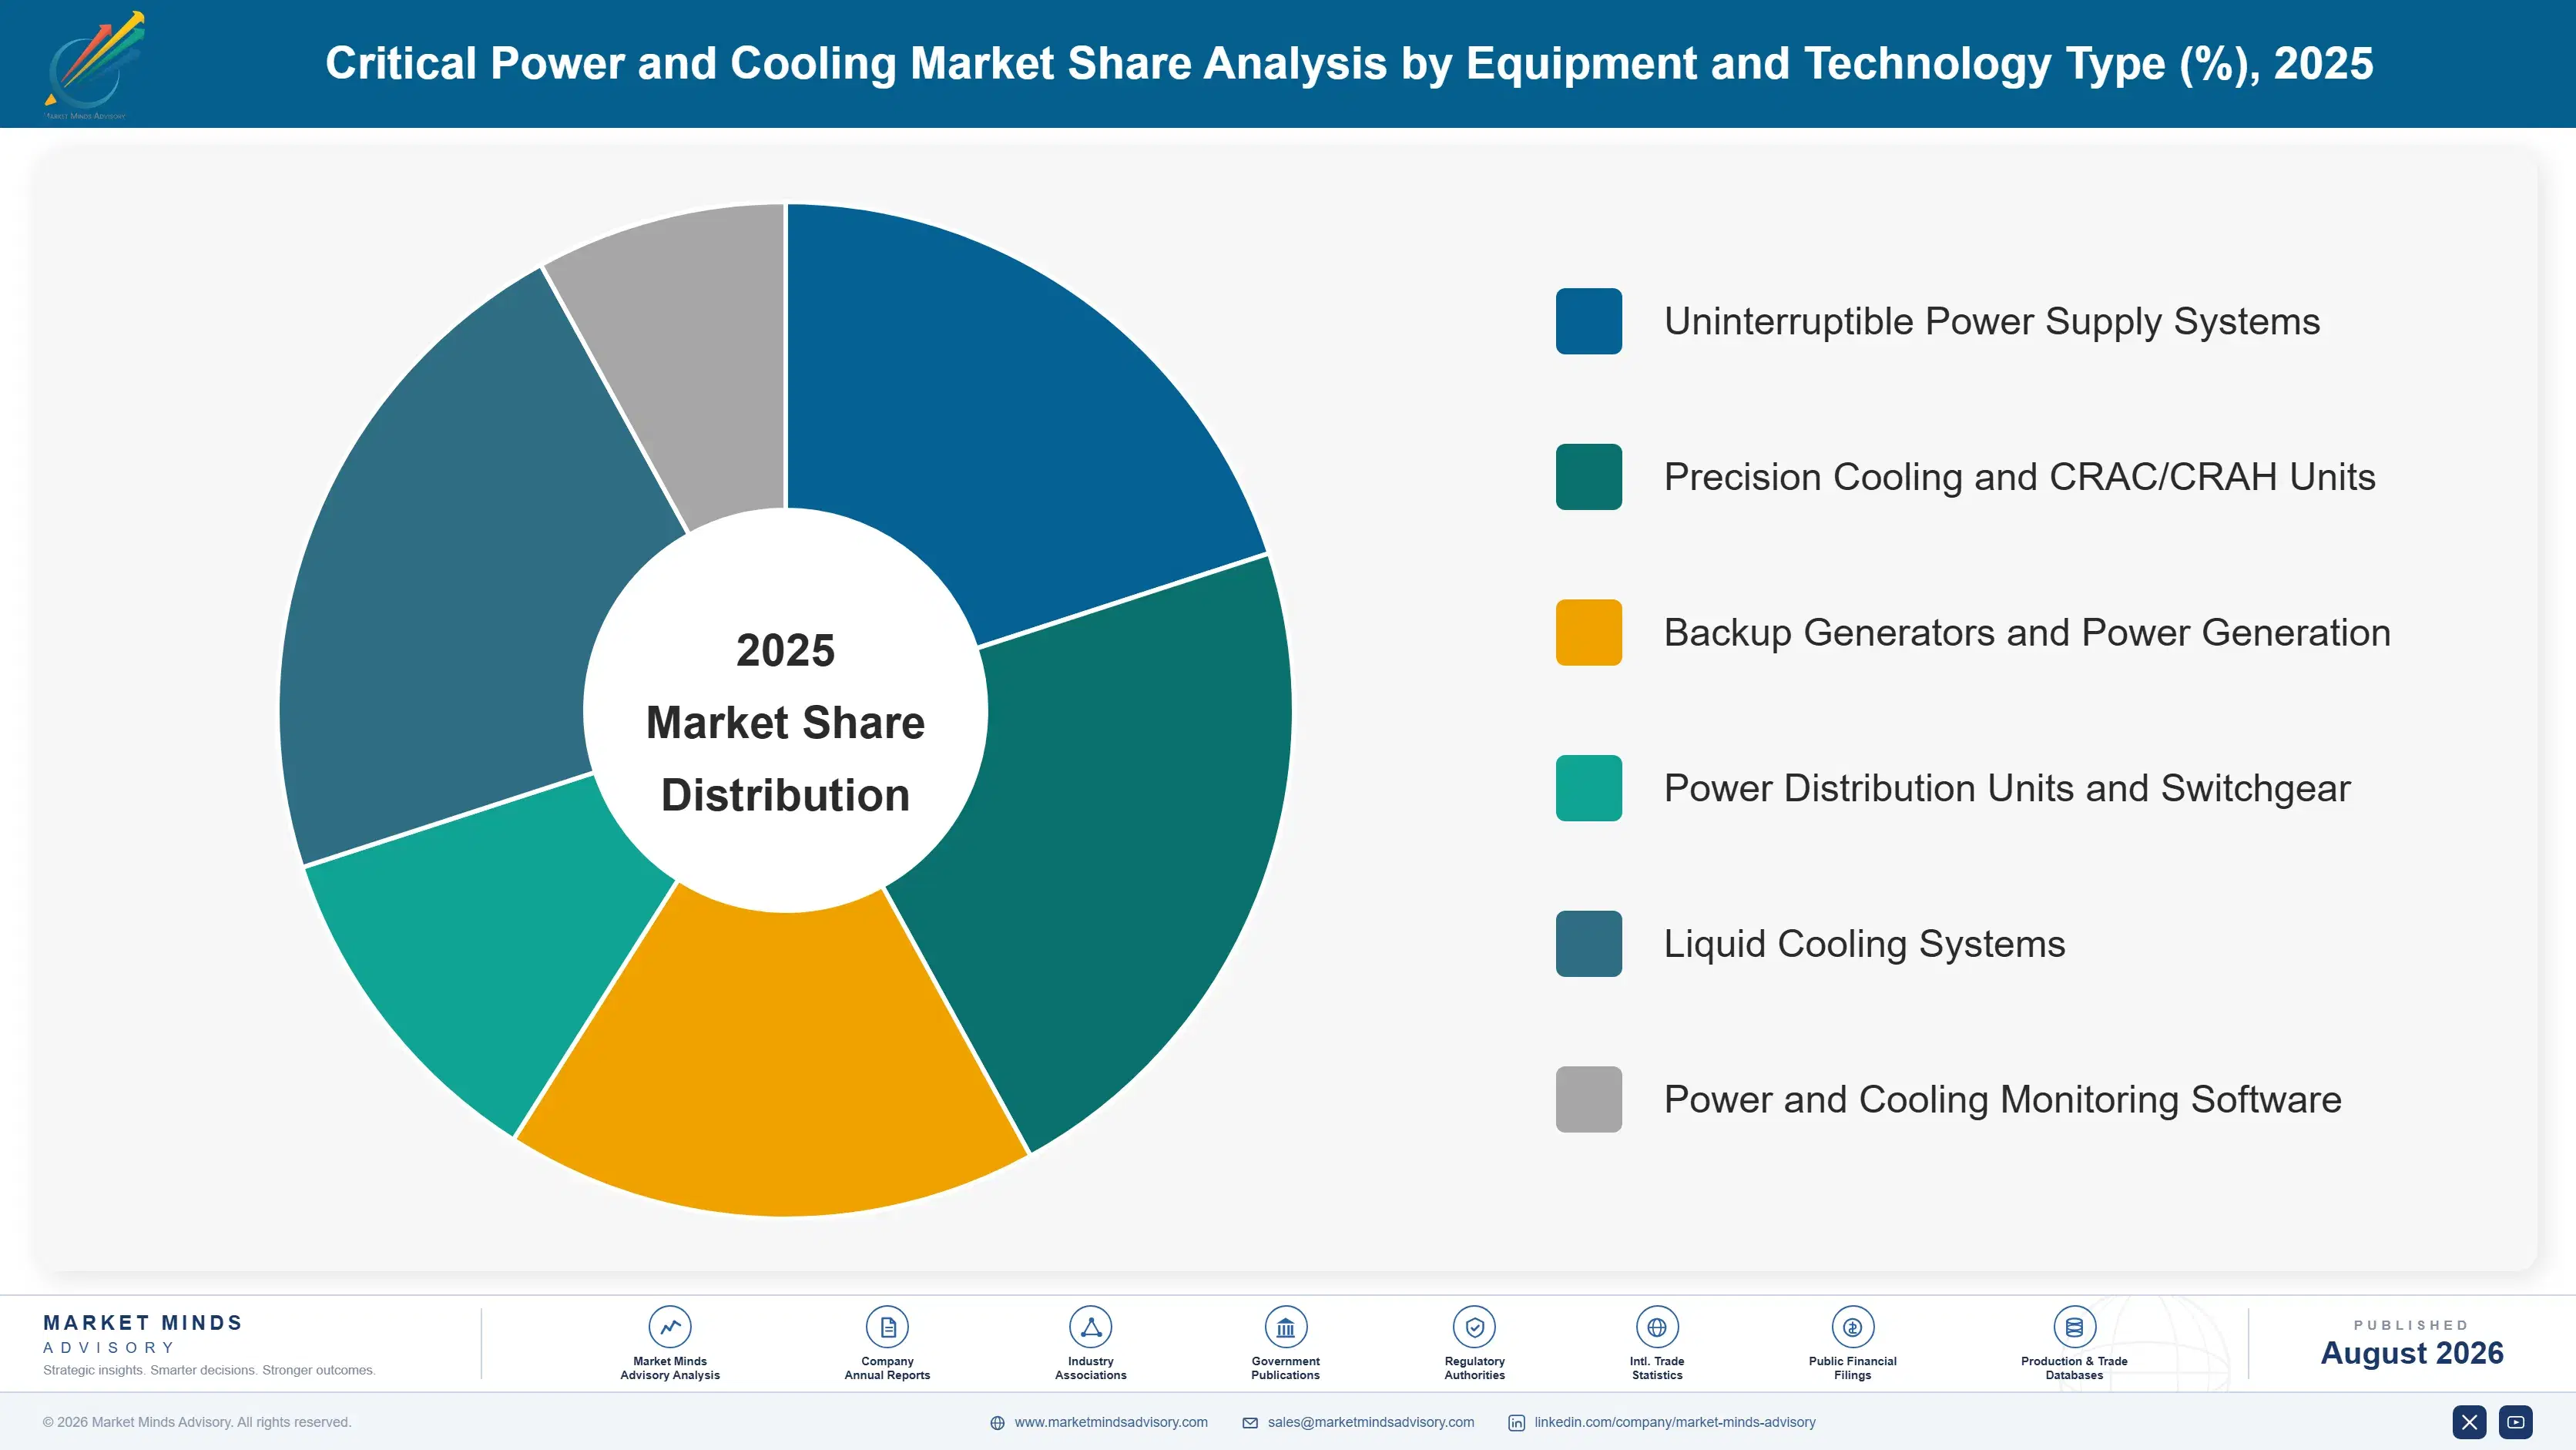
Segmentation follows equipment and technology type, the dimension operators use to specify critical infrastructure for a given facility's power and thermal requirements. Liquid cooling systems are treated as a distinct category given their fundamentally different engineering requirements relative to conventional air cooling equipment sold separately, since buyers evaluate each on different criteria entirely.
critical-power-and-cooling-market-market-share-analysis-1787301537343

Liquid Cooling Systems

Liquid cooling systems are the fastest-growing category, encompassing direct-to-chip and immersion cooling technology engineered to dissipate heat from GPU-based AI training clusters that conventional air cooling cannot reliably manage at current rack power density levels. Demand concentrates among hyperscale and AI-focused operators building new facilities specifically designed around liquid cooling requirements rather than retrofitting conventional air-cooled infrastructure after the fact. Production capacity for this specialized equipment remains constrained by the thermal engineering and manufacturing expertise required, a barrier that differs from conventional air cooling equipment experience most established vendors already possess. Vendors with proven deployment track records at hyperscale facility scale are winning a disproportionate share of new orders, since operators increasingly evaluate delivery reliability as heavily as thermal performance when selecting a cooling vendor.
CAGR 16.5%

Power and Cooling Monitoring Software

Power and cooling monitoring software, which provides real-time visibility into facility power budgets and thermal performance across increasingly complex mixed air and liquid cooling deployments, forms the second-fastest-growing category as operators need tighter operational control over rapidly changing facility power allocation. Demand concentrates among hyperscale and large colocation operators managing facilities with mixed cooling technologies simultaneously, where manual power budget tracking cannot keep pace with rapidly shifting workload allocation across racks. Growth tracks the broader liquid cooling buildout closely, since mixed cooling deployments require considerably more sophisticated monitoring than uniform air-cooled facilities historically needed. Vendors with proven integration depth across multiple equipment vendor product lines hold a meaningful advantage over single-vendor monitoring tools attempting to serve increasingly heterogeneous facility environments.
CAGR 11.5%
Full segment breakdown across 6 segments available in the complete report.

Regional Architecture and Country Demand Map

North America commands the largest share given dense hyperscale data center construction and the concentration of major equipment vendors headquartered there, while South Asia and Pacific shows the fastest regional growth on expanding data center investment and overflow capacity demand.

North America

The United States anchors the region's demand overwhelmingly, home to Vertiv and dense hyperscale data center construction concentrated in Virginia, Texas, and a growing number of secondary markets driven by AI infrastructure investment nationwide. Federal and state-level incentive programs supporting domestic manufacturing continue pulling additional critical equipment production capacity onshore across several announced facilities. Canada's growing data center construction sector, supported by favorable power pricing and cooler climate conditions, sustains steady demand tied to expanding hyperscale interest in the region overall today. Mexico's expanding data center sector, tied to nearshoring investment and growing cloud infrastructure demand, is driving growing demand for critical power and cooling equipment nationwide and near the border.
Share: 32% | CAGR: 9.6% (2026 to 2036)

Western Europe

Germany anchors the region's demand, home to a substantial concentration of enterprise and colocation data center capacity supported by dense industrial power infrastructure and skilled technical labor availability. Ireland and the Netherlands both host significant hyperscale data center concentrations, though grid capacity constraints in both countries have increasingly limited new facility approvals and pushed operators toward alternative locations. France's growing data center sector benefits from access to substantial nuclear-generated baseload power capacity relative to other European markets facing tighter grid constraints. The United Kingdom sustains steady demand tied to its established financial services and enterprise data center base, though grid connection delays have become a meaningful constraint on new capacity.
Share: 20% | CAGR: 7.3% (2026 to 2036)
Regional intelligence for 5 additional markets available in the complete report: East Asia, South Asia and Pacific, Latin America, Middle East and Africa, Eastern Europe. Contact sales@marketmindsadvisory.com.
critical-power-and-cooling-market-country-cagr-analysis-1787301537869

Where Vendors Can Defend Category Margin

As conventional air cooling equipment pricing compresses under broader competition, vendors are shifting commercial strategy toward liquid cooling capacity, long-term supply agreements, and monitoring software integration to defend margin across the fastest-growing hyperscale contracts over the coming decade and beyond, a shift that rewards vendors who move first across every facility segment they serve.

Scale Liquid Cooling Manufacturing Capacity Early

Vendors who scale liquid cooling manufacturing capacity ahead of broader industry adoption are winning a disproportionate share of hyperscale contracts, since operators increasingly demand proven delivery capability before committing to a vendor for a major facility build given current lead time constraints across the industry today. Vendors with established manufacturing scale report win rates roughly 2x higher than competitors still building out production capacity without comparable delivery track records. This lever requires substantial upfront capital investment but converts into a durable competitive advantage that later entrants cannot replicate quickly across the sector.
Market Impact: Doubles hyperscale win rate to roug

Secure Long-Term Component Supply Agreements Early

Vendors who secure long-term supply agreements directly with copper, steel, and semiconductor component suppliers are locking in production capacity and pricing ahead of broader market competition for the same constrained inputs, since component availability increasingly determines which vendors can actually meet promised delivery timelines across their order books. Vendors with established supply agreements report meaningfully shorter delivery timelines, in several cases exceeding 30 percent faster, than competitors relying on spot market component purchasing. This lever requires sustained relationship investment but converts into a durable, multi-year delivery advantage.
Market Impact: Cuts delivery time by over 30% over

Build Deep Cross-Vendor Software Integration

Vendors who build monitoring software capable of integrating across multiple equipment vendor platforms simultaneously are winning a disproportionate share of large facility contracts, since operators managing mixed air and liquid cooling deployments strongly prefer unified visibility over separate vendor-specific monitoring tools that do not communicate with each other across the facility. Vendors with proven cross-vendor integration report contract values roughly 25 percent higher than competitors offering only single-vendor monitoring capability for comparable facility scale. This lever requires sustained software investment but converts into a durable, multi-year revenue relationship worth defending.
Market Impact: Lifts contract value roughly 25% on

Establish Continuous-Duty Generation Lines Early

Vendors who establish dedicated continuous-duty rated generation product lines, rather than relying entirely on traditional standby-rated backup equipment, are capturing a growing category of spending tied directly to grid interconnection delays rather than emergency backup requirements alone. Vendors with continuous-duty product lines report contract values roughly 35 percent higher than comparable standby-only equipment sales for similar total generation capacity delivered. This lever requires substantial product engineering investment but delivers outsized revenue predictability once established across the operator's account base.
Market Impact: Lifts total contract value roughly

Who Controls the Margin Pool

The top five vendors hold roughly 38 percent of revenue on a company-revenue basis, a moderately concentrated structure reflecting how conventional air cooling and standard power distribution equipment remain accessible to numerous specialized manufacturers even as liquid cooling and continuous-duty generation concentrate among a narrower set of vendors with proven hyperscale delivery credentials. The gap between Vertiv and Schneider Electric, the two largest vendors, and the broader field remai
Current competitive activity centers on three fronts: liquid cooling manufacturing capacity races to win the largest hyperscale contracts, long-term component supply agreement investment designed to secure priority production allocation, and monitoring software integration intended to win the largest mixed-technology facility contracts across the industry.

Pressure is building from specialized liquid cooling startups and Asian manufacturers, who are moving into segments that traditional power and cooling vendors previously controlled entirely on their own. Several have already won reference contracts with major hyperscale operators, evidence that could reshape competitive dynamics faster than established incumbents currently expect across the broader industry.
critical-power-and-cooling-market-company-positioning-matrix-1787301538391

Competitive Moat and Risk Dimensions

VERTIV HOLDINGS CO

Moat: Broadest Integrated Equipment Portfolio

Vertiv operates one of the industry's broadest critical infrastructure portfolios spanning power, cooling, and monitoring software, giving it customer relationships across nearly every facility function that narrower point-solution competitors cannot easily match without comparable decades of accumulated product investment behind them.
VERTIV HOLDINGS CO

Risk: Premium Pricing Invites Value Competition

Vertiv's premium brand positioning and pricing create an opening for well-capitalized Asian manufacturers offering comparable core equipment performance at meaningfully lower prices, particularly in cost-sensitive standard air cooling segments where brand loyalty matters considerably less to price-focused buyers today.
SCHNEIDER ELECTRIC SE

Moat: Deepest Power Distribution Expertise

Schneider Electric has built particularly deep expertise in power distribution and electrical switchgear across decades of industrial electrical equipment manufacturing, giving it a qualification advantage in demanding hyperscale power architecture projects that newer entrants have been slower to develop with comparable depth.
SCHNEIDER ELECTRIC SE

Risk: Slower Liquid Cooling Product Expansion

Schneider Electric has moved somewhat more slowly than dedicated cooling specialists to build out its liquid cooling product portfolio, potentially ceding early-mover advantage in the fastest-growing segment of the market to competitors who prioritized that technology earlier in their product roadmaps.

Players Tracked

Prominent Players

Vertiv Holdings Co
Schneider Electric SE
Eaton Corporation plc
ABB Ltd
Legrand SA

Other Key Players

Rittal GmbH & Co. KG
STULZ GmbH
Delta Electronics, Inc.
Huawei Digital Power Technologies Co., Ltd.
Mitsubishi Electric Corporation
Generac Power Systems, Inc.
Cummins Inc.
CyberPower Systems, Inc.
Trane Technologies plc
Johnson Controls International plc
CoolIT Systems Inc.
Munters Group AB
Piller Power Systems
Socomec Group
KOHLER Co.

Recent Developments

FEBRUARY 2025

Vertiv Launches New Direct-to-Chip Liquid Cooling Platform

Vertiv introduced an organic product launch of a new direct-to-chip liquid cooling platform designed for high-density AI training cluster deployments, expanding its manufacturing capacity specifically to meet growing hyperscale operator demand for proven liquid cooling equipment at scale worldwide.
Signal: Established critical infrastructure vendor
AUGUST 2025

Schneider Electric Signs Multi-Year Supply Agreement With Major Hyperscale Operator

Schneider Electric signed a multi-year equipment supply agreement, not an acquisition or joint venture, with a major hyperscale cloud operator to provide power distribution and cooling equipment across the customer's expanding data center construction pipeline, securing predictable multi-year order revenue.
Signal: Hyperscale operators are increasingly secu
JANUARY 2026

Eaton Acquires Specialized Immersion Cooling Technology Company

Eaton completed the acquisition of a specialized immersion cooling technology company, adding proprietary thermal engineering capability rather than continuing to rely on third-party partnerships for its critical infrastructure product lines going forward across its full hyperscale customer base worldwide.
Signal: Established power and cooling vendors are

Copper and Steel Raw Material Exposure

Copper and steel together account for roughly 33 percent of cost of goods sold across the category, with electronic components, manufacturing labor, and assembly making up most of the remainder of finished equipment cost. Copper supply concentrates among a relatively small number of major global mining and refining operations, while steel sourcing draws on both domestic and imported feedstock across most manufacturing regions.
Copper prices tightened meaningfully during 2024 and 2025, when several manufacturers disclosed in earnings materials that rising demand from electrification and data center construction simultaneously pushed copper costs higher across their equipment manufacturing operations that period specifically. Several smaller manufacturers disclosed margin compression during this period as copper cost increases outpaced the price increases customers were willing to accept without contract renegotiation or delayed delivery.

Exposure varies by manufacturer scale and hedging sophistication. Larger manufacturers with long-term metal supply agreements or captive component fabrication capacity absorbed the volatility with comparatively limited disruption, while smaller manufacturers reliant entirely on spot-market metal purchasing faced sharper cost swings that occasionally opened share for better-hedged competitors during the tightest supply quarters of the cycle.
critical-power-and-cooling-market-cost-volatility-analysis-1787301538589

Secure Multi-Year Fixed-Price Metal Agreements

Leading manufacturers are increasingly securing multi-year fixed-price agreements directly with major copper and steel suppliers, trading some pricing flexibility for meaningfully greater supply certainty during periods of tight global metals market volatility across the industry, particularly during the sharpest phases of recent cycles.

Substitute Toward Lighter Component Designs

Manufacturers are redesigning transformer and generator components toward more efficient copper winding designs that reduce total material input per unit of equipment capacity, partially insulating finished cost from broader commodity price swings across product lines and export markets.

Invest In Captive Component Fabrication Capacity

Several of the largest manufacturers have built or acquired captive electrical component fabrication capacity, insulating a meaningful share of production from third-party supplier pricing pressure and allowing faster new product development cycles across their broader equipment portfolios and regional footprints.

Portfolio Architecture for Margin Defence

The market splits into three commercial tiers with distinct margin economics. Standard air-cooled UPS and cooling equipment competes largely on price and proven reliability across a mature global replacement channel, higher-capacity power distribution and standby generation carries meaningfully higher margin tied to specification complexity, and liquid cooling systems with monitoring integration command the highest margin given engineering differentiation and a constrained qualified vendor base
The tension between volume and premium positioning shapes how vendors allocate engineering investment: standard air cooling equipment still represents meaningful unit volume across enterprise and smaller colocation deployments, but nearly all incremental profit growth over the forecast period concentrates in liquid cooling and continuous-duty generation applications, where leading vendors increasingly direct thermal engineering and manufacturing capacity investment.

High-value margin pools concentrate specifically in liquid cooling systems serving the current AI infrastructure buildout and in continuous-duty generation serving grid-constrained markets. Both pools reward manufacturers who invest ahead of demand in manufacturing capacity and component supply rather than those who compete purely on standard equipment price across the broader replacement channel.

Volume / Commodity-Adjacent Tier

Standard air-cooled UPS and cooling equipment sold largely on price and proven reliability across a mature global replacement channel serving enterprise and smaller colocation deployments nationwide and abroad.
Gross Margin: 16-24%

Premium / Certified Tier

Higher-capacity power distribution and standby generation equipment with specification complexity, commanding meaningful premiums tied directly to reliability and delivery performance across accounts and facility types.
Gross Margin: 26-36%

Sustainability / Regulatory / Next-Generation Tier

Liquid cooling systems with monitoring software integration, carrying the category's highest margins given engineering differentiation and a constrained pool of qualified vendors able to deliver them at scale.
Gross Margin: 38-48%
critical-power-and-cooling-market-portfolio-architecture-1787301539089

Long-Cycle Equipment Meets Rapid Density Change

Critical power and cooling equipment behaves as a genuine long-cycle capital purchase, generating a large upfront installation sale followed by fifteen to twenty years of maintenance and eventual replacement revenue rather than a recurring subscription-like relationship, reflecting the category's traditionally long equipment service life across most facility types worldwide.
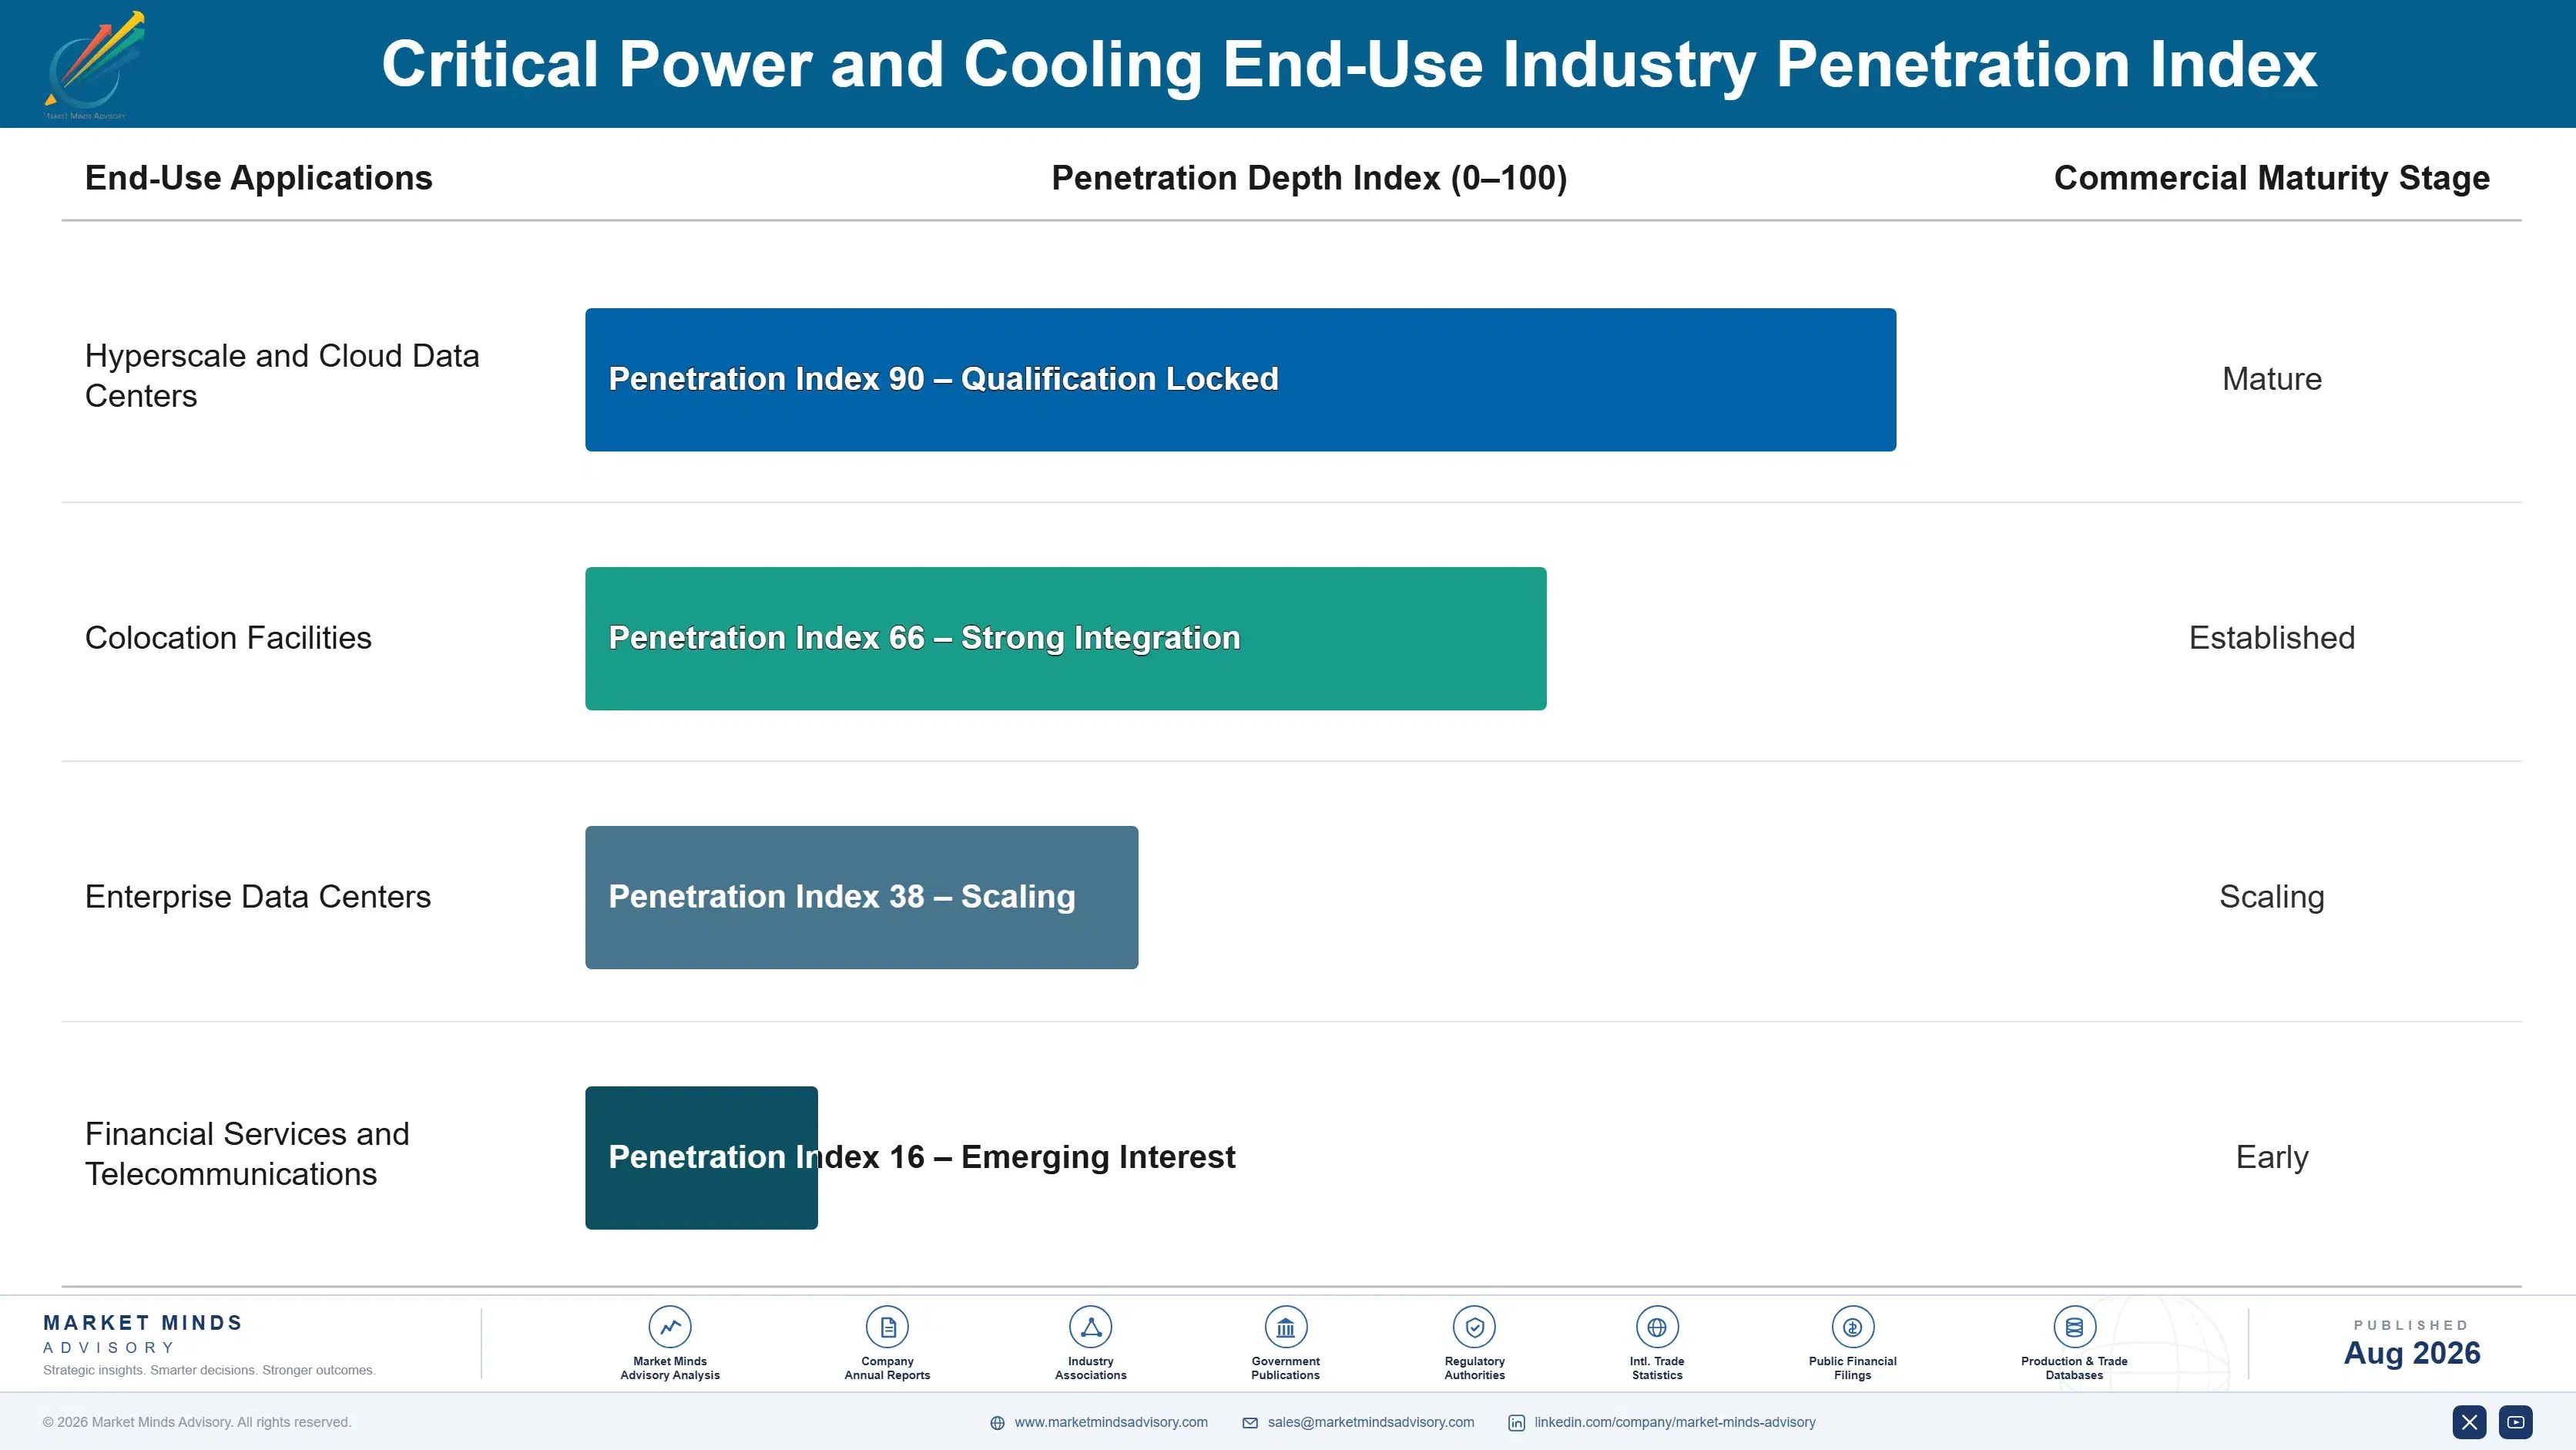
Adoption depth varies sharply by facility type across the market. Hyperscale and AI-focused operators show the fastest liquid-cooling-driven purchasing cycle given rapid thermal density increases, traditional enterprise data centers remain the slowest-cycling segment given their comparatively stable power density requirements, and colocation operators sit between the two, tied more closely to customer workload mix than to pure equipment age or mechanical wear.

A generational shift in buyer profile is underway as operator facility planning teams increasingly include dedicated thermal engineering and power architecture specialists rather than pure facilities managers trained under an older uniform air-cooling deployment model. Hyperscale procurement teams are also reshaping how vendors must present manufacturing capacity and delivery commitments earlier in the capital approval process, well before a purchase order is finalized.
critical-power-and-cooling-market-end-use-penetration-index-1787301539577

Where This Market Goes Next

These are among the four positions where our research anticipates prominent divergence between winners and laggards over the coming forecast period. Each is grounded in the demand model, the regulatory perimeter, and the announced capacity pipeline.
01 / LIQUID COOLING MANUFACTURING SCALE

Production capacity will decide who captures AI infrastructure growth

Hyperscale operators reward vendors who scale liquid cooling manufacturing capacity first, because current lead time constraints make operators deeply reluctant to commit to unproven equipment suppliers during a major facility build. Vendors who invested in manufacturing scale early are already winning a disproportionate share of new hyperscale liquid cooling contracts across major construction markets. This gap should widen rather than narrow as leading vendors accumulate delivery track records that later entrants cannot replicate quickly regardless of how much capital they eventually commit to catching up.
02 / COMPONENT SUPPLY SECURITY

Long-term supply agreements are winning the fastest-growing contracts

Operators increasingly weigh component supply security as heavily as core equipment specifications when selecting a vendor, rewarding vendors who invest in long-term supply agreements ahead of formal procurement processes across their manufacturing footprint and order books. Vendors with secured supply agreements are already reporting meaningfully shorter delivery timelines than competitors relying on spot market component purchasing. Vendors who underinvest in supply security risk losing deals to better-positioned competitors regardless of underlying equipment quality differences across their broader product lines and services.
03 / CROSS-VENDOR SOFTWARE INTEGRATION

Unified monitoring is opening a defensible new revenue line

Facilities running mixed air and liquid cooling deployments represent a growing segment that vendors investing early in cross-vendor monitoring software integration are increasingly capturing away from single-vendor competitors across the industry and multiple facility types. Vendors with proven cross-vendor integration capability report meaningfully higher contract values than competitors offering only single-vendor monitoring tools for comparable facility scale. This lever requires sustained software investment but expands the addressable market beyond the category's traditional hardware-only revenue base alone.
04 / CONTINUOUS-DUTY GENERATION STRATEGY

Grid-bridging generation is reshaping backup equipment demand

Operators increasingly prefer continuous-duty rated generation capable of bridging extended grid interconnection delays rather than traditional standby-only equipment designed purely for emergency backup scenarios across their facilities and campuses. Vendors with established continuous-duty product lines report contract values meaningfully higher than competitors offering only standby-rated equipment for comparable generation capacity today. This trend should continue as more operators face grid connection delays requiring sustained on-site generation capability rather than emergency-only backup systems going forward across the industry.

Engagement Snapshot From the Field

A live engagement with an industry participant carrying material or product regulatory and market exposure ahead of a defining policy shift, showing how our research translates into a defensible multi-year portfolio strategy.
MARKET MINDS ADVISORY · CLIENT ENGAGEMENT SUMMARY
Critical Power and Cooling Producer Strategic Portfolio Review and Transition Roadmap 2026·Investment Scenario on Critical Power and Cooling Exposure Evaluation 2025-26
CLIENT PROFILE
The client is a regional hyperscale cloud operator constructing several new AI-optimized data center campuses, representing substantial planned capital investment across its announced construction pipeline and customer commitments (client-reported, unverified by MMA). The company needed to select liquid cooling equipment suppliers capable of meeting aggressive facility commissioning timelines tied to AI customer demand.
STRATEGIC CHALLENGE
Leadership needed to select liquid cooling equipment suppliers capable of meeting rack density requirements while completing supplier selection within a compressed timeline set by construction schedules already committed to several major AI infrastructure customers across multiple new campuses under construction.
MMA APPROACH
MMA benchmarked candidate liquid cooling suppliers against manufacturing capacity, delivery timeline, and total cost of ownership including integration complexity, modeled expected thermal performance under three distinct deployment scenarios, and recommended a supplier selection and phased rollout sequence prioritized by customer deadline and available capital budget across campuses.
KEY FINDINGS
  1. Only three of nine candidate liquid cooling suppliers evaluated offered manufacturing capacity meeting the client's aggressive delivery timeline without significant lead time risk identified.
  2. Thermal performance varied by roughly 12 percent across candidate equipment options, a meaningful factor given the client's stringent AI customer service level commitments already in place.
  3. Delivery timelines varied by more than five months across candidate suppliers, materially affecting which suppliers could realistically meet the client's campus commissioning deadlines.
  4. Modeled thermal performance differences across candidate suppliers translated into a meaningful capacity utilization impact over the facility's operating life (client-reported, unverified by MMA).
CLIENT PROFILE
The client is a regional hyperscale cloud operator constructing several new AI-optimized data center campuses, representing substantial planned capital investment across its announced construction pipeline and customer commitments (client-reported, unverified by MMA). The company needed to select liquid cooling equipment suppliers capable of meeting aggressive facility commissioning timelines tied to AI customer demand.
STRATEGIC CHALLENGE
Leadership needed to select liquid cooling equipment suppliers capable of meeting rack density requirements while completing supplier selection within a compressed timeline set by construction schedules already committed to several major AI infrastructure customers across multiple new campuses under construction.
MMA APPROACH
MMA benchmarked candidate liquid cooling suppliers against manufacturing capacity, delivery timeline, and total cost of ownership including integration complexity, modeled expected thermal performance under three distinct deployment scenarios, and recommended a supplier selection and phased rollout sequence prioritized by customer deadline and available capital budget across campuses.
KEY FINDINGS
  1. Only three of nine candidate liquid cooling suppliers evaluated offered manufacturing capacity meeting the client's aggressive delivery timeline without significant lead time risk identified.
  2. Thermal performance varied by roughly 12 percent across candidate equipment options, a meaningful factor given the client's stringent AI customer service level commitments already in place.
  3. Delivery timelines varied by more than five months across candidate suppliers, materially affecting which suppliers could realistically meet the client's campus commissioning deadlines.
  4. Modeled thermal performance differences across candidate suppliers translated into a meaningful capacity utilization impact over the facility's operating life (client-reported, unverified by MMA).
RECOMMENDED STRATEGY
Phase 1: Phase 1 (Months 1-3): Complete supplier evaluation and finalize equipment selection based on capacity and delivery fit overall today. Phase 2: Phase 2 (Months 4-11): Execute equipment installation and commissioning across the client's first priority campus identified initially. Phase 3: Phase 3 (Months 12-16): Complete remaining campus rollouts and establish ongoing thermal performance monitoring across the full company portfolio.
OUTCOME
Sixteen months into the engagement, the client reported successful liquid cooling deployment across its full campus construction pipeline with thermal performance matching modeled projections across every commissioned facility and rack (client-reported, unverified by MMA), validating MMA's supplier selection recommendation and phased rollout sequence fully.

Frequently Asked Questions

Foundational context covering the market sizes, CAGR, scope, country, region and competition that inform every finding below. This section is provided to cover basics and most often pre-purchase conversations, answered from the MMA Primary Research Dataset.

What is the current size of the Critical Power and Cooling Market?

The market is valued at approximately 24.5 billion dollars in 2025, expanding to roughly 26.68 billion dollars in 2026 as AI infrastructure buildout continues driving equipment demand.

How large will the Critical Power and Cooling Market be by 2036?

MMA forecasts the market reaching approximately 62.59 billion dollars by 2036, roughly 2.35 times its 2026 value, driven primarily by AI data center construction and liquid cooling adoption.

What is the CAGR for the Critical Power and Cooling Market 2026 to 2036?

The base-case compound annual growth rate is 8.9 percent, with a bull scenario of 10.1 percent and a bear scenario of 7.7 percent depending on AI infrastructure spending pace.

Which segment is growing fastest?

Liquid cooling systems are growing fastest at a 16.5 percent CAGR, roughly 1.85 times the overall market rate, driven by AI training cluster thermal density exceeding air cooling limits.

Who are the major companies in the Critical Power and Cooling Market?

Vertiv Holdings Co, Schneider Electric SE, Eaton Corporation plc, ABB Ltd, and Legrand SA lead the market, together holding roughly 38 percent of revenue on a company-revenue basis.

Which country is growing fastest?

Malaysia is the fastest-growing country at a 14.8 percent CAGR, driven by rapid data center capacity expansion in the Johor corridor tied to overflow demand from Singapore.

Report Segmentation Architecture

The full report scope spans multiple orthogonal segmentation dimensions, with cross-tabulated demand data provided for each dimension pair. Coverage extends further to regional breakdowns, trend trajectories, and the competitive detail needed to support segment-level decision-making.

By Equipment and Technology Type

  • Uninterruptible Power Supply Systems
  • Precision Cooling and CRAC/CRAH Units
  • Backup Generators and Power Generation
  • Power Distribution Units and Switchgear
  • Liquid Cooling Systems
  • Power and Cooling Monitoring Software

By End-Use Industry

  • Hyperscale and Cloud Data Centers
  • Colocation Facilities
  • Enterprise Data Centers
  • Financial Services and Telecommunications

By Commercial Dimension

  • Direct Hyperscale Supply Agreements
  • Authorized Distributor Channel
  • Systems Integrator Partnerships
  • Aftermarket Service Contracts

By Region

  • North America
  • Western Europe
  • East Asia
  • South Asia and Pacific
  • Latin America
  • Middle East and Africa
  • Eastern Europe

Scope, Methodology, and Coverage

Every figure in this report is reproducible from documented input assumptions. The scope below maps the historical period, the forecast horizon, the segmentation dimensions, and the countries covered, alongside the underlying primary and qualitative methodology.
Historical Period
2020 to 2025
Forecast Period
2026 to 2036
Base Year
2025 (USD billions; MMA Primary Research Dataset, August 2026)
Market Definition
The market covers uninterruptible power supply systems, precision cooling equipment, backup generators, power distribution hardware, liquid cooling systems, and monitoring software that data centers and other mission-critical facilities use to maintain continuous power and thermal management. The underlying IT hardware being powered and cooled, and general commercial HVAC equipment outside mission-critical applications, are excluded.
Quantitative Units
USD billions (current prices); installed capacity in megawatts where cited
Segmentation Dimensions
By Equipment and Technology Type; By End-Use Industry; By Commercial Dimension; By Region
Regions Covered
North America, Western Europe, East Asia, South Asia and Pacific, Latin America, Middle East and Africa, Eastern Europe
Countries Covered
USA, Canada, Mexico, Germany, Ireland, Netherlands, France, UK, Poland, Romania, Hungary, Czech Republic, China, Japan, South Korea, Malaysia, India, Australia, Singapore, Brazil, Chile, Colombia, Saudi Arabia, UAE, South Africa, and additional markets relevant to this sector
Key Companies Profiled
Vertiv Holdings Co, Schneider Electric SE, Eaton Corporation plc, ABB Ltd, Legrand SA, Rittal GmbH & Co. KG, STULZ GmbH, Delta Electronics, Inc., Huawei Digital Power Technologies Co., Ltd., Mitsubishi Electric Corporation, Generac Power Systems, Inc., Cummins Inc., CyberPower Systems, Inc., Trane Technologies plc, Johnson Controls International plc, CoolIT Systems Inc., Munters Group AB, Piller Power Systems, Socomec Group, KOHLER Co.
Quantitative Methodology
Primary survey, n=3,800 respondents, Q4 2025, six countries; demand-side model with trade association cross-validation
Qualitative Methodology
47 expert interviews, Q4 2025; applied to validate demand model assumptions, identify emerging dynamics, and assess competitive positioning
Report Format
PDF and XLSX data workbook (Word format preview document)
Publisher
Market Minds Advisory
Report Code
MMA-2026-CON-927
Published
August 2026
Contact
sales@marketmindsadvisory.com | www.marketmindsadvisory.com

Purchase the full Critical Power and Cooling Market Report (2026 to 2036).

The full report delivers a complete quantitative and strategic assessment of the critical power and cooling market across all seven regions and more than twenty five countries covered in this study. It includes detailed segment-level forecasts through 2036, competitive benchmarking across twenty profiled manufacturers, and primary research drawn from 3,800 survey respondents and 47 expert interviews conducted in Q4 2025. Buyers receive editable data tables and full regional narrative detail beyond the two regions previewed in this summary document. A dedicated appendix covers liquid cooling technology comparisons and grid interconnection timelines by market.
Fully editable Excel data tables and models
All seven full regional narratives fully included
Twenty full company competitive profiles included
Liquid cooling technology comparison appendix included fully
Segment-level 2026-2036 detailed annual forecasts
Full primary survey and expert interview data included fully

Built For The People Who Decide

From boardroom strategy to bench-side execution, this report is read cover-to-cover by leaders shaping the next decade of their industry, turning demand scenarios, market dynamics and valuation benchmarks into decisions.
CXOs/ Presidents/ VPs/ Managers
M&A and Corporate Development
Strategy Teams and R&D Heads
Procurement and Product Directors
Regulatory and Compliance Leaders
Investor Relations and Equity Analysts