Market Minds Advisory
Crimp Top Cap Market

Crimp Top Cap Market: Container Closure Integrity, Annex 1 Enforcement and the Component Applied Last

The aluminium seal is applied last to a sterile vial and is the first place a sterility failure shows, which is why a part costing under a cent now carries disproportionate regulatory scrutiny.

Lead Analyst

Bilal Shaikh

Published

September 2026

Make Smarter Decisions with Customized Research Insights

Request a free sample report and evaluate market opportunities, growth trends, and competitive dynamics relevant to your business needs.

2025 MARKET VALUE$1.7BMarket Size 2025
2036 FORECAST VALUE$3.5BBase Case , 2026 to 2036
CAGR 2026 TO 20366.6 %Bull 7.8% / Bear 5.4%
INCREMENTAL OPPORTUNITY$1.6BNet 10- year value creation
EXPANSION MULTIPLE1.89x2036 value over 2026 base
Strategic Levers
M&A Pipeline
Regional Outlook
Country Rankings
Competitive Intelligence
Segmental Deep-dive
Call-Us : 91 93563 13602

Executive Snapshot and Market Trajectory

A crimp seal costs a fraction of a cent and can destroy a batch worth several million. Sterility depends on the crimp holding a stopper against a glass flange at a force nobody can see, and every regulator now wants that demonstrated rather than assumed. Assumption stopped being acceptable evidence.
Combination seals with an integrated stopper compound at 9.9%, exactly 1.50 times the market, by removing an aseptic handling step from the filling line. Every intervention inside a grade A zone is a contamination risk and a documentation burden, so fewer components mean fewer chances to fail. East Asia holds 29% of demand, and South Asia and Pacific grows fastest at 8.8%. India fills more of the world's generic injectables than anywhere.
Five suppliers hold 58% of the market, which is concentrated for a stamped aluminium part. Qualification explains it: a seal is validated as part of a container closure system with a specific vial and stopper, and changing any element reopens the whole assessment. Nobody does that to save a fraction of a cent. Ready-to-use sterilised components, now 37% of volume, deepen that lock considerably further.
Market Definition
The market covers aluminium and aluminium-plastic seals applied by crimping to the neck flange of glass or polymer vials, including flip-off seals, tear-off seals, plain crimp seals, combination seals supplied with an integrated stopper, and decorative crimp collars. Vials, elastomeric stoppers sold separately, screw closures, crown caps for beverages and aerosol valves are excluded.
Base Year Value
$1.7B in 2025 (MMA Primary Research Dataset, August 2026)
Forecast Period
2026 to 2036, eleven discrete annual values
CAGR
6.6% base case. Bull 7.8%. Bear 5.4%.
Fastest Growth Segment
Combination Seals With Integrated Stopper: 9.9% CAGR
Fastest Growth Country
India: 9.4% CAGR
Fastest Growth Region
South Asia and Pacific: 8.8% CAGR
Largest Region
East Asia: 29% of 2025 global value
Market Leaders
West Pharmaceutical Services, Datwyler Holding, Aptar Pharma, DWK Life Sciences, Genesis Packaging Technologies. Source: MMA Analysis based on company annual reports.
Primary Survey
n=3,800 procurement and R&D decision-makers, Q4 2025, six countries
Methodology
Demand-side build-up, cross-validated against public data, 47 expert interviews

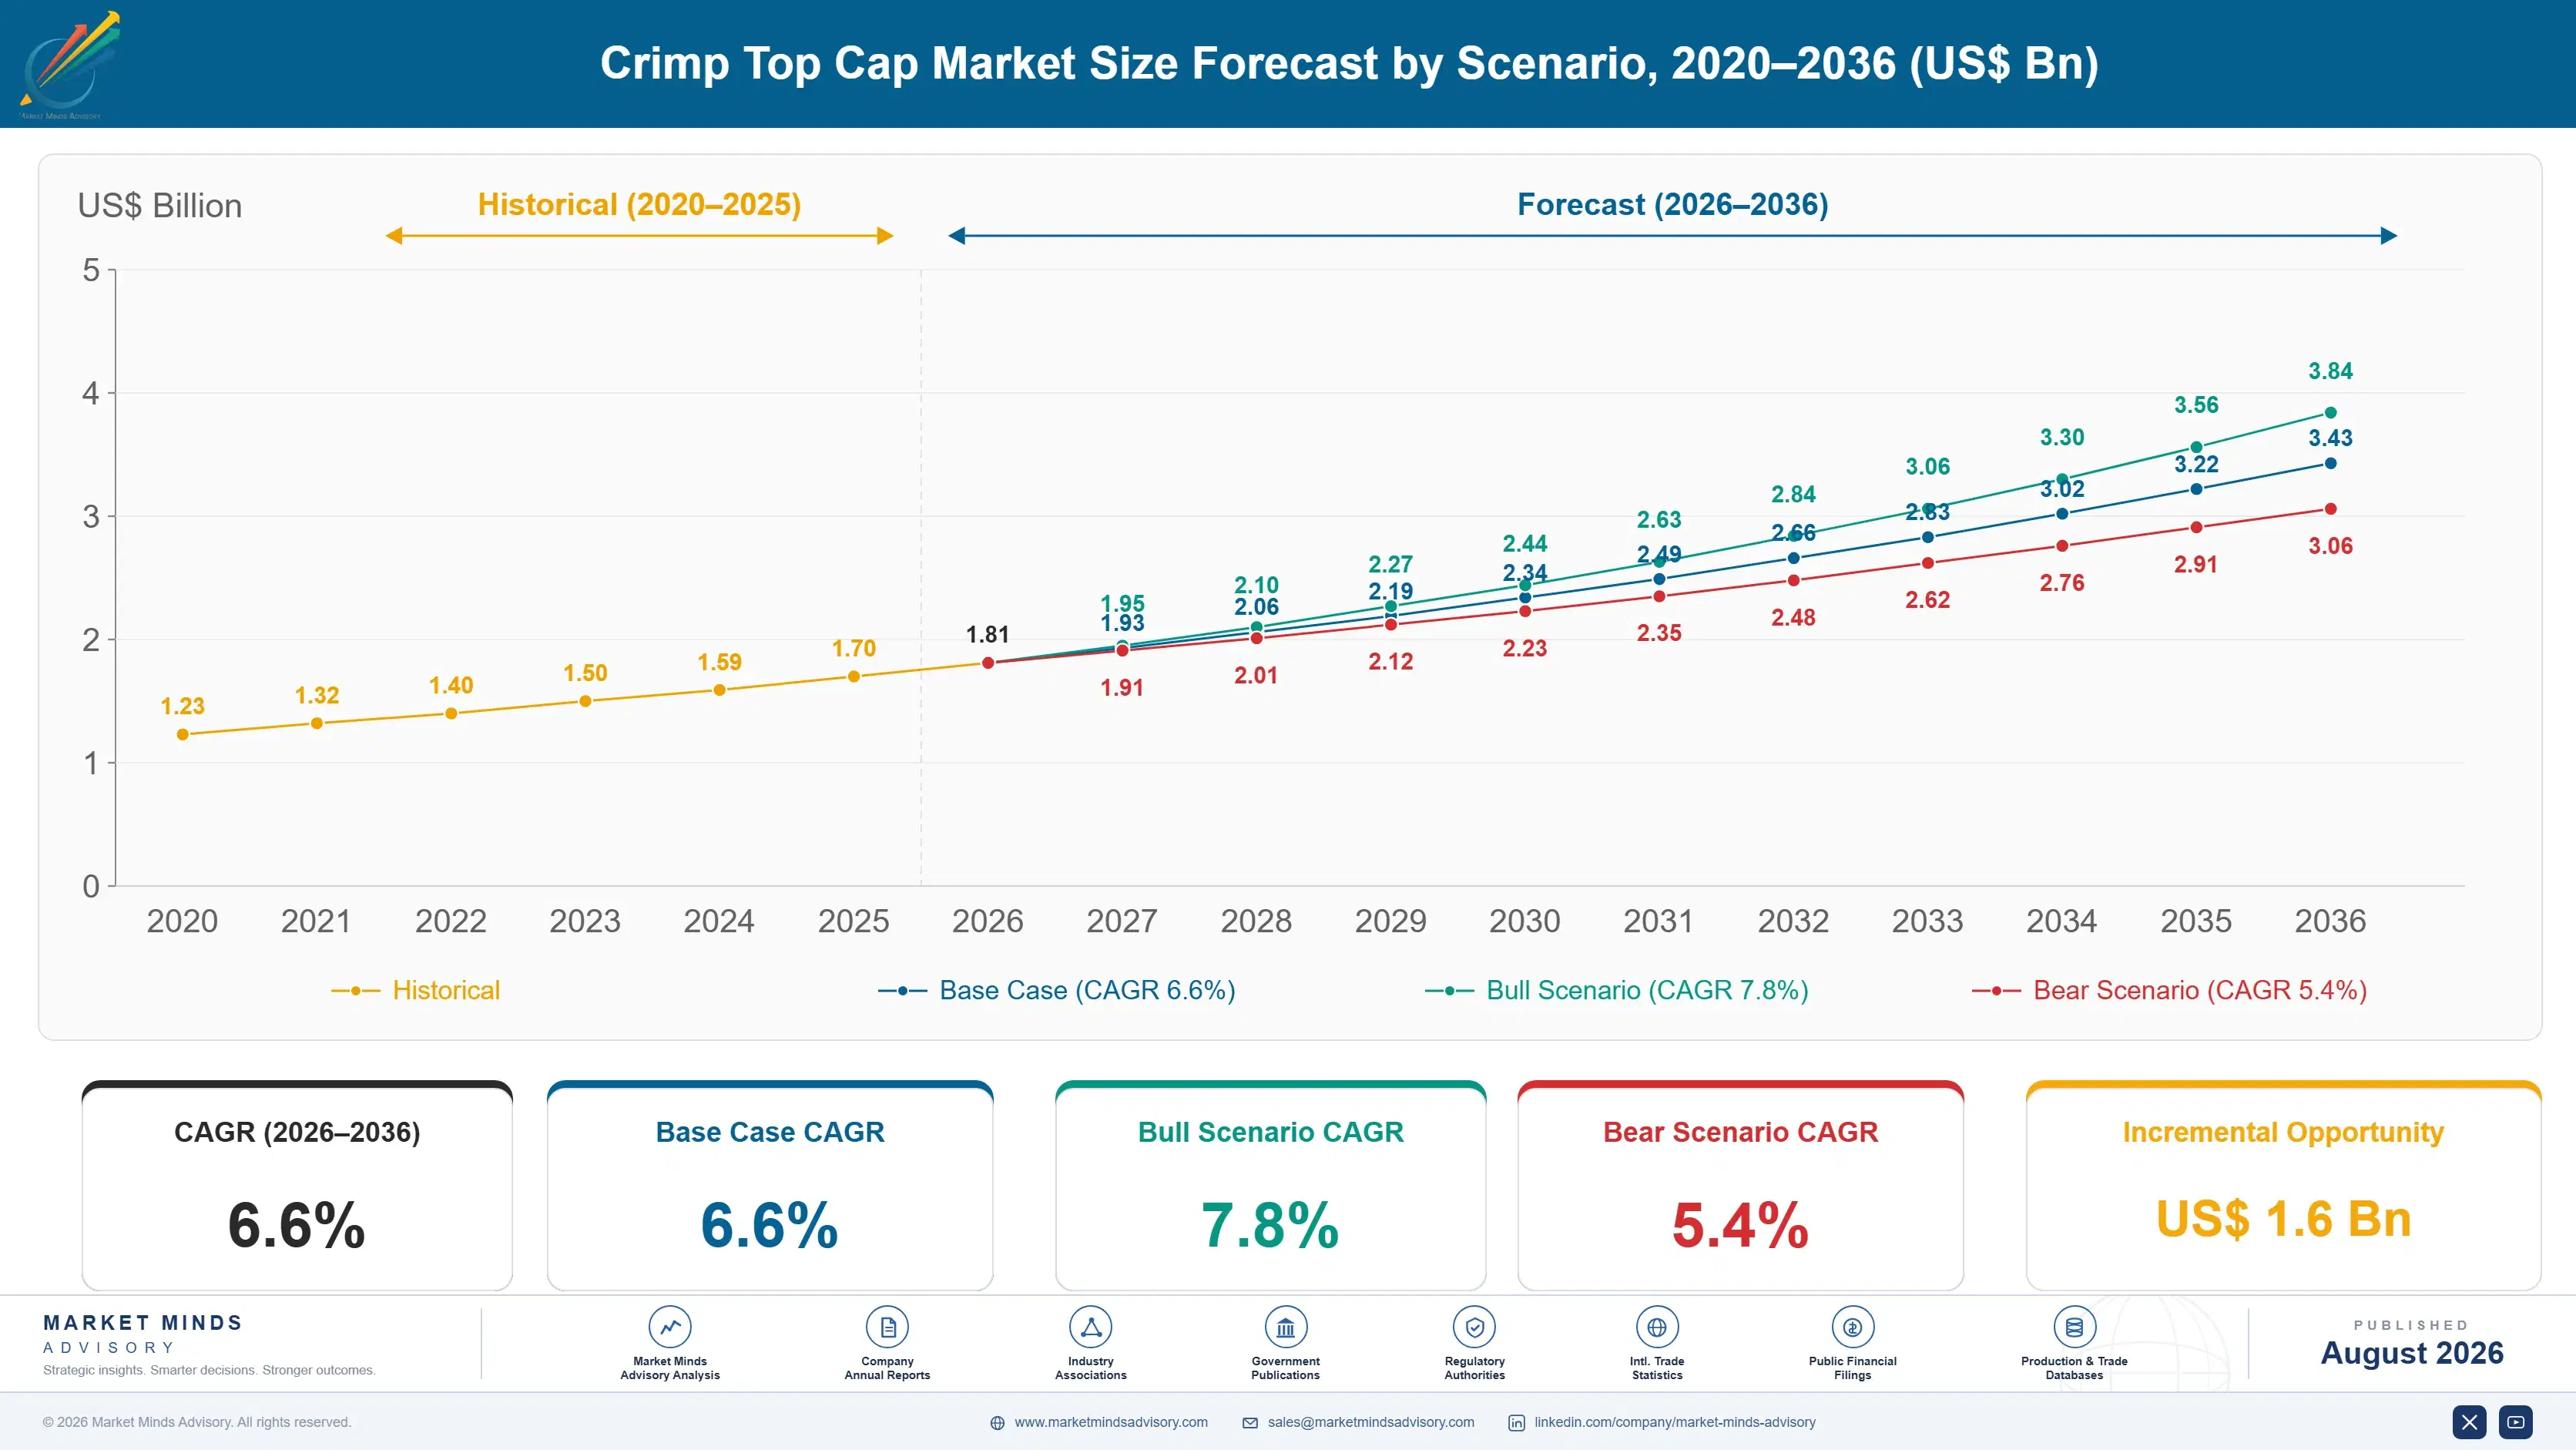
Crimp Top Cap Market Forecast Scenarios

crimp-top-cap-market-size-forecast-scenario-1787307203228
Growth ran at an implied 5.6% across 2020 to 2025, and vaccine programmes distorted the shape of it badly. Vial seal demand spiked through 2021 as pandemic manufacturing ran flat out, then fell back sharply in 2022 and 2023 as those programmes wound down. Underlying injectable growth continued beneath that noise throughout. Averaging across it explains nothing.
The base case at 6.6% rests on three mechanisms. Biologic and sterile injectable pipelines keep expanding, and most of that product fills into vials rather than syringes. The revised European Union Good Manufacturing Practice Annex 1 requires container closure integrity assurance on every fully sealed vial, which tightens seal specification and raises component value. And ready-to-use sterilised components keep displacing bulk seals that fillers wash and sterilise themselves. None of the three depends on the others.
The bull case at 7.8% assumes ready-to-use component adoption accelerates across mid-sized fillers who currently sterilise in-house, which would lift value per unit materially. The bear case at 5.4% follows from prefilled syringes and cartridges taking a larger share of injectable presentations, since each conversion removes a vial and its seal from the market permanently rather than temporarily. Neither scenario turns on component pricing.

The Cheapest Component With the Highest Consequence

This is a component nobody thinks about until it fails. A stamped aluminium seal costs a fraction of a cent, is applied in the final second of a filling operation, and holds the elastomeric stopper against the glass flange for the product's entire shelf life. If that compression falls outside a window of roughly 18 to 34 newtons, the vial either leaks or the glass cracks, and both outcomes end with a destroyed batch.
TOP FIVE CONCENTRATION58%Combined share held by the five largest global seal suppliers
RESIDUAL SEAL FORCE WINDOW18 to 34 newtonsAcceptable crimp force range before leakage or glass fracture
READY-TO-USE COMPONENT SHARE37% of volumeSeals supplied pre-sterilised rather than washed on site
ALUMINIUM COST SHARE43% of COGSMetal input as proportion of total component manufacturing cost
SYSTEM REQUALIFICATION COSTUSD 340,000 typicalCost of revalidating a container closure system after component change
BATCH VALUE AT RISKUSD 4.2 million medianMedian value of a sterile batch destroyed by failure
Regulators stopped accepting assumption on this point. The revised Annex 1 requires assurance of container closure integrity on every fully stoppered and sealed vial, which pushed fillers toward 100% inspection and much tighter seal specification. A component that used to be bought on price is now qualified as part of a system, and the median cost of revalidating that system after a component change runs around USD 340,000.
That qualification burden is why five suppliers hold 58% of a market for stamped metal parts. Nobody switches to save a fraction of a cent when the alternative is a validation exercise costing six figures and risking a batch worth several million. Ready-to-use sterilised components, now 37% of volume, deepen the lock further.
"The economics here are almost comically lopsided. I have watched a quality director spend two hours arguing about a seal supplier change that would have saved perhaps forty thousand dollars a year, against a requalification bill three hundred thousand and a batch risk in the millions. They were right to refuse."
Director, Sterile Packaging and Drug Delivery Systems Practice · MMA Pharmaceuti

Market Trends

Annex 1 Turns Closure Integrity From Assumption Into Evidence

The revised European Union Good Manufacturing Practice Annex 1 requires assurance of container closure integrity for every fully stoppered and sealed vial, rather than accepting sampled testing or process validation alone. Fillers responded with 100% inspection systems, headspace analysis and far tighter incoming component specification. Seal dimensional tolerance, aluminium temper and skirt geometry all now sit inside formal specifications rather than supplier standards. That has raised component value and narrowed the field of suppliers able to demonstrate the consistency that inspection systems reveal immediately. Inconsistency that once passed unnoticed now stops a line.
Market Impact: Vials in 61% of new approvals
Ready-to-Use Sterilised Components Displace On-Site Processing

Seals supplied gamma-irradiated in sealed bags or nested trays remove washing, depyrogenation and sterilisation from the filling site entirely, along with the validation and utilities those steps require. Adoption has reached 37% of volume and rises steadily, led by contract manufacturers and smaller fillers who cannot justify the in-house capability. Unit prices run several times bulk equivalents, which makes this the clearest value-per-unit growth available in the category. The constraint is supplier sterilisation capacity and the qualification burden attached to each new configuration. Capacity built ahead of demand converts directly into share.
Market Impact: Marked seals at 14% of volume

Market Opportunities and Growth Drivers

Biologic Pipelines Keep Filling Into Vials Rather Than Syringes

Monoclonal antibodies, cell and gene therapies and most oncology injectables fill into vials, because dose flexibility, reconstitution requirements and viscosity all resist syringe presentation. Each vial takes a stopper and a seal. Sterile injectable approvals have grown consistently, and contract manufacturing capacity has expanded across Europe, North America and Asia to fill them. Roughly 61% of new sterile injectable approvals still specify a vial presentation, and that share has proved far more durable than prefilled syringe advocates predicted a decade ago. Reconstitution and dose flexibility both resist syringe presentation. Vials remain the default presentation.
Market Impact: Conversions removing 3.4% annually

Serialisation Requirements Reach the Flip-Off Button

Anti-counterfeiting and traceability requirements have extended from cartons and labels onto the closure itself, with laser-marked or printed identifiers applied to the flip-off button. The seal is the one component a counterfeiter must replace to refill a genuine vial, which makes it the logical place to carry a unique mark. Regulatory pressure across emerging markets where counterfeit injectables are a genuine problem has accelerated adoption, and marked seals now account for roughly 14% of pharmaceutical seal volume. Marking without compromising the aluminium temper is the technical difficulty. Most stamping operations hold no such equipment at all.
Market Impact: Metal at 43% of component cost

Market Restraints and Challenges

Prefilled Syringes Remove Vials From the Market Permanently

Every product that converts from a vial to a prefilled syringe or cartridge removes a seal from the market for good, and those conversions almost never reverse. The root cause is clinical rather than commercial: syringes reduce dosing error, eliminate reconstitution and suit self-administration for chronic therapies. Conversion is concentrated in high-volume chronic biologics precisely where vial volumes were largest. Suppliers mitigate by participating in syringe and cartridge component supply, and by concentrating on the oncology and hospital categories syringes cannot readily serve. The clinical direction will not reverse. Offsets exist, but they are partial.
Market Impact: Full inspection covering 100% of vi

Aluminium Cost Moves Cannot Be Passed Through Quickly

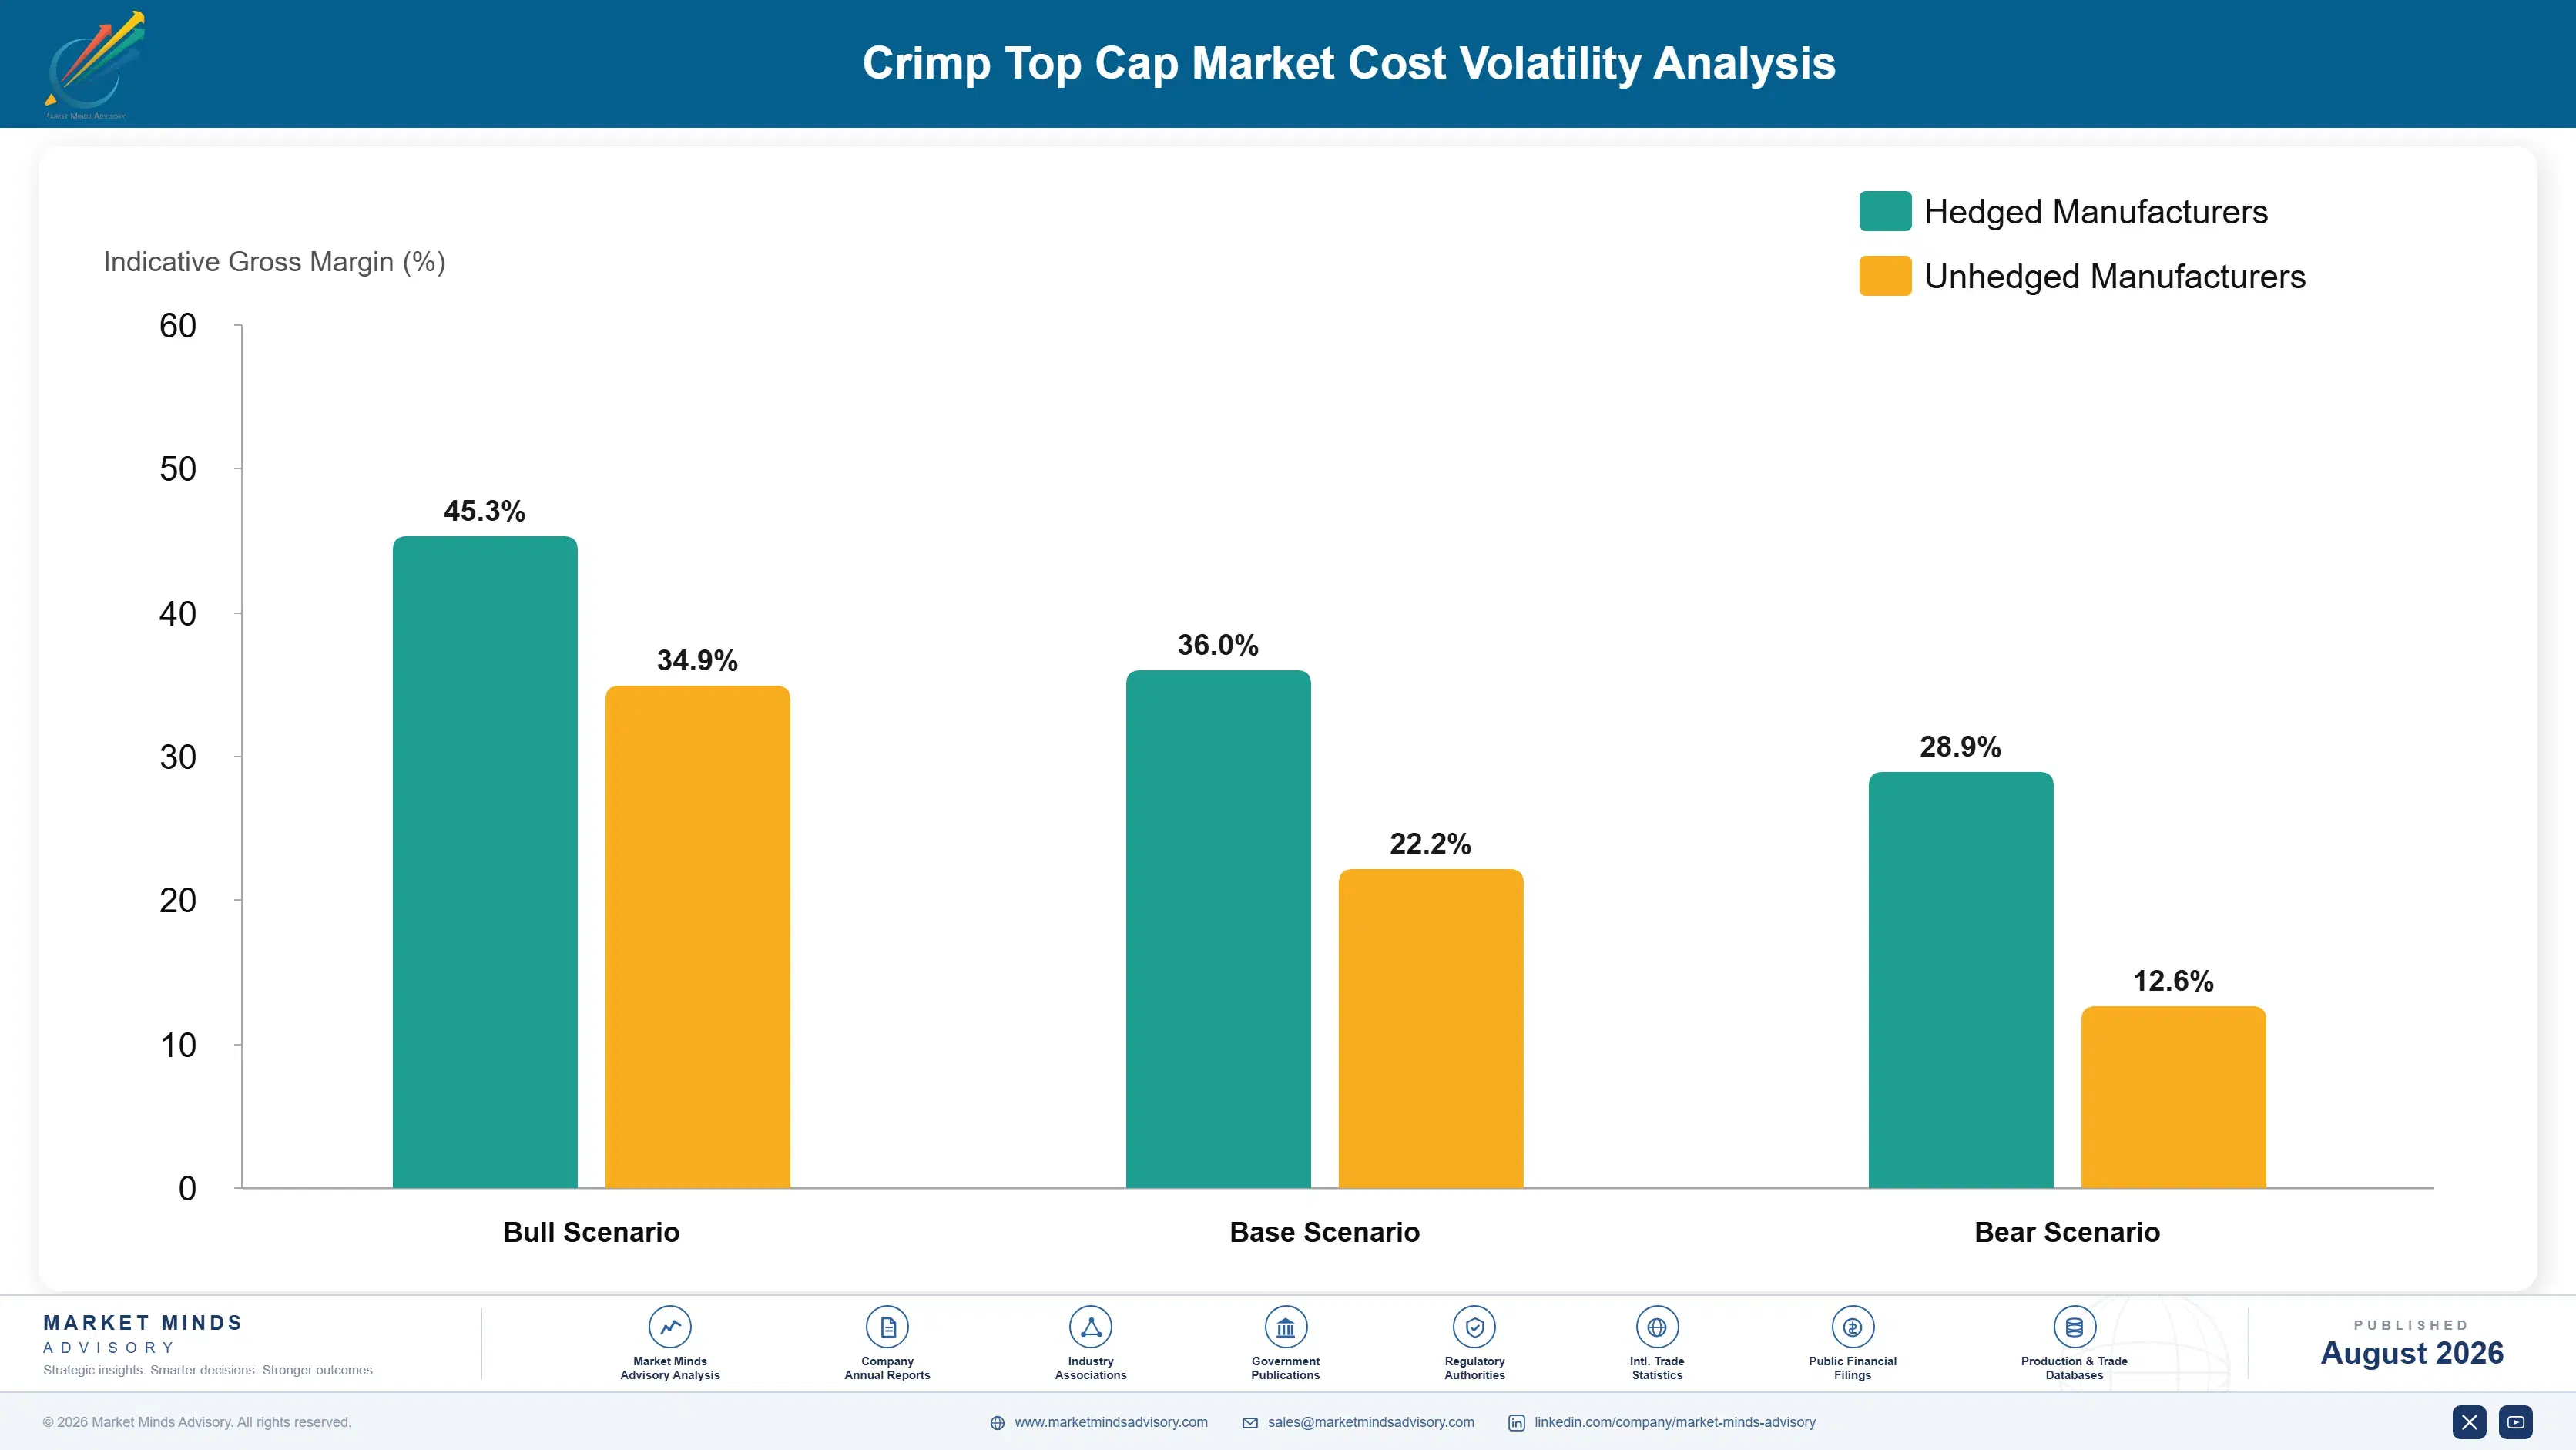
Metal accounts for 43% of cost of goods, and pharmaceutical supply agreements typically run annually with fixed pricing. The root cause is a mismatch of timescales: aluminium trades daily while regulated component contracts are negotiated once a year against validated specifications nobody wants reopened. A sharp metal move is therefore absorbed for several quarters. Suppliers mitigate through hedging programmes, indexed clauses where customers accept them, and by weighting mix toward ready-to-use and marked seals where metal is a smaller share of value. Raising an index clause before a metal move works far better than raising it afterwards.
Market Impact: Ready-to-use reaching 37% of volume
3 additional market trends, 4 additional growth drivers, and 2 additional restraints and challenges are covered in the full report. Contact sales@marketmindsadvisory.com to access the complete intelligence.

Segment CAGR and Growth Architecture

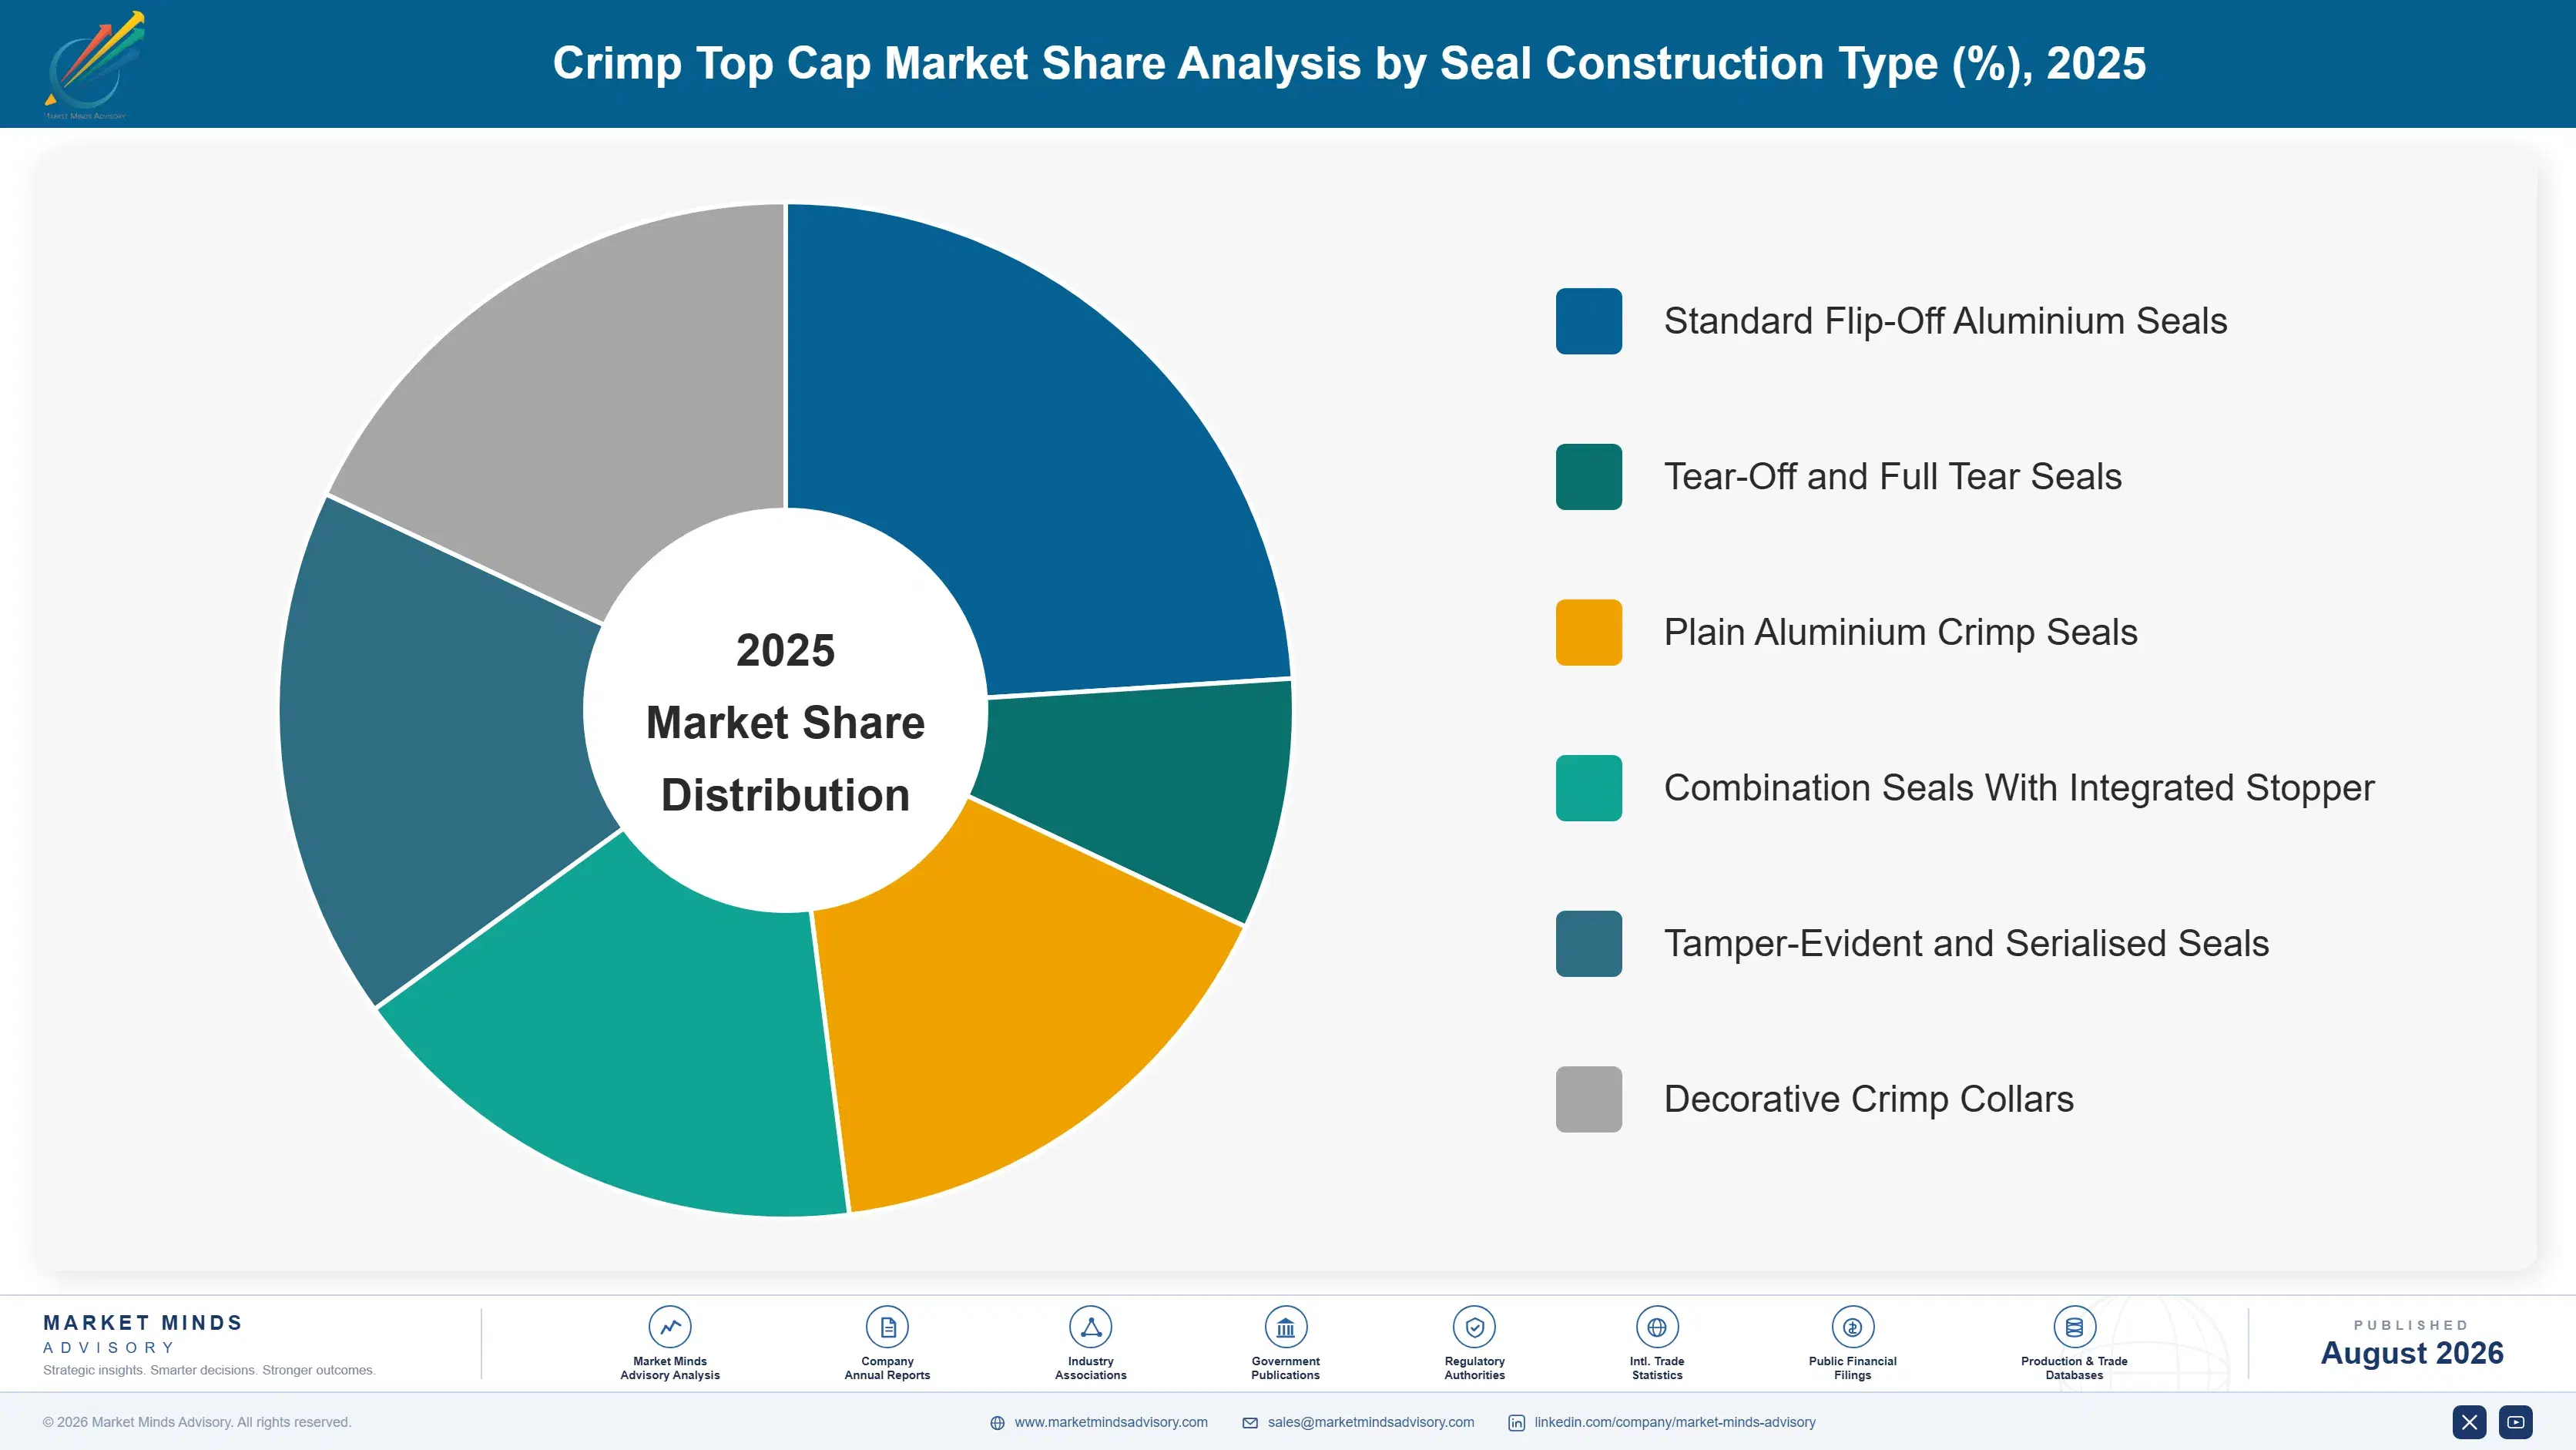
Segmentation follows seal construction type, because construction determines the aseptic handling the filling line must perform, the qualification evidence required and the value the component carries. A plain laboratory crimp seal and a pre-assembled combination seal serve entirely different buyers making entirely different decisions. Construction decides which buyer chooses and what evidence they demand.
crimp-top-cap-market-market-share-analysis-1787307203761

Combination Seals With Integrated Stopper

Combination seals compound at 9.9%, exactly 1.50 times the market rate, on an argument about aseptic risk rather than about the component itself. Supplying stopper and seal pre-assembled removes a handling step from inside the grade A zone, and every intervention there is a contamination opportunity, an operator training requirement and a line of documentation. Under the revised Annex 1 that matters considerably more than it used to. The trade-off is qualification: a combination component must be validated with the specific vial it will seal, and the stopper cannot then be changed independently. Unit values run well above separate components, and the assembly capability is not widely held across the supplier base.
CAGR 9.9%

Tamper-Evident and Serialised Seals

Marked seals grow at 8.4% as traceability requirements extend from the carton onto the closure itself. The logic is sound: a counterfeiter refilling a genuine vial must replace the seal, so a unique identifier there is harder to defeat than one printed on packaging that gets discarded. Laser marking and specialised printing on the flip-off button carry the identifier without compromising the aluminium temper that determines crimp performance, which is the technical difficulty. Emerging market regulators facing genuine counterfeit injectable problems have driven adoption hardest. Roughly 14% of pharmaceutical seal volume now carries a mark, and the capability requires equipment most stamping operations do not hold. Adoption is widening steadily.
CAGR 8.4%
Full segment breakdown across 6 segments available in the complete report.

Regional Architecture and Country Demand Map

Demand follows sterile filling capacity rather than pharmaceutical consumption, since the seal is applied where the vial is filled. Generic injectable manufacturing concentrates that capacity in a small number of countries that supply the world's hospital pharmacies. Consumption and administration geography barely overlap. Filling capacity is the map to read.

East Asia

East Asia holds 29% of global demand, the largest regional share, and Chinese sterile injectable manufacturing accounts for most of it. Domestic capacity serves a very large hospital market and increasingly exports finished injectables, which brings destination regulatory requirements with it. Chinese component suppliers including Hebei First Rubber and Jiangsu Hualan have built substantial seal capacity, and quality expectations have risen sharply as export ambitions grew. Japanese demand is smaller, technically exacting and served largely by domestic and European suppliers. Korean biologics manufacturing, particularly biosimilar fill-finish, adds a high-specification demand pool. Regional growth of 7.6% tracks sterile capacity addition rather than domestic pharmaceutical consumption. Export approvals rather than domestic regulation drove the quality improvement.
Share: 29% | CAGR: 7.6% (2026 to 2036)

South Asia and Pacific

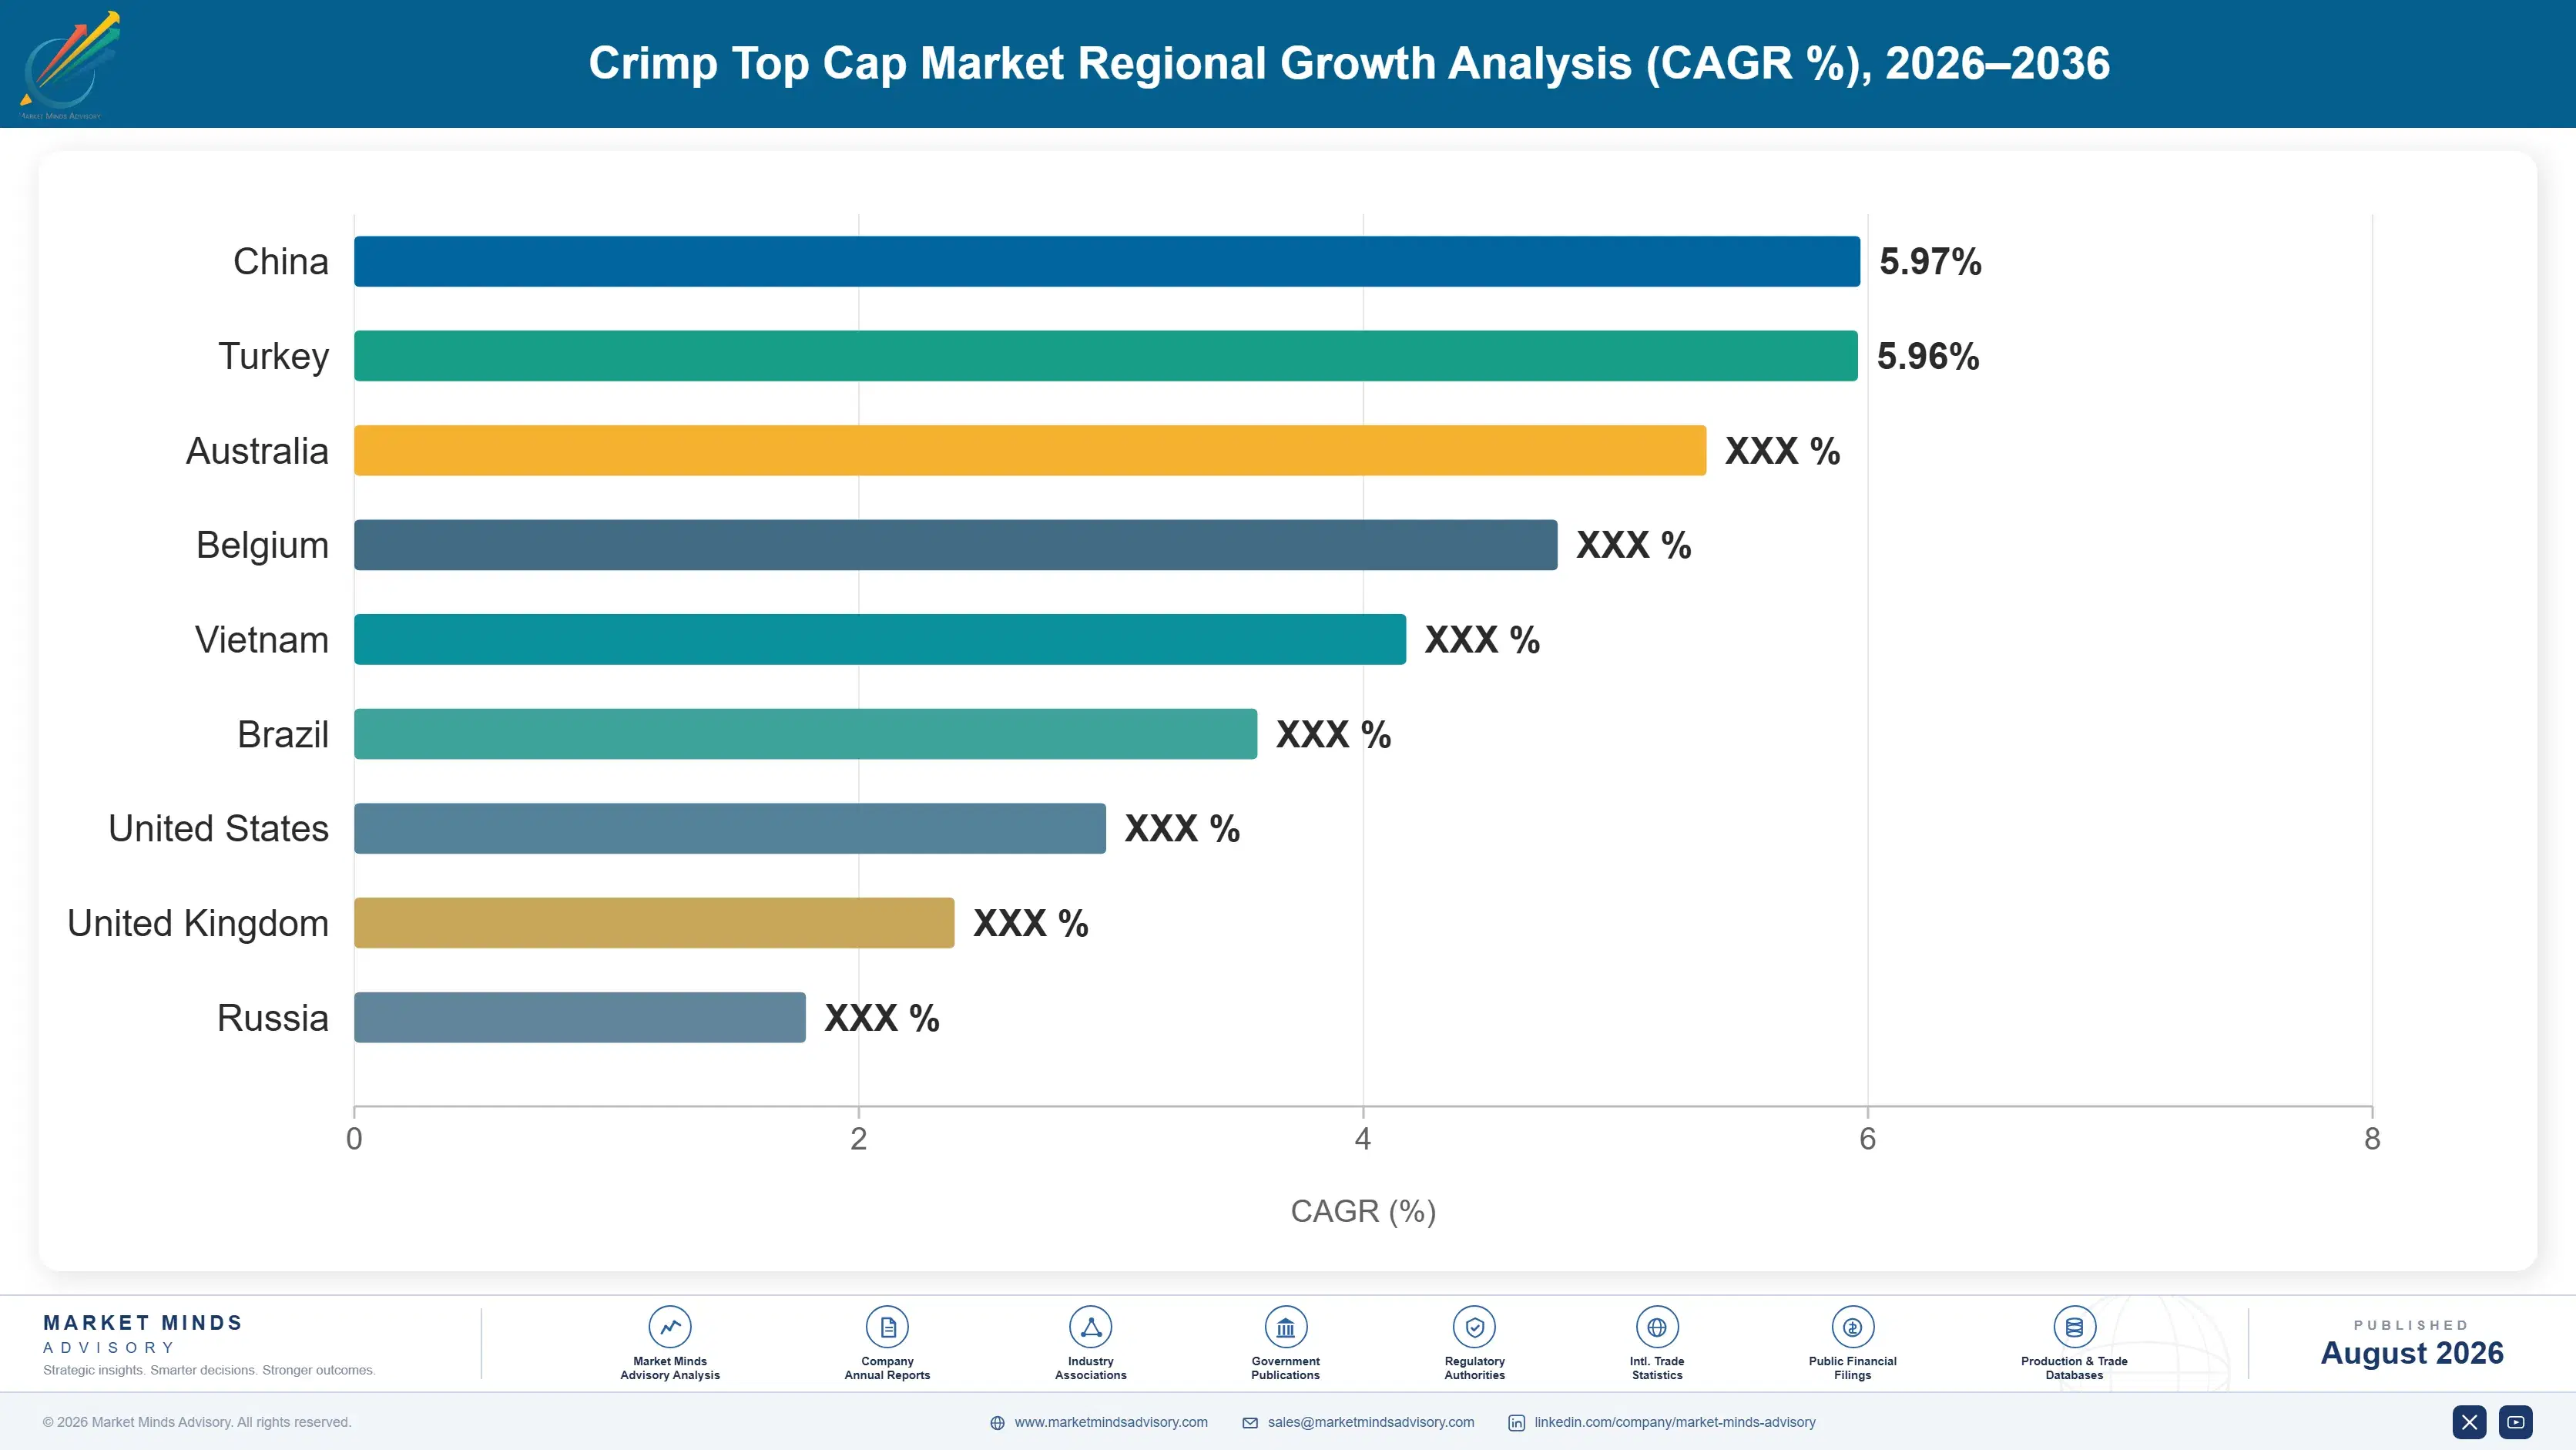
South Asia and Pacific takes 13% of demand and grows fastest at 8.8%, with India compounding at 9.4%. Note: this share exceeds the standard regional band because India fills a disproportionate share of the world's generic sterile injectables, and the seal is consumed where filling happens rather than where the medicine is administered. Indian contract manufacturers supply hospital injectables into North America, Europe and across the developing world, and United States Food and Drug Administration and European inspections have driven component specification steadily upward. Domestic suppliers including ACG and Kaisha Packaging serve that base alongside international names. Australian and Southeast Asian demand is modest by comparison and largely domestic in orientation.
Share: 13% | CAGR: 8.8% (2026 to 2036)
Regional intelligence for 5 additional markets available in the complete report: North America, Western Europe, Latin America, Middle East and Africa, Eastern Europe. Contact sales@marketmindsadvisory.com.
crimp-top-cap-market-country-cagr-analysis-1787307204281

Selling Against a Requalification Bill

Nothing in this market is won on the price of a stamped aluminium part. What decides business is qualification evidence, aseptic handling reduction and the sheer cost of changing anything inside a validated container closure system. Four positions convert that reality into margin worth having. The stamped part itself is almost beside the point in every one of them.

Supply Pre-Assembled Combination Seal and Stopper Components

Combination seals compound at 9.9% by removing an aseptic handling step from inside the grade A zone, where every intervention is a contamination opportunity and a documentation burden. Under the revised Annex 1 that argument carries far more weight than it did five years ago. Unit values run roughly 2.3 times separate components, and the assembly and qualification capability is not widely held. Once validated with a specific vial the component cannot be substituted without reopening the whole system assessment, which makes the position unusually durable for a packaging supplier.
Market Impact: Combination components priced 2.3 t

Build Ready-to-Use Sterilisation Capacity Ahead of Demand

Gamma-irradiated seals in sealed bags or nested trays remove washing, depyrogenation and sterilisation from the filling site along with the validation and utilities those steps require. Adoption sits at 37% of volume and keeps rising, led by contract manufacturers running many small batches. Unit prices run several times bulk equivalents, making this the clearest value-per-unit growth in the category. The binding constraint is supplier sterilisation capacity and the qualification burden per configuration, so capacity built ahead of demand converts directly into share. Qualification burden per configuration is the other limit.
Market Impact: Ready-to-use adoption now passing 3

Own the Container Closure Integrity Evidence Package

Annex 1 requires integrity assurance on every sealed vial, and fillers must demonstrate it with data rather than argument. Suppliers providing residual seal force characterisation, headspace testing correlation and dimensional capability data against the customer's specific vial and stopper move from component vendor to system partner. That evidence is what a quality director defends in an inspection. It also raises the requalification cost of switching, which averages around USD 340,000, and converts a stamped part into something no procurement function will retender on price alone. Procurement stops retendering on price.
Market Impact: Switching costs averaging USD 340,0

Add Marking Capability for Traceability Requirements

Marked seals grow at 8.4% because the closure is the one component a counterfeiter must replace when refilling a genuine vial. Laser marking or printing the flip-off button without compromising the aluminium temper that governs crimp performance is the technical difficulty, and most stamping operations hold no such capability. Emerging market regulators facing real counterfeit injectable problems have driven adoption hardest. Around 14% of pharmaceutical seal volume now carries a mark, and the equipment investment is modest against the qualification advantage it creates with export-oriented fillers. Export-oriented fillers value it most.
Market Impact: Marked seals now reaching 14% of to

Who Controls the Margin Pool

Five suppliers hold 58% of the market measured on seal component revenue, the basis applied consistently through this section. Concentration is high for stamped metal parts, and system qualification rather than manufacturing capability explains it. West Pharmaceutical Services leads clearly, with Datwyler and Aptar Pharma forming a credible second tier behind it. Stamping capability is almost irrelevant to position here.
Competition operates on three dimensions. Container closure integrity evidence, characterised against a customer's specific vial and stopper, decides who can support an Annex 1 filing. Ready-to-use sterilisation capacity decides participation in the fastest-growing supply format. And combination component assembly capability decides who can offer the aseptic handling reduction that fillers increasingly want. All three take years to build and cannot be bought quickly.

Two pressures are shifting position. Chinese and Indian suppliers have raised quality substantially as their domestic fillers pursued export approvals, and they now compete credibly on regulated work. Against that, prefilled syringe conversion removes vial volume permanently from exactly the high-value chronic categories where margins were best. Rankings will move toward suppliers holding both sterilisation capacity and assembly capability. Very few hold both today, and the ones closest are the incumbents already inside the validation files.
crimp-top-cap-market-company-positioning-matrix-1787307204801

Competitive Moat and Risk Dimensions

WEST PHARMACEUTICAL SERVICES

Moat: Integrated containment system qualification

West supplies stoppers, seals and combination components as validated containment systems rather than as separate parts, backed by analytical services that characterise integrity against a customer's specific vial. That position places the company inside the filing rather than inside the bill of materials, and displacing it means requalifying a system rather than substituting a component.
WEST PHARMACEUTICAL SERVICES

Risk: Prefilled syringe substitution exposure

Vial seal volume erodes as chronic biologics convert to prefilled syringes and cartridges, and those conversions concentrate in the high-value categories where the company's margins are strongest. Participation in syringe components offsets part of it, though the containment system position built around vials does not transfer intact to a fundamentally different presentation.
DATWYLER HOLDING

Moat: Elastomer and sealing expertise

Datwyler's depth in pharmaceutical elastomers underpins its combination component position, since the seal and stopper must perform together within a residual seal force window that neither part determines alone. That engineering understanding supports the integrity evidence Annex 1 filings now require, and it is genuinely difficult for a metal stamping specialist to replicate.
DATWYLER HOLDING

Risk: Capacity concentration in Europe

Manufacturing weighted toward European sites limits responsiveness in East Asia and South Asia, where 42% of global demand now sits and where growth is fastest. Regulated component supply tolerates longer lead times than most packaging, but local qualification support and technical service increasingly influence selection at Asian fillers pursuing export approvals.

Players Tracked

Prominent Players

West Pharmaceutical Services
Datwyler Holding
Aptar Pharma
DWK Life Sciences
Genesis Packaging Technologies

Other Key Players

Berry Global
Nipro Corporation
Shandong Pharmaceutical Glass
Hebei First Rubber Medical Technology
Jiangsu Hualan Technology
Adelphi Healthcare Packaging
Kaisha Packaging
ACG
Bormioli Pharma
Gerresheimer
SCHOTT Pharma
Stevanato Group
Comar
Corning
Thermo Fisher Scientific

Recent Developments

FEBRUARY 2025

Annex 1 enforcement tightens component specification requirements

European inspectors increased scrutiny of container closure integrity evidence during routine sterile facility inspections, requiring data characterised against specific vial and stopper combinations rather than generic component certification. This reflects regulatory enforcement practice rather than any commercial development, and it favours suppliers holding analytical capability.
Signal: Component certification is no longer suffi
JUNE 2025

Ready-to-use sterilisation capacity expands across component suppliers

Several pharmaceutical component suppliers commissioned additional gamma irradiation and nested packaging capacity, responding to contract manufacturer demand for seals requiring no on-site washing or depyrogenation. These were organic capital investments rather than acquisitions or joint ventures, targeting the fastest-growing supply format. Stamping capacity was never the limit.
Signal: Sterilisation capacity rather than stampin
OCTOBER 2025

Marked closure adoption widens across export-oriented injectable fillers

Generic injectable manufacturers supplying emerging markets extended use of laser-marked flip-off buttons carrying unique identifiers, responding to counterfeiting concerns in destination markets. This reflects customer specification change rather than any regulatory mandate, and it requires marking capability most stamping operations lack. No regulator has yet mandated it.
Signal: Traceability has moved onto the one compon

Metal, Sterilisation and Qualification Overhead

Aluminium accounts for roughly 43% of cost of goods, purchased as coil from regional rolling mills across Europe, North America and Asia. Elastomer for combination components, plastic flip-off buttons and packaging together run around 19%. Sterilisation, cleanroom operation and quality systems make up most of the remainder, and analytical characterisation services are funded largely outside cost of goods altogether.
Aluminium pricing moved sharply through 2022 as European smelting capacity curtailed under energy costs that International Energy Agency reporting documents across that period, and regional premiums rose alongside the underlying metal. Component suppliers absorbed much of it, because pharmaceutical supply agreements run annually against validated specifications customers will not reopen mid-term. Company annual reports covering pharmaceutical packaging segments disclose the resulting margin compression through several quarters.

Exposure divides by product mix rather than by purchasing scale. A supplier weighted toward plain bulk seals carries metal at close to half its cost base with no room to absorb a move. One weighted toward ready-to-use, combination and marked components carries metal at a much smaller share of a considerably higher unit value, and prices against qualification rather than material.
crimp-top-cap-market-cost-volatility-analysis-1787307204996

Weight mix toward components where metal is a minor cost share

Ready-to-use, combination and marked seals all carry substantially higher unit values against similar metal content, which dilutes aluminium exposure as a proportion of price. This is the same mix shift already justified on growth and margin grounds, so the input cost benefit arrives as a consequence rather than requiring a separate strategy or additional investment.

Negotiate indexed metal clauses inside annual supply agreements

Pharmaceutical customers resist reopening validated component pricing, but they generally accept an aluminium index clause when it is separated from the qualified specification itself. Framing metal as a pass-through distinct from component value removes most of the exposure without touching anything the quality function considers its own. Raising it before a price move works far better.

Contract regional aluminium coil against forecast annual volume

Coil is bought regionally because freight on a low-value bulky input is punitive, and regional premiums move separately from underlying metal prices. Annual contracting against forecast volume stabilises both components of the cost. Specification consistency matters as much as price, since aluminium temper directly governs crimp performance within the residual seal force window. Temper variation shows up immediately.

Portfolio Architecture for Margin Defence

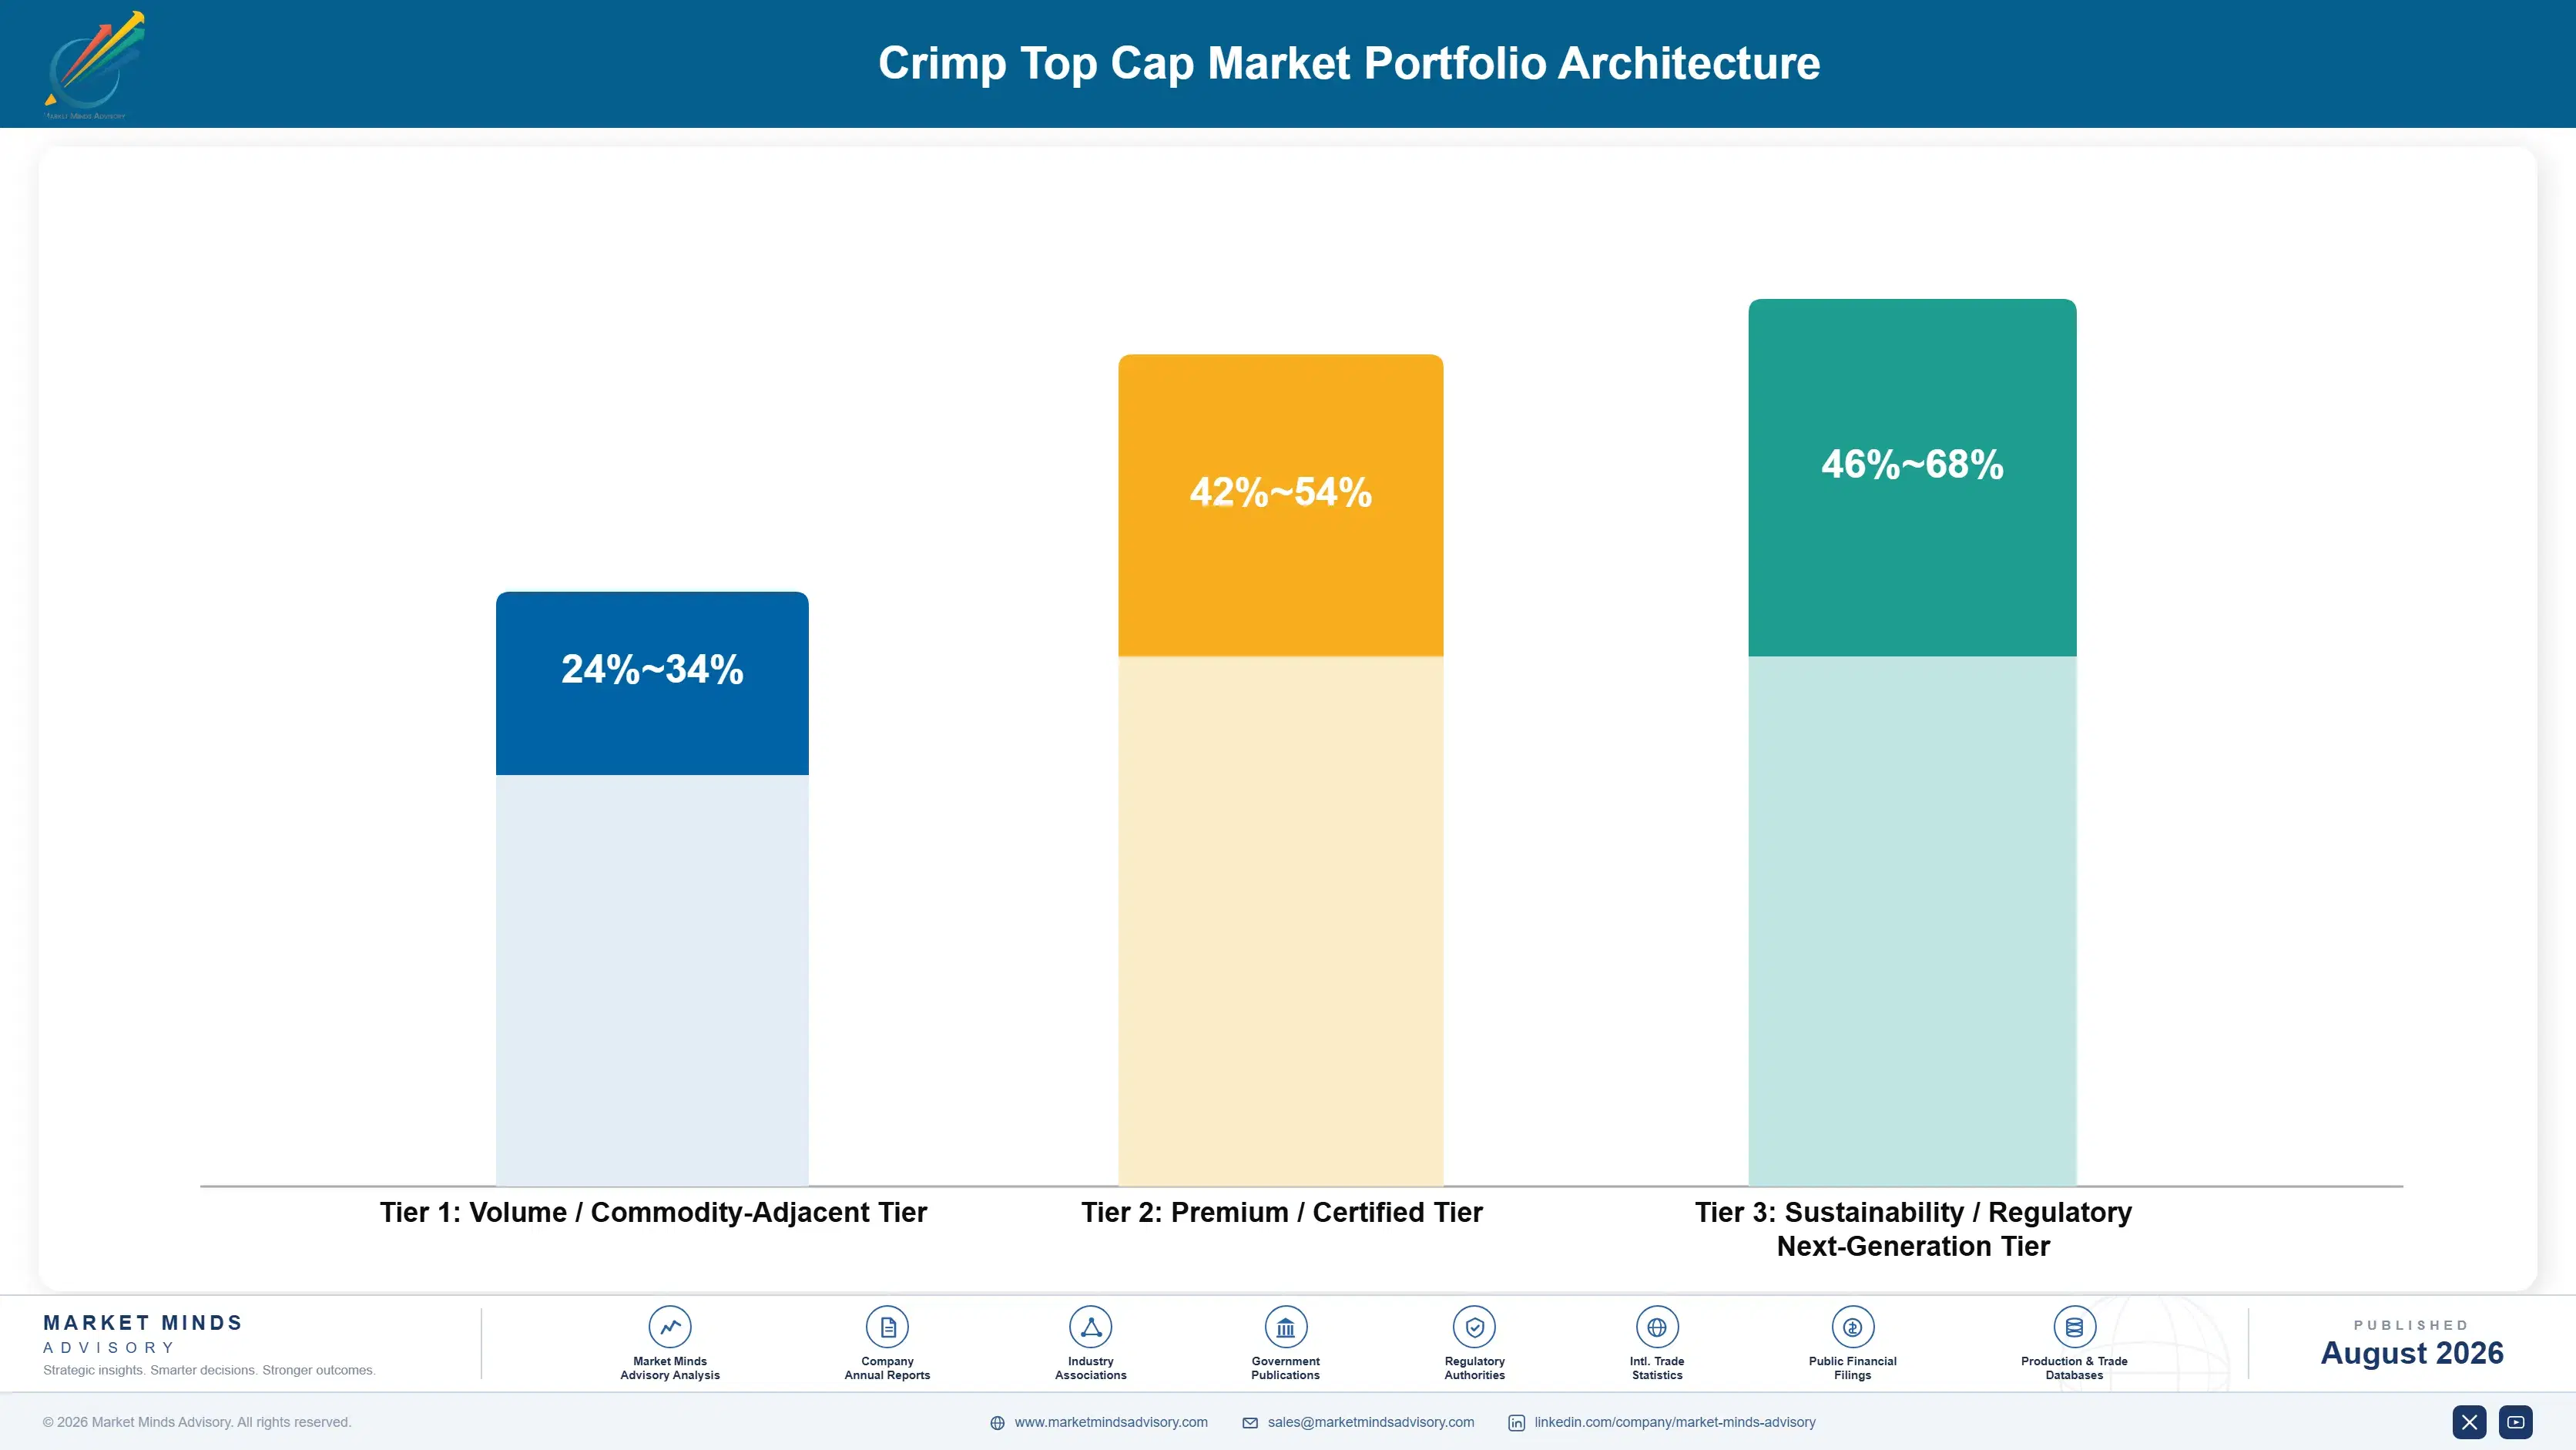
The portfolio separates on how much qualification evidence travels with the part. Plain bulk seals are stamped metal sold on price and specification, and Chinese and Indian suppliers compete hard there. Ready-to-use sterilised components add a validated process the customer no longer performs. Combination and marked seals add assembly, analytical characterisation and capability that comparatively few suppliers hold at all. Evidence rather than metal draws the whole ladder.
The tension is that bulk seals carry the stamping volume and the customer relationships from which higher-value work follows. A supplier that withdraws from plain seals loses the account entirely, since fillers generally want one component supplier across a facility rather than several. Successful suppliers run bulk work for position and treat qualification evidence as the actual product they sell. Position and margin have to be pursued as separate objectives here.

High-value pools sit where a regulatory requirement, an aseptic risk reduction or a traceability obligation sets the specification. Combination components, ready-to-use formats and marked seals all qualify, and each is chosen by a quality function that never sees a unit price comparison. Unit price never enters those conversations.

Volume / Commodity-Adjacent Tier

Plain aluminium crimp seals, standard flip-off and tear-off seals supplied in bulk for on-site washing and sterilisation. Competes on specification conformance and price, with Chinese and Indian suppliers now credible on regulated work in this tier.
Gross Margin: 24-34%

Premium / Certified Tier

Ready-to-use sterilised seals supplied gamma-irradiated in sealed bags or nested trays, removing washing, depyrogenation and validation from the filling site. Supplier sterilisation capacity rather than stamping capability constrains participation here.
Gross Margin: 42-54%

Sustainability / Regulatory / Next-Generation Tier

Combination seals with integrated stoppers and marked seals carrying unique identifiers. The wide margin range reflects sharply differing assembly complexity and the analytical characterisation packages that Annex 1 filings now require of suppliers.
Gross Margin: 46-68%
crimp-top-cap-market-portfolio-architecture-1787307205507

High-value Sub-segments and Strategic Watch-out

Combination Seal and Stopper Components

Compounding at 9.9% by removing an aseptic handling step from the grade A zone entirely, which matters far more under the revised Annex 1. Unit values run roughly 2.3 times separate components, and substitution requires reopening the whole container closure system assessment. Assembly capability is narrowly held.
Gross Margin: 50-68%

Ready-to-Use Sterilised Seals

At 37% of volume and rising, led by contract manufacturers running many small batches who cannot justify in-house washing capability. Supplier gamma irradiation and nested packaging capacity is the binding constraint rather than any stamping limitation on output. Unit prices run several times bulk equivalents.
Gross Margin: 44-54%

Plain and Standard Flip-Off Seals

The volume core at 5.4%, competing on specification conformance and price against Chinese and Indian suppliers now credible on regulated work. Run to hold the facility-wide component relationship from which all higher-value qualification work follows. Fillers generally want one component supplier across a facility rather than several competing ones.
Gross Margin: 24-34%

Prefilled Syringe Conversion Exposure

The watch-out. Each chronic biologic converting to a syringe removes roughly 3.4% of category volume annually and never returns it, concentrated in exactly the high-value products where seal margins were strongest across the portfolio. Participation in syringe components is the only genuine offset available to a seal supplier.
Gross Margin: 20-46%

Locked In by the Validation File

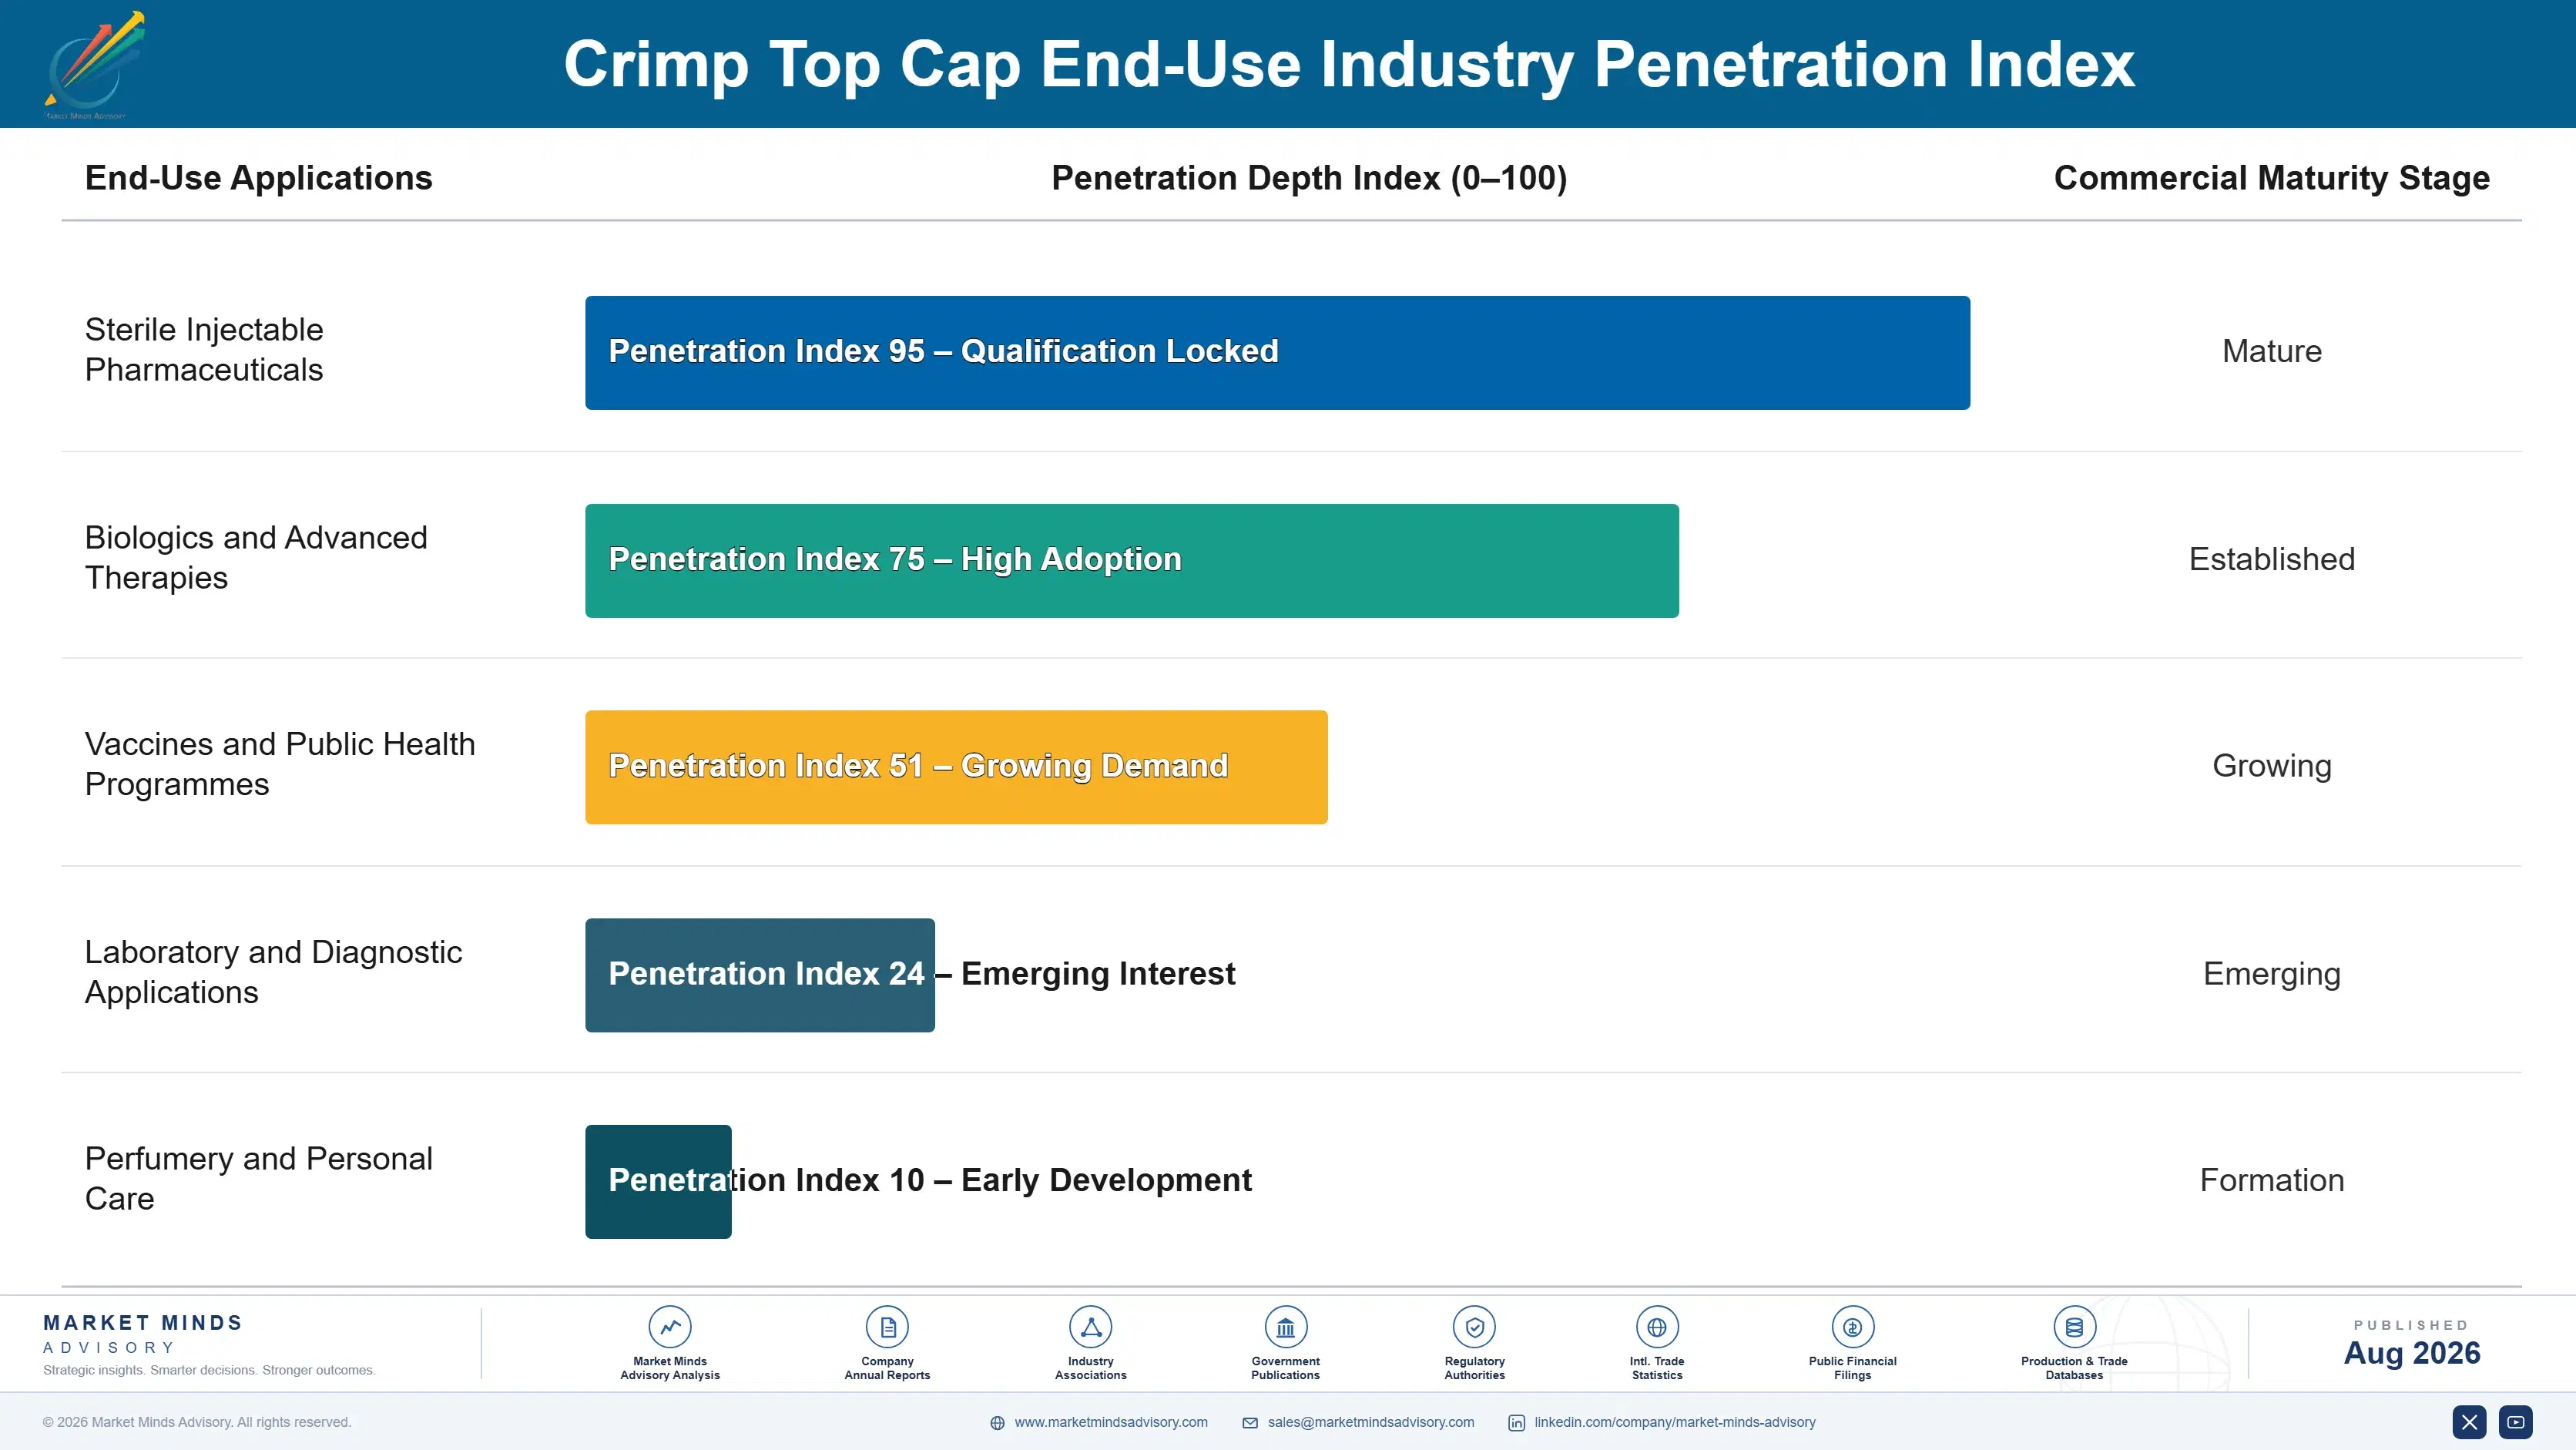
Revenue here is as close to contractually permanent as packaging gets. A seal is qualified as part of a container closure system alongside a specific vial and stopper, that system is named in the regulatory filing, and changing any element requires revalidation costing around USD 340,000 before anyone considers the batch risk. Products run for years or decades, and the component supplier named at qualification usually supplies for the whole of it.
Depth varies by filler type. Large pharmaceutical manufacturers buy deepest, qualifying components against integrity evidence and expecting analytical support during inspections. Contract manufacturers buy ready-to-use formats heavily because they cannot justify in-house sterilisation across many small batches. Generic injectable fillers buy on specification and price where the regulatory filing permits alternatives. Laboratory and diagnostic users sit shallowest, buying plain seals from catalogue with no qualification burden whatsoever.

The specifying population has narrowed rather than broadened. Component selection once sat with packaging procurement balancing cost and supply. Under Annex 1 it sits firmly with quality assurance, and that function evaluates integrity evidence and inspection defensibility rather than considering unit price at all. That is a fundamentally different sale.
crimp-top-cap-market-end-use-penetration-index-1787307205998

Where Seal Suppliers Actually Compete

These are among the four positions where our research anticipates prominent divergence between winners and laggards over the coming forecast period. Each is grounded in the demand model, the regulatory perimeter, and the announced capacity pipeline.
01 / INTEGRITY EVIDENCE OWNERSHIP

Sell the validation package, not the stamped aluminium part

The revised Annex 1 requires container closure integrity assurance on every sealed vial, demonstrated with data characterised against the specific vial and stopper actually in use, rather than through any generic component certification. Suppliers providing residual seal force characterisation and headspace testing correlation move from component vendor to system partner inside the customer's own regulatory filing. That evidence is what a quality director defends during inspection, and it raises switching costs to around USD 340,000 before batch risk enters the calculation.
02 / ASEPTIC STEP ELIMINATION

Every removed intervention inside grade A is worth paying for

Combination seals compound at 9.9%, exactly 1.50 times the market, because supplying the stopper and seal pre-assembled removes an entire handling step from inside the grade A zone. Each intervention inside that zone carries contamination risk, operator training requirements and a documentation burden which the revised Annex 1 has made considerably more onerous. Unit values run roughly 2.3 times separate components, and once validated against a specific vial that assembly cannot be substituted at all without reopening the entire container closure system assessment.
03 / STERILISATION CAPACITY CONSTRAINT

Gamma capacity rather than stamping capacity decides who grows

Ready-to-use seals supplied gamma-irradiated in sealed bags or nested trays now reach 37% of volume, removing washing, depyrogenation and the associated validation from the filling site altogether. Contract manufacturers running many small batches drive that adoption hardest, because in-house washing capability simply cannot be justified across their batch size distribution. Unit prices run several times bulk equivalents, and the binding constraint is supplier irradiation and nesting capacity, so capacity built ahead of demand converts more or less directly into market share.
04 / PRESENTATION SUBSTITUTION RISK

Syringe conversion takes the best volume and never gives it back

Each chronic biologic converting from a vial to a prefilled syringe or cartridge removes roughly 3.4% of category volume annually, and those conversions concentrate precisely in the high-value chronic products where seal margins had always been strongest. The clinical arguments around dosing error and self-administration for chronic therapy are genuine ones, so this direction is not going to reverse. Suppliers therefore have to participate in syringe components while holding the oncology and hospital categories that syringe presentations cannot readily serve at all.

Engagement Snapshot From the Field

A live engagement with an industry participant carrying material or product regulatory and market exposure ahead of a defining policy shift, showing how our research translates into a defensible multi-year portfolio strategy.
MARKET MINDS ADVISORY · CLIENT ENGAGEMENT SUMMARY
Crimp Top Cap Producer Strategic Portfolio Review and Transition Roadmap 2026·Investment Scenario on Crimp Top Cap Exposure Evaluation 2025-26
CLIENT PROFILE
A contract manufacturing organisation operating six sterile filling lines across two European sites, filling roughly 94 million vials annually (client-reported, unverified by MMA) for a client base of forty pharmaceutical sponsors. Component spend across stoppers and seals ran near EUR 21 million (client-reported, unverified by MMA), sourced from four suppliers with no consistent qualification approach between them.
STRATEGIC CHALLENGE
An Annex 1 inspection finding on container closure integrity evidence had required remediation across three filling lines, and sponsors were asking questions the organisation could not answer from its component documentation. Procurement had been consolidating suppliers on price. Quality assurance argued that consolidation on the wrong basis had created the exposure in the first place.
MMA APPROACH
MMA assessed the integrity evidence available from each of the four component suppliers against the specific vial and stopper combinations in use, then modelled the cost of in-house washing and depyrogenation against ready-to-use component pricing across the actual batch size distribution rather than against average volumes. Sponsor expectations on aseptic intervention counts were tested separately.
KEY FINDINGS
  1. Only one of the four suppliers could provide residual seal force characterisation against the client's actual vial and stopper combinations, and that supplier held the smallest share of component spend across the organisation.
  2. In-house washing and depyrogenation cost more per vial than ready-to-use components across every batch size below 40,000 units, which covered 71% of the batches the organisation actually ran.
  3. Three sponsors had already asked whether combination components could reduce aseptic interventions, and no internal function had assessed the qualification pathway or the cost implications at all.
  4. Component consolidation on price had left the organisation without analytical support from any supplier during the inspection, which extended remediation by an estimated four months.
CLIENT PROFILE
A contract manufacturing organisation operating six sterile filling lines across two European sites, filling roughly 94 million vials annually (client-reported, unverified by MMA) for a client base of forty pharmaceutical sponsors. Component spend across stoppers and seals ran near EUR 21 million (client-reported, unverified by MMA), sourced from four suppliers with no consistent qualification approach between them.
STRATEGIC CHALLENGE
An Annex 1 inspection finding on container closure integrity evidence had required remediation across three filling lines, and sponsors were asking questions the organisation could not answer from its component documentation. Procurement had been consolidating suppliers on price. Quality assurance argued that consolidation on the wrong basis had created the exposure in the first place.
MMA APPROACH
MMA assessed the integrity evidence available from each of the four component suppliers against the specific vial and stopper combinations in use, then modelled the cost of in-house washing and depyrogenation against ready-to-use component pricing across the actual batch size distribution rather than against average volumes. Sponsor expectations on aseptic intervention counts were tested separately.
KEY FINDINGS
  1. Only one of the four suppliers could provide residual seal force characterisation against the client's actual vial and stopper combinations, and that supplier held the smallest share of component spend across the organisation.
  2. In-house washing and depyrogenation cost more per vial than ready-to-use components across every batch size below 40,000 units, which covered 71% of the batches the organisation actually ran.
  3. Three sponsors had already asked whether combination components could reduce aseptic interventions, and no internal function had assessed the qualification pathway or the cost implications at all.
  4. Component consolidation on price had left the organisation without analytical support from any supplier during the inspection, which extended remediation by an estimated four months.
RECOMMENDED STRATEGY
Phase 1: Phase 1 (months 1 to 6): Reallocate component volume toward suppliers able to provide integrity characterisation against the actual vial and stopper systems in use. Phase 2: Phase 2 (months 6 to 15): Convert all batches below 40,000 units to ready-to-use sterilised components and release the freed washing capacity. Phase 3: Phase 3 (months 15 to 28): Qualify combination components on two filling lines for the sponsors requesting reduced aseptic intervention counts.
OUTCOME
Component spend rose by roughly EUR 1.9 million while washing and depyrogenation operating cost fell by approximately EUR 3.4 million (client-reported, unverified by MMA). The subsequent inspection closed without container closure integrity findings, and two sponsors expanded volumes citing the reduced intervention count (client-reported, unverified by MMA).

Frequently Asked Questions

Foundational context covering the market sizes, CAGR, scope, country, region and competition that inform every finding below. This section is provided to cover basics and most often pre-purchase conversations, answered from the MMA Primary Research Dataset.

What is the current size of the Crimp Top Cap Market?

The global market was worth USD 1.72 billion in 2025, reaching USD 1.83 billion in 2026. East Asia holds the largest regional share at 29% of demand.

How large will the Crimp Top Cap Market be by 2036?

MMA forecasts USD 3.47 billion by 2036, an expansion multiple of 1.89 times the 2026 base. That represents roughly USD 1.64 billion of incremental value.

What is the CAGR for the Crimp Top Cap Market 2026 to 2036?

The base case compounds at 6.6% annually, with a bull case of 7.8% and a bear case of 5.4%. Historical growth from 2020 to 2025 ran at 5.6%.

Which segment is growing fastest?

Combination seals with an integrated stopper compound at 9.9%, exactly 1.50 times the market rate. They remove an aseptic handling step from inside the grade A filling zone.

Who are the major companies in the Crimp Top Cap Market?

West Pharmaceutical Services, Datwyler Holding, Aptar Pharma, DWK Life Sciences and Genesis Packaging Technologies hold a combined 58% of the market. System qualification rather than stamping capability sustains that concentration.

Which country is growing fastest?

India compounds at 9.4%, well ahead of every other national market. Indian contract manufacturers fill a disproportionate share of the world's generic sterile injectable products.

Report Segmentation Architecture

The full report scope spans multiple orthogonal segmentation dimensions, with cross-tabulated demand data provided for each dimension pair. Coverage extends further to regional breakdowns, trend trajectories, and the competitive detail needed to support segment-level decision-making.

By Seal Construction Type

  • Standard Flip-Off Aluminium Seals
  • Tear-Off and Full Tear Seals
  • Plain Aluminium Crimp Seals
  • Combination Seals With Integrated Stopper
  • Tamper-Evident and Serialised Seals
  • Decorative Crimp Collars

By End-Use Industry

  • Sterile Injectable Pharmaceuticals
  • Biologics and Advanced Therapies
  • Vaccines and Public Health Programmes
  • Laboratory and Diagnostic Applications
  • Perfumery and Personal Care

By Commercial Dimension

  • Direct Supply to Pharmaceutical Manufacturers
  • Contract Manufacturing Organisation Supply
  • Distributor and Laboratory Catalogue Channel
  • Ready-to-Use Sterilised Component Programmes

By Region

  • North America
  • Western Europe
  • East Asia
  • South Asia and Pacific
  • Latin America
  • Middle East and Africa
  • Eastern Europe

Scope, Methodology, and Coverage

Every figure in this report is reproducible from documented input assumptions. The scope below maps the historical period, the forecast horizon, the segmentation dimensions, and the countries covered, alongside the underlying primary and qualitative methodology.
Historical Period
2020 to 2025
Forecast Period
2026 to 2036
Base Year
2025 (USD billions; MMA Primary Research Dataset, August 2026)
Market Definition
The market covers aluminium and aluminium-plastic seals applied by crimping to the neck flange of glass or polymer vials, spanning standard flip-off seals, tear-off and full tear seals, plain crimp seals, combination seals supplied pre-assembled with an elastomeric stopper, tamper-evident and serialised seals, and decorative crimp collars. Vials, stoppers sold as separate components, screw closures, beverage crown caps and aerosol valves are excluded. Sizing is measured at component supplier revenue in current prices.
Quantitative Units
USD billions (current prices); seal unit volumes and residual seal force in newtons where applicable
Segmentation Dimensions
By Seal Construction Type; By End-Use Industry; By Commercial Dimension; By Region
Regions Covered
North America, Western Europe, East Asia, South Asia and Pacific, Latin America, Middle East and Africa, Eastern Europe
Countries Covered
USA, China, Germany, France, UK, Japan, South Korea, India, Australia, Canada, Brazil, Mexico, Indonesia, Vietnam, Thailand, Malaysia, UAE, Saudi Arabia, South Africa, Nigeria, Turkey, Poland, Netherlands, Italy, Spain, Sweden, Switzerland, Argentina, Colombia, Singapore, and additional markets relevant to this sector
Key Companies Profiled
West Pharmaceutical Services, Datwyler Holding, Aptar Pharma, DWK Life Sciences, Genesis Packaging Technologies, Berry Global, Nipro Corporation, Shandong Pharmaceutical Glass, Hebei First Rubber Medical Technology, Jiangsu Hualan Technology, Adelphi Healthcare Packaging, Kaisha Packaging, ACG, Bormioli Pharma, Gerresheimer, SCHOTT Pharma, Stevanato Group, Comar, Corning, Thermo Fisher Scientific
Quantitative Methodology
Primary survey, n=3,800 respondents, Q4 2025, six countries; demand-side model with trade association cross-validation
Qualitative Methodology
47 expert interviews, Q4 2025; applied to validate demand model assumptions, identify emerging dynamics, and assess competitive positioning
Report Format
PDF and XLSX data workbook (Word format preview document)
Publisher
Market Minds Advisory
Report Code
MMA-2026-PAC-661
Published
August 2026
Contact
sales@marketmindsadvisory.com | www.marketmindsadvisory.com

Purchase the full Crimp Top Cap Market Report (2026 to 2036).

The full report sizes crimp top caps across six construction types, three commercial dimensions and seven regions, with annual forecasts to 2036 under base, bull and bear scenarios. Annex 1 container closure integrity requirements are translated into component specification consequences, with supplier analytical capability compared across the profiled set. Ready-to-use adoption economics are modelled against batch size distribution rather than average volumes, showing where in-house sterilisation stops being justifiable. Prefilled syringe conversion exposure is quantified by therapeutic category. Twenty suppliers are profiled on a consistent component revenue basis.
Annex 1 integrity requirements translated into component specifications
Supplier analytical characterisation capability compared across twenty companies
Ready-to-use economics modelled against actual batch size distribution
Prefilled syringe conversion exposure quantified by therapeutic category
Combination component qualification pathways and timelines assessed
Regional sterile filling capacity mapped against component supply

Built For The People Who Decide

From boardroom strategy to bench-side execution, this report is read cover-to-cover by leaders shaping the next decade of their industry, turning demand scenarios, market dynamics and valuation benchmarks into decisions.
CXOs/ Presidents/ VPs/ Managers
M&A and Corporate Development
Strategy Teams and R&D Heads
Procurement and Product Directors
Regulatory and Compliance Leaders
Investor Relations and Equity Analysts