Market Minds Advisory
Cranes Rental Market

Cranes Rental Market: Utilisation Is Measured Wrong Almost Everywhere

Fleet owners report time utilisation and then get paid on revenue per asset, and the gap between those two numbers is where almost every underperforming crane rental business is quietly hiding.

Lead Analyst

David Horsley

Published

September 2026

Make Smarter Decisions with Customized Research Insights

Request a free sample report and evaluate market opportunities, growth trends, and competitive dynamics relevant to your business needs.

2025 MARKET VALUE$58.0BMarket Size 2025
2036 FORECAST VALUE$114.8BBase Case , 2026 to 2036
CAGR 2026 TO 20366.4 %Bull 7.6% / Bear 5.2%
INCREMENTAL OPPORTUNITY$53.0BNet 10- year value creation
EXPANSION MULTIPLE1.86x2036 value over 2026 base
Strategic Levers
M&A Pipeline
Regional Outlook
Country Rankings
Competitive Intelligence
Segmental Deep-dive
Call-Us : 91 93563 13602

Executive Snapshot and Market Trajectory

Almost everyone in this business reports time utilisation, which measures how many days a crane left the yard. It says nothing about rate. A fleet running 71% time utilisation at poor rates earns less than one running 58% at disciplined rates, and boards keep rewarding the wrong number.
Growth runs at 6.4% and services rather than bare metal carry it. Operated and maintained lifting grows at 9.6%, exactly 1.50 times the market rate, because customers increasingly want a lift delivered rather than a machine hired. East Asia holds the largest share at 29%, on Chinese and Korean industrial and infrastructure construction volume. Crawler classes serving wind installation follow at 8.2%, where scarcity rather than cycle sets rates.
Concentration is very low at 21% across the top five measured on fleet capacity in tonne-metres, and it will stay low because lifting is a local business with mobilisation cost rising steeply with distance. Crane transport is where margin disappears, and the operators who price it properly are the ones earning anything at all. Contractors are also buying rather than hiring in the stable standard classes, which keeps leaking predictable demand out of rental.
Market Definition
This market covers commercial rental of lifting equipment with or without operators, spanning mobile and all-terrain crane rental, crawler crane rental for heavy lift, tower crane rental for building construction, operated and maintained lifting services, and specialised heavy lift and transport projects. Sale of new or used cranes, aerial work platforms and telehandlers, forklift and warehouse handling equipment, permanent overhead cranes installed in buildings, and rigging hardware sold independently fall outside scope.
Base Year Value
$58.0B in 2025 (MMA Primary Research Dataset, August 2026)
Forecast Period
2026 to 2036, eleven discrete annual values
CAGR
6.4% base case. Bull 7.6%. Bear 5.2%.
Fastest Growth Segment
Operated and Maintained Lifting Services: 9.6% CAGR
Fastest Growth Country
India: 8.8% CAGR
Fastest Growth Region
South Asia and Pacific: 8.4% CAGR
Largest Region
East Asia: 29% of 2025 global value
Market Leaders
Mammoet, Sarens, Maxim Crane Works, Sanghvi Movers, Al Faris Group. Source: MMA Analysis based on company annual reports.
Primary Survey
n=3,800 procurement and R&D decision-makers, Q4 2025, six countries
Methodology
Demand-side build-up, cross-validated against public data, 47 expert interviews

Cranes Rental Market Forecast Scenarios

cranes-rental-market-size-forecast-scenario-1787301074517
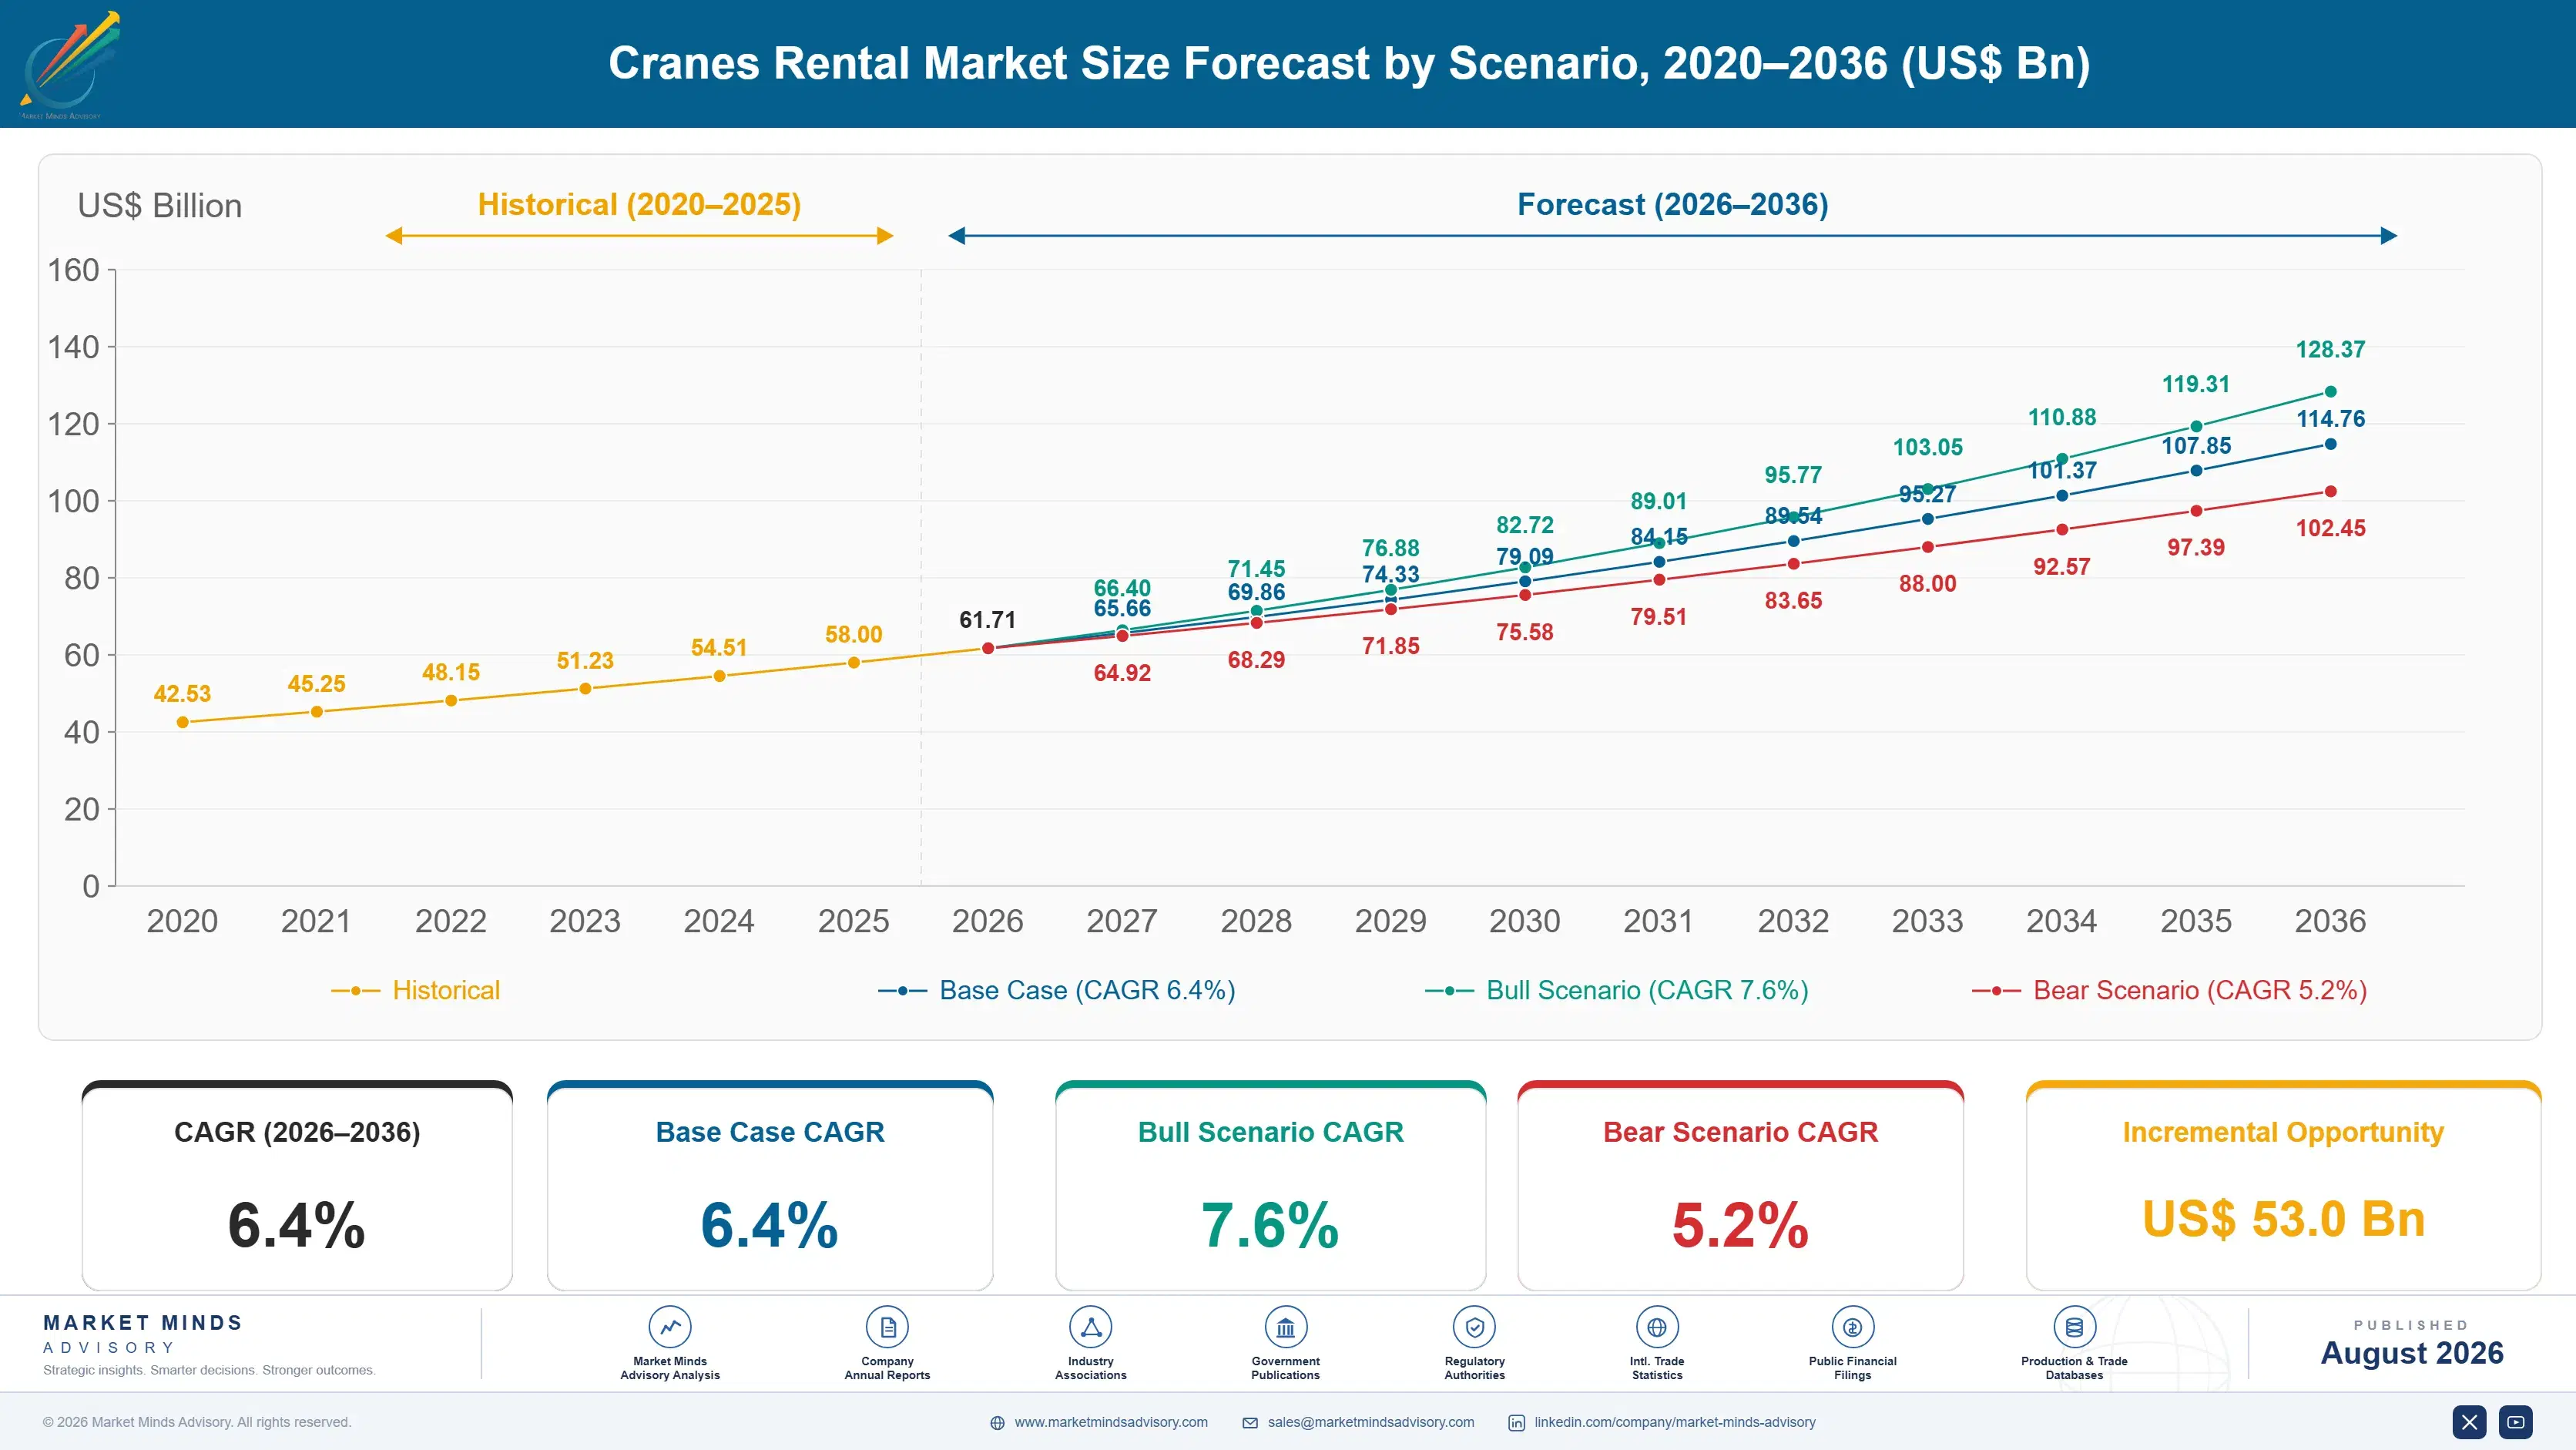
The 2020 to 2025 period grew at 5.2% and fleet discipline improved more than volume did. Construction activity fell sharply through 2020 and recovered unevenly, while wind installation and industrial maintenance held up throughout and became a larger share of demand. Interest rate increases from 2022 raised the cost of holding fleet and pushed several operators to sell down older machines rather than compete on rate.
Three mechanisms carry the 6.4% base case. Wind turbine installation and maintenance is the largest, since taller towers demand crane classes very few fleets own and rates reflect that scarcity. Operated service conversion is the second, because customers buying a completed lift pay for capability rather than for machine days. And industrial plant maintenance is the third, which generates recurring lifting demand independent of construction cycles. None of the three depends on building construction recovering strongly.
The 7.6% bull case rests on offshore and onshore wind installation accelerating together, which would tighten the very heavy crawler classes where supply is genuinely constrained. The 5.2% bear case is a construction downturn combined with fleet oversupply in standard mobile classes, where low switching costs mean rate discipline collapses quickly once anyone breaks it.

The Number Everyone Reports Is Wrong

Ask a crane rental business how it is performing and you will be told a time utilisation figure, typically somewhere near 71%. It counts the days each machine left the yard. It does not count what the machine earned while it was out, and those two things separate widely. Financial utilisation, revenue measured against theoretical capacity at published rates, runs closer to 43% across the sector.
REPORTED TIME UTILISATION71%Days a crane leaves the yard, not what it earns
FINANCIAL UTILISATION43%Revenue against theoretical capacity at full published rates
MOBILISATION SHARE OF JOB27%Of total job cost consumed by transport and rigging
OPERATOR VACANCY RATE18%Across certified crane operator positions in most mature markets
TOP FIVE CONCENTRATION21%Very low, because lifting is a local business everywhere
FLEET AVERAGE AGE11 yearsRising as interest costs discourage replacement across most operators
The gap has a specific cause. Rate discipline collapses first in the standard mobile classes where every operator in a region owns similar machines and switching costs a customer nothing. A yard manager under pressure to move iron will take work at rates that cover the diesel and the driver, book it as utilisation, and report a healthy number upward. The fleet looks busy. The business earns very little.
Mobilisation is the second thing measured badly. Transport and rigging carry around 27% of total job cost, and that share rises steeply with distance because heavy transport permits, escorts, and assembly crews do not scale down. Operators quoting a day rate and absorbing mobilisation to win work are frequently taking jobs that lose money before the hook lifts anything at all.
"A client showed me 74% utilisation and a loss. We rebuilt the numbers by job and found their best machine was travelling three hours each way to earn a rate the machine next door was getting locally."
Director, Construction Equipment and Lifting Services Practice · MMA Constructio

Market Trends

Customers Buy Completed Lifts Rather Than Machine Days

Industrial and construction clients are moving from bare rental toward operated and maintained arrangements where the provider supplies crane, operator, rigging crew, and lift planning as one deliverable. Growth runs at 9.6% against 6.4% for the market. The shift transfers execution risk to the provider and prices on capability rather than on machine class, which is why margins hold considerably better here. Operator vacancy near 18% also makes self-supply harder for customers than it was. Method statements and crew certification now get evaluated ahead of rate on complex work. Displacing an operated relationship on price alone has become very difficult.
Market Impact: Operator vacancy near 18%
Wind Installation Reshapes Which Crane Classes Matter

Turbine hub heights have risen past what most existing crawler fleets can reach, and the very heavy classes capable of the work are owned by a small number of operators worldwide. Rates in those classes reflect genuine scarcity rather than any cyclical strength. Maintenance lifting on installed turbines then produces recurring demand across the asset life. Fleets without exposure to these classes are competing in the standard segments where rate discipline fails first. Capital in those classes gets committed ahead of contracted demand, which is what sustains the rates. Gaps between projects have become expensive since financing costs rose.
Market Impact: Financial utilisation near 43%

Market Opportunities and Growth Drivers

Operator Scarcity Pushes Customers Toward Operated Hire

Certified crane operator vacancy runs near 18% across most mature markets, and the training and certification pathway takes years rather than months, so the shortage does not resolve on wage increases alone. Customers who once hired bare machines and supplied their own operators increasingly cannot staff them, which converts bare rental demand into operated service demand without any commercial persuasion. Providers holding trained crews therefore capture work that fleet size alone would never have won. Providers recruiting and training ahead of contracted demand hold capacity competitors cannot assemble quickly. Wage cost rises modestly against access to a much better segment.
Market Impact: Financial utilisation sits at 43%

Industrial Maintenance Generates Demand Outside Construction

Refineries, petrochemical plants, power stations, and steel works all require scheduled lifting for vessel replacement, turnaround work, and component change-outs, and that demand follows maintenance calendars rather than construction cycles. It is recurring, plannable years ahead, and largely insulated from the downturns that empty construction sites. Operators with industrial account relationships carry considerably steadier financial utilisation than those dependent on building work, which matters enormously through any construction correction. Multi-year framework agreements covering turnaround lifting price well above spot work. Operators with industrial accounts ride a construction correction far better than those without. Yard placement against those assets matters enormously.
Market Impact: Mobilisation is 27% of job cost

Market Restraints and Challenges

Rate Discipline Collapses In Standard Mobile Classes

Financial utilisation runs near 43% against reported time utilisation around 71%, and the gap concentrates in standard mobile classes where every regional operator owns similar machines. The root cause is that switching costs a customer nothing when the equipment is interchangeable, so one operator discounting sets the regional rate immediately. Commercial impact is fleets that look busy and earn little. Mitigation runs through financial utilisation reporting, class differentiation, and disciplined refusal of work below defined rate floors. Contractor ownership also keeps leaking predictable demand out of rental in exactly these classes.
Market Impact: Operated services growing at 9.6%

Mobilisation Cost Destroys Margin On Distant Work

Transport and rigging carry around 27% of total job cost and that share climbs steeply with distance, because heavy transport permits, route surveys, escorts, and assembly crews do not scale down for shorter jobs. The root cause is physics and regulation together. Commercial impact is operators winning distant work that loses money before lifting begins. Mitigation runs through mobilisation priced separately rather than absorbed, defined radius limits by machine class, and yard placement near recurring industrial demand. Yard placement against recurring industrial demand is the only genuinely durable answer available here.
Market Impact: Fleet age reaches 11 years
3 additional market trends, 4 additional growth drivers, and 2 additional restraints and challenges are covered in the full report. Contact sales@marketmindsadvisory.com to access the complete intelligence.

Segment CAGR and Growth Architecture

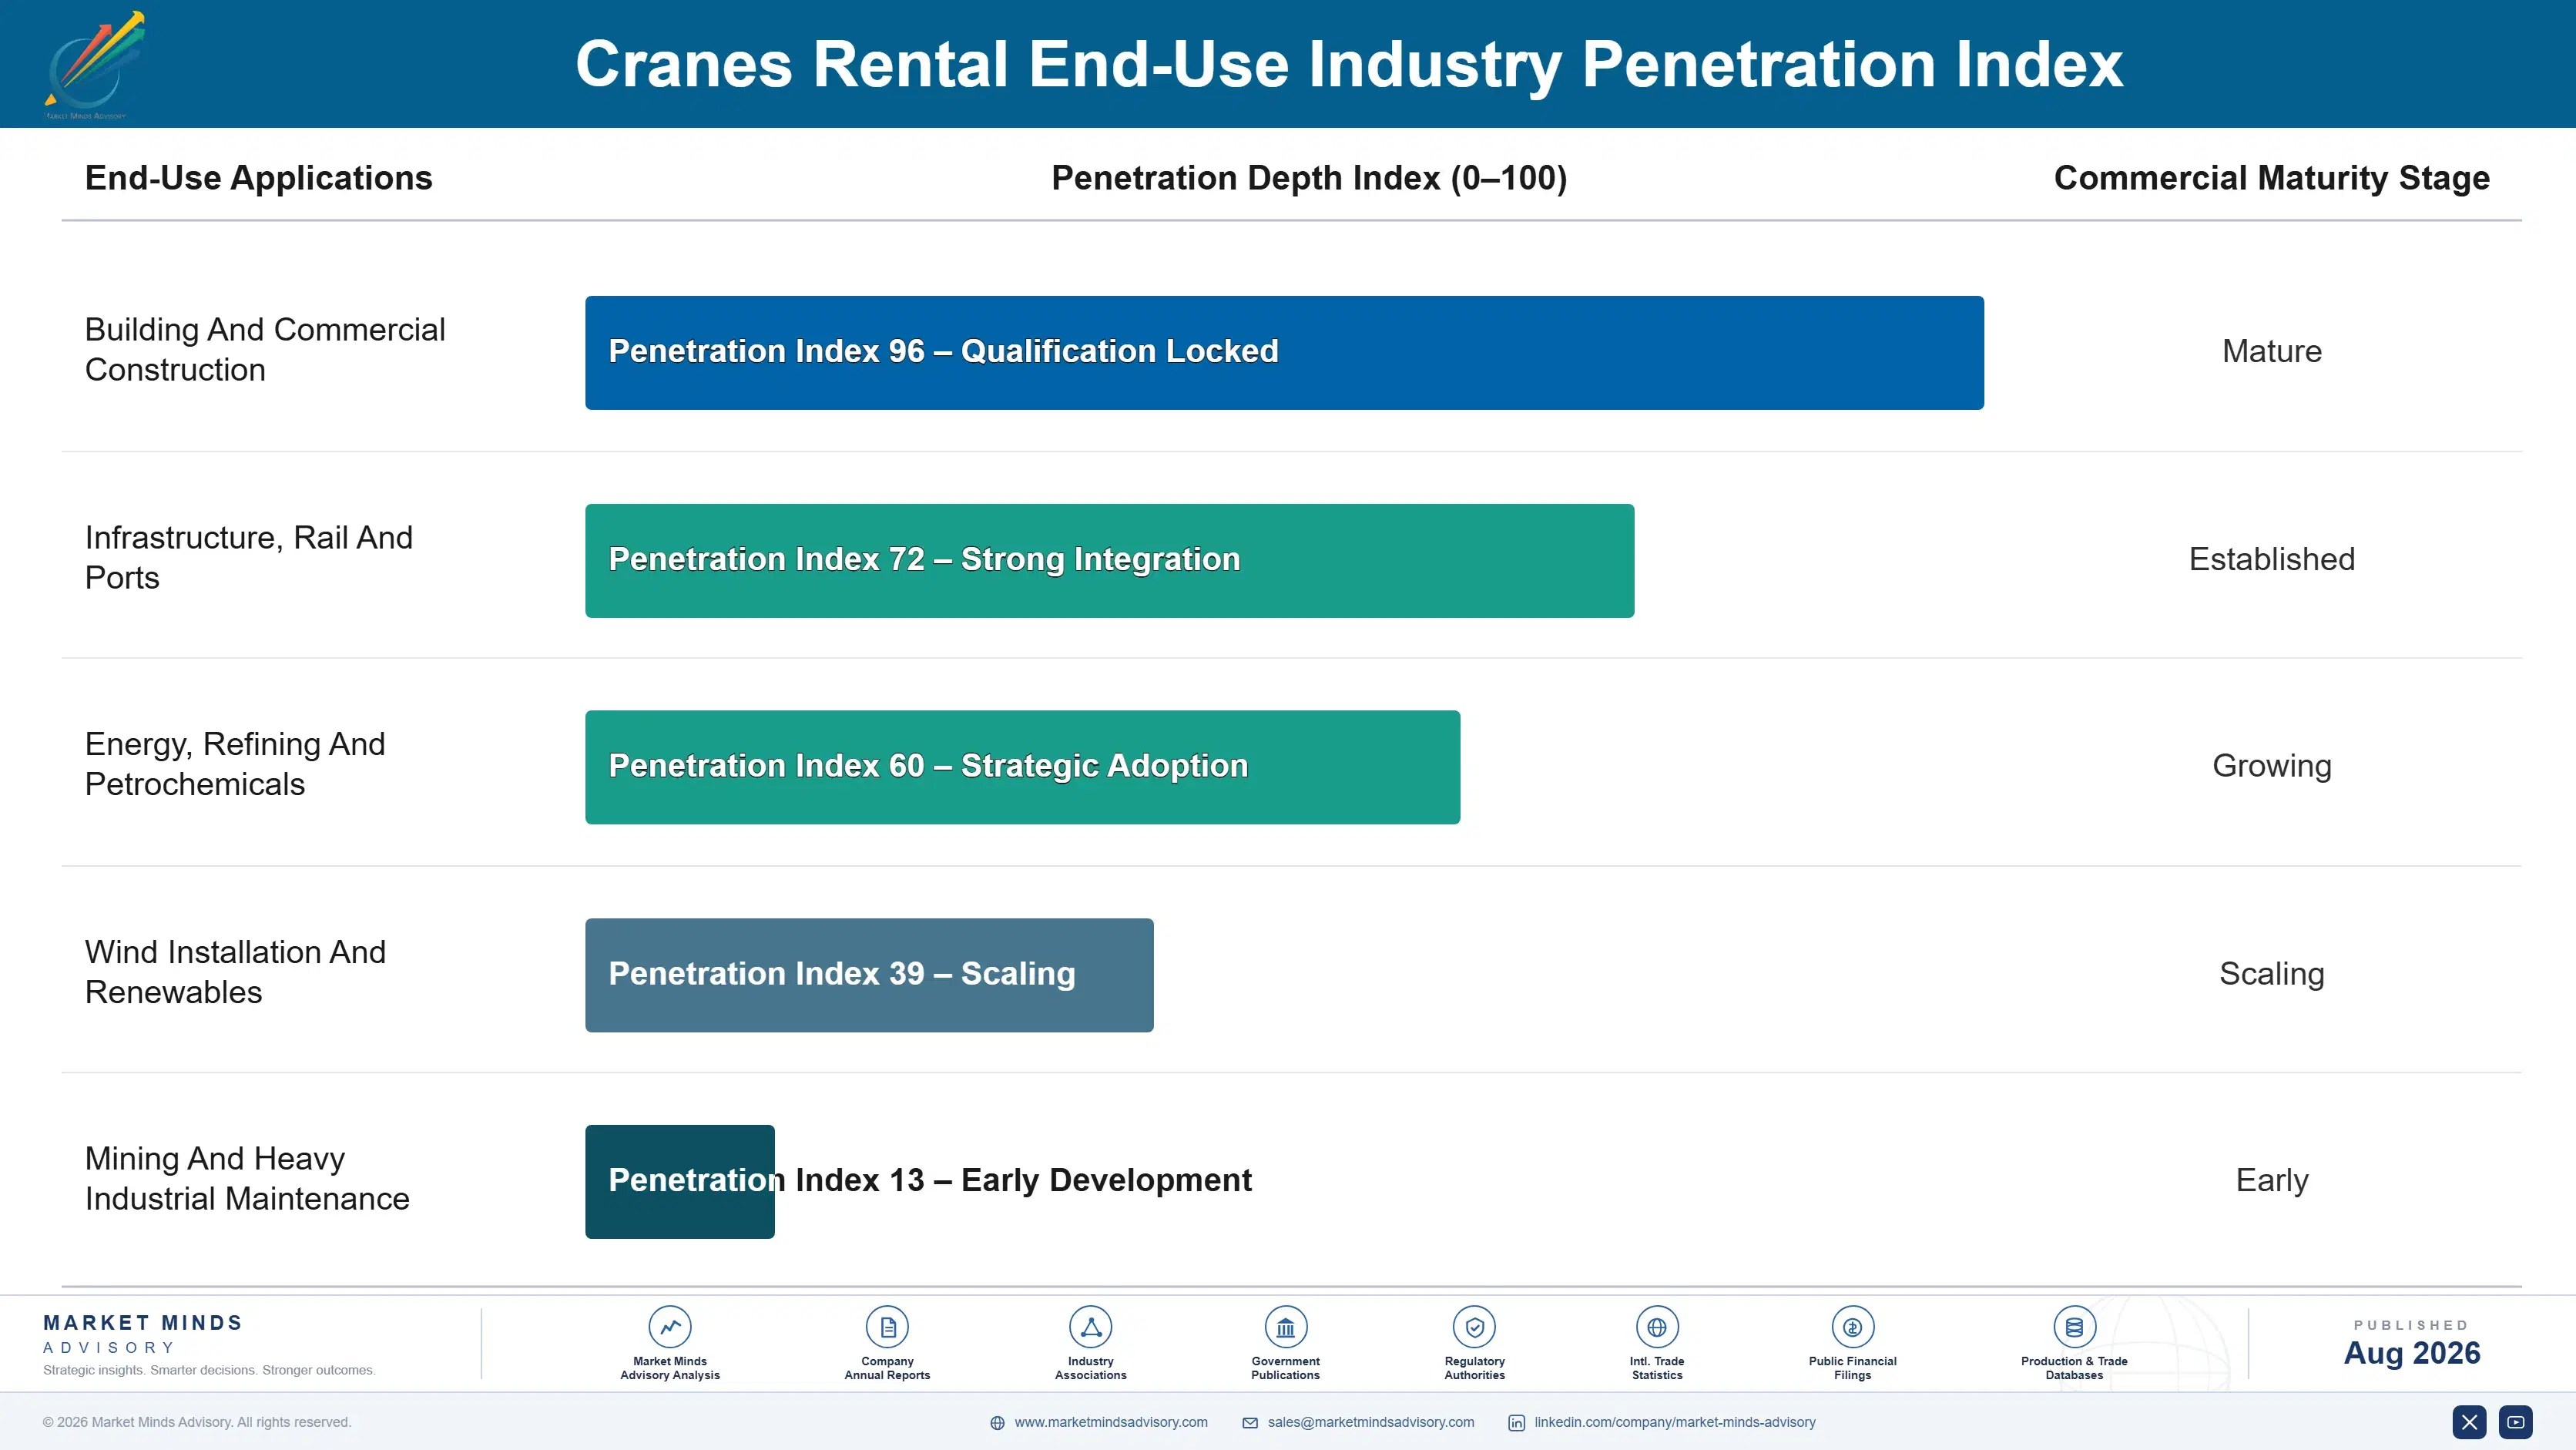
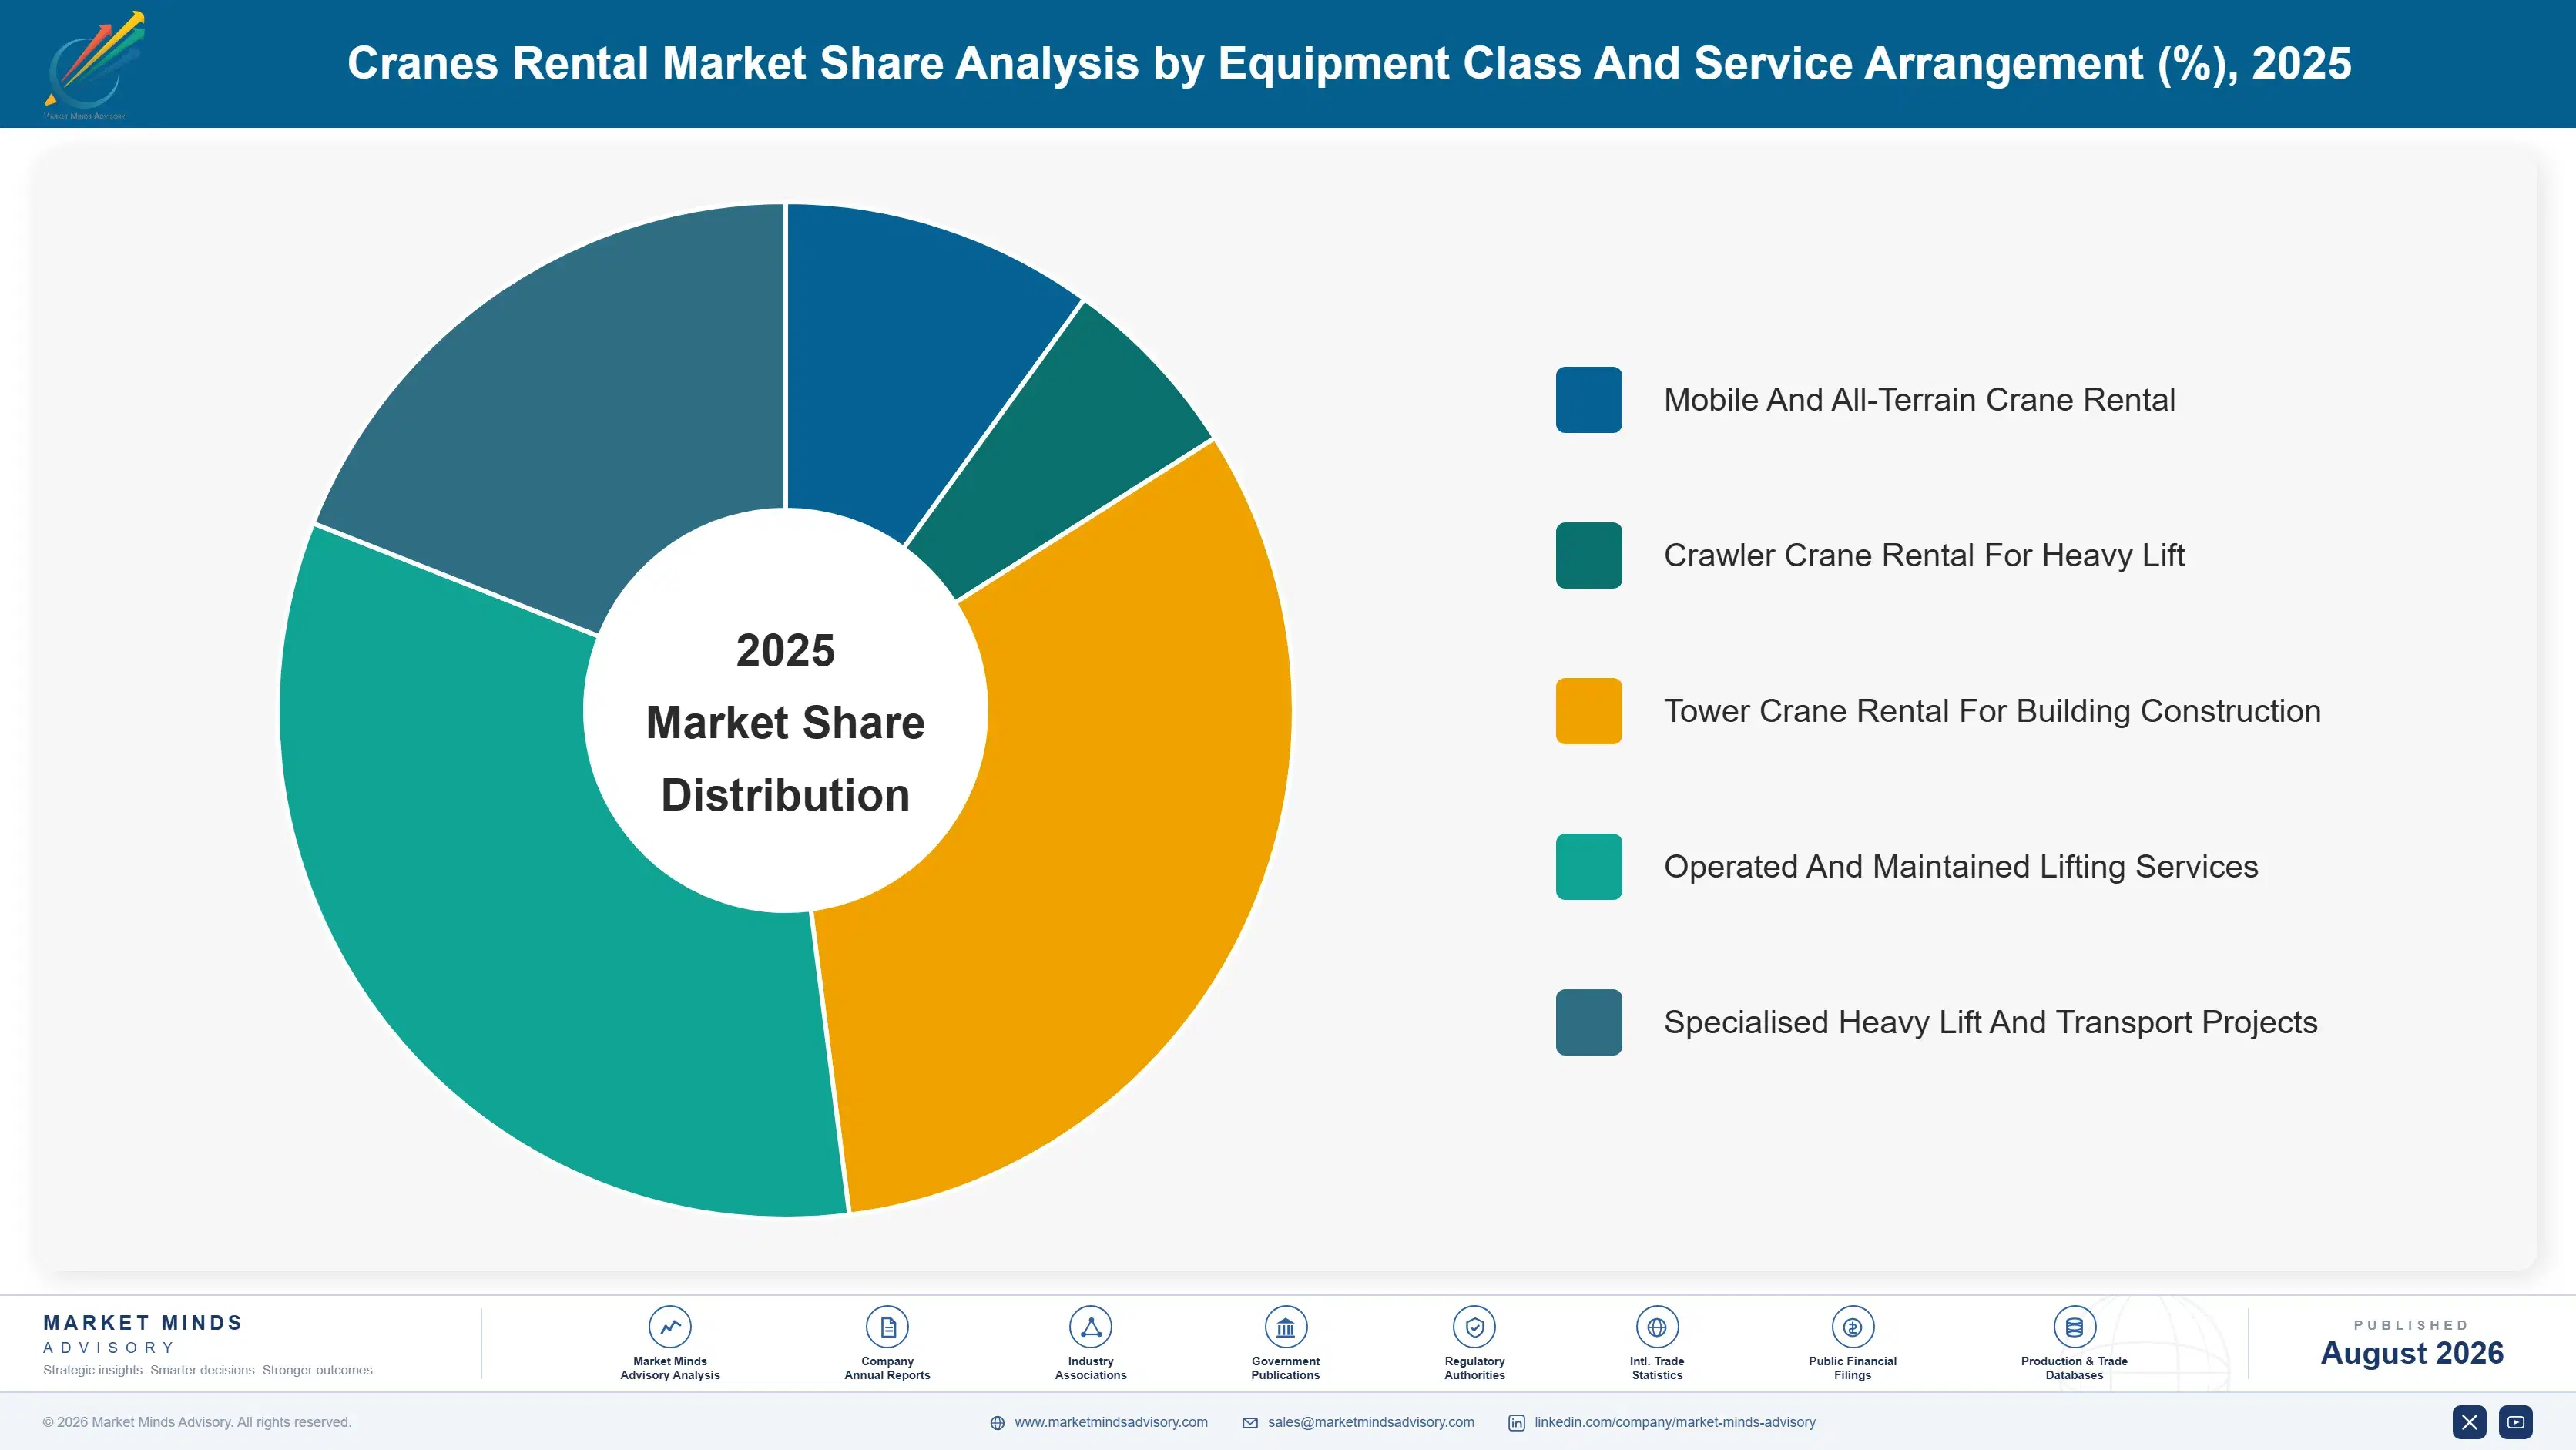
Segmentation follows equipment class and service arrangement together, because those determine mobilisation cost, operator requirement, rate defensibility, and how easily a customer can substitute one supplier for another. End-use industry cuts across every class rather than separating them, which makes it a considerably weaker primary dimension for this particular market. Substitutability rather than machine size decides rate defensibility here.
cranes-rental-market-market-share-analysis-1787301075047

Operated And Maintained Lifting Services

The fastest arrangement at 9.6%, exactly 1.50 times the market rate, and the only one priced on capability rather than on machine class. The provider supplies crane, operator, rigging crew, and lift planning as one deliverable, which transfers execution risk and makes direct rate comparison against a bare hire almost impossible. Operator vacancy near 18% is accelerating the shift, since customers who once staffed their own machines increasingly cannot. Margins hold considerably better here, and the relationships are far harder for a competitor to displace on price. Site knowledge accumulated by a regular crew is worth more than most customers realise. Displacing that relationship means sourcing crews from a market already short of them.
CAGR 9.6%

Crawler Crane Rental For Heavy Lift

Second fastest at 8.2%, and the class where scarcity rather than cycle strength sets rates. Turbine hub heights have risen past what most existing fleets can reach, and the very heavy crawlers capable of that work are owned by a small number of operators worldwide. Mobilisation is severe, since these machines travel in many loads and take days to assemble, which means jobs are planned months ahead and priced accordingly. Financial utilisation in this class runs well above the standard mobile segments. Turbine maintenance on installed assets then generates recurring lifting across the whole asset life. Capital in these classes is committed ahead of contracted demand, which is what sustains the rates. Few operators worldwide can serve the work.
CAGR 8.2%
Full segment breakdown across 5 segments available in the complete report.

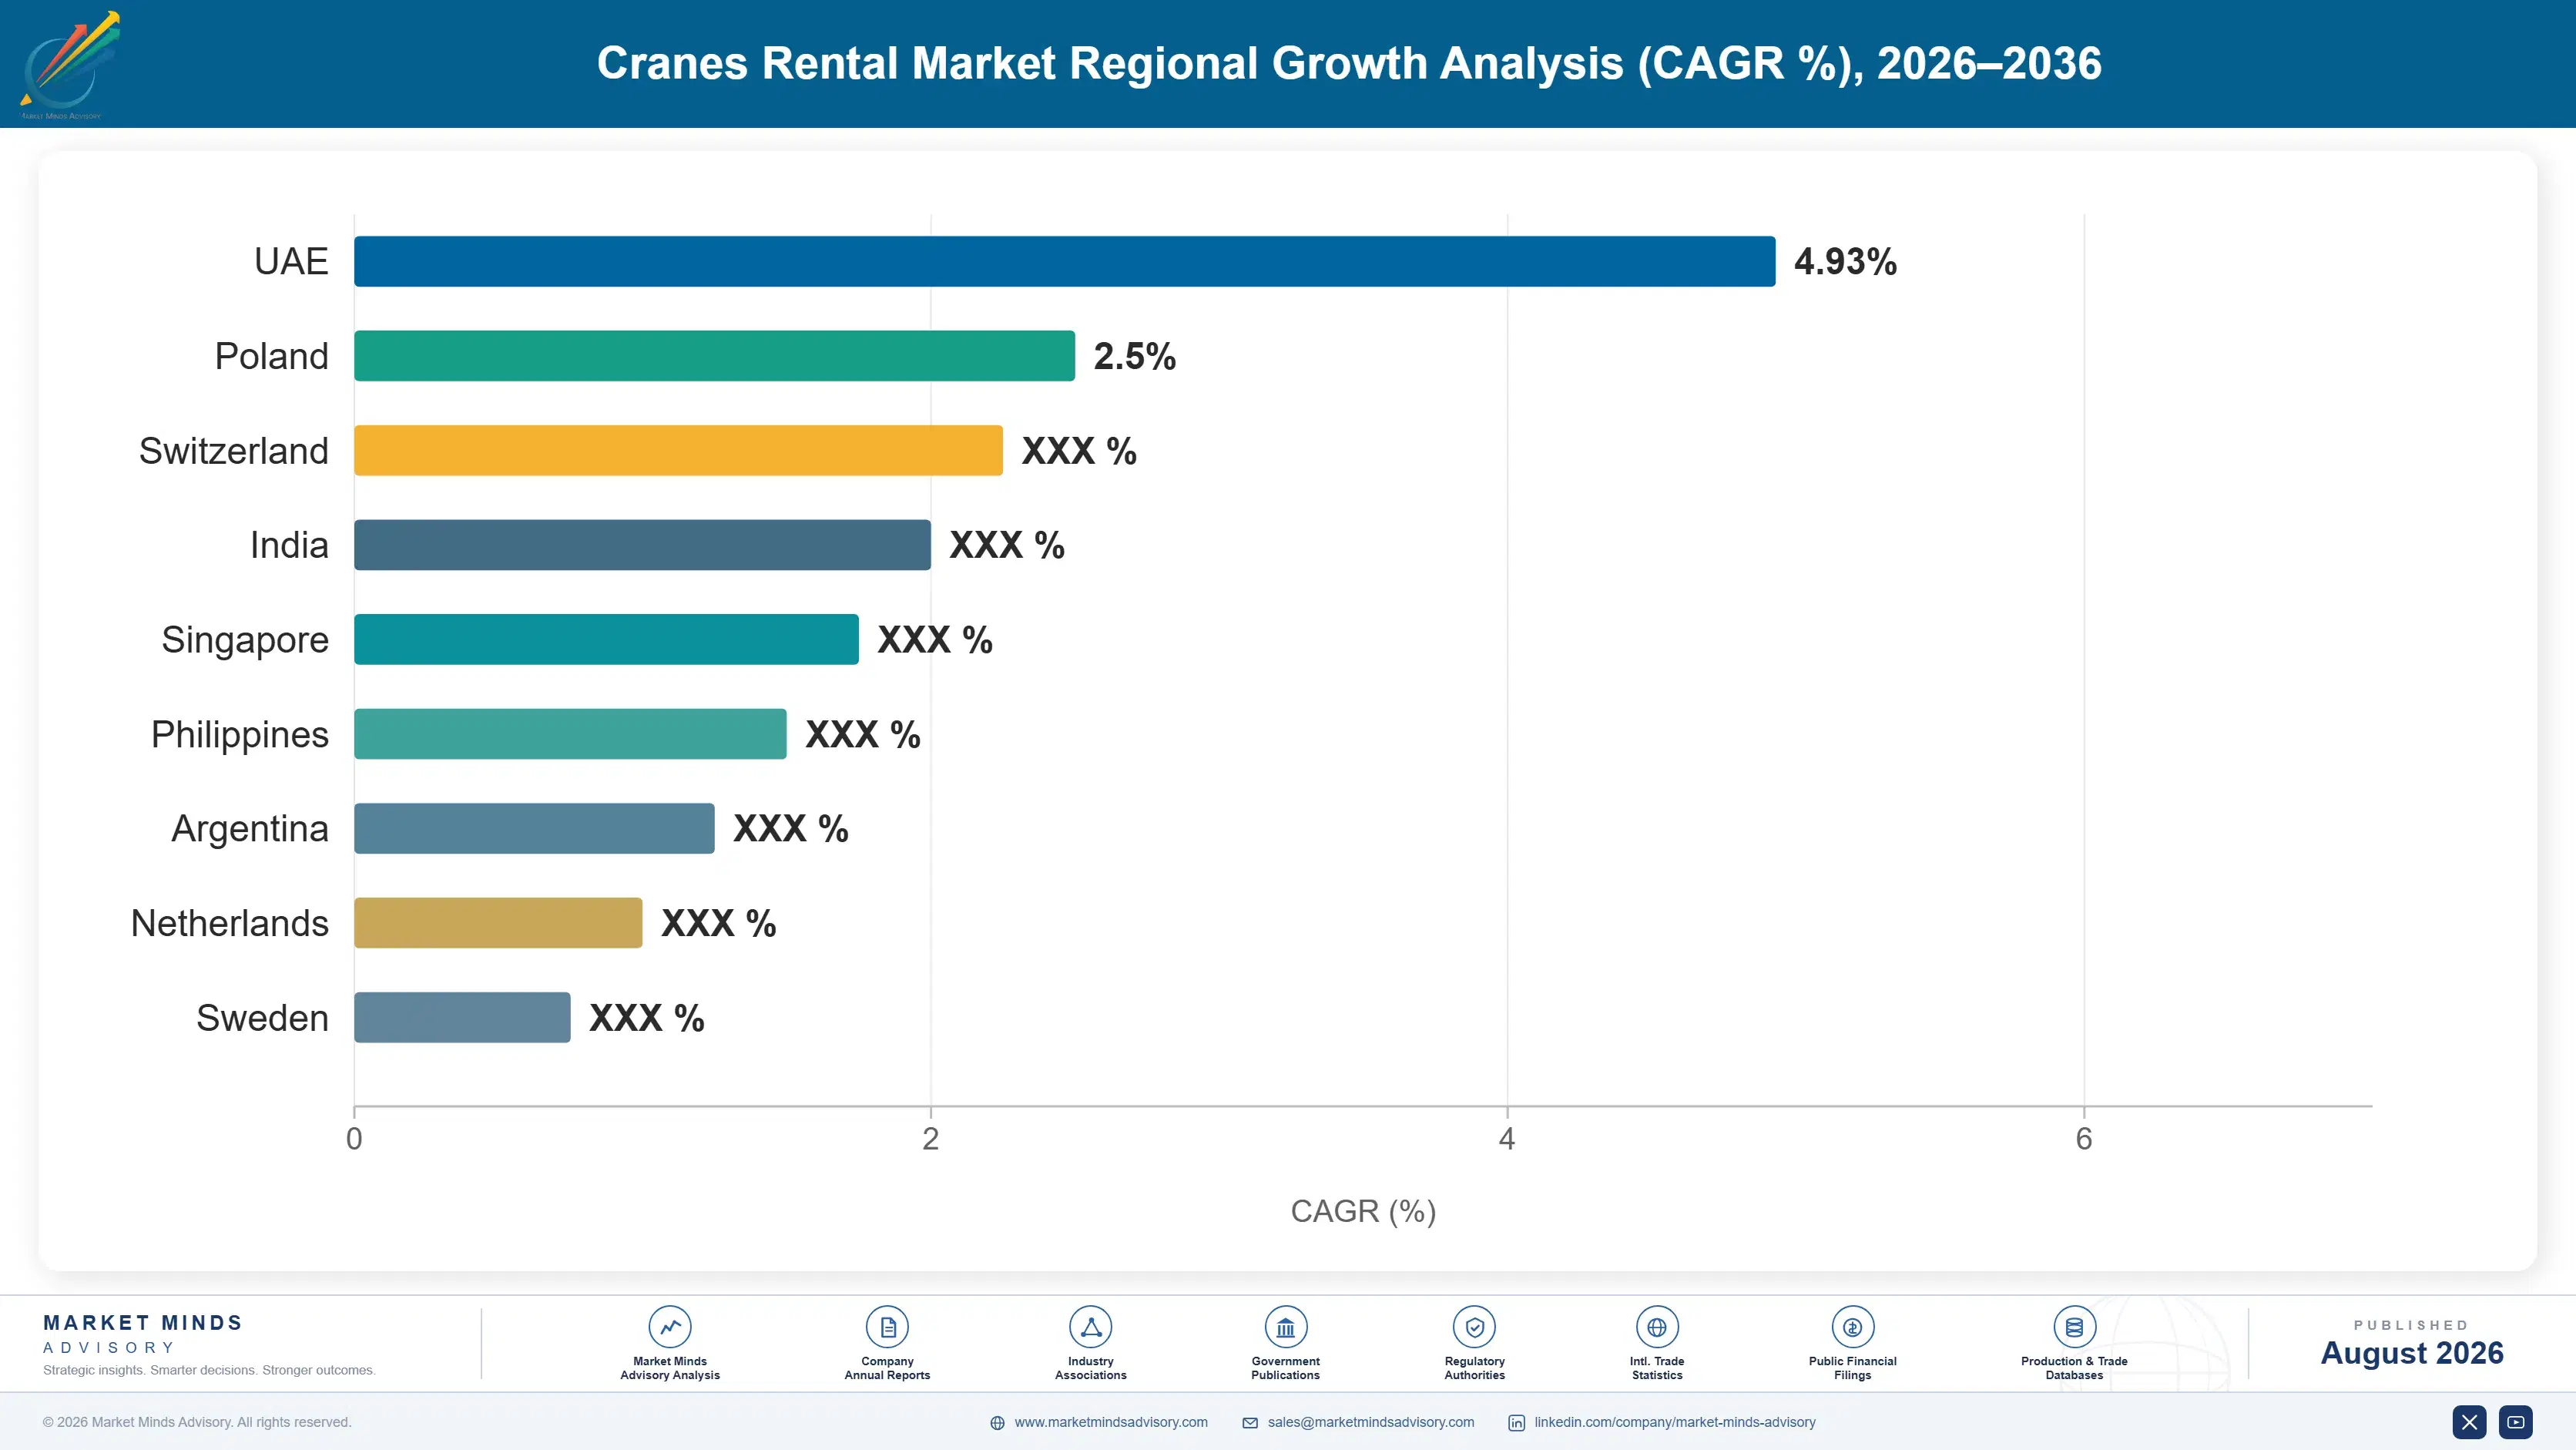
Regional Architecture and Country Demand Map

East Asia leads at 29% on Chinese and Korean industrial and infrastructure construction volume. North America follows on industrial maintenance and wind installation, ahead of Western Europe. South Asia and Pacific grows fastest as Indian infrastructure programmes scale. Industrial maintenance demand varies enormously between these regions.

East Asia

Twenty-nine percent, the largest share, and the mix is unlike any other region. Chinese infrastructure and industrial construction generate lifting demand at enormous scale, largely served by domestic operators running domestically manufactured fleets at rates Western operators could not sustain. Korean shipbuilding, petrochemical, and offshore fabrication yards produce heavy lift demand that is recurring rather than project-driven. Japanese urban construction uses tower cranes intensively under tight site constraints. Growth at 7.2% runs above the market rate, supported by Chinese wind installation as much as by building work. Operated service arrangements are less developed here than in Europe, with bare hire still dominant. Domestic manufacturers supply capable machines that lower entry costs for new regional operators.
Share: 29% | CAGR: 7.2% (2026 to 2036)

North America

Industrial maintenance rather than construction carries more of this 24% than most observers expect. Refinery turnarounds, petrochemical vessel replacement, and power station outage work generate recurring, plannable lifting demand across the Gulf Coast and Midwest that continues through construction downturns. Onshore wind installation has concentrated very heavy crawler demand in a handful of operators. Operator scarcity is acute, with vacancy across certified positions pushing customers toward operated hire. Growth at 6.0% sits close to the market rate, carried by industrial and wind rather than by buildings. Multi-year framework agreements covering turnaround lifting are more common here than anywhere else. Yards sited against refining and petrochemical clusters earn steadier financial utilisation than construction-dependent depots. Rate discipline in mobile classes remains poor.
Share: 24% | CAGR: 6.0% (2026 to 2036)
Regional intelligence for 5 additional markets available in the complete report: Western Europe, South Asia and Pacific, Latin America, Middle East and Africa, Eastern Europe. Contact sales@marketmindsadvisory.com.
cranes-rental-market-country-cagr-analysis-1787301075565

Fixing What the Fleet Actually Earns

Reported time utilisation sits near 71% against financial utilisation around 43%, mobilisation carries 27% of job cost, and operator vacancy runs near 18%. Value comes from measuring revenue per asset, from pricing mobilisation separately, from converting to operated service, and from choosing classes deliberately. The measure a board rewards is the behaviour it gets. Fleet size rarely fixes either problem.

Report Financial Utilisation Instead Of Time Utilisation

Time utilisation near 71% measures how often a crane left the yard and says nothing about what it earned, while financial utilisation near 43% measures revenue against capacity at published rates. Yard managers rewarded on the first number will take work at rates covering diesel and driver, and the fleet will look busy while the business earns nothing. Changing the reported measure changes the behaviour within a quarter, and it costs only the discipline to publish it. Boards approving fleet capital against strong time utilisation are frequently funding the wrong problem entirely.
Market Impact: Closes the gap between 71% and 43% utilisation

Price Mobilisation Separately From The Day Rate

Transport and rigging carry around 27% of total job cost and that share rises steeply with distance, because permits, route surveys, escorts, and assembly crews simply do not scale down for a shorter job. Operators absorbing mobilisation into a day rate to win distant work routinely take jobs that lose money before the hook moves. Quoting mobilisation as a separate line loses some tenders and removes the losses hiding inside apparently healthy utilisation figures. Defined travel radius limits by machine class then make that discipline operational rather than merely aspirational.
Market Impact: Mobilisation carries about 27% of total job cost

Convert Bare Hire Accounts To Operated Service

Operated and maintained lifting grows at 9.6% against 6.4% for the market and prices on capability rather than machine class, which makes direct rate comparison against a bare hire almost impossible for a procurement team. Operator vacancy near 18% means many customers can no longer staff hired machines anyway. Converting an existing bare hire relationship costs a crew and a lift planner rather than any capital, and it moves the account out of the price contest entirely. Site knowledge accumulated by a regular crew then makes the relationship very hard to displace.
Market Impact: Operated services are now growing at 9.6% yearly

Concentrate Fleet In Classes Others Cannot Serve

Standard mobile classes are where rate discipline collapses first, because every regional operator owns similar machines and switching costs a customer nothing at all. Very heavy crawlers serving wind installation and industrial vessel replacement are owned by few operators and price on scarcity rather than on cycle. Fleet capital directed toward classes with genuine supply constraint earns financial utilisation well above the 43% sector average, and it survives a construction downturn considerably better. Capital in constrained classes must be committed ahead of contracted demand, which is uncomfortable and necessary. Gaps between projects have become expensive since financing costs rose sharply.
Market Impact: Beats the 43% sector average utilisation rate today

Who Controls the Margin Pool

Concentration is very low at 21% across the top five measured on fleet capacity in tonne-metres, and it will stay low for a reason that has nothing to do with consolidation appetite. Lifting is local: mobilisation cost rises steeply with distance, so a national fleet competes as a set of regional yards rather than as one business. Global operators exist only where projects are large enough to justify moving machines internationally.
Competitive activity runs on three fronts. Heavy class fleet ownership is the first, since very heavy crawlers serving wind and industrial vessel work are scarce and price accordingly. Operator crew depth is the second, which vacancy near 18% has made a genuine constraint on winning operated work. And lift engineering capability is the third, because complex jobs are awarded on method statements rather than on rate.

Pressure arrives from two directions. Contractors are buying rather than hiring in stable classes where financing allows. And Chinese crane manufacturers are supplying capable machines at prices that lower the entry cost for new regional operators. Both pressures bite hardest in exactly the standard classes where rate discipline is already weakest.

Rankings move on heavy class acquisitions and on project awards.
cranes-rental-market-company-positioning-matrix-1787301076083

Competitive Moat and Risk Dimensions

MAMMOET

Moat: Heavy lift engineering and mobilisation

Owning very heavy lift capability alongside the engineering to plan and execute complex jobs lets one operator take work that fleet ownership alone cannot win, since these projects are awarded on method rather than rate. Moving that equipment internationally is a competence in itself, involving permits, transport, and assembly crews across jurisdictions. Assembling either capability takes decades.
MAMMOET

Risk: Heavy capital against project timing

Very heavy fleet ties up substantial capital against demand that arrives as discrete projects rather than as steady flow, so a gap between major awards leaves expensive assets idle with no local work capable of absorbing them. Financing costs have made those gaps considerably more painful since 2022. Scarcity pricing compensates only when the projects actually arrive.
SARENS

Moat: Wind installation class depth

Fleet positioned specifically in the crane classes that turbine hub heights now demand gives access to installation and maintenance work most competitors physically cannot perform, and rates in those classes reflect genuine scarcity rather than cycle. Turbine maintenance then generates recurring lifting across asset life. Replicating that position requires capital commitment ahead of demand.
SARENS

Risk: Concentration in one demand sector

Fleet weighted toward wind installation classes carries exposure to a single policy-driven sector, where subsidy changes, permitting delays, and interconnection queues all move installation volume independently of general construction. Diversification into industrial lifting requires different machines rather than merely different customers. Sector concentration cuts both ways with equal force.

Key Players

Mammoet
Sarens
Maxim Crane Works
Sanghvi Movers
Al Faris Group

Others

ALL Erection and Crane Rental
Bigge Crane and Rigging
Lampson International
Barnhart Crane and Rigging
Wasel
Nippon Express
Kanamoto
Boom Logistics
Uperio
Riwal
Fagioli
ALE Heavylift
Deep Sea Mooring
Sarilar Crane
Baldwins Crane Hire

Recent Developments

FEBRUARY 2025

Operator adopts revenue per asset reporting across fleet

A regional crane rental group replaced time utilisation with revenue per asset as its primary yard performance measure, after finding that busy depots were accepting work below rate floors to protect reported utilisation. The change was an internal management decision rather than any acquisition, joint venture, or partnership arrangement.
Signal: Changing the reported measure changes yard behaviour faster than any pricing policy does at depot level.
MAY 2025

Lifting provider adds crews to convert bare hire accounts

A crane rental operator recruited and trained additional certified crews specifically to convert existing bare hire customers to operated and maintained arrangements, citing customer difficulty staffing hired machines. The investment was organic recruitment rather than any acquisition, joint venture, or labour supply agreement with a third party.
Signal: Operator scarcity is converting bare hire demand into service demand without commercial persuasion being required at all.
SEPTEMBER 2025

Heavy crawler ordered ahead of wind installation programme

A lifting contractor ordered a very heavy crawler crane capable of current turbine hub heights, committing capital ahead of an installation programme rather than against contracted work already awarded. The order was direct equipment procurement rather than any joint venture, acquisition, or leasing arrangement with a manufacturer.
Signal: Capacity in scarce classes gets committed before demand, which is what sustains the rates through a cycle.

Capital, Crews and Heavy Transport

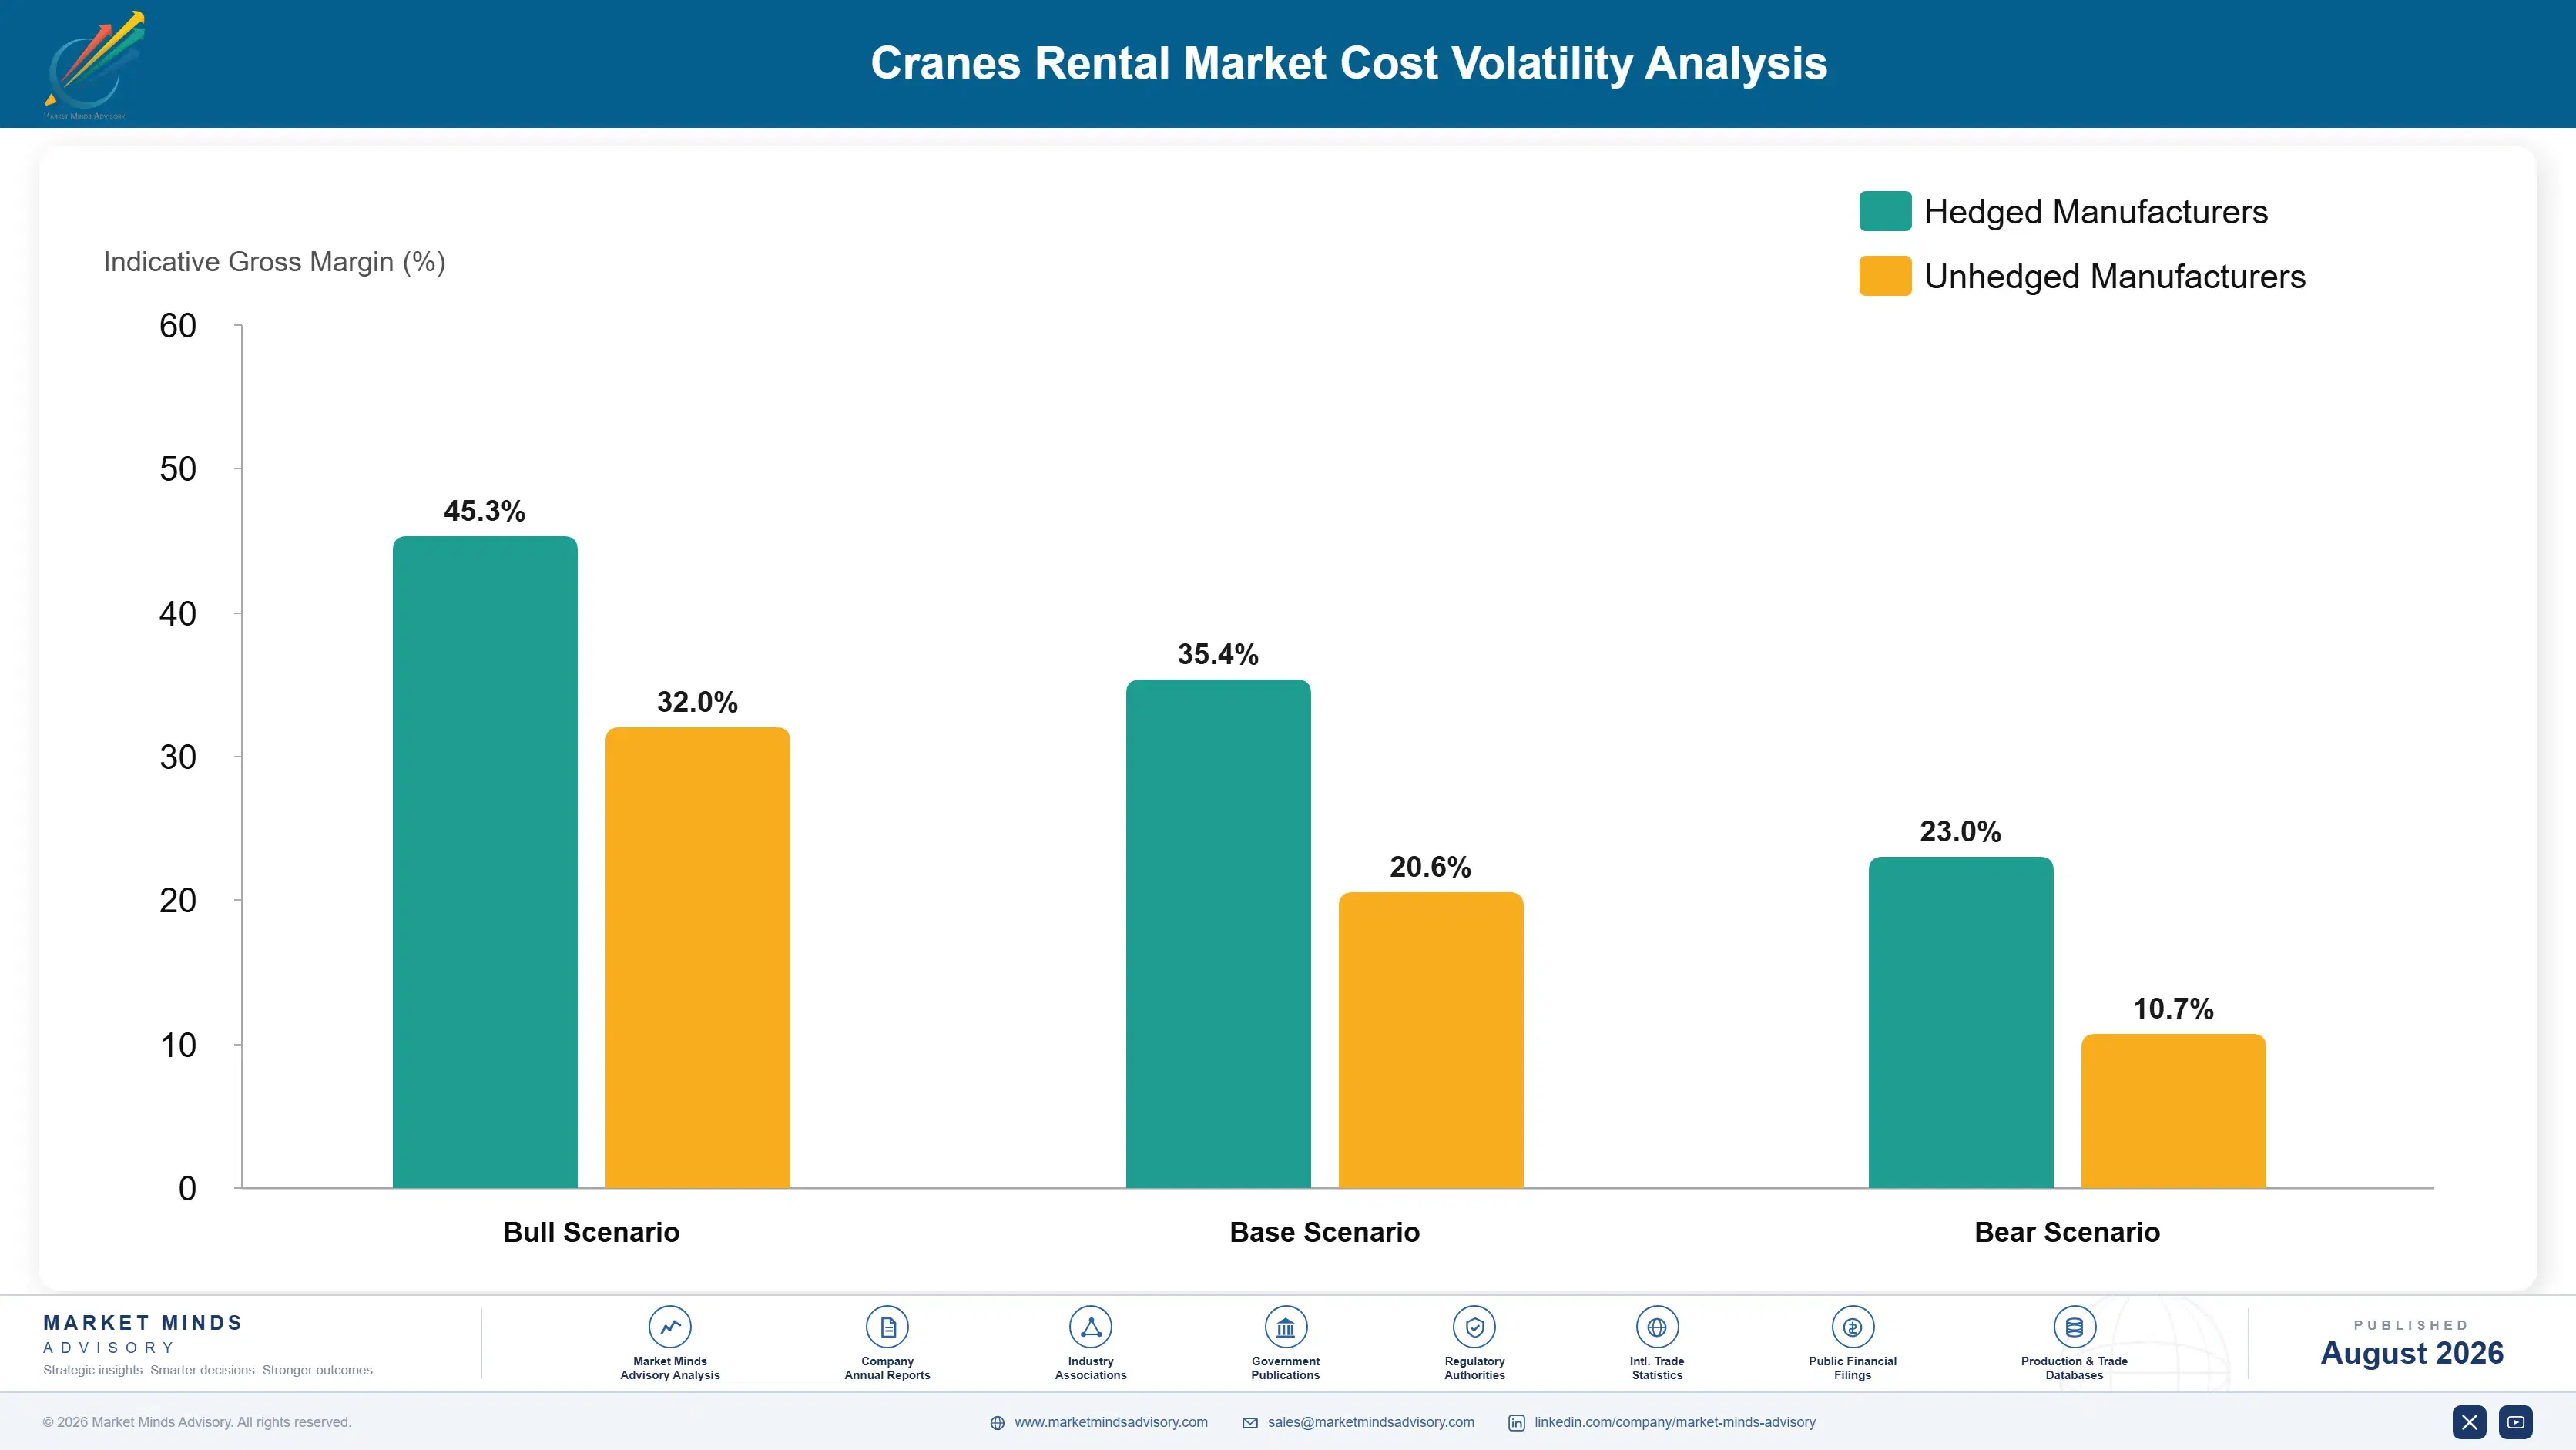
Fleet capital and depreciation carry roughly 34% of operating cost, financing a further 11% at current rates, operator and rigging crew wages about 23%, heavy transport and mobilisation near 15%, and maintenance, tyres, and parts the balance. Machine acquisition is global while every other input is local, which is why cost positions differ far more between yards in one country than between countries.
Interest rate increases from 2022 raised the cost of holding fleet materially, and several listed rental operators disclosed reduced capital expenditure and extended replacement cycles in annual filings covering the period. Average fleet age has risen toward eleven years as a direct consequence. Heavy transport cost rose alongside on driver scarcity and permit processing delays, and neither input has retreated since. Replacement decisions have been deferred rather than cancelled. Availability is beginning to suffer.

The competitive disadvantage mechanism runs through yard placement rather than through purchasing power. Mobilisation carries around 27% of job cost and rises steeply with distance, so an operator whose yards sit far from recurring industrial demand pays a permanent premium no procurement improvement can offset. Machine cost is nearly identical for everyone; geography is where the differences actually accumulate across a year.
cranes-rental-market-cost-volatility-analysis-1787301076280

Place yards against recurring industrial demand not construction

Mobilisation carries around 27% of job cost and rises steeply with distance, so yard location determines cost position more than fleet composition does. Refineries, petrochemical plants, and power stations generate recurring plannable lifting that construction sites do not. Operators siting yards against those assets earn steadier financial utilisation and pay less to reach the work throughout the year.

Extend machine life through structured maintenance not deferral

Financing cost has pushed average fleet age toward eleven years, and the difference between an eleven year old machine that has been maintained to programme and one that has simply been kept running shows up in availability rather than in book value. Structured component replacement costs less annually than the downtime and reputational damage a breakdown mid-lift produces.

Build crew capacity ahead of the operated service demand

Certified operator vacancy near 18% is the binding constraint on converting bare hire accounts into operated service, and the certification pathway takes years rather than months. Operators recruiting and training ahead of contracted demand hold capacity competitors cannot assemble quickly. Wage cost rises modestly against access to a segment growing at half again the market rate.

Portfolio Architecture for Margin Defence

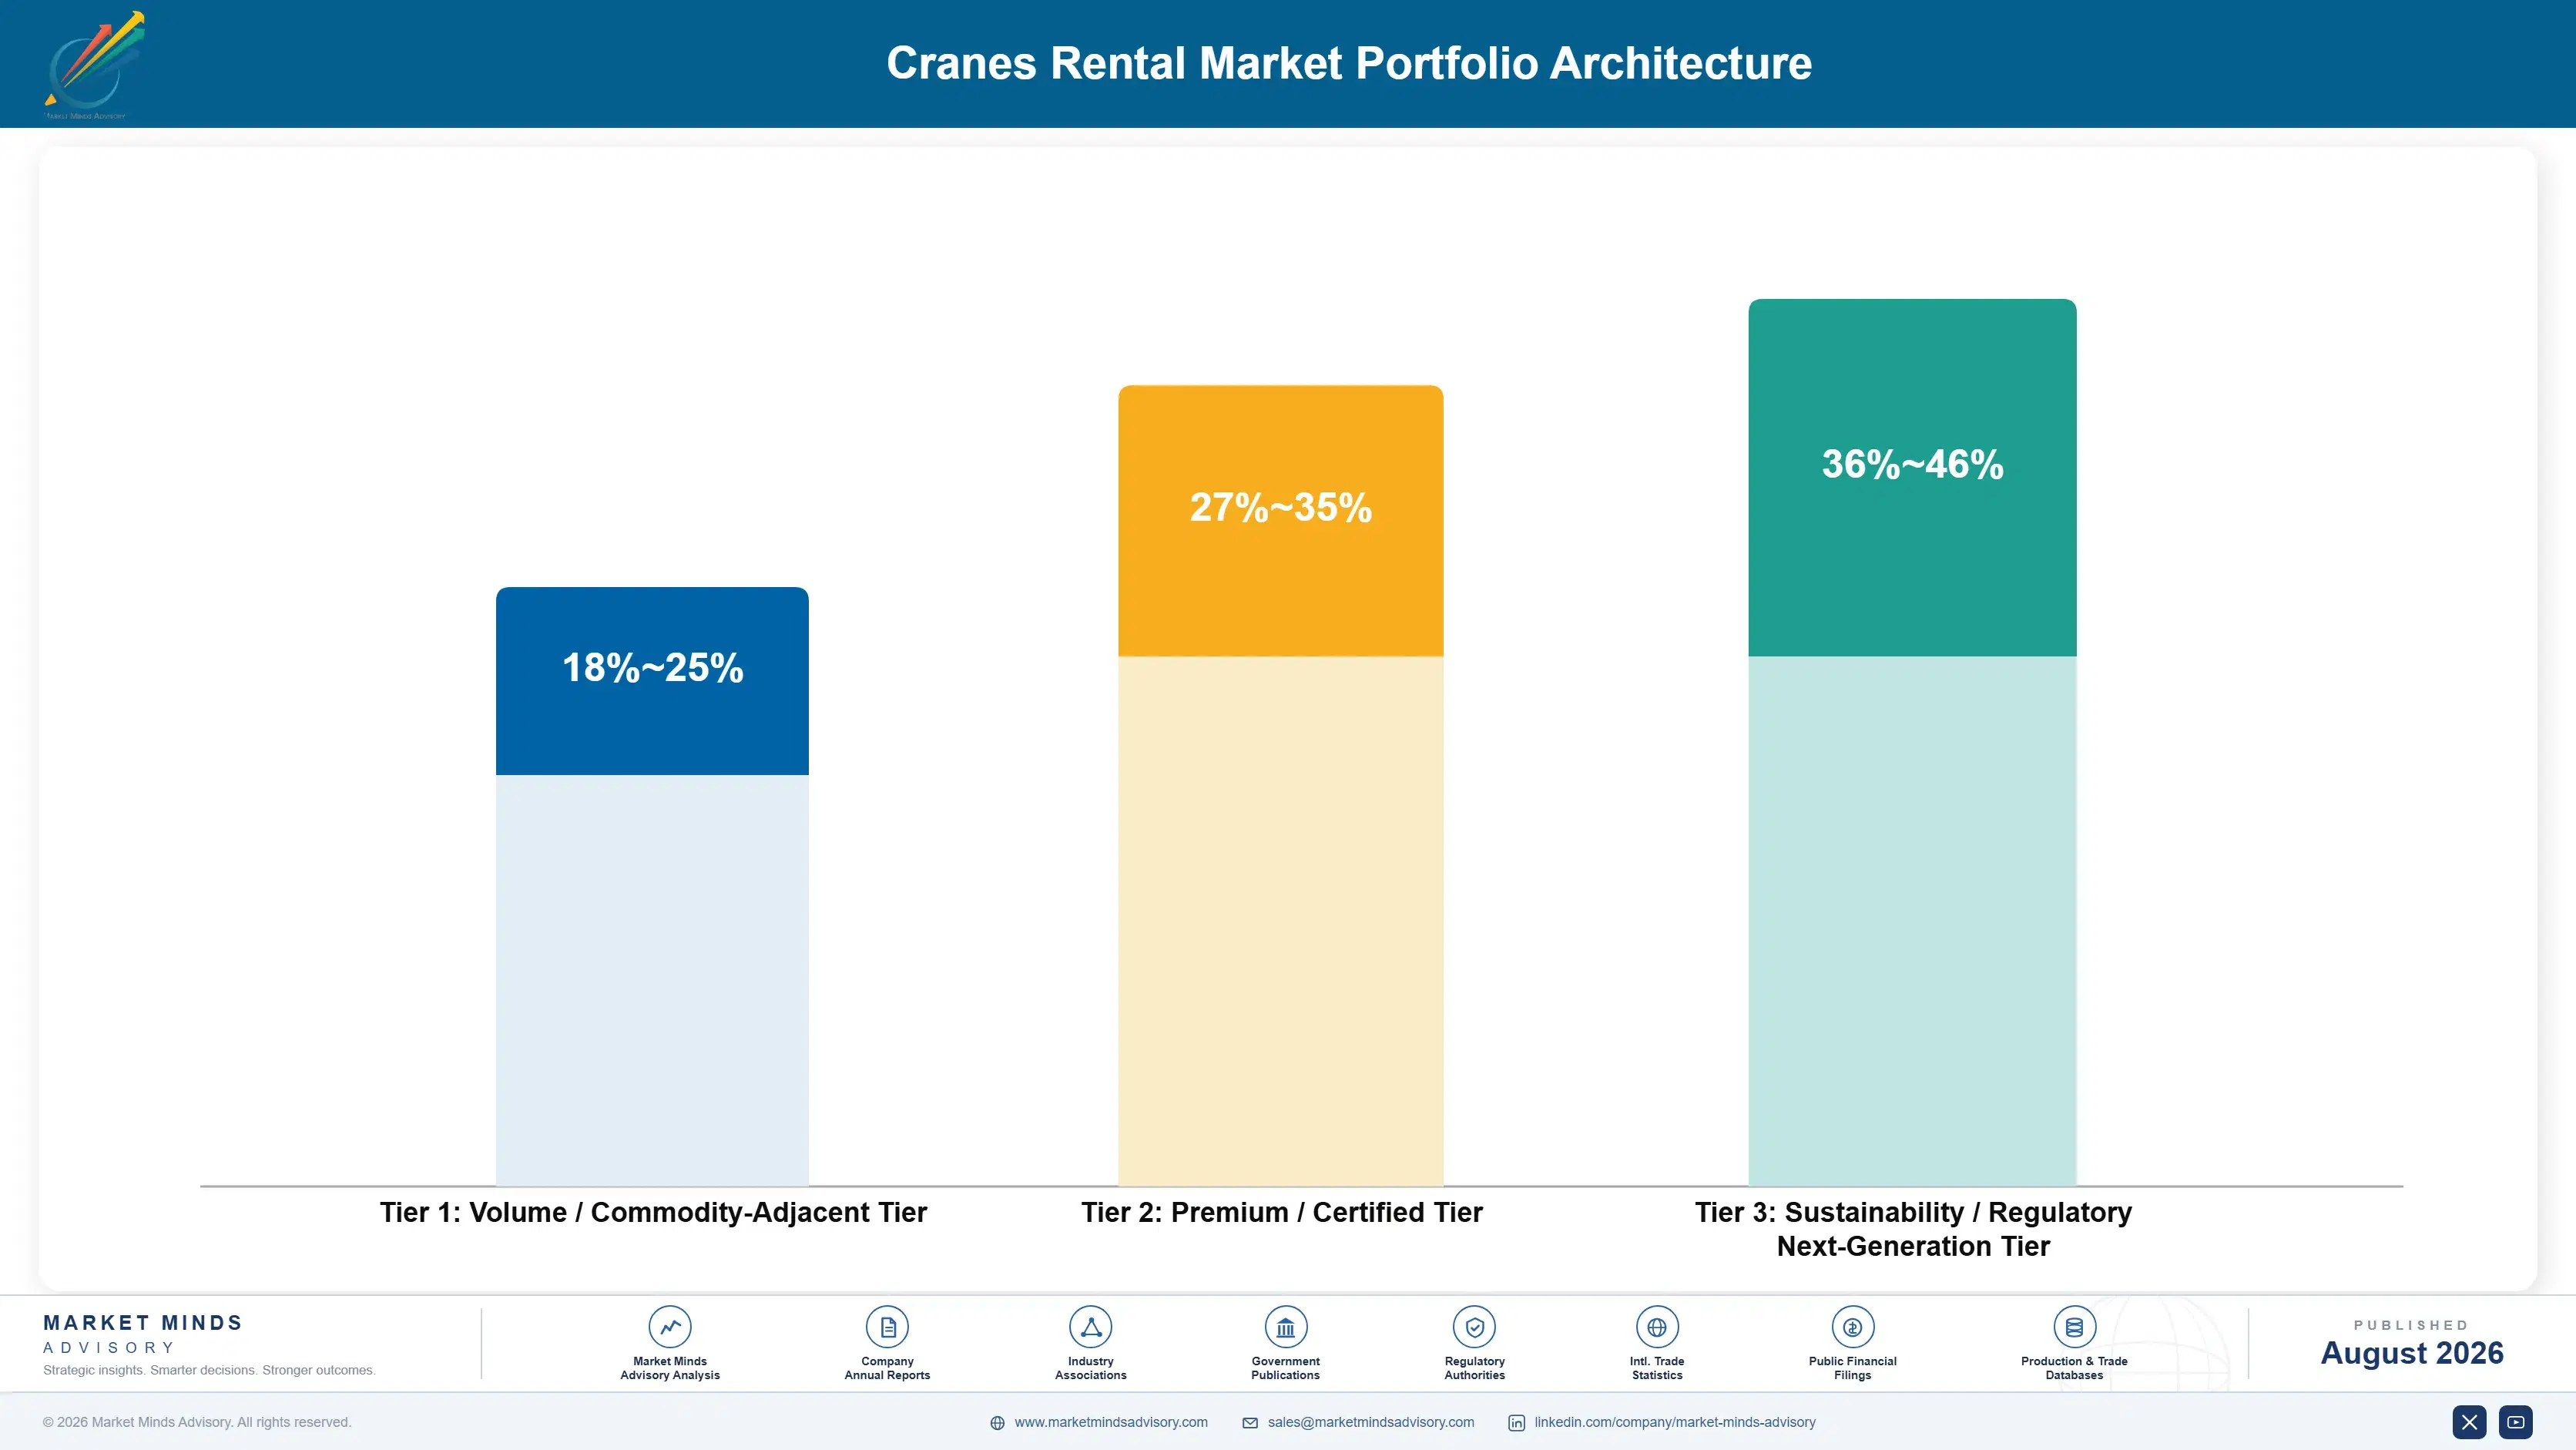
Three tiers describe this business and the spread is set by how easily a customer substitutes one supplier for another. Standard mobile classes sit at the bottom, where every regional operator owns similar machines and rate discipline fails first. Tower crane and mid-range crawler hire occupies the middle, tied by site duration and erection cost. Operated services and very heavy lift sit at the top, priced on capability and scarcity.
The tension is that standard fleet fills a yard and absorbs fixed cost while earning almost nothing, and heavy classes earn well but sit idle between projects. Operators concentrating entirely in standard machines report healthy time utilisation and poor returns. Those weighted toward heavy classes carry expensive assets through demand gaps that financing costs have made painful since 2022. Nearly every durable position runs both deliberately.

High-value pools concentrate where the customer is buying an outcome rather than a machine. Complex lifts awarded on method statements are the clearest case, since rate barely enters the evaluation. Industrial framework lifting pools value similarly, because turnaround calendars are planned years ahead and priced above spot. Both pools survive a construction downturn intact.

Volume / Commodity-Adjacent Tier

Standard mobile and all-terrain crane hire, where every regional operator owns similar machines and switching costs a customer nothing. Rate discipline fails here first, and financial utilisation sits well below the reported time figure.
Gross Margin: 18-25%

Premium / Certified Tier

Tower crane hire and mid-range crawler work, tied by site duration and the cost of erecting or dismantling equipment mid-project. Switching is expensive enough during a build that rates hold considerably better than in mobile classes.
Gross Margin: 27-35%

Sustainability / Regulatory / Next-Generation Tier

Operated and maintained lifting plus very heavy crawler work serving wind installation and industrial vessel replacement. Best margin by a clear distance, priced on scarcity and engineering capability rather than on any comparable machine day rate.
Gross Margin: 36-46%
cranes-rental-market-portfolio-architecture-1787301076774

High-value Sub-segments and Strategic Watch-out

Operated And Maintained Lifting

Fastest growth at 9.6%, exactly 1.50 times the market rate, priced on capability rather than machine class so procurement cannot compare it directly. Operator vacancy near 18% is converting bare hire demand into service demand without any commercial persuasion. Accumulated site knowledge makes these relationships durable.
Gross Margin: 36-46%

Very Heavy Crawler Classes

Strong growth at 8.2% where turbine hub heights exceed what most fleets can physically reach and scarcity rather than cycle sets rates. Capital must be committed ahead of demand, and gaps between projects have become expensive since 2022. Turbine maintenance then generates recurring lifting demand.
Gross Margin: 36-46%

Standard Mobile Class Fleet

The volume core, filling yards and absorbing fixed cost while earning very little, because interchangeable machines mean one operator discounting sets the regional rate immediately. Contractor ownership keeps leaking predictable demand out of rental here. Reported utilisation looks healthy while contribution stays poor. Rate floors are the only available defence.
Gross Margin: 18-25%

Distant Work Priced On Day Rate

The strategic watch-out, since mobilisation carries roughly 27% of job cost and rises steeply with distance while permits and assembly crews do not scale down. Absorbing it into a day rate produces losses hidden inside healthy utilisation figures. Defined radius limits by machine class fix it.
Gross Margin: 18-25%

Projects, Turnarounds and Frameworks

Revenue arrives in two rhythms that behave nothing alike. Project lifting is lumpy, tendered, and priced under competitive pressure, with long gaps between awards in the heavier classes. Industrial maintenance lifting follows turnaround calendars planned years ahead, arrives regardless of construction conditions, and is frequently contracted under multi-year frameworks that price above spot. The second is worth considerably more per machine hour and it is far scarcer.
Stickiness depends on how much of the job the provider actually owns. An operated service relationship with trained crews and accumulated site knowledge is difficult to displace, since a competitor must supply crews from a market with vacancy near 18%. Tower crane hire sticks for the duration of a build because erecting a replacement mid-project is expensive. Standard mobile hire sticks not at all and is rebid job by job on price.

Buyer profiles shifted as site safety obligations tightened and operator supply thinned. The earlier buyer was a site manager hiring a machine by the day. The current one is more often a procurement function contracting a lifting outcome under a framework, with method statements and crew certification evaluated first.
cranes-rental-market-end-use-penetration-index-1787301077266

What We Would Tell a Board

These are among the four positions where our research anticipates prominent divergence between winners and laggards over the coming forecast period. Each is grounded in the demand model, the regulatory perimeter, and the announced capacity pipeline.
01 / UTILISATION MEASUREMENT REFORM

Stop reporting the number that hides the problem

Time utilisation near 71% measures how often a crane left the yard and reveals nothing about what it earned, while financial utilisation around 43% measures revenue against capacity at published rates. Yard managers rewarded on the first will take work covering diesel and driver, so the fleet looks busy while the business earns almost nothing at all. Changing the reported measure changes depot behaviour within a single quarter, and it costs nothing beyond the discipline required to publish it honestly.
02 / MOBILISATION PRICING DISCIPLINE

Absorbed transport is where the losses actually hide

Transport and rigging carry around 27% of total job cost and that share rises steeply with distance, because permits, route surveys, escorts, and assembly crews simply do not scale down for a shorter job. Operators absorbing mobilisation into a headline day rate to win distant work routinely take on jobs that lose money before the hook moves anything at all. Quoting mobilisation as a separate line loses some tenders and removes the losses currently hidden inside apparently healthy utilisation figures.
03 / SERVICE CONVERSION STRATEGY

Sell the lift, because the machine is a commodity

Operated and maintained lifting grows at 9.6% against 6.4% for the market and prices on capability rather than machine class, which makes direct rate comparison against bare hire almost impossible for any procurement team. Operator vacancy near 18% means many customers can no longer staff hired machines regardless of what they would prefer. Converting an existing account costs a crew and a lift planner rather than any capital at all, and it removes the relationship from the price contest entirely.
04 / FLEET CLASS CONCENTRATION

Buy the machines your competitors cannot afford

Standard mobile classes are where rate discipline collapses first of all, because every regional operator owns broadly similar equipment and switching costs a customer absolutely nothing when the machines are interchangeable. Very heavy crawlers serving wind installation and industrial vessel replacement are owned by very few operators and they price on genuine scarcity instead. Capital directed toward genuinely constrained classes earns financial utilisation well above the 43% sector average, and it survives a construction downturn considerably better than standard fleet does.

Engagement Snapshot From the Field

A live engagement with an industry participant carrying material or product regulatory and market exposure ahead of a defining policy shift, showing how our research translates into a defensible multi-year portfolio strategy.
MARKET MINDS ADVISORY · CLIENT ENGAGEMENT SUMMARY
Cranes Rental Producer Strategic Portfolio Review and Transition Roadmap 2026·Investment Scenario on Cranes Rental Exposure Evaluation 2025-26
CLIENT PROFILE
A regional crane rental operator with approximately 195 million dollars in annual revenue (client-reported, unverified by MMA), running mobile, all-terrain, and mid-range crawler fleet from eleven yards across two countries. Reported time utilisation was strong across every depot, operating margin had declined for three consecutive years, and management had proposed additional fleet investment to improve fixed cost absorption.
STRATEGIC CHALLENGE
The board could not reconcile healthy reported utilisation with deteriorating returns, and was reluctant to approve further fleet capital until that contradiction was explained. Management attributed the margin decline to regional rate competition and viewed additional machines as the route to defending share against smaller local operators. Depot performance varied widely and unexplained.
MMA APPROACH
We rebuilt performance by machine and by job, calculating revenue against theoretical capacity at published rates rather than days deployed. Mobilisation cost was allocated to individual jobs rather than absorbed into overhead. Rate achievement was compared across depots and machine classes, and the operated service margin was benchmarked against bare hire across the same customer base.
KEY FINDINGS
  1. Financial utilisation across the fleet sat far below reported time utilisation, and the gap was widest in exactly the depots reporting the strongest activity figures.
  2. Jobs beyond a definable travel radius were loss-making once mobilisation was allocated properly, and those jobs were concentrated in the highest-utilisation depots.
  3. Standard mobile classes accounted for most deployed days and a small minority of contribution, while mid-range crawlers earned far better rates. Fleet mix explained much of it.
  4. Operated service work carried substantially better margin than bare hire on identical machines, and it represented a small share of total revenue.
CLIENT PROFILE
A regional crane rental operator with approximately 195 million dollars in annual revenue (client-reported, unverified by MMA), running mobile, all-terrain, and mid-range crawler fleet from eleven yards across two countries. Reported time utilisation was strong across every depot, operating margin had declined for three consecutive years, and management had proposed additional fleet investment to improve fixed cost absorption.
STRATEGIC CHALLENGE
The board could not reconcile healthy reported utilisation with deteriorating returns, and was reluctant to approve further fleet capital until that contradiction was explained. Management attributed the margin decline to regional rate competition and viewed additional machines as the route to defending share against smaller local operators. Depot performance varied widely and unexplained.
MMA APPROACH
We rebuilt performance by machine and by job, calculating revenue against theoretical capacity at published rates rather than days deployed. Mobilisation cost was allocated to individual jobs rather than absorbed into overhead. Rate achievement was compared across depots and machine classes, and the operated service margin was benchmarked against bare hire across the same customer base.
KEY FINDINGS
  1. Financial utilisation across the fleet sat far below reported time utilisation, and the gap was widest in exactly the depots reporting the strongest activity figures.
  2. Jobs beyond a definable travel radius were loss-making once mobilisation was allocated properly, and those jobs were concentrated in the highest-utilisation depots.
  3. Standard mobile classes accounted for most deployed days and a small minority of contribution, while mid-range crawlers earned far better rates. Fleet mix explained much of it.
  4. Operated service work carried substantially better margin than bare hire on identical machines, and it represented a small share of total revenue.
RECOMMENDED STRATEGY
Phase 1: Phase 1 (months one to six): replace time utilisation with revenue per asset as the depot measure, and set rate floors by class. Phase 2: Phase 2 (months six to eighteen): price mobilisation separately, define travel radius limits by machine class, and decline work beyond them. Phase 3: Phase 3 (months eighteen to thirty-six): redirect fleet capital toward crawler classes and recruit crews to convert bare hire accounts.
OUTCOME
The fleet investment was deferred. Depot behaviour changed within two quarters of the reporting change, deployed days fell while contribution rose, and margin recovered materially without any additional machines being purchased at all (client-reported, unverified by MMA). Rate floors held across every depot afterward. Crawler capital was approved separately.

Frequently Asked Questions

Foundational context covering the market sizes, CAGR, scope, country, region and competition that inform every finding below. This section is provided to cover basics and most often pre-purchase conversations, answered from the MMA Primary Research Dataset.

What is the current size of the Cranes Rental Market?

The market is valued at USD 58.0 billion in 2025, rising to USD 61.71 billion in 2026. Scope covers commercial rental of lifting equipment with or without operators, not equipment sales or aerial work platforms.

How large will the Cranes Rental Market be by 2036?

MMA forecasts USD 114.76 billion by 2036, an increase of USD 53.05 billion over the 2026 base. That represents an expansion multiple of 1.86 times across the forecast period.

What is the CAGR for the Cranes Rental Market 2026 to 2036?

The base case CAGR is 6.4%, with a bull case of 7.6% and a bear case of 5.2%. The historical rate from 2020 to 2025 was 5.2%, held back by uneven construction recovery.

Which segment is growing fastest?

Operated and maintained lifting services at 9.6%, exactly 1.50 times the market rate. Customers increasingly want a completed lift rather than a machine, and operator vacancy near 18% accelerates that shift.

Who are the major companies in the Cranes Rental Market?

Mammoet, Sarens, Maxim Crane Works, Sanghvi Movers, and Al Faris Group lead on fleet capacity in tonne-metres. The top five hold only 21%, because lifting is a local business everywhere.

Which country is growing fastest?

India at 8.8%, where metro rail, highway, port, and industrial plant construction are all scaling at once. Fleet ownership is fragmented and capable operators win on availability rather than on price.

Report Segmentation Architecture

The full report scope spans multiple orthogonal segmentation dimensions, with cross-tabulated demand data provided for each dimension pair. Coverage extends further to regional breakdowns, trend trajectories, and the competitive detail needed to support segment-level decision-making.

By Equipment Class And Service Arrangement

  • Mobile And All-Terrain Crane Rental
  • Crawler Crane Rental For Heavy Lift
  • Tower Crane Rental For Building Construction
  • Operated And Maintained Lifting Services
  • Specialised Heavy Lift And Transport Projects

By End-Use Industry

  • Building And Commercial Construction
  • Infrastructure, Rail And Ports
  • Energy, Refining And Petrochemicals
  • Wind Installation And Renewables
  • Mining And Heavy Industrial Maintenance

By Commercial Model

  • Bare Hire By Day Or Week
  • Operated Hire With Certified Crew
  • Multi-Year Industrial Framework Agreements
  • Lump Sum Project Lifting Contracts
  • Long-Term Site Hire For Tower Cranes

By Region

  • East Asia
  • North America
  • Western Europe
  • South Asia and Pacific
  • Latin America
  • Middle East and Africa
  • Eastern Europe

Scope, Methodology, and Coverage

Every figure in this report is reproducible from documented input assumptions. The scope below maps the historical period, the forecast horizon, the segmentation dimensions, and the countries covered, alongside the underlying primary and qualitative methodology.
Historical Period
2020 to 2025
Forecast Period
2026 to 2036
Base Year
2025 (USD billions; MMA Primary Research Dataset, August 2026)
Market Definition
This market comprises commercial rental of lifting equipment to third parties, with or without operators, measured at rental and lifting service revenue rather than at equipment value. Coverage spans mobile and all-terrain crane rental, crawler crane rental for heavy lift applications, tower crane rental for building construction, operated and maintained lifting services including crew and lift planning, and specialised heavy lift and transport projects. Sale of new or used cranes, aerial work platforms, telehandlers and scissor lifts, forklift and warehouse handling equipment, permanent overhead and gantry cranes installed within buildings, marine and port cranes fixed to structures, and rigging hardware sold independently fall outside scope.
Quantitative Units
USD billions (current prices); fleet capacity in tonne-metres; financial and time utilisation rates; revenue per asset by machine class
Segmentation Dimensions
By Equipment Class And Service Arrangement; By End-Use Industry; By Commercial Model; By Region
Regions Covered
East Asia, North America, Western Europe, South Asia and Pacific, Latin America, Middle East and Africa, Eastern Europe
Countries Covered
China, Japan, South Korea, United States, Canada, Mexico, Germany, Netherlands, France, United Kingdom, Belgium, Denmark, India, Australia, Singapore, Brazil, Chile, Peru, Saudi Arabia, United Arab Emirates, Qatar, South Africa, Poland, Czechia, and additional markets relevant to this sector
Key Companies Profiled
Mammoet, Sarens, Maxim Crane Works, Sanghvi Movers, Al Faris Group, ALL Erection and Crane Rental, Bigge Crane and Rigging, Lampson International, Barnhart Crane and Rigging, Wasel, Nippon Express, Kanamoto, Boom Logistics, Uperio, Riwal, Fagioli, ALE Heavylift, Deep Sea Mooring, Sarilar Crane, Baldwins Crane Hire
Quantitative Methodology
Primary survey, n=3,800 respondents, Q4 2025, six countries; demand-side model with trade association cross-validation
Qualitative Methodology
47 expert interviews, Q4 2025; applied to validate demand model assumptions, identify emerging dynamics, and assess competitive positioning
Report Format
PDF and XLSX data workbook (Word format preview document)
Publisher
Market Minds Advisory
Report Code
MMA-2026-CON-609
Published
August 2026
Contact
sales@marketmindsadvisory.com | www.marketmindsadvisory.com

Purchase the full Cranes Rental Market Report (2026 to 2036).

The full report sizes crane rental across five equipment and service classes, five end-use industries, five commercial models, and seven regions, with financial utilisation reported separately from time utilisation throughout. Mobilisation cost is allocated by travel distance and machine class, since absorbing it into day rates is where most loss-making work in this sector hides. Operator availability is assessed against operated service conversion potential by market. Competitive profiling covers twenty companies on fleet capacity in tonne-metres, with heavy class supply constraints analysed against wind installation demand.
Financial utilisation reported separately from time utilisation throughout
Mobilisation cost allocated by travel distance and machine class
Operator availability assessed against operated service conversion potential
Heavy class supply constraints analysed against wind installation demand
Industrial maintenance lifting separated from construction driven demand
Contractor ownership leakage tracked across standard equipment classes

Built For The People Who Decide

From boardroom strategy to bench-side execution, this report is read cover-to-cover by leaders shaping the next decade of their industry, turning demand scenarios, market dynamics and valuation benchmarks into decisions.
CXOs/ Presidents/ VPs/ Managers
M&A and Corporate Development
Strategy Teams and R&D Heads
Procurement and Product Directors
Regulatory and Compliance Leaders
Investor Relations and Equity Analysts