Market Minds Advisory
Counter Ied Market

Counter Ied Market: Counter IED Market: Countermeasure Functions, Threat Geography and Reactive Procurement 2026 to 2036

Procurement here follows casualty statistics rather than threat assessment, so demand surges after an incident and collapses when attention moves elsewhere. Capacity built at the peak sits idle for a decade.

Lead Analyst

Published

September 2026

Make Smarter Decisions with Customized Research Insights

Request a free sample report and evaluate market opportunities, growth trends, and competitive dynamics relevant to your business needs.

2025 MARKET VALUE$2.9BMarket Size 2025
2036 FORECAST VALUE$6.0BBase Case , 2026 to 2036
CAGR 2026 TO 20366.8 %Bull 8.0% / Bear 5.6%
INCREMENTAL OPPORTUNITY$2.9BNet 10- year value creation
EXPANSION MULTIPLE1.93x2036 value over 2026 base
Strategic Levers
M&A Pipeline
Regional Outlook
Country Rankings
Competitive Intelligence
Segmental Deep-dive
Call-Us : 91 93563 13602

Executive Snapshot and Market Trajectory.

This equipment is bought reactively and that shapes the whole industry serving it. Procurement follows casualty figures rather than threat assessment, arriving in surges after incidents and collapsing when attention moves. Capacity built at a peak then sits idle for years. Several suppliers did not survive the last one.
The market reaches USD 3.10 billion in 2026 and USD 5.99 billion by 2036, a 1.93 times expansion at 6.8% across the forecast period. Robotic and unmanned ground systems grow at 10.2%, half again the market rate of 6.8%, because the commercial argument is expendability rather than capability. Threat geography bears no relationship at all to economic geography in this market. Recorded procurement is a poor measure of what is actually in service.
Five suppliers hold 47% of procurement revenue, split between defence primes carrying counter-IED as one line among many and specialists who do very little else. Leonardo, L3Harris and Elbit Systems hold prime positions alongside far larger businesses. Chemring Group and Teledyne FLIR built specialist positions in countermeasures and robotics, carrying far more cyclical risk and far more product depth at the same time.
Market Definition
This report covers equipment and systems procured to detect, defeat and mitigate improvised explosive devices: robotic and unmanned ground systems, standoff detection systems, electronic countermeasure jammers, route clearance vehicles and systems, protective equipment and blast mitigation, and explosive ordnance disposal tools. It excludes conventional munitions and weapons, general armoured vehicles without route clearance role, aviation platforms, intelligence software, and civil aviation security screening equipment.
Base Year Value
$2.9B in 2025 (MMA Primary Research Dataset, September 2026)
Forecast Period
2026 to 2036, eleven discrete annual values
CAGR
6.8% base case. Bull 8.0%. Bear 5.6%.
Fastest Growth Segment
Robotic And Unmanned Ground Systems: 10.2% CAGR
Fastest Growth Country
Poland: 12.4% CAGR
Fastest Growth Region
South Asia and Pacific: 8.8% CAGR
Largest Region
North America: 28% of 2025 global value
Market Leaders
Leonardo, Chemring Group, Teledyne FLIR, L3Harris Technologies and Elbit Systems lead on counter-IED equipment and system procurement revenue. Source: MMA Analysis.
Primary Survey
n=3,800 procurement and R&D decision-makers, Q4 2025, six countries
Methodology
Demand-side build-up, cross-validated against public data, 47 expert interviews

Counter Ied Market Forecast Scenarios

counter-ied-market-size-forecast-scenario-1789991951652
Between 2020 and 2025 the category compounded at 5.7%, recovering from a decade of decline that followed the drawdown of the largest deployments this equipment was ever bought for. Programme funding fell sharply after 2014 and several suppliers exited or consolidated. Renewed demand arrived from a completely different direction, driven by conditions in Eastern Europe, the Sahel and unresolved contamination across previous conflict areas.
The base case holds 6.8% on three mechanisms. Unmanned ground systems keep displacing manual approaches because expendability rather than capability is the argument, and operational attrition near 22% annually produces recurring replacement demand. Explosive remnant clearance across previously contested territory is a decades long programme with humanitarian funding behind it. And European procurement is rebuilding capability reduced substantially after 2014, across detection, robotics and clearance together rather than any single equipment type.
The bull case at 8.0% assumes standoff detection reaches ranges that change tactical practice rather than marginally improving it, which would justify fleet wide replacement. The bear case at 5.6% is attention moving elsewhere: this category has collapsed before when casualty figures fell out of the news, and nothing about the funding mechanism has changed since the last time it happened.

Bought When Somebody Is Counting Casualties

Nothing about this market behaves like a normal defence category, because it is funded reactively. Procurement responds to casualty figures rather than to threat assessment, which produces surges of urgent requirement funding and then long periods of nothing. Even urgent programmes take around 34 months to reach users. Suppliers who expanded during the last peak spent a decade carrying that capacity.
TOP FIVE CONCENTRATION47%Concentrated among defence primes and specialist countermeasure suppliers together
STANDOFF DETECTION RANGE45 metresWorking distance achieved by current vehicle mounted detection systems
ROBOT OPERATIONAL ATTRITION22%Unmanned ground systems lost or damaged beyond repair annually
PROGRAMME PROCUREMENT CYCLE34 monthsFrom urgent requirement statement to equipment reaching actual users
DONATED EQUIPMENT SHARE31%Systems reaching high threat areas through transfer rather than purchase
DUAL USE REVENUE SHARE26%Supplier income from hazardous materials and civil applications
Threat geography and economic geography have almost no relationship here, which is why conventional regional models misread this market entirely. Demand sits where devices are actually being used: the Sahel, Iraq, Syria, Somalia, Ukraine and its neighbours, and parts of South Asia. Most of those places do not fund their own procurement, and around 31% of equipment reaching the highest threat areas arrives through transfer rather than purchase.
Robotics changed the economics rather than the capability, which most analysis of this market misses. An unmanned ground system does not dispose of a device better than a trained operator does. It is expendable, and that reframes the purchase from a capability decision into a risk transfer decision. Attrition near 22% annually would alarm any other category and is the point of this one.
"Somebody asks every few years whether the robots have got good enough to replace the operator. They have not and they do not need to. The argument was never capability. You can send a robot into something you would not send a person into, and everything follows from that."
Director, Defence Systems and Protective Technologies Practice · MMA Technology Practice · September 2026

Market Trends

Expendability Rather Than Capability Drives Robot Adoption

An unmanned ground system does not handle a device better than a trained operator, and the vendors claiming otherwise are answering the wrong question entirely. The commercial argument is that it can be sent where a person cannot be, which converts a capability purchase into a risk transfer decision and moves the price ceiling from what the machine does to what an avoided casualty is worth. Operational attrition near 22% annually is consequently a feature rather than a defect, and it produces recurring replacement demand that no other segment here generates.
Market Impact: Poland compounds at 12.4% annually
Dual Use Revenue Is What Survives The Downturns

This category collapsed after 2014 and several suppliers exited entirely, because a business dependent on reactive procurement has no revenue when attention moves elsewhere. Around 26% of supplier income now comes from hazardous materials response, civil bomb disposal, nuclear decommissioning and industrial inspection applications using substantially the same equipment. That revenue is smaller per unit and considerably steadier, and it kept several specialists alive through the last trough. Suppliers without it are exposed to a funding cycle nobody in the industry controls or predicts. Nothing about the funding mechanism has changed since then.
Market Impact: Detection compounds at 8.9% annually

Market Opportunities and Growth Drivers

European Procurement Is Rebuilding Reduced Capabilities

European counter-IED and explosive ordnance disposal capability was reduced substantially after 2014 as deployments ended and budgets moved elsewhere, and rebuilding it is now a stated priority across several national programmes. Poland compounds at 12.4%, ahead of any other country, on capability development that spans detection, robotics and clearance together rather than any single equipment type. Baltic and Nordic procurement follows comparable logic. This is capability restoration rather than expansion, which makes it more predictable than the reactive surges that characterise the rest of this market. Restoration is easier to plan against than any surge.
Market Impact: Cycles turned after 2014 sharply

Explosive Remnant Clearance Is A Decades Long Programme

Territory contested in recent years carries contamination that will take decades to clear, and that work is funded through humanitarian and reconstruction budgets rather than through defence procurement. The equipment overlaps substantially with military counter-IED tooling: detection systems, robotic handling and protective equipment all transfer directly. Standoff detection compounds at 8.9% partly on this demand, which behaves nothing like defence spending because it is planned across long horizons and funded by donors rather than by ministries responding to incidents. Donors rather than ministries fund it, on horizons measured in decades.
Market Impact: About 31% arrives as transfer

Market Restraints and Challenges

Reactive Funding Makes Capacity Planning Nearly Impossible

Procurement here responds to casualty figures rather than to threat assessment, producing urgent requirement surges followed by years of very little. The root cause is that this equipment protects against a threat that is politically visible only while people are being injured by it, and attention moves faster than any industrial base can adjust. Commercially this destroyed several suppliers after 2014 who had built capacity for a peak. Mitigation runs through dual use revenue, flexible manufacturing and deliberately avoiding capacity commitments during any surge. Refusing to build during a surge is the hardest discipline here.
Market Impact: Attrition runs near 22% yearly

Highest Threat Areas Fund The Least Procurement

Around 31% of equipment reaching the highest threat areas arrives through donation, transfer or partner nation programmes rather than through purchase by the users themselves. The root cause is that device use concentrates in places with limited defence budgets, so the threat and the money sit in different countries entirely. Commercially this means demand signals from operations do not translate into orders from the operators. Mitigation runs through building relationships with donor programmes and transfer authorities rather than only with end users. Operational demand signals never become orders from the operators themselves.
Market Impact: Dual use supplies 26% of income
3 additional market trends, 4 additional growth drivers, and 2 additional restraints and challenges are covered in the full report. Contact sales@marketmindsadvisory.com to access the complete intelligence.

Segment CAGR and Growth Architecture

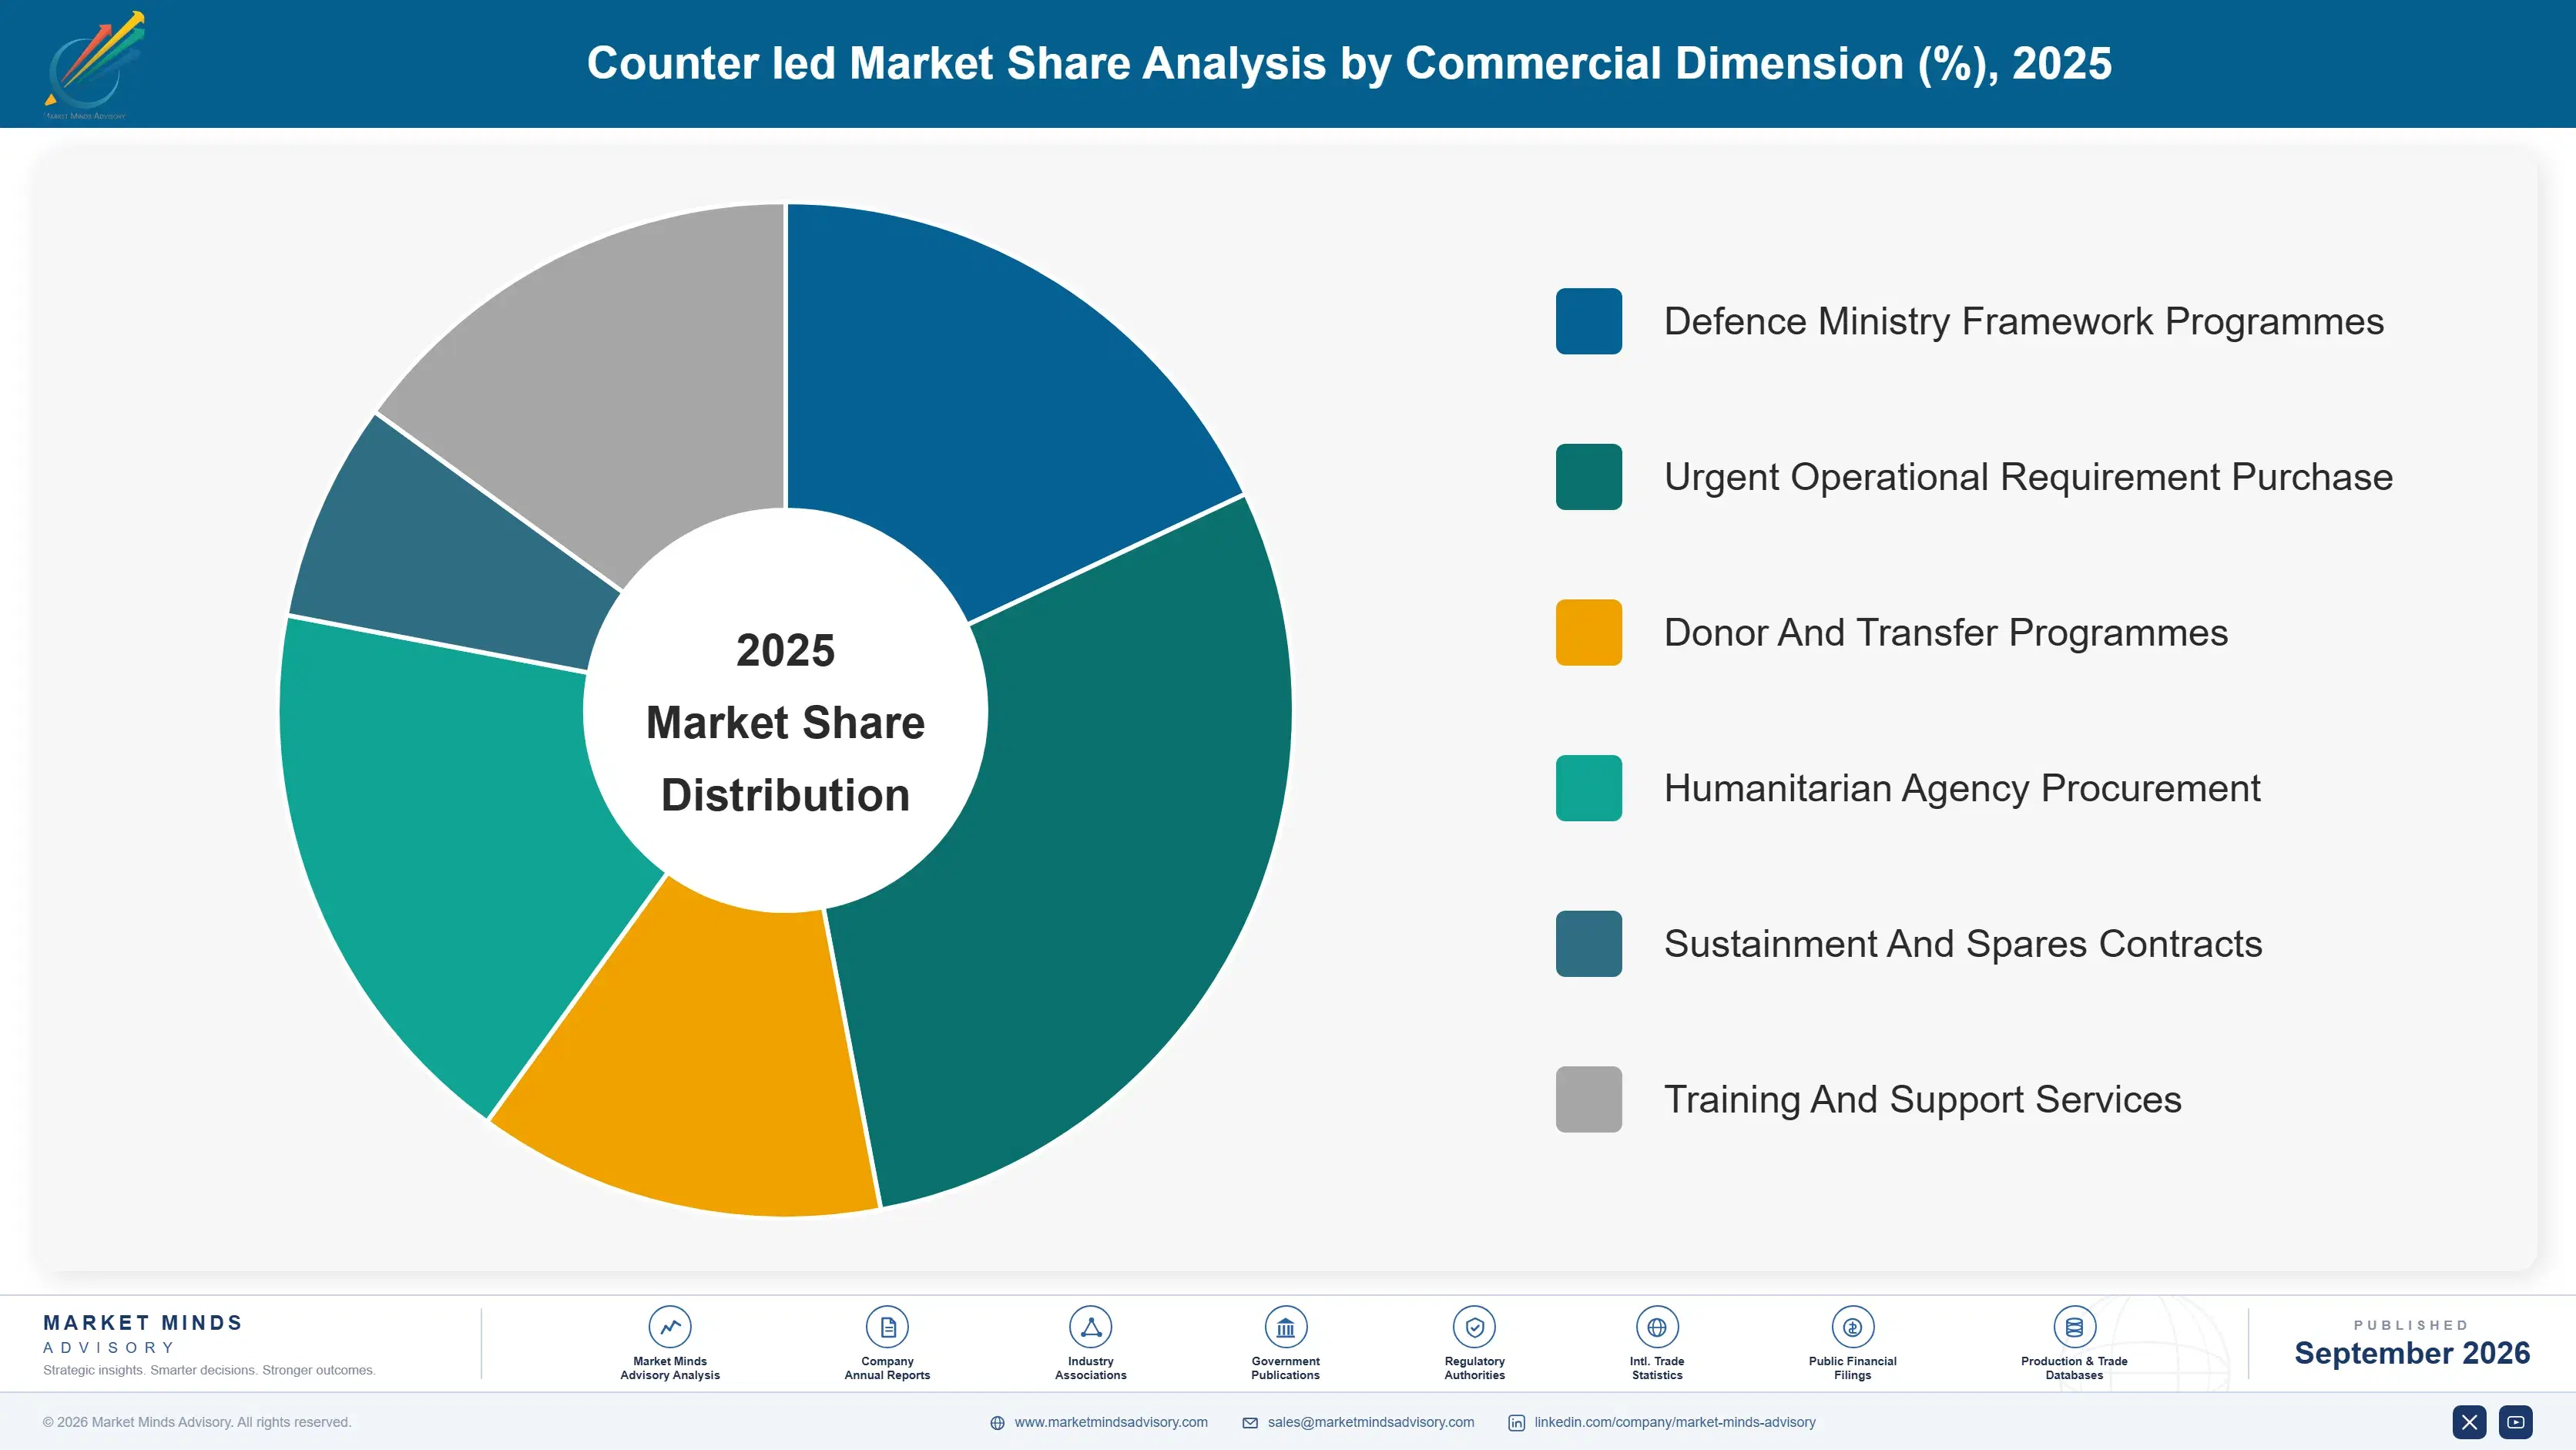
Segmentation follows countermeasure function, since what a system does determines who procures it, how it is funded and whether it has any application outside defence. Six functions cover the market: robotic and unmanned ground systems, standoff detection, electronic countermeasure jammers, protective equipment and blast mitigation, explosive ordnance disposal tools, and route clearance vehicles. Procurement route is a separate dimension.
counter-ied-market-market-share-analysis-1789991952209

Robotic And Unmanned Ground Systems

Robotic and unmanned ground systems grow at 10.2%, half again the market rate of 6.8%, and the reason is expendability rather than any capability advantage. A robot does not handle a device better than a trained operator does, and vendors claiming otherwise are answering a question nobody asked. It can be sent where a person cannot, which converts the purchase from a capability decision into a risk transfer decision and moves the price ceiling entirely. Operational attrition near 22% annually would be alarming in any other equipment category and here it is the point, generating recurring replacement demand nothing else in this market produces. Vendors keep engineering against that logic.
CAGR 10.2%

Standoff Detection Systems

Standoff detection compounds at 8.9% on two funding sources that behave nothing alike. Military procurement buys vehicle mounted systems achieving around 45 metres of working distance, which changes route clearance practice without transforming it. Humanitarian and reconstruction funding buys comparable technology for explosive remnant clearance across previously contested territory, a programme measured in decades and planned across long horizons rather than responding to incidents. The second source is considerably more predictable than the first, and suppliers organised entirely around defence ministries frequently miss it because the procurement runs through donors and agencies instead. Agencies and donors run those procurements on criteria that defence organised suppliers rarely understand or track, which leaves the segment open.
CAGR 8.9%
Full segment breakdown across 6 segments available in the complete report.

Regional Architecture and Country Demand Map

North America holds 28% of procurement revenue on programme funding rather than on threat exposure. Middle East and Africa at 17% and Eastern Europe at 12% both sit far above the standard bands, because this equipment is bought where devices are used rather than where economies are large.

North America

North America takes 28% of procurement revenue on sustained programme funding rather than on any current threat exposure at home. United States forces retain counter-IED capability as a standing requirement, funding robotics, detection and training through programmes that survived the post-drawdown reductions better than European equivalents did. L3Harris, Teledyne FLIR, Textron Systems and Oshkosh Defense all manufacture here. Much of the equipment reaching high threat areas elsewhere is purchased here and transferred, which is why procurement revenue and threat geography diverge so sharply. Growth at 5.6% is the second slowest anywhere on a mature and already equipped base. Programme funding here survived the drawdown far better than European equivalents did.
Share: 28% | CAGR: 5.6% (2026 to 2036)

Western Europe

Twenty-two percent of procurement revenue reaches Western Europe, where capability reduced substantially after 2014 is now being rebuilt across several national programmes. Leonardo, Chemring Group, Thales, Saab, QinetiQ and Rheinmetall all manufacture here and export widely, so supplier presence considerably exceeds regional consumption. European equipment supplies a large share of transfers into higher threat areas elsewhere. Explosive ordnance disposal capability for legacy contamination from earlier conflicts sustains steady domestic demand. Growth at 5.4% is the slowest of any region, reflecting restoration rather than expansion across most of these programmes. Much of the equipment reaching higher threat areas elsewhere is manufactured here and transferred, so supplier presence exceeds regional consumption considerably. Legacy contamination sustains steady domestic work.
Share: 22% | CAGR: 5.4% (2026 to 2036)
Regional intelligence for 5 additional markets available in the complete report: East Asia, South Asia and Pacific, Latin America, Middle East and Africa, Eastern Europe. Contact sales@marketmindsadvisory.com.
counter-ied-market-country-cagr-analysis-1789991952743

How Suppliers Survive The Cycle

Funding in this market arrives in surges that nobody predicts and disappears again when attention moves, the highest threat areas fund the least procurement, and the fastest growing segment is valued precisely for being destroyed. Each of the four levers below addresses how a supplier stays commercially viable across a cycle it cannot influence.

Build Dual Use Revenue Before The Trough

This category collapsed after 2014 and several suppliers exited, because a business dependent on reactive procurement has no revenue when casualty figures leave the news. Around 26% of supplier income now comes from hazardous materials response, civil disposal, nuclear decommissioning and industrial inspection using substantially the same equipment. That revenue is smaller per unit and far steadier, and it is what kept the surviving specialists alive last time. Building it during a peak is straightforward and building it during a trough is nearly impossible, which is exactly the wrong way round for most boards.
Market Impact: Dual use now provides 26% of all revenue

Sell Attrition As The Product Rather Than Durability

Operational attrition near 22% annually would be a defect in any other equipment category and here it is the commercial argument. A robot exists to be sent where a person cannot go, and one too valuable to lose does not get used for the task it was bought for. Designing to a price that makes loss acceptable, and pricing replacement accordingly, produces recurring revenue that durable expensive systems never generate. Suppliers engineering toward survivability are optimising against their own commercial interest and against the customer's actual need. Customers hesitate to risk expensive machines.
Market Impact: Attrition near 22% each year drives replacement demand

Reach Donor Programmes, Not Only End Users

Around 31% of equipment reaching the highest threat areas arrives through donation, transfer or partner nation programmes rather than purchase by the forces using it. The threat and the budget sit in different countries entirely, so operational demand signals never become orders from the operators. Suppliers organised around end user relationships in high threat regions are calling on people with no procurement authority whatsoever. The purchasing decisions happen in donor capitals and transfer authorities, on entirely different timescales and against completely different criteria. Different capitals, timescales and criteria entirely. Operators hold no procurement authority at all.
Market Impact: Transfers supply fully 31% of all the equipment

Follow Humanitarian Clearance Funding Deliberately Instead

Explosive remnant clearance across previously contested territory is a decades long programme funded by donors and reconstruction budgets rather than by defence ministries responding to casualty figures. The equipment overlaps almost completely with military counter-IED tooling, and the funding is planned across long horizons rather than surging and collapsing. Standoff detection compounds at 8.9% partly on this. Suppliers organised entirely around defence procurement miss it because it runs through agencies and donors they have never called on and do not track. The funding horizon is measured in decades. Defence organised suppliers rarely track it.
Market Impact: Clearance demand compounds at 8.9% very steadily indeed

Who Controls the Margin Pool

Five suppliers hold 47% of counter-IED procurement revenue, split between defence primes carrying this as one line among many and specialists who do very little else. Leonardo, L3Harris Technologies and Elbit Systems hold prime positions with counter-IED alongside far larger businesses. Chemring Group and Teledyne FLIR built specialist positions in countermeasures and robotics, which carries more cyclical risk and more product depth simultaneously. All participants are assessed on equipment and system procurement revenue.
Competition depends heavily on which funding route a supplier can actually reach. Defence ministry programmes favour primes with existing framework positions and security clearances. Donor and transfer programmes run on procurement rules primes rarely engage with. Humanitarian clearance funding operates through agencies that assess suppliers on completely different criteria, and specialists frequently win there against far larger competitors.

Rankings shift with the funding cycle rather than with product capability, since a supplier's position depends mostly on whether it survived the last trough with capability intact. The second pressure is robotics, where the commercial logic of expendability favours suppliers who can build to a price rather than those engineering toward maximum survivability, which is the opposite of what defence manufacturing usually rewards.
counter-ied-market-company-positioning-matrix-1789991953265

Competitive Moat and Risk Dimensions

CHEMRING GROUP

Moat: Countermeasure Specialist Depth

Chemring has focused on countermeasures and detection across decades rather than carrying them alongside larger defence businesses, which produces product depth and customer relationships a prime treating this as one line item never accumulates. Detection chemistry and countermeasure knowledge compound through sustained investment. That focus also makes the company credible with clearance programmes.
CHEMRING GROUP

Risk: Reactive Funding Exposure

A specialist has no larger business to carry it through a funding trough, and this category collapsed after 2014 in a way that removed several competitors permanently from the market. Dual use revenue near 26% of income helps and does not fully insulate anybody. Nothing about the funding mechanism has changed since the last collapse occurred.
TELEDYNE FLIR

Moat: Sensing And Robotics Combination

Teledyne FLIR combines thermal and chemical sensing with unmanned ground systems, so detection and handling arrive from one supplier rather than being integrated by the customer. That matters when operators need equipment that works together under pressure without integration work in the field. The sensing technology also underpins substantial civil and industrial business that steadies revenue through defence funding troughs.
TELEDYNE FLIR

Risk: Robot Price Point Pressure

Expendability is the commercial argument for unmanned ground systems, which means a system too expensive to lose fails its own purpose regardless of capability. Attrition near 22% annually makes unit price the decisive variable rather than performance. Suppliers building cheaper adequate platforms compete effectively against considerably more capable machines that customers hesitate to risk.

Players Tracked

Prominent Players

Leonardo
Chemring Group
Teledyne FLIR
L3Harris Technologies
Elbit Systems

Other Key Players

Rheinmetall
Thales
Saab
General Dynamics
BAE Systems
Textron Systems
Oshkosh Defense
QinetiQ
Israel Aerospace Industries
Rafael Advanced Defense Systems
Smiths Detection
Allen-Vanguard
ECA Group
Hanwha Aerospace
Cobham

Recent Developments

FEBRUARY 2025

Poland Expands Counter Explosive Capability Across Multiple Equipment Types

Polish procurement expanded counter explosive device capability spanning detection, robotic systems and clearance equipment together, a national programme decision rather than any corporate transaction. European capability reduced substantially after 2014 is being rebuilt across several national programmes, with Poland compounding at 12.4% ahead of any other country.
Signal: Capability restoration is considerably more predictable than the reactive surges that this market usually runs on.
SEPTEMBER 2024

Teledyne FLIR Extends Lower Cost Unmanned Ground System Range

Teledyne FLIR extended its unmanned ground system range toward lower cost platforms suited to expendable use, an organic product development rather than an acquisition. Operational attrition near 22% annually makes unit price the decisive variable, since a system too valuable to lose does not get sent where it is needed.
Signal: A robot too expensive to lose fails the purpose it was procured for in the first place.
JUNE 2025

Chemring Expands Detection Products For Humanitarian Clearance Programmes

Chemring Group extended its detection products toward humanitarian explosive remnant clearance applications, an organic expansion rather than a partnership or merger. That funding comes from donors and reconstruction budgets planned across decades rather than from defence ministries responding to casualty figures reported in the news.
Signal: Donor funded clearance behaves nothing like defence procurement, and very few suppliers pursue it properly at all.

What This Equipment Costs To Build

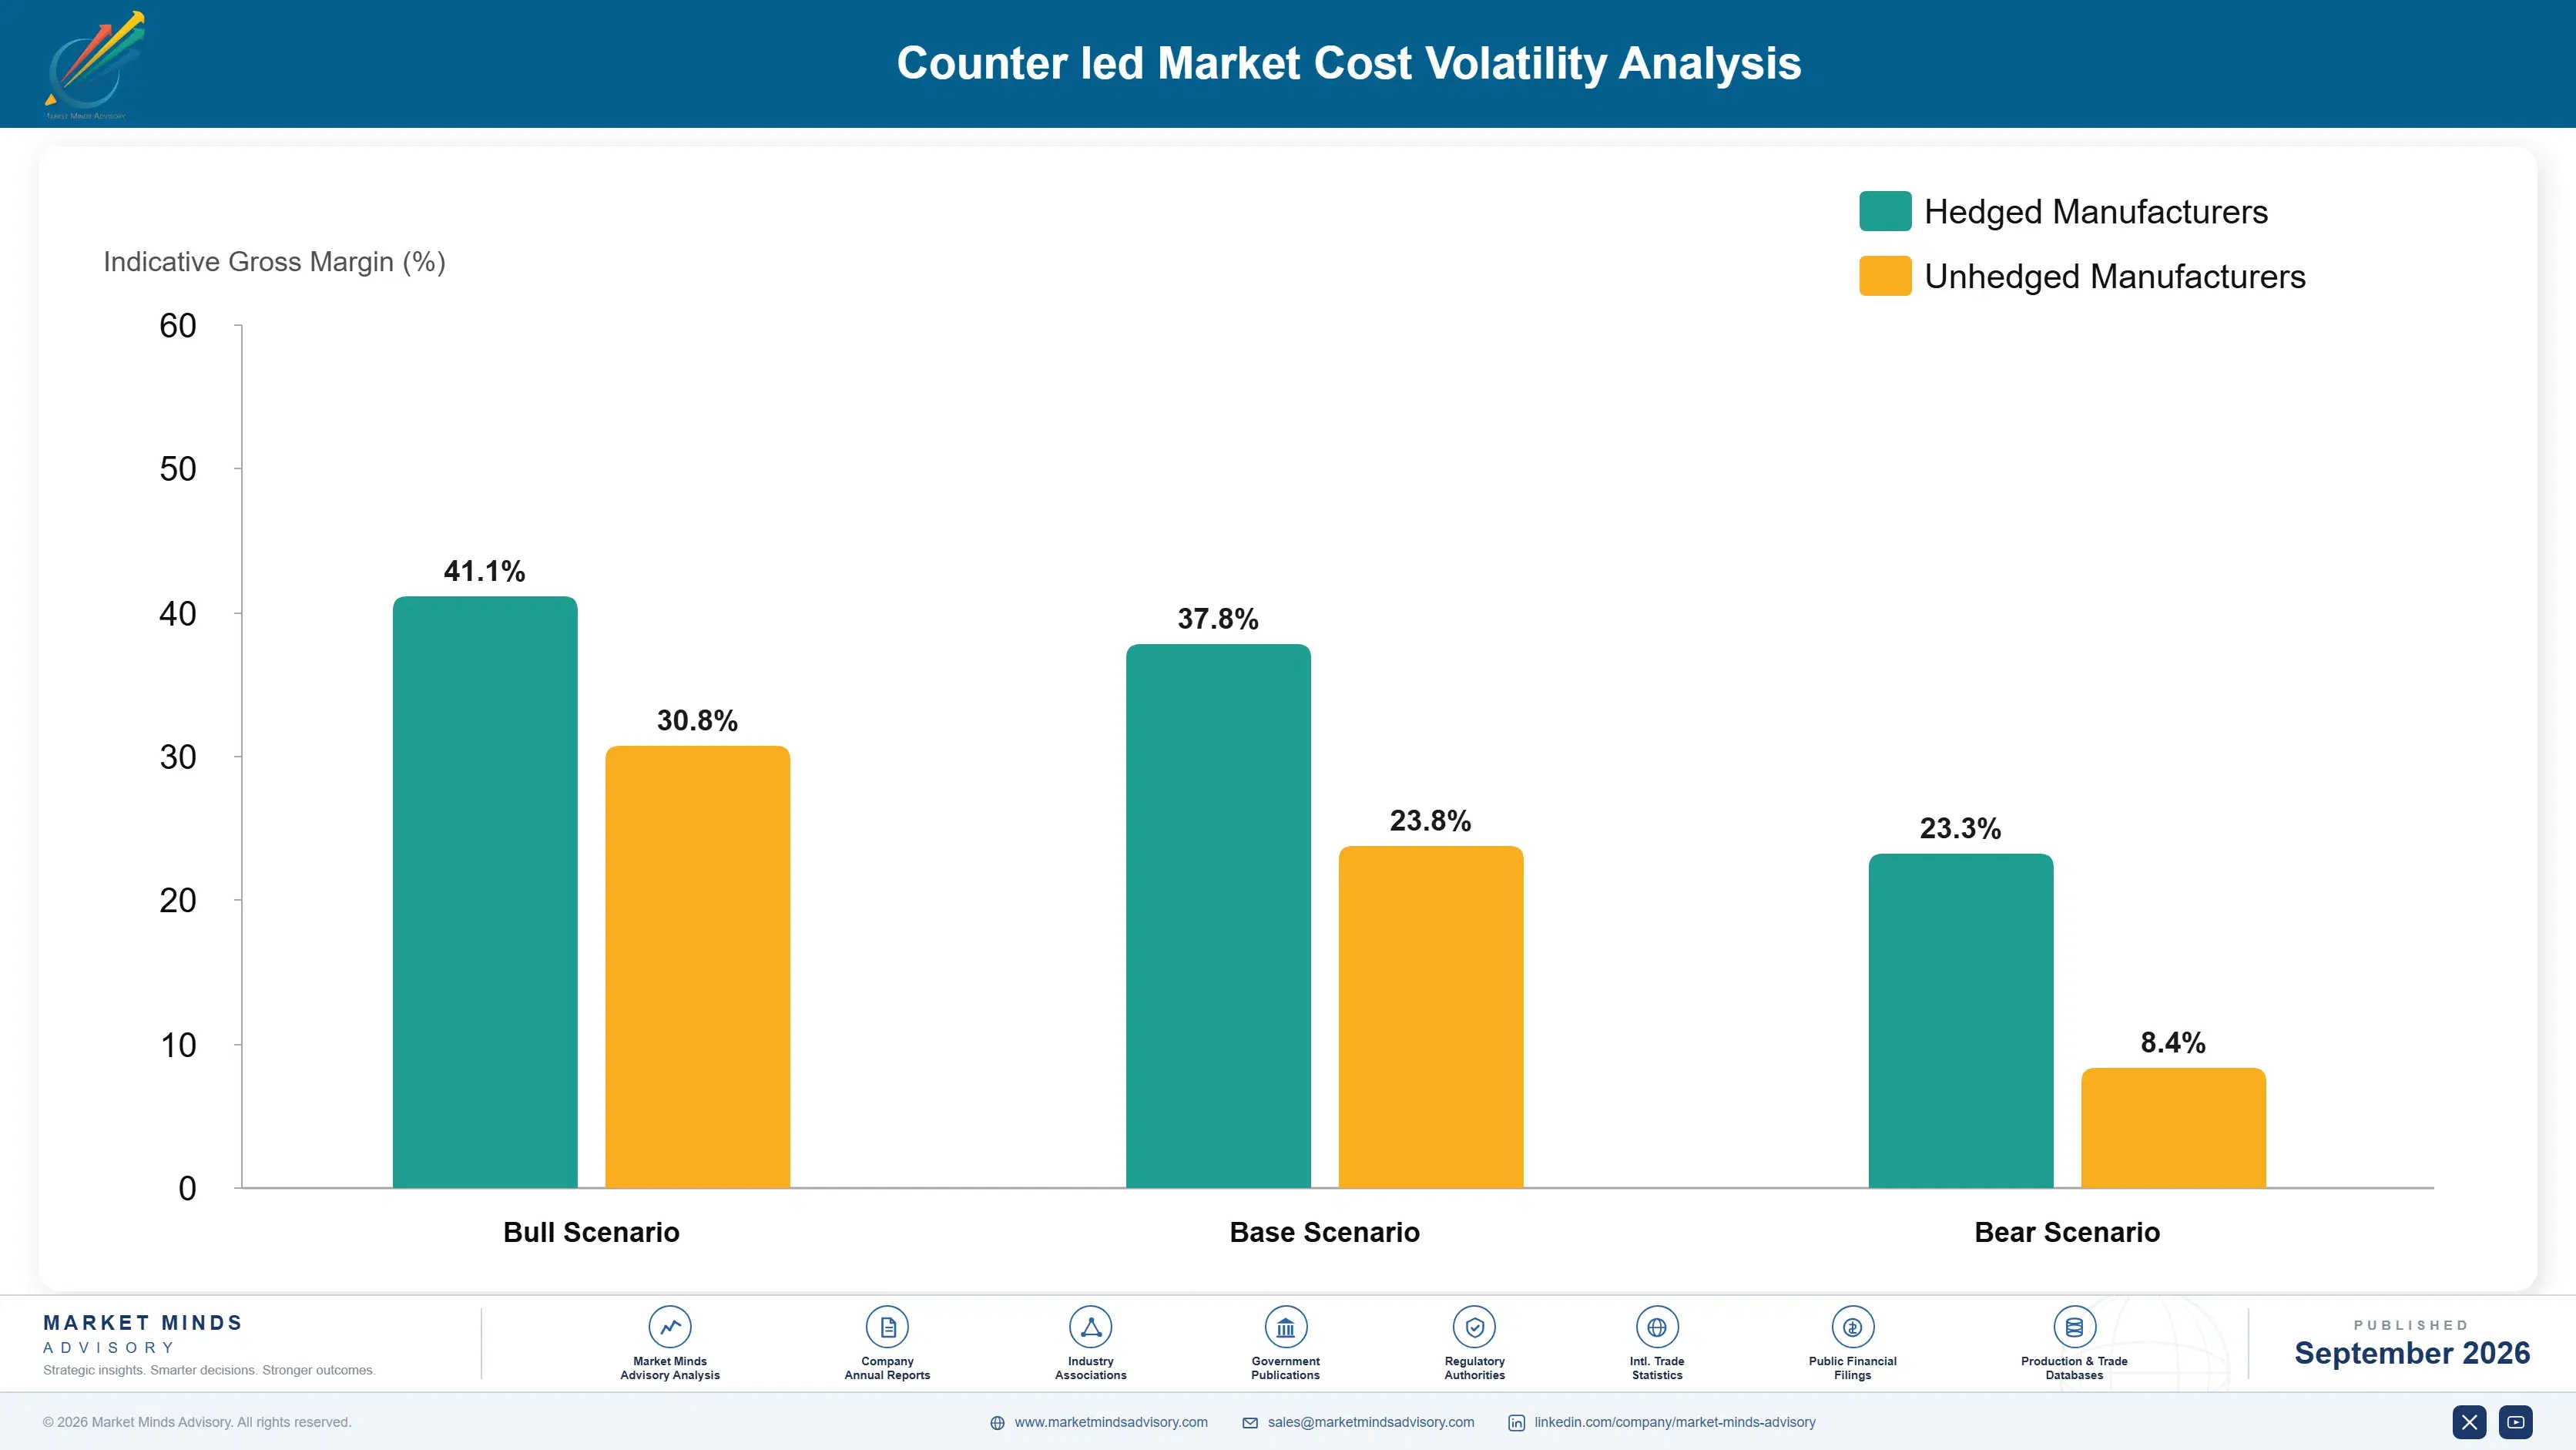
Electronic components and sensing assemblies account for roughly 33% of equipment cost, weighted toward detection systems and countermeasure electronics that carry military qualification. Ruggedised mechanical assembly carries around 27%, which is high because this equipment operates in conditions that destroy commercial hardware. Qualification and security accreditation absorb about 16%, and low volume manufacturing overhead takes most of the remaining balance.
Component availability tightened through 2022 and 2023 across sensing and radio frequency parts, and defence volumes competed against commercial customers ordering vastly more units at far better pricing. Leonardo Annual Report 2024 and Chemring Group Annual Report 2024 both record supply chain availability and qualification cost as operating variables. Suppliers on fixed price government contracts absorbed increases directly, since a programme priced against a requirement statement does not reprice on delivery years later.

The competitive disadvantage mechanism is volume rather than any technology gap. Qualification, accreditation and low volume manufacturing overhead run around 16% and much of it is fixed regardless of units shipped, so a supplier producing hundreds carries per unit cost a supplier producing thousands does not. Exposure concentrates among specialists during troughs, when volumes fall and fixed costs do not.
counter-ied-market-cost-volatility-analysis-1789991953459

Use Commercial Components Wherever Qualification Permits

Electronic components run around 33% of cost and military qualified parts carry substantial premiums over commercial equivalents that frequently meet the actual environmental requirement. Reviewing which components genuinely need qualification rather than inheriting a specification written decades ago releases material cost. Expendable robotic platforms tolerate commercial parts comfortably, since they are designed to be lost.

Design Platforms Serving Defence And Civil Together

Qualification and accreditation run about 16% of cost and are largely fixed regardless of volume, so spreading them across defence and civil applications halves the burden per unit. Around 26% of supplier income already comes from hazardous materials and industrial work using similar equipment. Designing one platform for both markets from the outset is what makes those economics work.

Hold Manufacturing Flexible Rather Than Adding Capacity

Reactive funding produces surges that tempt suppliers into capacity commitments, and the resulting fixed cost base is what destroyed several competitors after 2014. Contract manufacturing, flexible assembly arrangements and deliberate under investment during peaks cost margin during good years and preserve the business through the trough. The discipline is refusing to build for a demand level nobody believes will persist.

Portfolio Architecture for Margin Defence

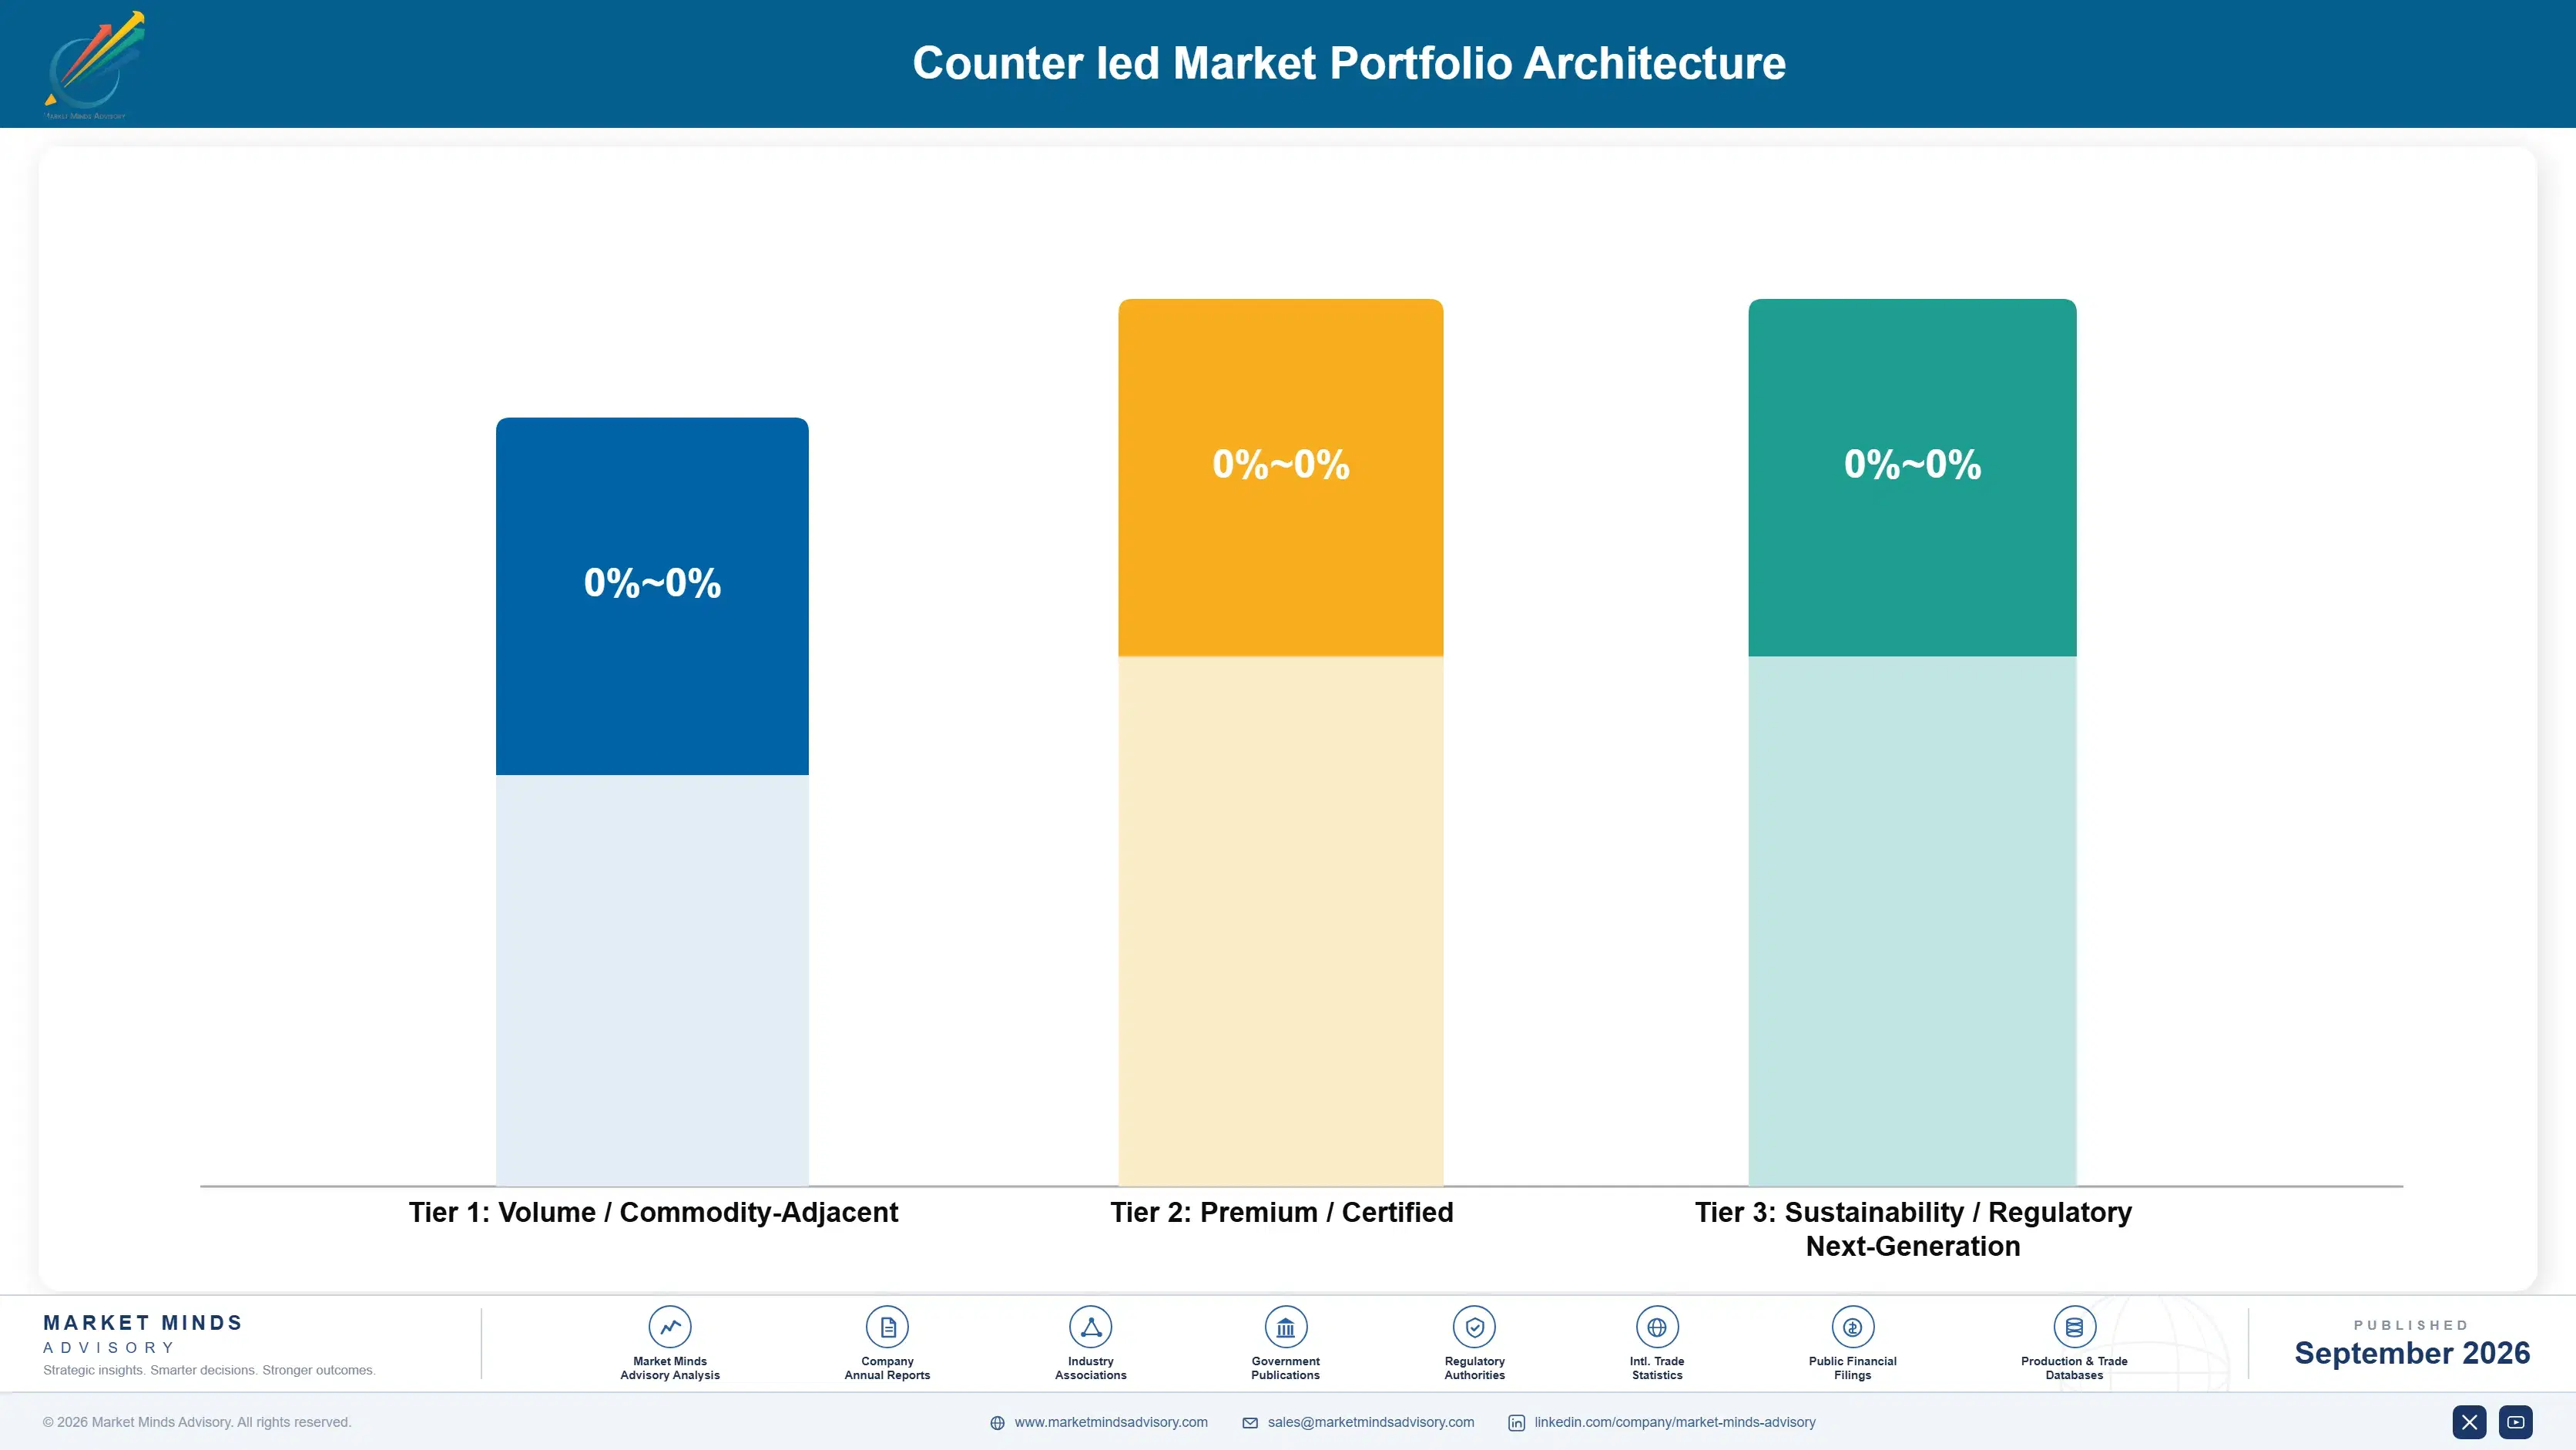
Margin architecture separates on whether the equipment has a life outside defence procurement. Route clearance vehicles and protective equipment earn least, since both are heavy manufacturing sold to a single customer type with no civil application at comparable specification. Explosive ordnance disposal tools sit in the middle. Robotics, standoff detection and countermeasure electronics earn most, because each carries dual use revenue and genuine technology barriers.
The volume versus premium tension in robotics inverts the usual logic entirely. A more capable and more durable system is worth less operationally, because an expensive robot does not get sent into the situations it was procured for. Attrition near 22% annually means unit price rather than performance decides selection. Suppliers engineering toward survivability are building something the customer will hesitate to use properly.

High-value pools concentrate in detection technology and in dual use platforms, and neither is reached by defence programme positioning alone. Detection depends on sensing chemistry and physics accumulated over decades of specialist investment. Dual use requires civil market relationships that defence organisations rarely build. Both are what carried the surviving specialists through the last trough, which is the only performance test this industry genuinely applies.

Volume / Commodity-Adjacent

Route clearance vehicles and protective equipment, heavy manufacturing sold to a single customer type with no comparable civil application available. The eight point spread separates suppliers with existing vehicle production lines from those building dedicated capacity for uncertain programme volumes.
Gross Margin: 14% to 22%

Premium / Certified

Explosive ordnance disposal tools and electronic countermeasure jammers sold on qualification, reliability and accredited performance against defined threats. The twelve point spread tracks how much of a supplier's volume sits under multi-year framework programmes rather than in reactive urgent requirement purchases.
Gross Margin: 26% to 38%

Sustainability / Regulatory / Next-Generation

Robotic systems and standoff detection carrying genuine technology barriers alongside dual use revenue from hazardous materials and industrial applications. The fourteen point spread reflects how much civil business a supplier has built, which is what determines survival through a defence funding trough.
Gross Margin: 42% to 56%
counter-ied-market-portfolio-architecture-1789991953965

High-value Sub-segments and Strategic Watch-out

Robotic And Unmanned Ground Systems

Grows at 10.2% because expendability rather than capability is the commercial argument for sending a machine instead of a person. The fourteen point spread reflects civil revenue depth. Attrition near 22% annually is the point of the category rather than a defect in it. Loss is expected.
Gross Margin: 42% to 56%

Standoff Detection Systems

Grows at 8.9% on military procurement and humanitarian clearance funding that behave nothing alike in timing or in criteria. The fourteen point spread reflects sensing technology depth. Around 45 metres of working range changes route clearance practice without transforming it. Two funding sources that behave nothing alike.
Gross Margin: 42% to 56%

Electronic Countermeasure Jammers

Grows at 7.4% on vehicle and dismounted protection requirements that every deploying force maintains as a standing capability. The twelve point spread reflects framework programme coverage. Spectrum management complexity makes this considerably harder to enter than it appears. Every deploying force maintains this as standing capability.
Gross Margin: 26% to 38%

Route Clearance Vehicles And Systems

Grows at 2.1%, slowest of the six functions, because the large fleet procurement of the last deployment era is complete and those vehicles are now in sustainment. The eight point spread reflects manufacturing base. Support revenue continues long after new purchases stop entirely. Sustainment revenue continues for decades.
Gross Margin: 14% to 22%

How This Demand Actually Behaves

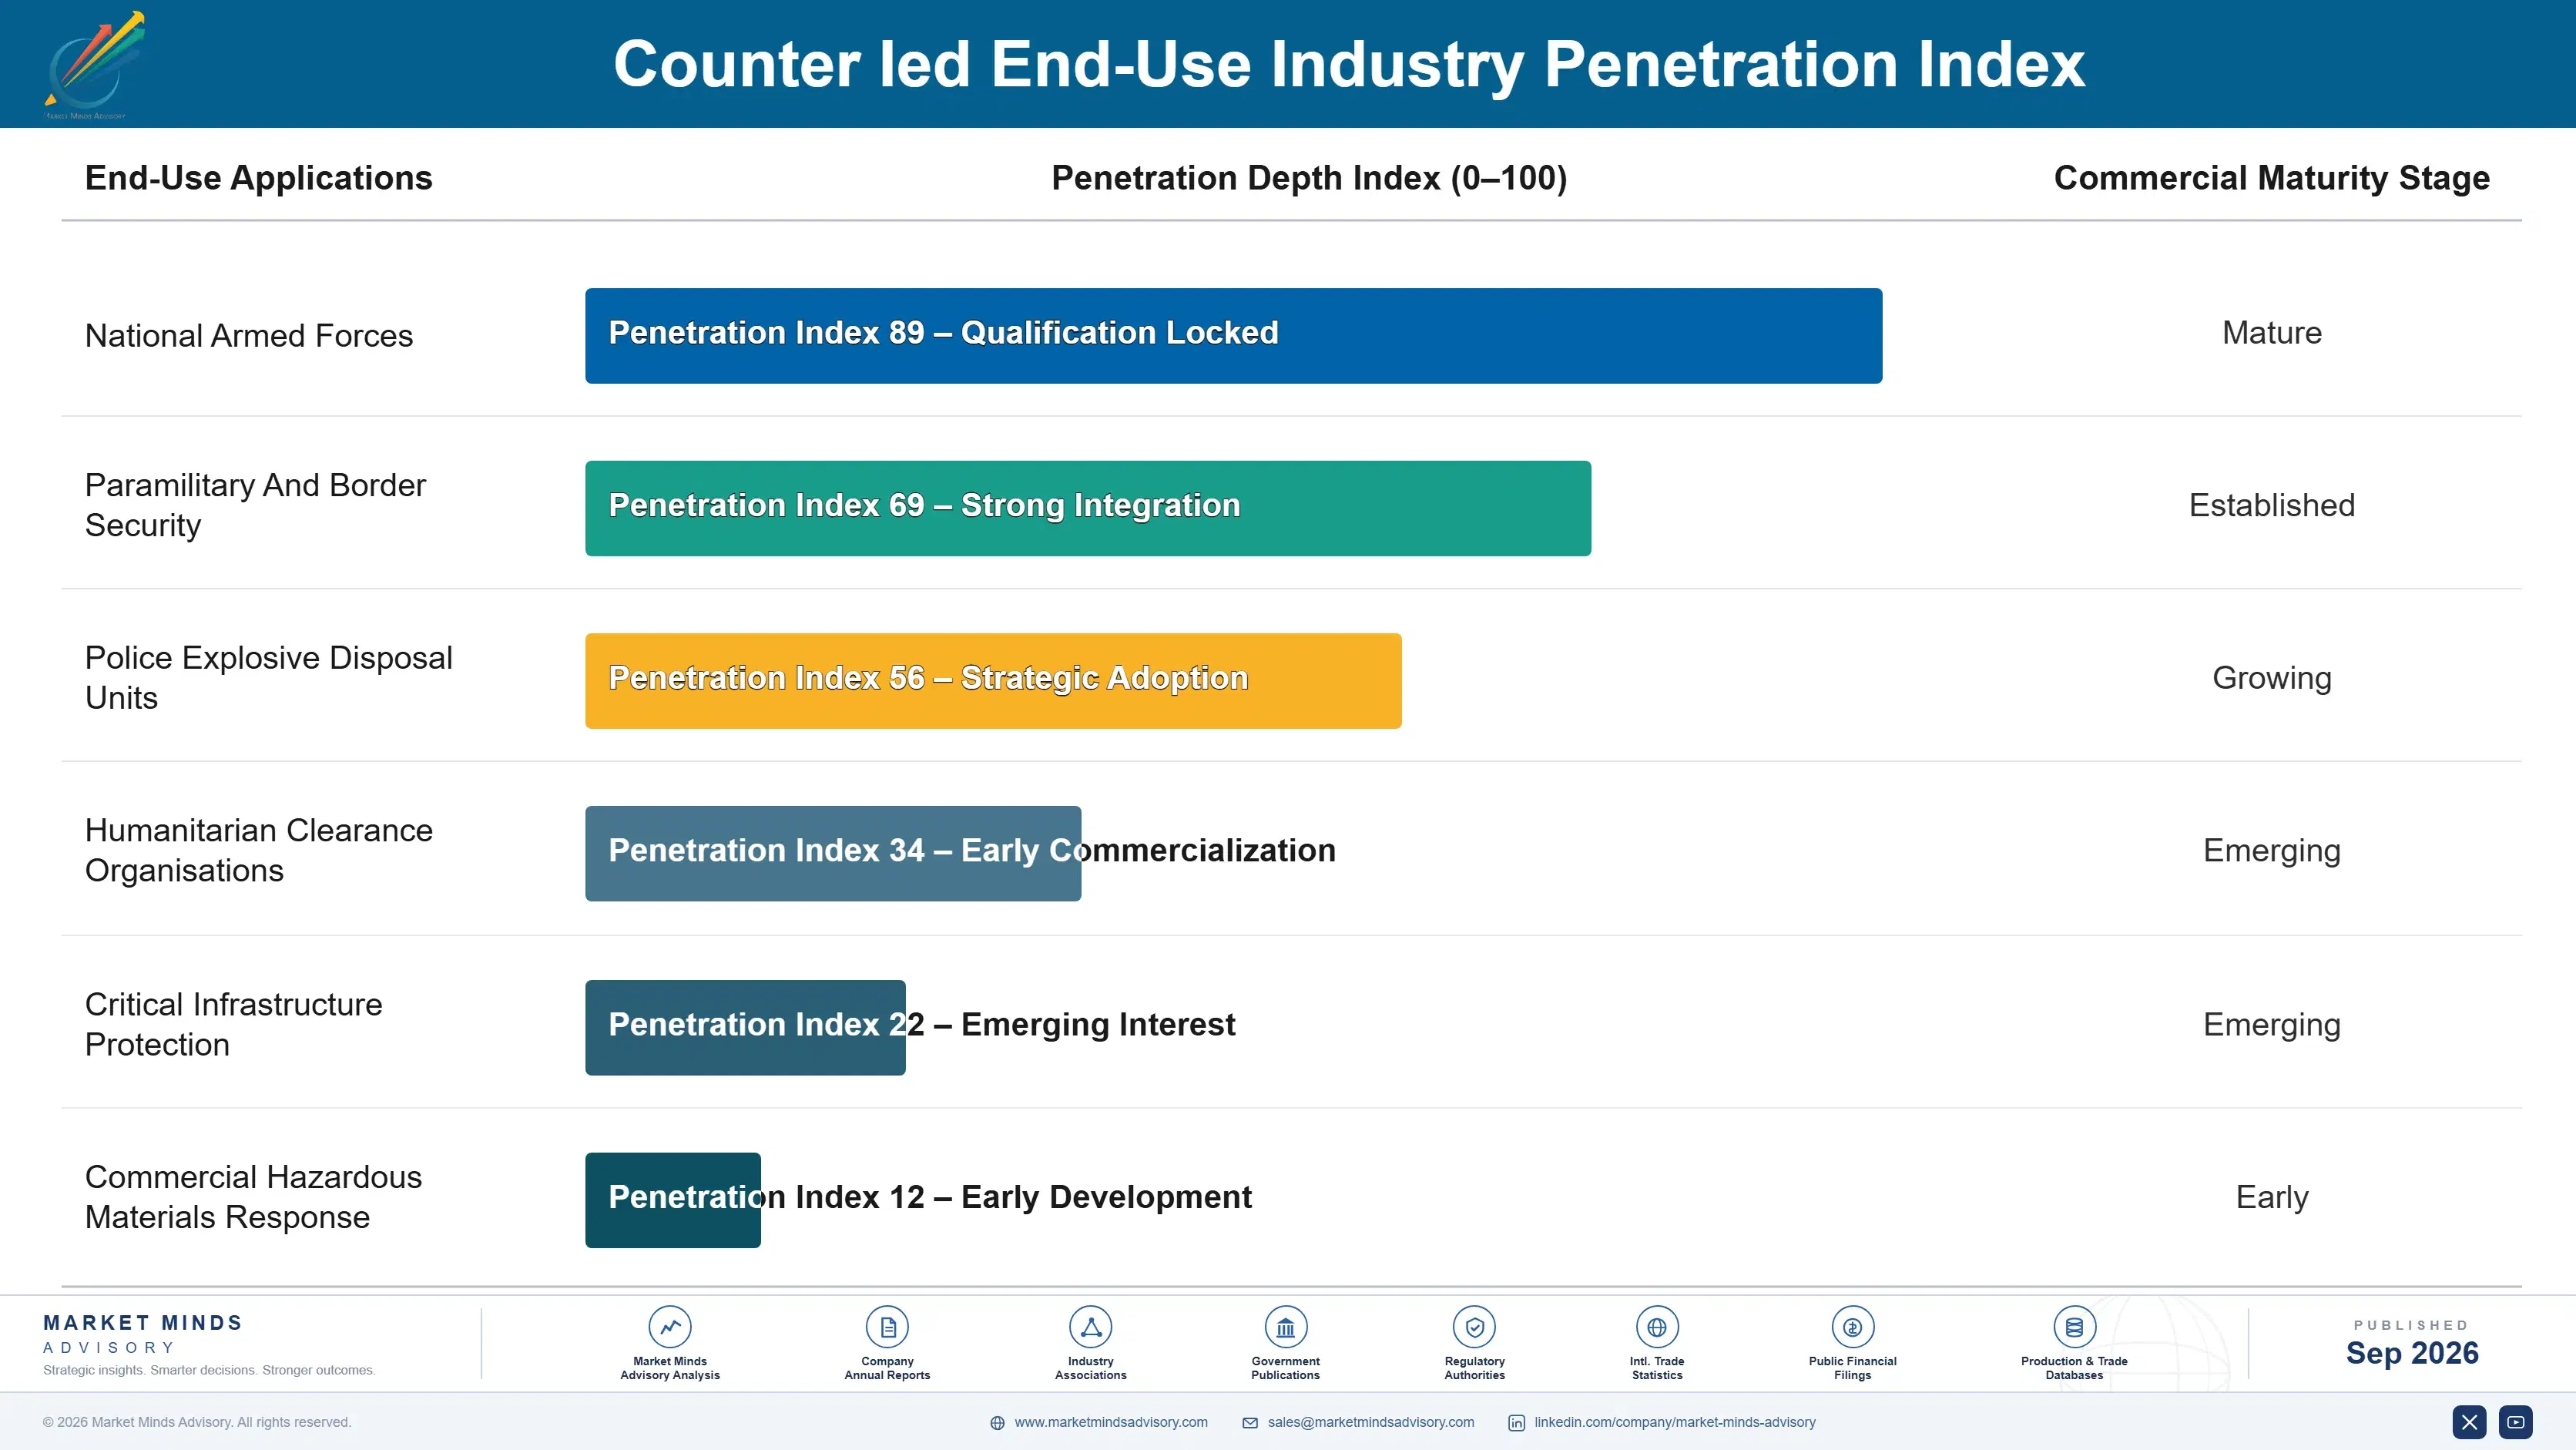
The annuity is sustainment rather than procurement. Equipment fielded during a surge requires spares, training, software updates and repair for its whole service life, and that revenue continues long after new purchases stop entirely. Route clearance vehicles bought during the last deployment era still generate support income more than a decade later. Whoever won the original programme holds that sustainment position almost unchallenged afterwards.
Depth varies by how accredited the equipment is. A countermeasure system certified against specific threats and integrated into vehicle electrical architecture is effectively permanent for that fleet's life. Detection equipment with trained operators and established procedures behind it is similarly embedded. Expendable robotic platforms are the shallowest by design, since they are replaced constantly and each replacement is a genuine competitive opportunity for anybody with an adequate product.

The buyer is more varied than any other defence category, and suppliers frequently reach only one type. A defence ministry procures on capability and framework relationships. A donor programme procures on transfer rules and partner requirements. A humanitarian agency procures on clearance productivity and cost per hectare. Different criteria, timescales and people, and organisations built for the first reach little of the rest.
counter-ied-market-end-use-penetration-index-1789991954457

How Suppliers Stay In Business

These are among the four positions where our research anticipates prominent divergence between winners and laggards over the coming forecast period. Each is grounded in the demand model, the regulatory perimeter, and the announced capacity pipeline.
01 / CIVIL REVENUE BUILDING

Build The Other Business During The Peak

This category collapsed after 2014 and removed several suppliers permanently, because a business dependent on reactive procurement has no revenue at all once casualty figures leave the news cycle. Around 26% of supplier income now comes from hazardous materials response, civil disposal, nuclear decommissioning and industrial inspection using substantially the same equipment. That revenue is smaller per unit and considerably steadier, and building it during a funding peak is straightforward while building it during a trough is very nearly impossible.
02 / EXPENDABILITY PRICING DISCIPLINE

Build It Cheap Enough To Lose

An unmanned ground system exists to be sent where a person cannot go, and one that is too expensive to lose simply does not get used for the task it was procured to perform. Operational attrition near 22% annually would be a defect in any other equipment category and here it is precisely the commercial argument. Designing to a price that makes loss acceptable produces recurring replacement revenue that durable expensive systems never generate, and suppliers engineering toward survivability work against their own interest.
03 / FUNDING ROUTE COVERAGE

Call On Donors, Not Just Ministries

Around 31% of equipment reaching the highest threat areas arrives through donation, transfer or partner nation programmes rather than being purchased by the forces that actually use it in the field. The threat and the budget sit in entirely different countries, so operational demand never becomes an order from the operator. Suppliers organised around end user relationships in high threat regions are calling on people holding no procurement authority whatsoever, while the actual purchasing decisions are being taken in donor capitals and transfer authorities instead.
04 / CLEARANCE PROGRAMME ACCESS

Follow The Decades, Not The Headlines

Explosive remnant clearance across previously contested territory is a programme measured in decades and funded through donors and reconstruction budgets rather than by defence ministries responding to casualty figures in the news. The equipment overlaps almost completely with military counter-IED tooling and the funding is planned across long horizons rather than surging and then collapsing. Standoff detection compounds at 8.9% partly on this, and defence organised suppliers miss it because that funding runs entirely through agencies and donors they have never once called on.

Engagement Snapshot From the Field

A live engagement with an industry participant carrying material or product regulatory and market exposure ahead of a defining policy shift, showing how our research translates into a defensible multi-year portfolio strategy.
MARKET MINDS ADVISORY · CLIENT ENGAGEMENT SUMMARY
Counter Ied Producer Strategic Portfolio Review and Transition Roadmap 2026·Investment Scenario on Counter Ied Exposure Evaluation 2025-26
CLIENT PROFILE
A European counter explosive device specialist with around 340 employees, deriving the substantial majority of revenue from defence procurement across four national customers. Order intake had been volatile for a decade and the board had twice reduced headcount during funding troughs. A new surge in European procurement was arriving and management wanted to expand capacity to meet it.
STRATEGIC CHALLENGE
Operations wanted manufacturing capacity added immediately to capture the visible order pipeline. Finance recalled that the previous expansion had preceded a collapse and had nearly ended the company. Neither had assessed how much of the current pipeline was capability restoration rather than reactive surge, or what civil applications the existing products could reach without redesign.
MMA APPROACH
MMA separated the order pipeline into capability restoration programmes with multi-year funding and reactive urgent requirements without it, and modelled revenue under three attention scenarios. We assessed which existing products could reach hazardous materials, nuclear decommissioning and industrial inspection buyers without redesign. The work drew on 47 expert interviews conducted in Q4 2025 with suppliers, procurement officials and clearance agencies.
KEY FINDINGS
  1. Only about 4 in 10 of the pipeline represented multi-year capability restoration funding, and the remainder behaved exactly like the surge that preceded the last collapse.
  2. Three existing product lines met hazardous materials response requirements without any redesign, and nobody in the company had ever approached that market.
  3. Humanitarian clearance agencies procured comparable detection equipment on entirely different criteria, and the company had never once bid into any of those programmes.
  4. Adding capacity for the full pipeline would have raised fixed costs by roughly 2 times the level that ended badly in 2014 (client-reported, unverified by MMA).
CLIENT PROFILE
A European counter explosive device specialist with around 340 employees, deriving the substantial majority of revenue from defence procurement across four national customers. Order intake had been volatile for a decade and the board had twice reduced headcount during funding troughs. A new surge in European procurement was arriving and management wanted to expand capacity to meet it.
STRATEGIC CHALLENGE
Operations wanted manufacturing capacity added immediately to capture the visible order pipeline. Finance recalled that the previous expansion had preceded a collapse and had nearly ended the company. Neither had assessed how much of the current pipeline was capability restoration rather than reactive surge, or what civil applications the existing products could reach without redesign.
MMA APPROACH
MMA separated the order pipeline into capability restoration programmes with multi-year funding and reactive urgent requirements without it, and modelled revenue under three attention scenarios. We assessed which existing products could reach hazardous materials, nuclear decommissioning and industrial inspection buyers without redesign. The work drew on 47 expert interviews conducted in Q4 2025 with suppliers, procurement officials and clearance agencies.
KEY FINDINGS
  1. Only about 4 in 10 of the pipeline represented multi-year capability restoration funding, and the remainder behaved exactly like the surge that preceded the last collapse.
  2. Three existing product lines met hazardous materials response requirements without any redesign, and nobody in the company had ever approached that market.
  3. Humanitarian clearance agencies procured comparable detection equipment on entirely different criteria, and the company had never once bid into any of those programmes.
  4. Adding capacity for the full pipeline would have raised fixed costs by roughly 2 times the level that ended badly in 2014 (client-reported, unverified by MMA).
RECOMMENDED STRATEGY
Phase 1: Phase one: add capacity only against the multi-year restoration programmes, and meet any surge demand through contract manufacturing arrangements instead. Phase 2: Phase two: approach hazardous materials and nuclear decommissioning buyers with the three product lines that already meet their requirements without redesign. Phase 3: Phase three: build a bidding capability for humanitarian clearance programmes, which procure similar equipment on completely different criteria and timescales.
OUTCOME
The specialist added limited capacity and contracted the surge volume externally (client-reported, unverified by MMA). Civil revenue reached a meaningful share of the total within a year and the company entered its first clearance agency framework. Capacity decisions are now assessed against funding durability rather than order pipeline, which is the change that outlasted the engagement.

Frequently Asked Questions

Foundational context covering the market sizes, CAGR, scope, country, region and competition that inform every finding below. This section is provided to cover basics and most often pre-purchase conversations, answered from the MMA Primary Research Dataset.

What is the current size of the Counter Ied Market?

Global value reaches USD 3.10 billion in 2026, measured as counter-IED equipment and system procurement revenue across six functions. The 2025 base is USD 2.9 billion.

How large will the Counter Ied Market be by 2036?

Procurement revenue reaches USD 5.99 billion by 2036, an increase of USD 2.89 billion over the forecast period. That represents 1.93 times expansion from the 2026 base.

What is the CAGR for the Counter Ied Market 2026 to 2036?

The base case runs at 6.8% annually, with a bull case at 8.0% if standoff detection ranges change tactical practice and a bear case at 5.6% if attention and funding move elsewhere again.

Which segment is growing fastest?

Robotic and unmanned ground systems grow at 10.2%, half again the market rate of 6.8%. The argument is expendability rather than capability, and attrition near 22% annually drives recurring replacement.

Who are the major companies in the Counter Ied Market?

Leonardo, Chemring Group, Teledyne FLIR, L3Harris Technologies and Elbit Systems lead on procurement revenue, together holding 47%. Rheinmetall, QinetiQ and Allen-Vanguard hold smaller specialist positions.

Which country is growing fastest?

Poland leads at 12.4%, on capability development spanning detection, robotics and clearance together after substantial reductions made across Europe in earlier years. Baltic states and India follow.

Report Segmentation Architecture

The full report scope spans multiple orthogonal segmentation dimensions, with cross-tabulated demand data provided for each dimension pair. Coverage extends further to regional breakdowns, trend trajectories, and the competitive detail needed to support segment-level decision-making.

By Countermeasure Function

  • Robotic And Unmanned Ground Systems
  • Standoff Detection Systems
  • Electronic Countermeasure Jammers
  • Protective Equipment And Blast Mitigation
  • Explosive Ordnance Disposal Tools
  • Route Clearance Vehicles And Systems

By End-Use Industry

  • National Armed Forces
  • Paramilitary And Border Security
  • Police Explosive Disposal Units
  • Humanitarian Clearance Organisations
  • Critical Infrastructure Protection
  • Commercial Hazardous Materials Response

By Commercial Dimension

  • Defence Ministry Framework Programmes
  • Urgent Operational Requirement Purchase
  • Donor And Transfer Programmes
  • Humanitarian Agency Procurement
  • Sustainment And Spares Contracts
  • Training And Support Services

By Region

  • North America
  • Western Europe
  • East Asia
  • South Asia and Pacific
  • Latin America
  • Middle East and Africa
  • Eastern Europe

Scope, Methodology, and Coverage

Every figure in this report is reproducible from documented input assumptions. The scope below maps the historical period, the forecast horizon, the segmentation dimensions, and the countries covered, alongside the underlying primary and qualitative methodology.
Historical Period
2020 to 2025
Forecast Period
2026 to 2036
Base Year
2025 (USD billions; MMA Primary Research Dataset, September 2026)
Market Definition
This report covers equipment and systems procured to detect, defeat and mitigate improvised explosive devices: robotic and unmanned ground systems, standoff detection systems, electronic countermeasure jammers, route clearance vehicles and systems, protective equipment and blast mitigation, and explosive ordnance disposal tools. It excludes conventional munitions and weapons, general armoured vehicles without route clearance role, aviation platforms, intelligence software, and civil aviation security screening equipment.
Quantitative Units
USD millions, equipment and system procurement revenue basis; fielded systems; detection working range in metres; annual operational attrition as a percentage; procurement cycle length in months.
Segmentation Dimensions
Countermeasure function; procuring organisation type; funding and procurement route; geography across seven regions.
Regions Covered
North America, Western Europe, East Asia, South Asia and Pacific, Latin America, Middle East and Africa, Eastern Europe
Countries Covered
United States, Canada, United Kingdom, France, Germany, Italy, Spain, Poland, Lithuania, Romania, Ukraine, India, Pakistan, Australia, South Korea, Japan, Saudi Arabia, United Arab Emirates, Nigeria, Colombia.
Key Companies Profiled
Leonardo, Chemring Group, Teledyne FLIR, L3Harris Technologies, Elbit Systems, Rheinmetall, Thales, Saab, General Dynamics, BAE Systems, Textron Systems, QinetiQ, Smiths Detection, Allen-Vanguard, Hanwha Aerospace.
Quantitative Methodology
Primary survey, n=3,800 respondents, Q4 2025, six countries; demand-side model with trade association cross-validation
Qualitative Methodology
47 expert interviews, Q4 2025; applied to validate demand model assumptions, identify emerging dynamics, and assess competitive positioning
Report Format
PDF and XLSX data workbook (Word format preview document)
Publisher
Market Minds Advisory
Report Code
MMA-2026-TEC-581
Published
September 2026
Contact
sales@marketmindsadvisory.com | www.marketmindsadvisory.com

Purchase the full Counter Ied Market Report (2026 to 2036).

This report sizes the global counter-IED equipment market from 2026 to 2036 across six countermeasure functions, six procuring organisation types and seven regions. It explains why reactive funding tied to casualty figures makes capacity planning nearly impossible, how 31% of equipment reaching high threat areas arrives by transfer rather than purchase, and why operational attrition near 22% is the commercial argument for robotics rather than a defect. Cost composition is sourced to company annual reports, with qualification overhead analysed as the volume constraint. Regional analysis explains why threat geography overrides economic geography entirely here.
Six countermeasure functions sized through to 2036
Reactive funding cycles modelled against supplier survival
Qualification cost composition drawn from company annual filings
Twenty named suppliers assessed on procurement revenue
Four revenue levers with quantified commercial impact
Anonymised European specialist revenue stability engagement included fully

Built For The People Who Decide

From boardroom strategy to bench-side execution, this report is read cover-to-cover by leaders shaping the next decade of their industry, turning demand scenarios, market dynamics and valuation benchmarks into decisions.
CXOs/ Presidents/ VPs/ Managers
M&A and Corporate Development
Strategy Teams and R&D Heads
Procurement and Product Directors
Regulatory and Compliance Leaders
Investor Relations and Equity Analysts