Market Minds Advisory
Cosmetics ODM Market

Cosmetics ODM Market: Cosmetics ODM Market: Formulation Ownership, Order Minimums and Regulatory Dossier Control, 2026 to 2036

A great many independent brands are the same base formula from the same few factories with a different fragrance. The story is the only part the brand genuinely owns outright.

Lead Analyst

Published

September 2026

Make Smarter Decisions with Customized Research Insights

Request a free sample report and evaluate market opportunities, growth trends, and competitive dynamics relevant to your business needs.

2025 MARKET VALUE$24.6BMarket Size 2025
2036 FORECAST VALUE$56.2BBase Case , 2026 to 2036
CAGR 2026 TO 20367.8 %Bull 9.0% / Bear 6.6%
INCREMENTAL OPPORTUNITY$29.7BNet 10- year value creation
EXPANSION MULTIPLE2.12x2036 value over 2026 base
Strategic Levers
M&A Pipeline
Regional Outlook
Country Rankings
Competitive Intelligence
Segmental Deep-dive
Call-Us : 91 93563 13602

Executive Snapshot and Market Trajectory.

The manufacturer holds the formulation and the brand holds the marketing. Around 63% of launches are built on existing formulations rather than newly developed ones, which is why so many products described as independent are difficult to distinguish once the packaging is removed. Marketing is what the brand adds.
Regulatory dossier and registration services grow at 11.7%, half again the market rate of 7.8%, and they are the modern lock-in. Manufacturers hold 71% of product information files, and a brand switching factory must rebuild those documents for every market it sells in. Low minimum order production follows at 10.4%. Median accepted runs fell to around 3,200 units, opening the market to founders who could never have met earlier thresholds. Founders buy launch dates.
East Asia holds 44% of service revenue, far above the usual band, because Korean and Chinese manufacturers develop and produce for brands headquartered everywhere else. Concentration is very low at 22%, and gross margins average 23% because manufacturers cut order minimums to capture launches. Speed rather than novelty is what founders buy, roughly 4.6 months from brief. Nobody planned the margin outcome, and volume growth followed the reduction immediately.
Market Definition
This market covers third-party development and manufacture of finished cosmetic and personal care products, including full service formulation and manufacture, stock formulation customisation, regulatory dossier and registration services, packaging development and sourcing, small batch and low minimum order production, and contract manufacture to a brand's own formula. It excludes raw material and ingredient supply, packaging components sold separately to brands, brand-owned manufacturing, and retail or distribution services.
Base Year Value
$24.6B in 2025 (MMA Primary Research Dataset, September 2026)
Forecast Period
2026 to 2036, eleven discrete annual values
CAGR
7.8% base case. Bull 9.0%. Bear 6.6%.
Fastest Growth Segment
Regulatory Dossier And Registration Services: 11.7% CAGR
Fastest Growth Country
India: 12.4% CAGR
Fastest Growth Region
South Asia and Pacific: 9.8% CAGR
Largest Region
East Asia: 44% of 2025 global value
Market Leaders
Cosmax, Kolmar Korea, Cosmecca Korea, Intercos, and Nox Bellcow lead the field. Source: MMA Primary Research Dataset, July 2026.
Primary Survey
n=3,800 procurement and R&D decision-makers, Q4 2025, six countries
Methodology
Demand-side build-up, cross-validated against public data, 47 expert interviews

Cosmetics ODM Market Forecast Scenarios

cosmetics-odm-market-size-forecast-scenario-1790012676551
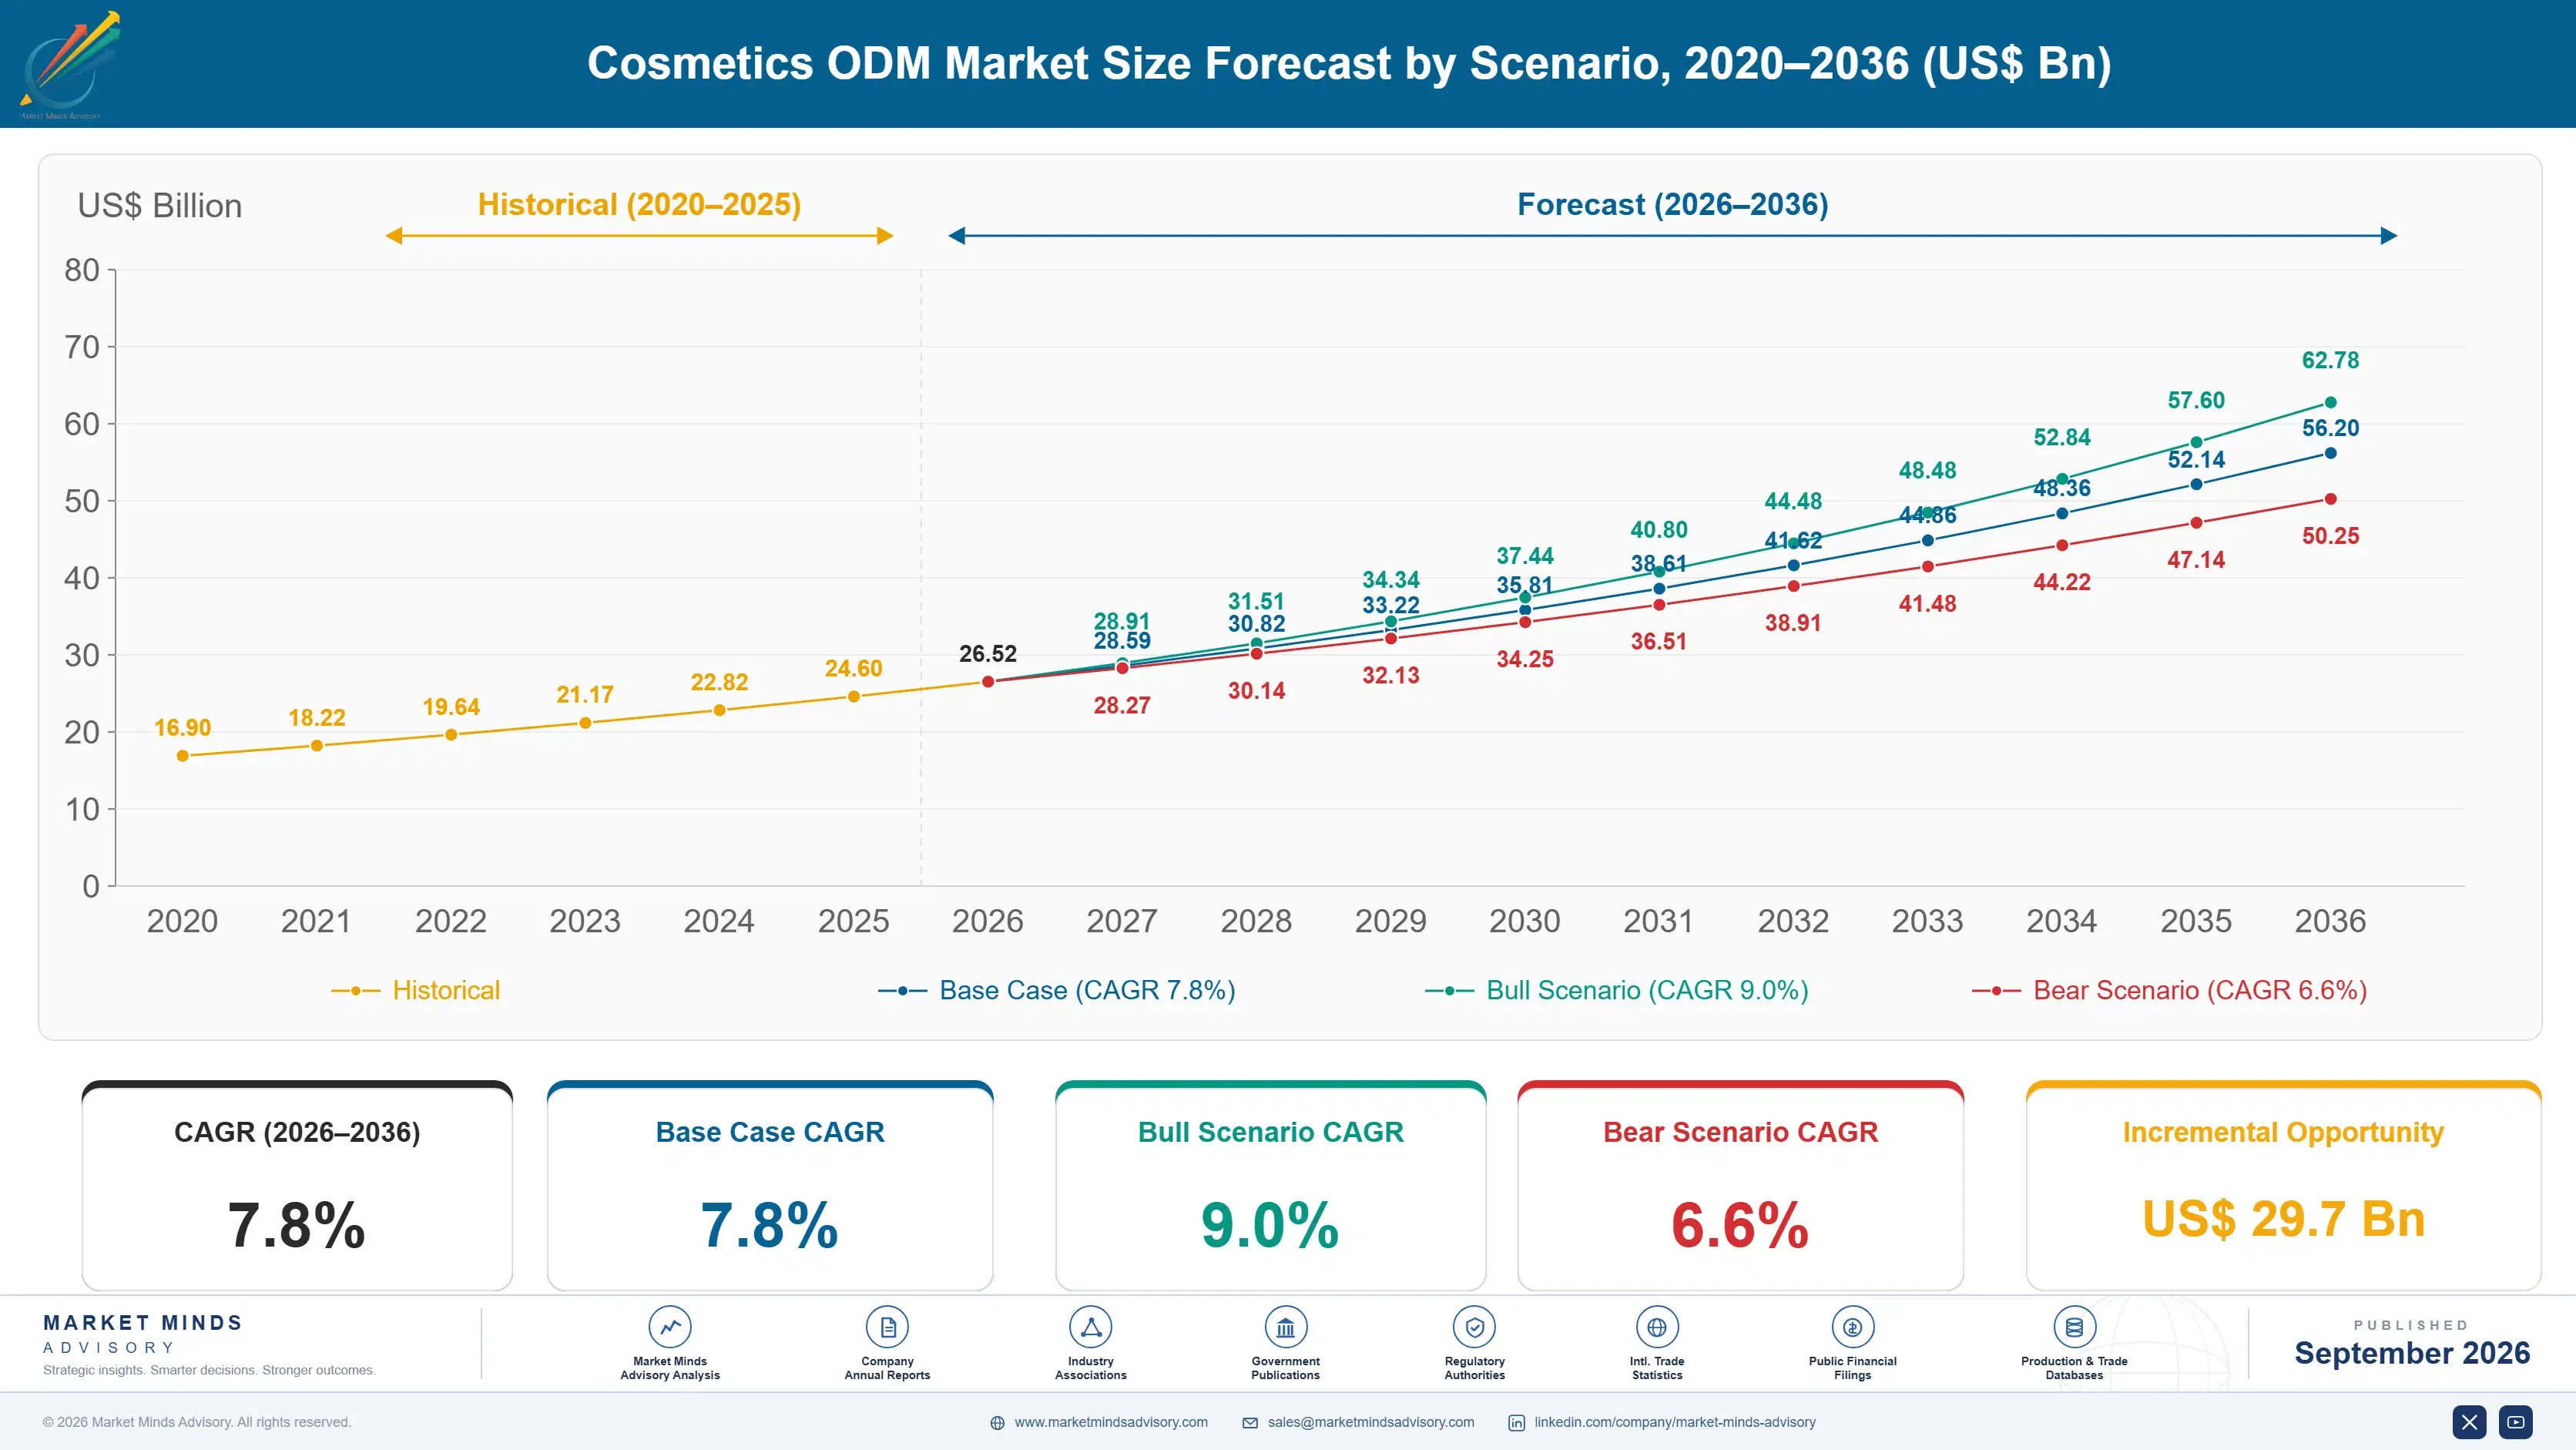
Between 2020 and 2025 this industry made the independent brand possible and then absorbed the consequences. Manufacturers dropped order minimums to capture a wave of new launches, which expanded the customer base enormously and compressed margins across the sector. Historical growth of 6.4% reflects rising volume against falling value per unit, and the two moved in opposite directions throughout the period.
The base case at 7.8% rests on three mechanisms. Regulatory dossier services grow because market registration requirements multiply and manufacturers already hold the documents. Low minimum order production keeps expanding as launches proliferate. And Asian manufacturing capacity continues absorbing work from brands headquartered elsewhere, since the formulation library and the packaging relationships both sit there rather than near the brand. None of the three depends on formulation novelty improving anywhere.
The bull case at 9.0% depends on dossier and registration services being priced properly rather than bundled into manufacturing quotes, which would lift margins on work manufacturers already perform. The bear case at 6.6% is minimum order competition continuing downward: every reduction captures launches and reduces value per unit, and several manufacturers have already reached order sizes that barely cover changeover.

Who Actually Owns The Product

The uncomfortable fact about beauty is that the manufacturer usually owns the product. Around 63% of launches use an existing formulation with adjusted fragrance, colour, and packaging, which is why so many independent brands are chemically similar to one another. The brand owns positioning, imagery, and audience. It rarely owns anything a chemist would recognise as proprietary. That is where the value genuinely sits.
TOP FIVE CONCENTRATION22%Share of service revenue held by the leading manufacturers
STOCK FORMULATION SHARE63%Launches built on existing formulations rather than new development
TIME TO MARKET4.6 monthsTypical interval from initial brief to finished product delivery
MINIMUM ORDER QUANTITY3,200 unitsMedian smallest production run accepted by leading manufacturers
DOSSIER OWNERSHIP SHARE71%Regulatory files held by the manufacturer rather than the brand
AVERAGE GROSS MARGIN23%Retained margin across formulation, manufacture and packaging combined
That arrangement is exactly what made the independent brand possible. A manufacturer holding stock formulations, regulatory dossiers, and packaging relationships can take a founder from brief to finished product in about 4.6 months, which collapsed a timeline that once ran into years. The same capability that enabled the wave also explains why so much of it looks alike on a shelf.
Order minimums decide who can play. Median accepted production runs have fallen to around 3,200 units as manufacturers competed for launches, which opened the market to brands that could never have reached previous thresholds. It also compressed sector margins toward 23%, because short runs consume changeover time that long runs amortise across far more units. Several manufacturers now accept orders that barely cover the setup involved in running them.
"Somebody should say plainly that a lot of independent beauty is the same base from the same three factories with a different fragrance and a better story. That is not a criticism of anybody. It is simply where the value sits, and the brands who understand it negotiate very differently."
Practice Director, Beauty Supply Chain and Contract Manufacturing · MMA Chemicals and Materials Practice · September 2026

Market Trends

Regulatory Dossiers Have Become The Real Lock-In

Product information files, safety assessments, and market registrations are held by the manufacturer in 71% of relationships, which means a brand changing factory must rebuild that documentation for every market it sells in. That is expensive, slow, and frequently decisive. Registration services grow at 11.7% as market requirements multiply, and manufacturers who price this work properly rather than bundling it into a manufacturing quote capture margin on something they already do. Most manufacturers still bundle it into a per-unit quote, which gives away the strongest position they hold. Registration work carries far better margins than filling.
Market Impact: Delivers in 4.6 months

Order Minimums Fell And Took Margins With Them

Median accepted runs have dropped to around 3,200 units as manufacturers competed for a wave of independent launches, which opened the market to founders who could never have met previous thresholds. It also compressed sector gross margins toward 23%, since short runs consume the same changeover, cleaning, and qualification time that long runs spread across far more units. Several manufacturers now accept orders that barely cover the setup involved. Capturing more customers has therefore made the sector less profitable rather than more, which nobody intended. Volume growth followed the reduction immediately.
Market Impact: Segment grows at 11.7%

Market Opportunities and Growth Drivers

Launch Speed Depends Entirely On Existing Libraries

A manufacturer holding stock formulations, cleared dossiers, and packaging relationships delivers a finished product roughly 4.6 months from brief, against timelines that once ran into years for anybody building from scratch. Indian growth of 12.4% leads every country covered, driven by domestic beauty brands launching at pace alongside manufacturing capacity that has expanded quickly to serve them. Speed rather than formulation novelty is what founders are actually buying. A manufacturer without a library competes on price against factories that can quote a finished product from an existing base. Libraries are the whole competitive asset.
Market Impact: Margins average just 23%

Registration Requirements Multiply Across Every Market

Selling a cosmetic in additional countries requires separate product information files, safety assessments, and registrations, and each one is work somebody must fund and own. Manufacturers already hold 71% of those documents and are best placed to extend them. Registration services grow at 11.7% accordingly, and they carry considerably better margins than filling and packing because the work is expertise rather than machine time. Manufacturers already hold most of those documents and extend them more cheaply than any brand could commission the work independently. Expertise rather than machine time earns it.
Market Impact: Covers 63% of launches

Market Restraints and Challenges

Short Runs Consume Margin Long Runs Amortise

Gross margins average 23% and median order quantities have fallen to around 3,200 units, and the root cause is that changeover, cleaning, and line qualification cost the same regardless of run length. Commercially this means capturing more customers has made the sector less profitable rather than more. Manufacturers respond with tiered pricing that reflects setup honestly, dedicated small batch lines, and premium charges for the flexibility founders actually want. Founders accept an explicit setup charge readily, since flexibility is precisely what they came for. Tiered pricing reflecting setup honestly is the obvious answer.
Market Impact: Manufacturers hold 71% of files

Formulation Similarity Undermines Brand Pricing Power

Around 63% of launches use existing formulations with adjusted fragrance and colour, and the root cause is that developing something genuinely new costs more and takes longer than most brands will fund. Commercially this leaves brands competing on narrative while their products converge, which eventually compresses retail prices and then manufacturer prices. Manufacturers respond by offering exclusivity periods, genuinely proprietary development tiers, and formulation ownership transfer at a price. Brands wanting genuine differentiation will pay for it once somebody explains what they are currently buying. Retail price compression works back to manufacturer pricing.
Market Impact: Minimums fell to 3,200 units
3 additional market trends, 4 additional growth drivers, and 2 additional restraints and challenges are covered in the full report. Contact sales@marketmindsadvisory.com to access the complete intelligence.

Segment CAGR and Growth Architecture

Segmentation follows service scope. Six categories cover the market: full service formulation and manufacture, stock formulation customisation, regulatory dossier and registration services, packaging development and sourcing, small batch and low minimum order production, and contract manufacture to a brand's own formula. Quality testing and stability work are counted within the service they support rather than separately.
cosmetics-odm-market-market-share-analysis-1790012677109

Regulatory Dossier And Registration Services

Dossier and registration services grow at 11.7%, half again the market rate of 7.8%, and they have quietly become the strongest commercial position in this industry. Manufacturers hold 71% of product information files, so a brand changing factory must rebuild documentation for every market it sells in, which is expensive enough to prevent most moves. The work is expertise rather than machine time, which means margins run well above filling and packing. Manufacturers still bundling it into a manufacturing quote are giving away their best asset. Each additional market a brand enters extends that position further without any competitive process. Rebuilding documentation market by market costs far more than any unit price difference recovers for a brand.
CAGR 11.7%

Small Batch And Low Minimum Order Production

Small batch production grows at 10.4% because it is what independent brands need and what the industry competed to provide. Median accepted runs fell to around 3,200 units, opening the market to founders who could never have met earlier thresholds, and volume growth followed immediately. The economics are worse than they look: changeover, cleaning, and qualification cost the same on a short run as a long one, which is why sector margins compressed toward 23% while customer counts rose sharply across every region. Manufacturers separating short run capacity from volume lines protect economics that mixed lines quietly destroy. Customer counts rose sharply across every region while margins fell. Setup cost is identical whatever the run length involved.
CAGR 10.4%
Full segment breakdown across 6 segments available in the complete report.

Regional Architecture and Country Demand Map

Regional shares record where products are developed and manufactured rather than where brands are headquartered, and those two diverge enormously. Four regions sit outside the standard bands, each for a reason named in its paragraph. Brand headquarters and factory location are almost never the same place.

East Asia

At 44% this region sits far above the standard band, and the justification is where the industry actually is: Korean and Chinese manufacturers develop and produce for brands headquartered across every other region, holding the formulation libraries, the packaging relationships, and most of the capacity. Korean manufacturers in particular set formulation trends that the rest of the industry follows within a year or two. Growth of 8.8% exceeds the world rate, and Japanese manufacturers add higher specification work at smaller volumes. Korean manufacturers set formulation trends the rest of the industry follows within a year or two, which is an advantage no capacity investment reproduces. Japanese manufacturers add higher specification work at smaller volumes and different price points entirely.
Share: 44% | CAGR: 8.8% (2026 to 2036)

South Asia and Pacific

At 15% this region sits above the standard band, driven by Indian growth of 12.4% that leads every country covered alongside expanding capacity across Indonesia, Thailand, and Vietnam. Indonesian manufacturers hold halal certification capability that serves a demand nobody else can address as credibly. Growth of 9.8% is the fastest of the seven regions. Domestic beauty brands are launching at pace, and much of the capacity added here serves those brands rather than export customers. Indonesian manufacturers hold halal certification capability that serves demand nobody else can address as credibly anywhere. Domestic beauty brands are launching at pace, and much added capacity serves them rather than export customers. Growth here leads every region covered.
Share: 15% | CAGR: 9.8% (2026 to 2036)
Regional intelligence for 5 additional markets available in the complete report: Western Europe, North America, Latin America, Middle East and Africa, Eastern Europe. Contact sales@marketmindsadvisory.com.
cosmetics-odm-market-country-cagr-analysis-1790012677652

Where Manufacturers Recover Real Margin

Four commercial moves separate manufacturers earning properly from those competing on order minimums until nothing remains. Each recognises that the manufacturer holds assets the brand does not, and that giving them away inside a per-unit quote wastes the strongest position in the relationship. Competing on minimums alone ends somewhere unpleasant for everybody. Somebody eventually stops.

Price Regulatory Work Separately From Manufacturing

Manufacturers hold 71% of product information files and perform the registration work already, yet most bundle it into a per-unit manufacturing quote where it disappears entirely. Those pricing dossier and registration services separately report gross margins 9 to 14 points above competitors who fold it into unit cost. The work is expertise rather than machine time, and it also creates the switching cost that keeps the account when a cheaper factory appears. Every additional market a brand enters extends that position further, without any competitive process at all. Registration is expertise work.
Market Impact: Lifts gross margins by 9 to 14 points

Charge Honestly For Short Run Changeover

Median order quantities fell to around 3,200 units and changeover, cleaning, and qualification cost the same whatever the run length, which is why sector margins compressed toward 23% as customer counts rose. Manufacturers pricing setup explicitly rather than absorbing it into unit cost hold margins 7 to 12 points higher on small batch work. Founders accept the charge readily, because flexibility is what they came for and they know it costs something. Absorbing setup into unit cost hides a loss that compounds with every small account accepted. Flexibility is what they came for.
Market Impact: Holds margins 7 to 12 points higher overall

Sell Exclusivity Rather Than Repeating Formulations

Around 63% of launches use existing formulations, which eventually converges the market and compresses prices for everybody in it including the manufacturer. Offering exclusivity periods and genuinely proprietary development at a stated premium converts a commodity relationship into a development one, and manufacturers doing so report contract values 2.6 times higher. Brands that want differentiation will pay for it once somebody explains clearly what they are and are not currently buying. Convergence eventually compresses retail prices and works back to manufacturer pricing within a couple of cycles. Few manufacturers open that conversation.
Market Impact: Raises contract values by 2.6 times over library

Build Registration Coverage Ahead Of Brand Expansion

Each additional market a brand enters requires separate files, assessments, and registrations, and manufacturers already holding coverage capture that work without competition. Those maintaining dossiers across many jurisdictions retain 3.1 times more of a customer's international expansion than manufacturers registered in one market only. The brand cannot easily take that elsewhere, since rebuilding documentation market by market costs far more than any unit price difference could recover. Rebuilding documentation market by market costs far more than any unit price difference could ever recover. The brand cannot easily take that work elsewhere at all.
Market Impact: Retains 3.1 times more of a customer expansion

Who Controls the Margin Pool

Concentration is remarkably low. Five manufacturers hold 22% of service revenue, measured consistently on that basis across all participants, and thousands of smaller operations serve regional brands and short runs. Scale confers advantages in formulation library breadth and regulatory coverage rather than in unit cost, which is why the largest participants are not the cheapest ones.
Competition currently turns on three things: formulation library depth, which determines how fast a brand can launch; regulatory dossier coverage across the markets a brand intends to enter; and order minimum flexibility, which decides whether a founder can work with the manufacturer at all. Unit price matters at volume and considerably less below it. Speed to a finished product decides most independent brand awards, since founders are buying a launch date rather than a formulation nobody else could produce.

Pressure comes from two directions. Regional manufacturers undercut on short runs where shipping and lead time favour proximity. Meanwhile the largest Korean and Chinese participants set formulation trends the rest of the industry follows. Rankings will shift toward manufacturers who monetise dossiers and development rather than competing on price per unit. Capacity-only manufacturers hold the weakest position.
cosmetics-odm-market-company-positioning-matrix-1790012678178

Competitive Moat and Risk Dimensions

COSMAX

Moat: Formulation Library And Trends

A formulation library built across thousands of launches lets the company deliver from brief to finished product faster than anybody starting from a specification, and it sets textures and formats the wider industry adopts a year or two later. Brands buy speed and current relevance rather than novelty, and both come from that accumulated library.
COSMAX

Risk: Margin Compression From Minimums

Competing for independent brand launches by accepting ever smaller runs expands the customer base while consuming changeover capacity that longer runs would amortise. Sector margins near 23% reflect that trade directly, and reversing it means declining work competitors will happily accept instead. Nobody declines that work willingly.
INTERCOS

Moat: Prestige Colour Cosmetics Development

Development capability in colour cosmetics for prestige brands requires pigment expertise, texture work, and packaging integration that volume skincare manufacture does not build, and proximity to European brand development teams supports iteration those brands expect. That combination is difficult to replicate from a cost base optimised for volume.
INTERCOS

Risk: Cost Position Against Asian Capacity

European manufacturing costs sit well above Asian equivalents for any product that ships economically, and brands under margin pressure move volume categories eastward while keeping only development work local. Defending share means staying in categories where iteration speed and proximity genuinely outweigh unit cost. That is a narrowing set of categories.

Players Tracked

Prominent Players

Cosmax
Kolmar Korea
Cosmecca Korea
Intercos
Nox Bellcow

Other Key Players

Ancorotti Cosmetics
Chromavis
Fareva
Mibelle Group
Maesa
Bawei Biotechnology
Toyo Beauty
Nihon Kolmar
Cosmo Beauty
Albea
Quadpack
Vitalabs
Voyant Beauty
Cosmetic Solutions
Tropical Products

Recent Developments

FEBRUARY 2026

Cosmax Opens Dedicated Low Minimum Order Production Line

Cosmax commissioned a dedicated small batch line, an organic capacity investment funded internally, separating short run changeover from volume production so that flexible orders no longer consume capacity longer runs would amortise properly. Changeover, cleaning, and qualification consume the same time on a short run as a long one.
Signal: Separating short run capacity protects margins that mixed lines quietly destroyed. Founders will pay for flexibility.
SEPTEMBER 2025

Intercos Acquires Cosmetic Regulatory Services Firm For Dossier Coverage

Intercos completed an acquisition of a cosmetic regulatory services firm, extending product information file and registration coverage across markets where its brand customers were expanding without existing documentation support. Brands cannot easily move documentation between manufacturers, since it must be rebuilt for every market they sell into.
Signal: Dossier coverage is being bought because it holds accounts more firmly than pricing does. Switching cost beats price.
MAY 2025

Kolmar Korea Signs Development Agreement With Global Beauty Group

Kolmar Korea entered a multi-year development and supply agreement with a global beauty group covering exclusive formulations rather than library products, with no acquisition or equity investment involved in the arrangement. Library formulations are available to any customer, which is precisely what an exclusive development agreement removes for the buyer.
Signal: Exclusivity commands premiums that repeated library formulations never will. Differentiation is purchasable, and brands increasingly pay for it.

What Making Somebody's Brand Costs

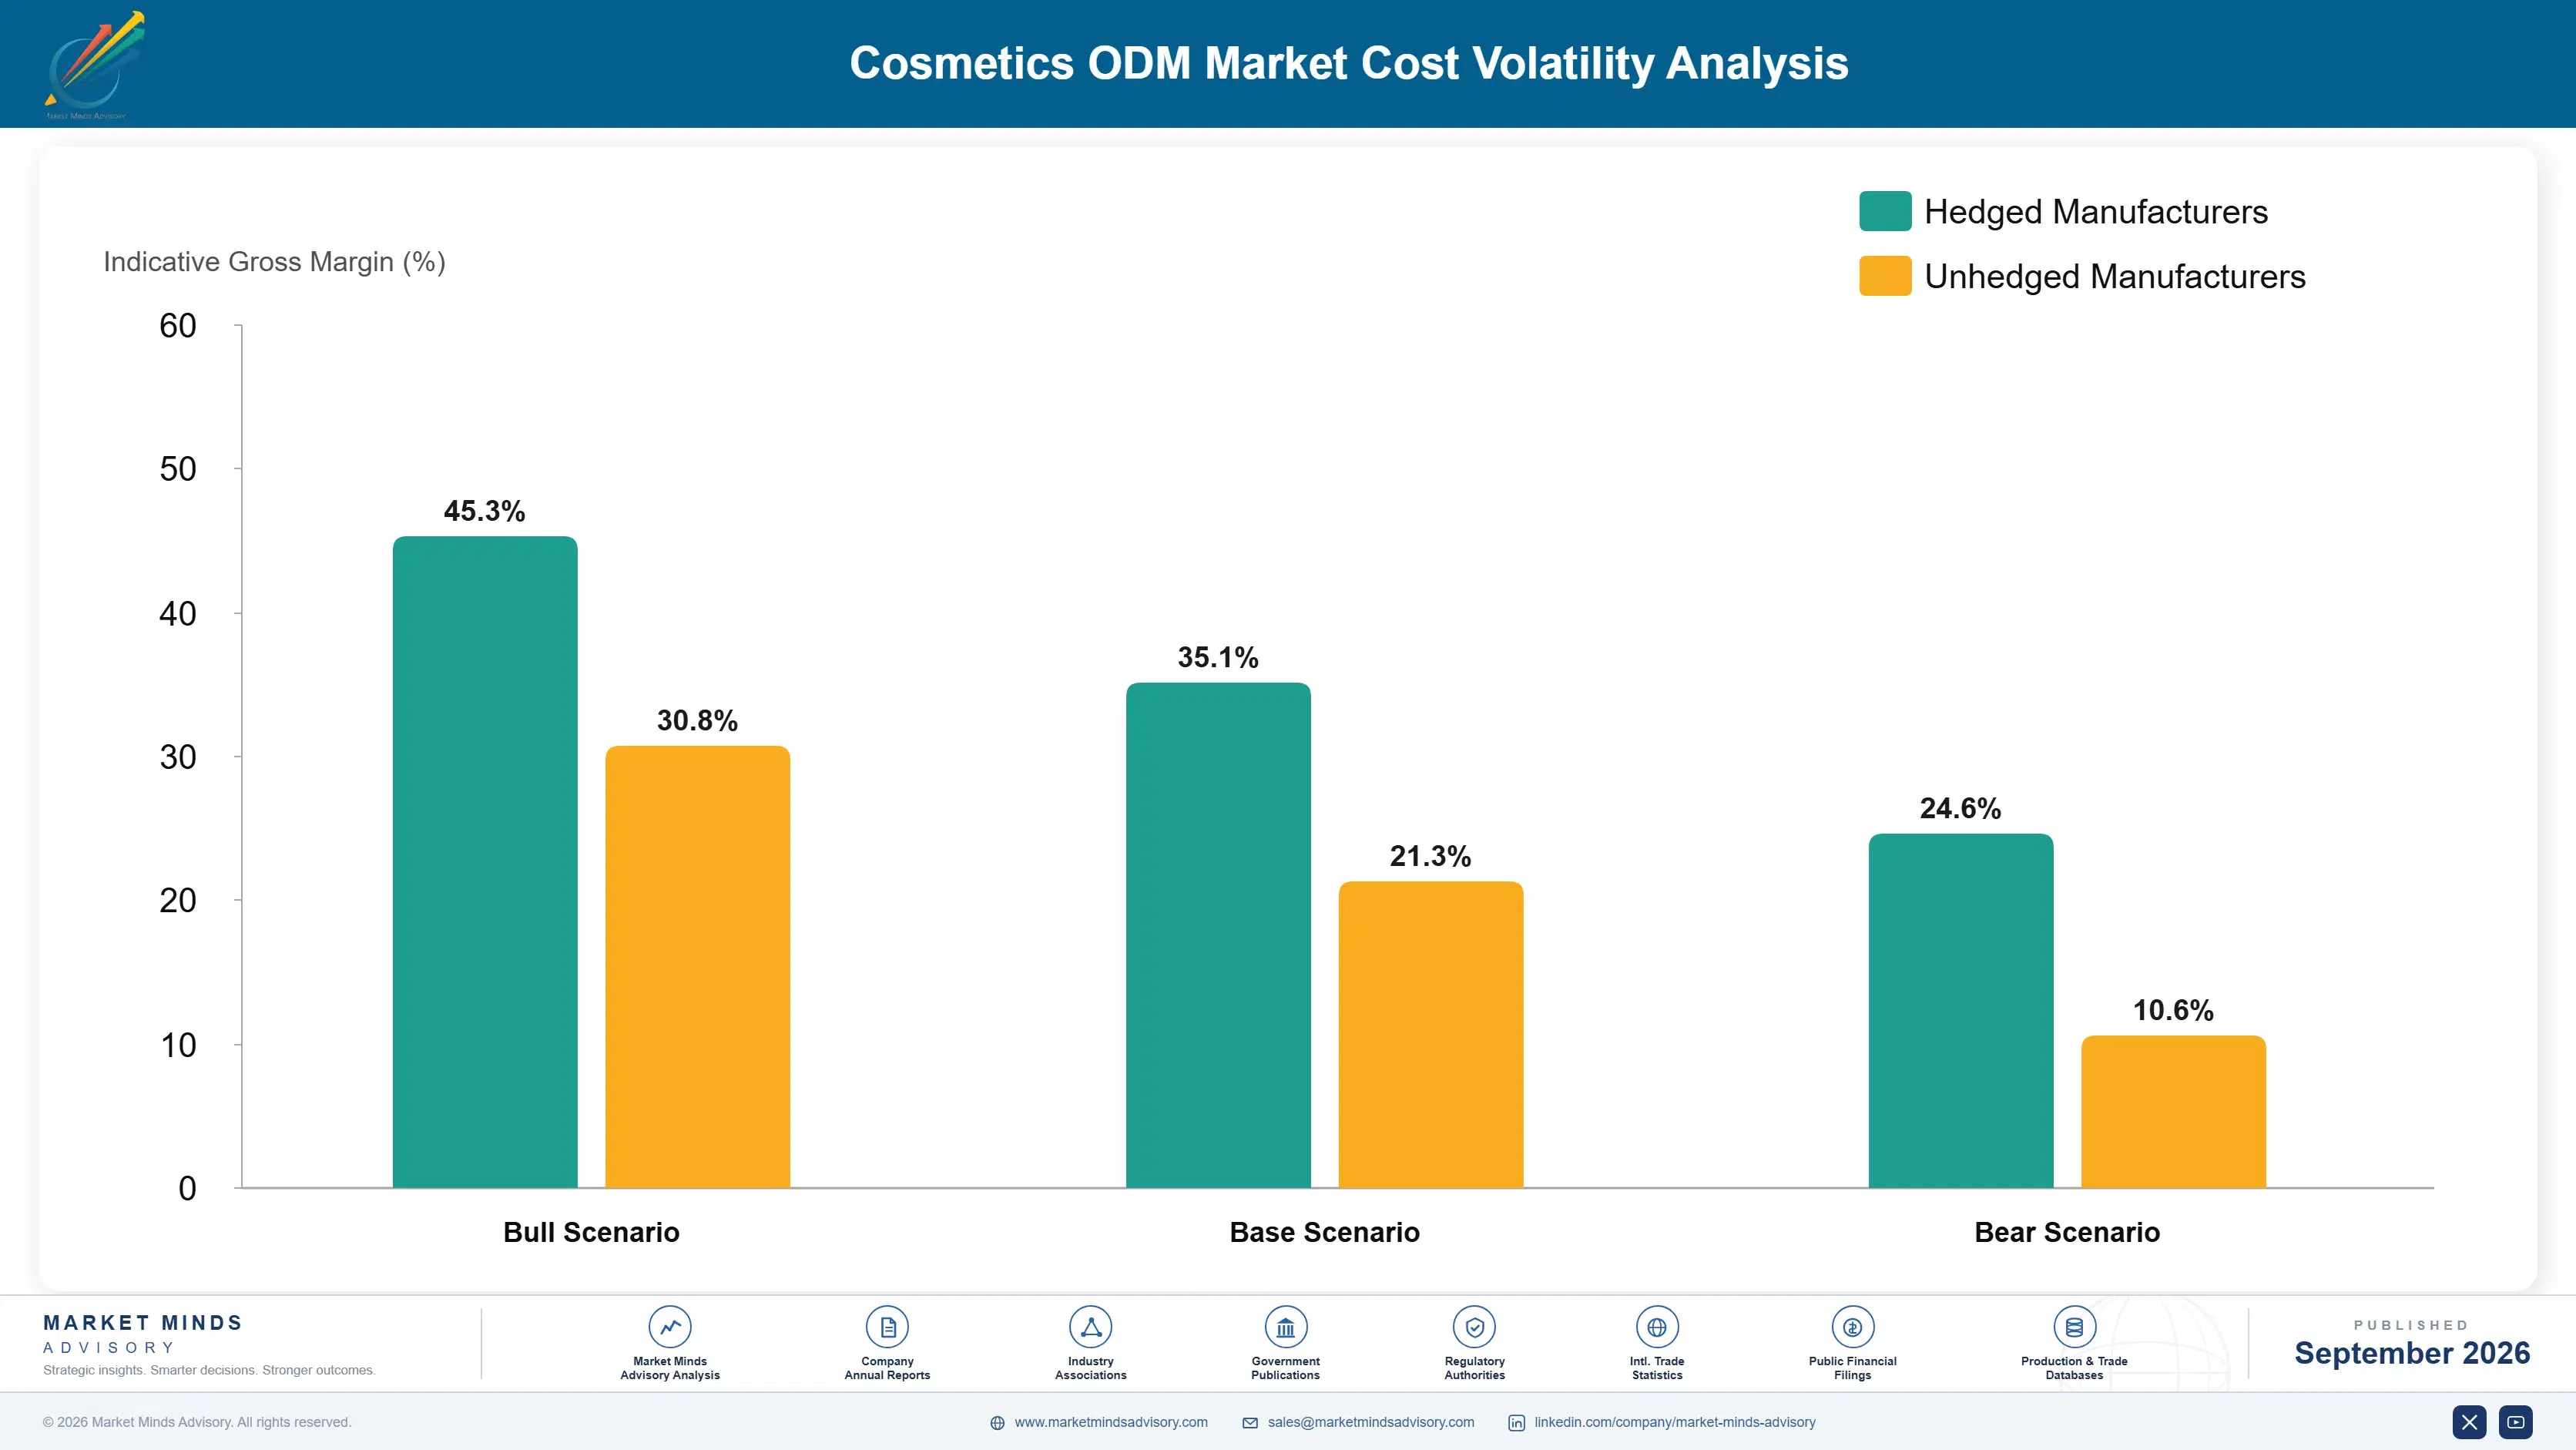
Three input groups dominate cost. Raw materials and actives run 34% to 42% of cost of goods sold, and the range widens considerably between a basic emulsion and something carrying meaningful active concentrations. Packaging components take 26% to 34%, frequently exceeding what goes inside them. Labour, filling, quality assurance, and changeover add 20% to 28%, rising sharply as order quantities fall.
Packaging component and specialty active prices moved through 2024 and 2025 as demand from a proliferating brand population competed for the same supply, and several manufacturers described margin pressure in their annual reports for those years. Cosmetics Europe guidance on safety assessment documentation over the same period added regulatory workload that manufacturers largely absorbed rather than pricing separately from their manufacturing quotes. Regulatory workload rose without a corresponding price adjustment.

The competitive disadvantage mechanism runs through order economics rather than manufacturing efficiency. A manufacturer running short orders on lines built for volume consumes changeover time that no unit price recovers, and the loss compounds with every additional small customer accepted. Exposure varies sharply by manufacturer type: those with dedicated small batch capacity price flexibility properly, while those mixing runs quietly subsidise their smallest accounts.
cosmetics-odm-market-cost-volatility-analysis-1790012678374

Separate Small Batch Capacity From Volume Lines

Short runs on lines built for volume consume changeover and cleaning time that unit pricing never recovers, and the loss compounds with every small account taken on. Dedicated small batch capacity lets a manufacturer serve founders profitably while protecting the volume economics that fund the business, rather than quietly subsidising one with the other.

Price Regulatory Documentation As A Service

Product information files and registrations are expertise rather than machine time, and bundling them into a per-unit quote hides work that carries considerably better margins than filling. Charging separately also makes the switching cost visible to the brand, which is the strongest retention asset a manufacturer holds and most currently give away. Most manufacturers give it away.

Standardise Packaging Across Formulation Families

Packaging frequently costs more than the formulation inside it, and every bespoke component adds tooling, qualification, and minimum order exposure the manufacturer carries. Standard component families across formulation types concentrate purchasing, shorten development, and let brands differentiate through decoration rather than through tooling nobody amortises. Decoration differentiates more cheaply than tooling does. Nobody amortises bespoke tooling properly.

Portfolio Architecture for Margin Defence

Margin follows what the brand cannot obtain elsewhere. Contract manufacture to a brand's own formula is close to commodity, since the manufacturer contributes capacity alone and any competent factory can quote. Stock formulation work earns moderately. Exclusive development and regulatory dossier services earn most, because one creates something the brand genuinely owns and the other creates a switching cost nothing else matches. What the brand cannot obtain elsewhere decides this hierarchy entirely.
The tension between volume and premium runs through what the brand is buying. A founder needs speed, a small run, and something adequate on shelf within a quarter, and compares manufacturers on minimums and lead time. An established group commissioning exclusive development compares formulation capability and intellectual property terms, and pays accordingly for both. The two buyers behave nothing alike in negotiation.

High-value pools concentrate where the manufacturer contributes something proprietary: exclusive formulation development, multi-market regulatory coverage, and technically difficult formats that few factories can produce reliably. Where the work is filling a known formula into standard packaging, price per unit decides everything and thousands of manufacturers can quote it competently. Thousands of factories quote that work.

Volume / Commodity-Adjacent

Contract manufacture to a brand's own formula in standard packaging, where the manufacturer contributes capacity alone and any competent factory can quote. The eight-point range reflects scale and location rather than any capability difference between the participants.
Gross Margin: 12% to 20%

Premium / Certified

Stock formulation customisation and packaging development where library depth and speed to market decide the award. The ten-point range separates manufacturers with dedicated small batch capacity from those running short orders across volume lines.
Gross Margin: 22% to 32%

Sustainability / Regulatory / Next-Generation

Exclusive formulation development and multi-market regulatory dossier services, where the manufacturer contributes intellectual property or documentation the brand cannot readily replace. The fourteen-point range reflects registration coverage breadth and exclusivity terms offered.
Gross Margin: 34% to 48%
cosmetics-odm-market-portfolio-architecture-1790012678872

High-value Sub-segments and Strategic Watch-out

Regulatory Dossier Services

Highest value in the industry, growing at 11.7% and creating switching costs no pricing strategy matches, since manufacturers hold 71% of files. The fourteen-point range reflects how many jurisdictions each manufacturer maintains registration coverage across. Most manufacturers still bundle it into unit price. Expertise rather than machine time earns it.
Gross Margin: 36% to 50%

Exclusive Development Programmes

High value converting commodity relationships into development ones, with contract values well above library formulation work. The twelve-point range reflects exclusivity terms and whether formulation ownership transfers to the brand at any agreed point. Brands pay once the choice is explained clearly. Ownership transfer can be priced separately.
Gross Margin: 32% to 44%

Dedicated Small Batch Production

Volume core growing at 10.4% and profitable only where changeover capacity is separated from volume lines properly. The ten-point range separates manufacturers pricing setup explicitly from those absorbing it silently into per-unit quotations. Mixed lines quietly subsidise the smallest accounts. Dedicated capacity is what makes it profitable.
Gross Margin: 24% to 34%

Own Formula Contract Filling

The strategic watch-out. The manufacturer contributes capacity alone, thousands of factories can quote, and no switching cost exists in either direction. The eight-point range reflects location and scale rather than anything commercially defensible. No switching cost exists in either direction. Any competent factory can quote this work.
Gross Margin: 10% to 18%

How This Revenue Repeats

Revenue recurs through repeat production orders while a brand's product sells, which makes it dependent on the brand's own success rather than on anything the manufacturer controls. Independent brands fail frequently, so a manufacturer serving many small accounts carries constant churn. Regulatory and development work recurs differently, arriving whenever a brand enters a market or refreshes a range, and it is far less sensitive to any single product's performance.
Attachment depth follows documentation rather than satisfaction. A brand whose product information files, safety assessments, and registrations sit with the manufacturer faces rebuilding all of them per market to move, which costs more than any unit price saving recovers. A brand that owns its dossiers and its formula can move on price at the next order, and increasingly some of them do.

The buyer has changed shape entirely. This was an industry serving a modest number of large brand groups with long planning cycles and substantial orders. It now serves thousands of small brands wanting short runs and quick turnarounds alongside those groups, which requires different capacity, different commercial terms, and a tolerance for churn the industry did not previously need.
cosmetics-odm-market-end-use-penetration-index-1790012679367

Where This Market Rewards

These are among the four positions where our research anticipates prominent divergence between winners and laggards over the coming forecast period. Each is grounded in the demand model, the regulatory perimeter, and the announced capacity pipeline.
01 / DOSSIER MONETISATION DISCIPLINE

Stop giving away the strongest asset

Manufacturers hold 71% of product information files and already perform the registration work, yet most fold it into a per-unit manufacturing quote where it vanishes into unit cost entirely. Those pricing it separately report gross margins 9 to 14 points above competitors who do not. The work is expertise rather than machine time, and it creates the switching cost that holds an account when a cheaper factory appears, and every additional market extends that position without competition, which is why it holds accounts better than pricing ever does.
02 / CHANGEOVER COST HONESTY

Short runs cost what they cost

Median order quantities fell to around 3,200 units while changeover, cleaning, and qualification cost the same regardless of run length, which compressed sector margins toward 23% as customer numbers rose. Manufacturers pricing setup explicitly hold margins 7 to 12 points higher on small batch work than those absorbing it. Founders accept the charge readily, since flexibility is precisely what they came for, and they know perfectly well that it costs something to provide, and absorbing it silently compounds a loss with every account.
03 / EXCLUSIVITY PREMIUM SELLING

Convergence eventually hurts the factory too

Around 63% of launches use existing formulations, which converges the market, compresses retail prices, and works back to manufacturer pricing within a couple of cycles. Offering exclusivity periods and proprietary development at a stated premium produces contract values 2.6 times higher than repeated library work. Brands wanting genuine differentiation will pay once somebody explains clearly what they are currently buying instead, which is a conversation surprisingly few manufacturers are willing to open, and convergence eventually reaches manufacturer pricing as well.
04 / REGISTRATION COVERAGE BUILDING

Follow the brand into every market

Each additional country a brand enters requires separate files, assessments, and registrations, and a manufacturer already holding coverage captures that work without any competitive process at all. Those maintaining dossiers across many jurisdictions retain 3.1 times more of a customer's international expansion. The brand cannot easily move it, because rebuilding documentation market by market costs far more than unit price differences recover, which makes this the most durable position in the whole industry, and no unit price difference recovers what rebuilding documentation costs.

Engagement Snapshot From the Field

A live engagement with an industry participant carrying material or product regulatory and market exposure ahead of a defining policy shift, showing how our research translates into a defensible multi-year portfolio strategy.
MARKET MINDS ADVISORY · CLIENT ENGAGEMENT SUMMARY
Cosmetics ODM Producer Strategic Portfolio Review and Transition Roadmap 2026·Investment Scenario on Cosmetics ODM Exposure Evaluation 2025-26
CLIENT PROFILE
An independent skin care brand selling across four markets with annual revenue near USD 41 million, manufacturing entirely through one Korean partner at a cost of roughly USD 12 million (client-reported, unverified by MMA). The founders believed their core formulations had been developed exclusively for them. The agreement had not been reviewed since the first production run.
STRATEGIC CHALLENGE
A competitor had launched a product the team believed was chemically identical to their bestseller, and an investor had asked what intellectual property the brand actually owned. Nobody had examined the manufacturing agreement closely since it was signed four years earlier during the brand's first production run. Nobody had checked what the contract said.
MMA APPROACH
MMA reviewed the manufacturing agreement against what the brand believed it held, traced ownership of formulations and regulatory documentation, and compared the brand's core products against library formulations the manufacturer offered to other customers in the same categories. Switching cost was quantified including documentation, stability testing, and requalification across all four markets.
KEY FINDINGS
  1. Three of the brand's four core products used library formulations available to any customer, with differences limited to fragrance, colourant, and packaging specification.
  2. The manufacturer held product information files and registrations for all four markets, so changing partner would have required rebuilding documentation in each of them.
  3. The agreement contained no exclusivity provision of any kind, and the competitor product was confirmed as the same base formulation with a different fragrance.
  4. Switching manufacturer was estimated at roughly nine months and USD 1.8 million once documentation, stability testing, and requalification were counted properly. Nobody had estimated that before.
CLIENT PROFILE
An independent skin care brand selling across four markets with annual revenue near USD 41 million, manufacturing entirely through one Korean partner at a cost of roughly USD 12 million (client-reported, unverified by MMA). The founders believed their core formulations had been developed exclusively for them. The agreement had not been reviewed since the first production run.
STRATEGIC CHALLENGE
A competitor had launched a product the team believed was chemically identical to their bestseller, and an investor had asked what intellectual property the brand actually owned. Nobody had examined the manufacturing agreement closely since it was signed four years earlier during the brand's first production run. Nobody had checked what the contract said.
MMA APPROACH
MMA reviewed the manufacturing agreement against what the brand believed it held, traced ownership of formulations and regulatory documentation, and compared the brand's core products against library formulations the manufacturer offered to other customers in the same categories. Switching cost was quantified including documentation, stability testing, and requalification across all four markets.
KEY FINDINGS
  1. Three of the brand's four core products used library formulations available to any customer, with differences limited to fragrance, colourant, and packaging specification.
  2. The manufacturer held product information files and registrations for all four markets, so changing partner would have required rebuilding documentation in each of them.
  3. The agreement contained no exclusivity provision of any kind, and the competitor product was confirmed as the same base formulation with a different fragrance.
  4. Switching manufacturer was estimated at roughly nine months and USD 1.8 million once documentation, stability testing, and requalification were counted properly. Nobody had estimated that before.
RECOMMENDED STRATEGY
Phase 1: Phase one: negotiate exclusivity on the bestselling formulation at a stated premium rather than attempting to move manufacturer from a weak position. Phase 2: Phase two: take ownership of product information files and registrations progressively, funding the transfer rather than leaving switching cost with the partner. Phase 3: Phase three: commission genuinely proprietary development for the next flagship product, accepting longer timelines for something the brand can defend.
OUTCOME
Exclusivity was secured on two formulations at an 11% unit price premium (client-reported, unverified by MMA). Dossier ownership transferred across three markets within a year. The next flagship launched on proprietary development at a materially higher gross margin. Investor concerns about intellectual property were resolved within the year.

Frequently Asked Questions

Foundational context covering the market sizes, CAGR, scope, country, region and competition that inform every finding below. This section is provided to cover basics and most often pre-purchase conversations, answered from the MMA Primary Research Dataset.

What is the current size of the Cosmetics ODM Market?

The market was worth USD 24.6 billion in 2025 and reaches USD 26.5 billion in 2026. Value covers third-party development and manufacture of finished cosmetic products.

How large will the Cosmetics ODM Market be by 2036?

MMA forecasts USD 56.2 billion by 2036, an increase of USD 29.7 billion across the forecast period. That represents 2.12 times the 2026 base of USD 26.5 billion.

What is the CAGR for the Cosmetics ODM Market 2026 to 2036?

The base case compound annual growth rate is 7.8%, with a bull case at 9.0% and a bear case at 6.6%. Historical growth from 2020 to 2025 ran at 6.4%.

Which segment is growing fastest?

Regulatory dossier and registration services grow at 11.7%, half again the market rate of 7.8%. Manufacturers hold most product files, which creates real switching costs.

Who are the major companies in the Cosmetics ODM Market?

Cosmax, Kolmar Korea, Cosmecca Korea, Intercos, and Nox Bellcow lead, together holding just 22% of service revenue. Thousands of smaller manufacturers hold all the remainder.

Which country is growing fastest?

India grows at 12.4%, driven by domestic beauty brands launching at pace alongside manufacturing capacity that has expanded quickly to serve them across the country.

Report Segmentation Architecture

The full report scope spans multiple orthogonal segmentation dimensions, with cross-tabulated demand data provided for each dimension pair. Coverage extends further to regional breakdowns, trend trajectories, and the competitive detail needed to support segment-level decision-making.

By Service Scope

  • Full Service Formulation and Manufacture
  • Stock Formulation Customisation
  • Regulatory Dossier and Registration Services
  • Packaging Development and Sourcing
  • Small Batch and Low Minimum Order Production
  • Contract Manufacture to Brand Formula

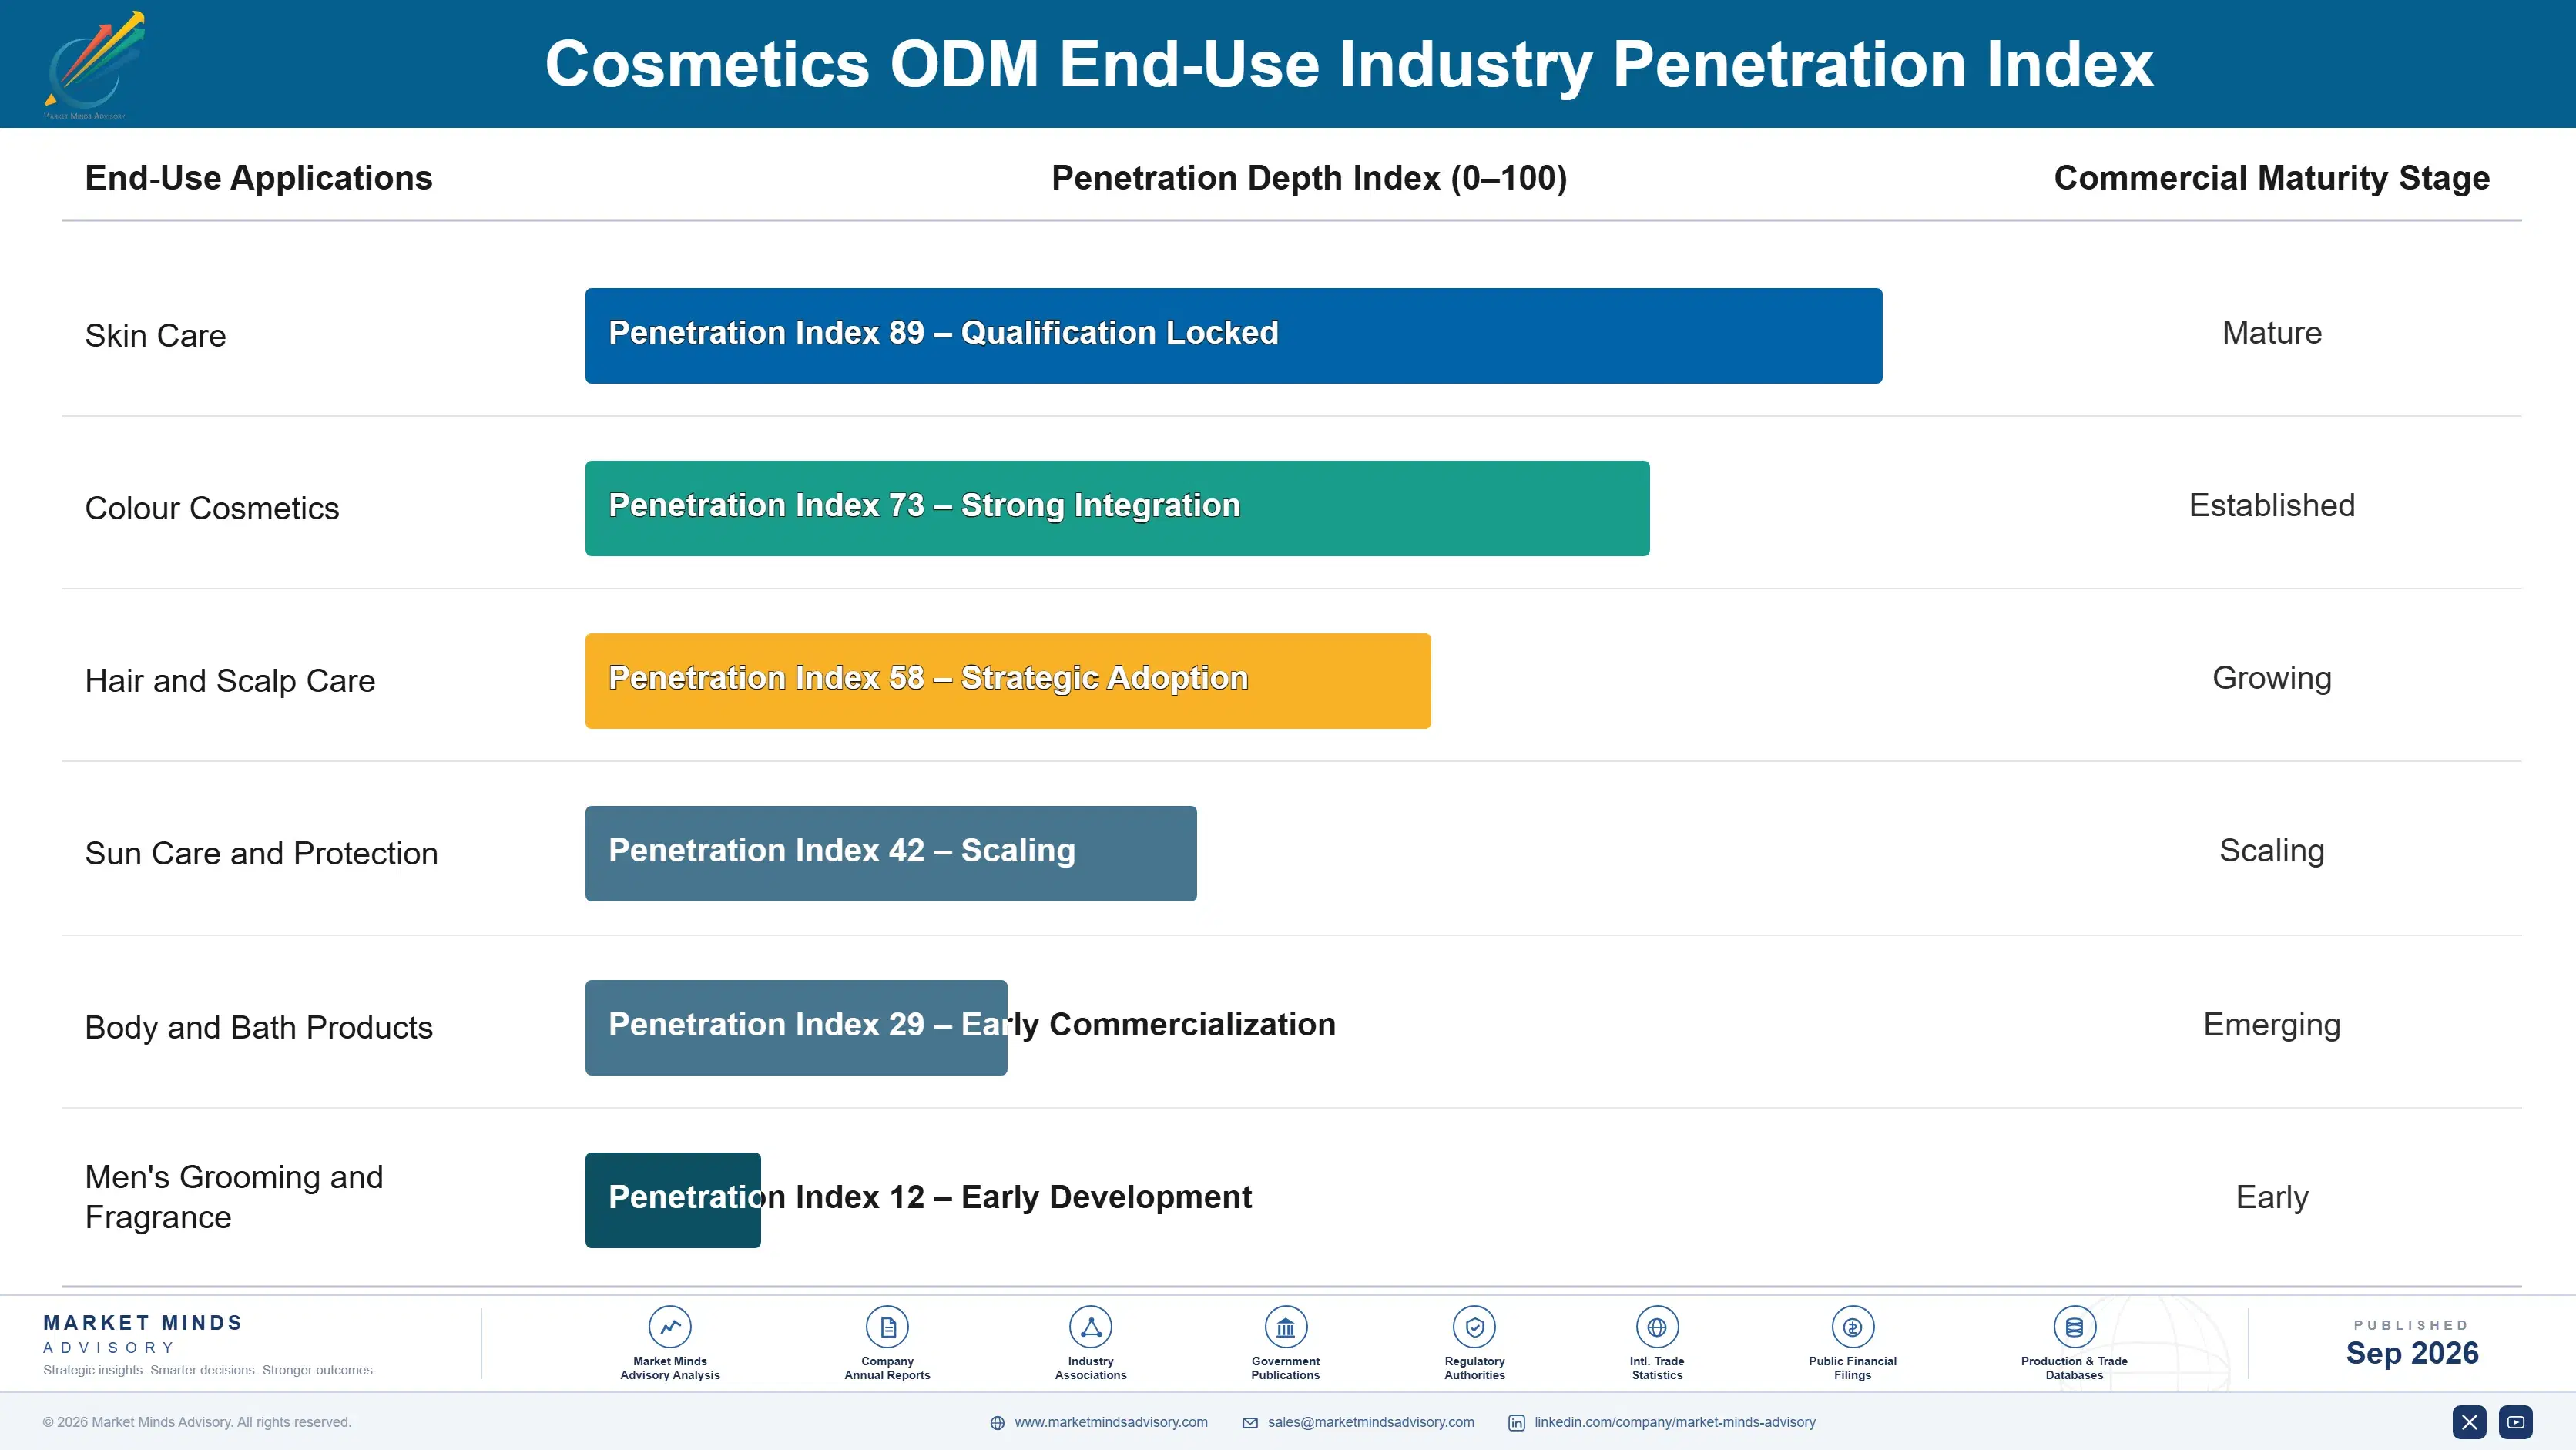
By End-Use Industry

  • Skin Care
  • Colour Cosmetics
  • Hair and Scalp Care
  • Sun Care and Protection
  • Body and Bath Products
  • Men's Grooming and Fragrance

By Commercial Dimension

  • Global Brand Group Contract
  • Independent Brand Programme
  • Retailer Private Label Supply
  • Exclusive Development Agreement
  • Regulatory Services Retainer
  • Distributor Led Brand Creation

By Region

  • East Asia
  • South Asia and Pacific
  • Western Europe
  • North America
  • Latin America
  • Middle East and Africa
  • Eastern Europe

Scope, Methodology, and Coverage

Every figure in this report is reproducible from documented input assumptions. The scope below maps the historical period, the forecast horizon, the segmentation dimensions, and the countries covered, alongside the underlying primary and qualitative methodology.
Historical Period
2020 to 2025
Forecast Period
2026 to 2036
Base Year
2025 (USD billions; MMA Primary Research Dataset, September 2026)
Market Definition
This market covers third-party development and manufacture of finished cosmetic and personal care products, including full service formulation and manufacture, stock formulation customisation, regulatory dossier and registration services, packaging development and sourcing, small batch and low minimum order production, and contract manufacture to a brand's own formula. It excludes raw material supply, packaging components sold separately, brand-owned manufacturing, and retail or distribution services.
Quantitative Units
USD billions, service and finished product revenue
Segmentation Dimensions
Service scope, end-use industry, commercial dimension, region
Regions Covered
East Asia, South Asia and Pacific, Western Europe, North America, Latin America, Middle East and Africa, Eastern Europe
Countries Covered
South Korea, China, Japan, Taiwan, India, Indonesia, Thailand, Vietnam, Malaysia, Australia, Italy, France, Germany, Spain, United Kingdom, Switzerland, Poland, Czechia, United States, Canada, Mexico, Brazil, Colombia, Chile, Argentina, Saudi Arabia, United Arab Emirates, Egypt, Nigeria, South Africa
Key Companies Profiled
Cosmax, Kolmar Korea, Cosmecca Korea, Intercos, Nox Bellcow, Ancorotti Cosmetics, Chromavis, Fareva, Mibelle Group, Maesa, Bawei Biotechnology, Toyo Beauty, Nihon Kolmar, Cosmo Beauty, Albea, Quadpack, Vitalabs, Voyant Beauty, Cosmetic Solutions, Tropical Products
Quantitative Methodology
Primary survey, n=3,800 respondents, Q4 2025, six countries; demand-side model with trade association cross-validation
Qualitative Methodology
47 expert interviews, Q4 2025; applied to validate demand model assumptions, identify emerging dynamics, and assess competitive positioning
Report Format
PDF and XLSX data workbook (Word format preview document)
Publisher
Market Minds Advisory
Report Code
MMA-2026-CHM-951
Published
September 2026
Contact
sales@marketmindsadvisory.com | www.marketmindsadvisory.com

Purchase the full Cosmetics ODM Market Report (2026 to 2036).

The full report sizes the cosmetics original design manufacturing market across six service scopes, seven regions, and thirty countries, with forecasts to 2036 under base, bull, and bear cases. It examines why most launches use existing formulations, how falling order minimums expanded the customer base while compressing sector margins, and why regulatory dossier ownership has become the strongest retention asset manufacturers hold. Competitive analysis covers twenty participants evaluated consistently on service revenue, with detailed treatment of library depth and registration coverage. Cost structure, margin architecture, and regional manufacturing patterns are analysed throughout. Primary research includes 3,800 survey responses and 47 expert interviews.
Six service scopes sized and forecast separately
Twenty participants evaluated on service revenue consistently
Regional manufacturing concentration mapped across seven distinct geographies
Margin architecture by service scope and switching cost created
Order minimum economics benchmarked against changeover and margin outcomes
Dossier ownership analysed across brand and manufacturer relationships

Built For The People Who Decide

From boardroom strategy to bench-side execution, this report is read cover-to-cover by leaders shaping the next decade of their industry, turning demand scenarios, market dynamics and valuation benchmarks into decisions.
CXOs/ Presidents/ VPs/ Managers
M&A and Corporate Development
Strategy Teams and R&D Heads
Procurement and Product Directors
Regulatory and Compliance Leaders
Investor Relations and Equity Analysts