Market Minds Advisory
Cosmetic Ingredients Market

Cosmetic Ingredients Market: Claims Substantiation, Preservative Attrition, and Where Value Concentrates Against Volume

Brands no longer buy molecules, they buy clinical evidence and a story a regulator will accept, which is why active ingredients take a fifth of market value on a rounding error of volume.

Lead Analyst

Bilal Shaikh

Published

September 2026

Make Smarter Decisions with Customized Research Insights

Request a free sample report and evaluate market opportunities, growth trends, and competitive dynamics relevant to your business needs.

2025 MARKET VALUE$13.4BMarket Size 2025
2036 FORECAST VALUE$26.8BBase Case , 2026 to 2036
CAGR 2026 TO 20366.5 %Bull 7.7% / Bear 5.2%
INCREMENTAL OPPORTUNITY$12.5BNet 10- year value creation
EXPANSION MULTIPLE1.88x2036 value over 2026 base
Strategic Levers
M&A Pipeline
Regional Outlook
Country Rankings
Competitive Intelligence
Segmental Deep-dive
Call-Us : 91 93563 13602

Executive Snapshot and Market Trajectory

Cosmetic ingredient suppliers stopped selling chemistry some years ago. What a brand buys now is a clinical study, a regulatory dossier, a sustainability certificate, and a claim its legal team will approve, with the molecule arriving almost incidentally alongside all of that. Chemistry is rarely the difficult part.
Commercial power sits with suppliers who fund substantiation studies rather than with anyone able to synthesise the compound. Active ingredients grow fastest at 9.8%, roughly 1.51 times the market, and already take 21% of value on a very small share of tonnage. East Asia holds 30% of global value, carried by Chinese, Korean, and Japanese brand development that sets global formulation trends rather than following them.
Concentration is low at roughly 33% for the top five, and a long tail of specialist suppliers competes effectively on single ingredient families. Preservative options have narrowed sharply as regulators withdrew actives, leaving formulators working with a toolkit smaller than a decade ago. Registration of a novel ingredient now costs above a million dollars. That cost falls whatever volume the ingredient carries, which has pushed niche innovation out of reach for anyone without scale.
Market Definition
The market comprises ingredients formulated into cosmetic and personal care products, covering surfactants and cleansing agents, emollients and moisturising agents, emulsifiers and rheology modifiers, active ingredients, ultraviolet filters, and preservatives and antimicrobials. Value is measured at ingredient supplier level. Fragrance compositions and aroma chemicals, packaging, contract manufacturing services, finished cosmetic products, and pharmaceutical topical actives sold under drug approval fall outside scope.
Base Year Value
$13.4B in 2025 (MMA Primary Research Dataset, August 2026)
Forecast Period
2026 to 2036, eleven discrete annual values
CAGR
6.5% base case. Bull 7.7%. Bear 5.2%.
Fastest Growth Segment
Active Ingredients: 9.8% CAGR
Fastest Growth Country
India: 10.4% CAGR
Fastest Growth Region
South Asia and Pacific: 8.8% CAGR
Largest Region
East Asia: 30% of 2025 global value
Market Leaders
BASF, Croda International, Evonik Industries, Clariant, and Ashland lead on cosmetic ingredient revenue. Source: company annual reports and MMA Analysis, July 2026.
Primary Survey
n=3,800 procurement and R&D decision-makers, Q4 2025, six countries
Methodology
Demand-side build-up, cross-validated against public data, 47 expert interviews

Cosmetic Ingredients Market Forecast Scenarios

cosmetic-ingredients-market-trends-size-forecast-scenario-1787549031824
Between 2020 and 2025 the market restructured more than it grew. Skincare boomed while colour cosmetics collapsed and then recovered, Chinese regulatory reform opened a route for new ingredient filings, and European restrictions removed several preservatives and ultraviolet filters from the toolkit. Raw material costs rose sharply through 2021 and 2022. The 5.4% historical growth blends premiumisation toward actives with pass-through pricing.
The 6.5% base case rests on three mechanisms. Premiumisation continues to move value toward active ingredients that carry clinical evidence and command pricing unrelated to their manufacturing cost. Biotechnology routes are replacing extraction and petrochemical synthesis for high-value actives, delivering consistency and traceability that brands increasingly require. And regulatory attrition among preservatives and ultraviolet filters keeps forcing reformulation, which reopens supplier positions across entire product ranges. Each of the three raises value faster than it raises tonnage shipped.
The 7.7% bull case assumes premium skincare demand holds across Asia and that biotechnology-derived actives reach cost parity with extracted equivalents. The 5.2% bear case reflects consumer trading down toward mass market formats, brand consolidation reducing formulation diversity, and registration costs pushing smaller suppliers out of novel development. Consumer sentiment across Asia decides more of this than any technical factor.

Where the Value Hides Behind Very Little Volume

Three things set the commercial shape of this market. Claims substantiation comes first, because a brand cannot market an ingredient benefit it cannot defend to a regulator or an advertising authority. Regulatory status comes second, since an ingredient not cleared in China, the European Union, and the United States serves a fragmented market at best. Manufacturing cost comes a distant third for anything sold as an active.
TOP-FIVE CONCENTRATION33%Share of global cosmetic ingredient supply held by leading producers
AVERAGE SELLING PRICEUSD 18.40 per kgBlended pricing across functional and active ingredient categories
ACTIVE INGREDIENT SHARE21%Portion of value from actives despite very small volume
NATURAL ORIGIN CONTENT62%Average renewable carbon content across newly launched ingredients
REFORMULATION CYCLE LENGTH3 yearsTypical interval before brands reformulate a mass market product
REGISTRATION DOSSIER COSTUSD 1.2 millionTypical cost of a novel ingredient regulatory submission
The value distribution is extreme. Surfactants and emollients account for most tonnage and a minority of value, competing on price per kilogram against producers with better feedstock positions. Actives take 21% of value on a fraction of the volume, priced against the benefit claimed rather than against anything on a cost sheet. Suppliers who confuse the two businesses price both wrongly.
Preservation has become the industry's quiet crisis. Regulators have withdrawn or restricted parabens, methylisothiazolinone, formaldehyde donors, and several others over two decades, and no comparably broad-spectrum replacements have arrived. Formulators now build preservation systems from combinations of weaker actives, multifunctional emollients with antimicrobial side effects, and packaging that limits contamination. It works, and it costs more. Nobody expects that toolkit to widen again.
"The most valuable thing a cosmetic ingredient supplier owns is a folder of clinical data and a regulatory dossier that took four years and seven figures to assemble. The reaction chemistry is usually a first-year undergraduate exercise. Brands understand this perfectly, which is why they negotiate on evidence and not on price per kilogram."
Practice Director, Personal Care and Specialty Ingredients · MMA Chemicals and Materials Practice · August 2026

Market Trends

Biotechnology Routes Displace Extraction for High-Value Actives

Fermentation and precision biotechnology now produce squalane, hyaluronic acid, retinoid analogues, recombinant collagen, and a growing list of peptides at consistency and purity that plant extraction cannot match. The commercial argument is not cost, which often remains higher, but traceability, batch consistency, and freedom from agricultural supply risk that brands increasingly refuse to carry. Natural origin content averages 62% across newly launched ingredients, and biotechnology routes count toward that while avoiding deforestation and harvest questions entirely. Suppliers without a biotechnology platform are watching the highest-value part of their portfolio migrate away.
Market Impact: Actives hold 21% of value
Chinese Regulatory Reform Reopened a Closed Innovation Market

Filing reform for new cosmetic ingredients in China replaced an effectively closed system with a workable notification route, and the number of accepted new ingredients has risen substantially every year since. That matters commercially out of proportion to the paperwork, because China is the largest single growth market and suppliers previously had to formulate around ingredients they could not use there. Domestic Chinese suppliers have been the most active filers, building portfolios that international competitors will meet in export markets rather than only at home. Formulation innovation reopened in the largest growth market.
Market Impact: Reformulation runs on 3 year cycles

Market Opportunities and Growth Drivers

Premiumisation Concentrates Value in Clinically Substantiated Actives

Consumers buying skincare on efficacy rather than on brand alone have pushed brands toward ingredients with published clinical evidence behind them, and those ingredients price against the claim rather than against manufacturing cost. Actives already hold 21% of market value on a fraction of the tonnage, and the share keeps rising. For suppliers this changes the investment case entirely: the money goes into clinical studies, instrumental measurement, and publication rather than into plant. A supplier who funds a good study owns a position that competitors cannot replicate by matching the molecule.
Market Impact: Options down over 40%

Regulatory Attrition Forces Reformulation Across Entire Ranges

European Commission restrictions on ultraviolet filters, preservatives, and synthetic polymer microparticles have each removed established ingredients from the toolkit, and every removal forces brands to reformulate products that were performing perfectly well. Reformulation is one of the few moments a brand genuinely reconsiders its supplier list, and it typically happens on a three-year cycle even without regulation forcing it. Suppliers arriving with a compliant, substantiated alternative displace incumbents who arrive with a development timeline. Regulatory pressure therefore functions as a recurring redistribution of positions. Prepared challengers gain, and unprepared incumbents quietly lose ground.
Market Impact: Dossiers cost above $1.2 million

Market Restraints and Challenges

Preservative Attrition Leaves Formulators With a Shrinking Toolkit

Parabens, methylisothiazolinone, formaldehyde donors, and several other broad-spectrum preservatives have been restricted or abandoned under regulatory and consumer pressure, and nothing of comparable breadth has replaced them. The root cause is that effective antimicrobials are, by design, biologically active, which makes them difficult to defend under modern safety assessment. Formulators now combine weaker actives, multifunctional emollients, and protective packaging to achieve what one preservative used to do. Suppliers are developing hurdle-technology systems and fermentation-derived antimicrobials, and the results work at meaningfully higher cost. Challenge testing has become a routine formulation cost.
Market Impact: Natural origin content reaches 62%

Registration Costs Exclude Smaller Suppliers From Novel Development

A novel ingredient dossier now costs above USD 1.2 million across the major jurisdictions once safety data, toxicology, and environmental assessment are complete, and the timeline runs several years. The root cause is regulatory convergence toward pharmaceutical-grade safety evidence for materials applied to skin. That cost falls per ingredient regardless of the volume it will eventually carry, which makes niche innovation uneconomic for anyone without scale. Smaller suppliers mitigate by licensing, partnering with larger producers, or working only with ingredients already on approved inventories. Innovation has consolidated toward the larger producers accordingly.
Market Impact: Filings up above 40% annually
4 additional market trends, 3 additional growth drivers, and 2 additional restraints and challenges are covered in the full report. Contact sales@marketmindsadvisory.com to access the complete intelligence.

Segment CAGR and Growth Architecture

Segmentation follows ingredient function, because function determines inclusion level, pricing logic, regulatory scrutiny, and whether the ingredient is bought on cost or on claim. Six functional categories cover commercial supply, and they behave as almost separate businesses, since a surfactant and an active share nothing beyond appearing in the same formulation. Pricing logic differs by orders of magnitude.
cosmetic-ingredients-market-trends-market-share-analysis-1787549032367

Active Ingredients

The fastest-growing category at 9.8%, roughly 1.51 times the market, and the one where almost all the profit sits. Peptides, retinoids, growth factors, botanical extracts with standardised markers, and fermentation-derived molecules are all priced against the claim they support rather than against manufacturing cost, which can run to hundreds or thousands of dollars per kilogram. Actives hold 21% of market value on a small fraction of tonnage. What defends a position here is clinical evidence and regulatory clearance across major jurisdictions, not synthesis capability. Biotechnology routes are steadily displacing extraction because brands want traceability and consistency more than they want a natural harvest story. The clinical file, not the synthesis route, is what any competitor would actually need to replicate.
CAGR 9.8%

Ultraviolet Filters

Second fastest at 7.2%, and unusual in being simultaneously a growth market and a regulatory minefield. Sun protection demand rises with skin cancer awareness and with daily-wear facial products incorporating protection as standard, yet the available filter list keeps shrinking as environmental and systemic absorption concerns lead to restriction. Filter approval differs between the European Union, the United States, and Asian markets, which forces brands to run different formulations by region and raises the value of any filter cleared everywhere. New filter development is extremely expensive and rare. Suppliers holding globally approved filters occupy positions that competitors cannot enter without a decade of regulatory work. Daily-wear facial products keep raising volumes regardless.
CAGR 7.2%
Full segment breakdown across 6 segments available in the complete report.

Regional Architecture and Country Demand Map

Regional shares follow where brands develop products rather than where consumers buy them. Formulation and claims development concentrate around the major beauty innovation centres, and regulatory divergence between jurisdictions forces suppliers to hold different portfolios in each. Claims environments differ as much as the ingredient lists do.

North America

Clinical substantiation matters more here than anywhere, because advertising authorities and litigation risk together make unsupported claims genuinely expensive. That favours suppliers who fund published studies and disadvantages those selling on tradition or provenance alone. The indie brand phenomenon originated in this region and continues to drive ingredient trial rates far above what volumes justify, since a small brand will adopt a novel active that a multinational would spend two years evaluating. Sun care sits under drug rather than cosmetic regulation, which has effectively frozen the approved filter list for decades and left American formulations behind European and Asian equivalents. Growth of 6.0% reflects premium skincare strength. Litigation risk shapes formulation more than regulation does.
Share: 24% | CAGR: 6.0% (2026 to 2036)

Western Europe

Regulation defines this market. The cosmetics framework, scientific committee opinions, and chemicals restrictions together create the strictest ingredient environment anywhere, and compliance costs are absorbed into every formulation sold. Restrictions on synthetic polymer microparticles, several ultraviolet filters, and a long list of preservatives have each forced industry-wide reformulation over the past decade. The offsetting advantage is that European clearance carries weight globally and suppliers use it as a quality signal. Croda, BASF, Clariant, and a dense network of specialists including Gattefossé and Seppic anchor global supply from here. Growth of 5.0% is the slowest in the report and reflects mature consumption rather than any loss of technical leadership. Compliance capability has become an export advantage in itself.
Share: 22% | CAGR: 5.0% (2026 to 2036)
Regional intelligence for 5 additional markets available in the complete report: East Asia, South Asia and Pacific, Latin America, Middle East and Africa, Eastern Europe. Contact sales@marketmindsadvisory.com.
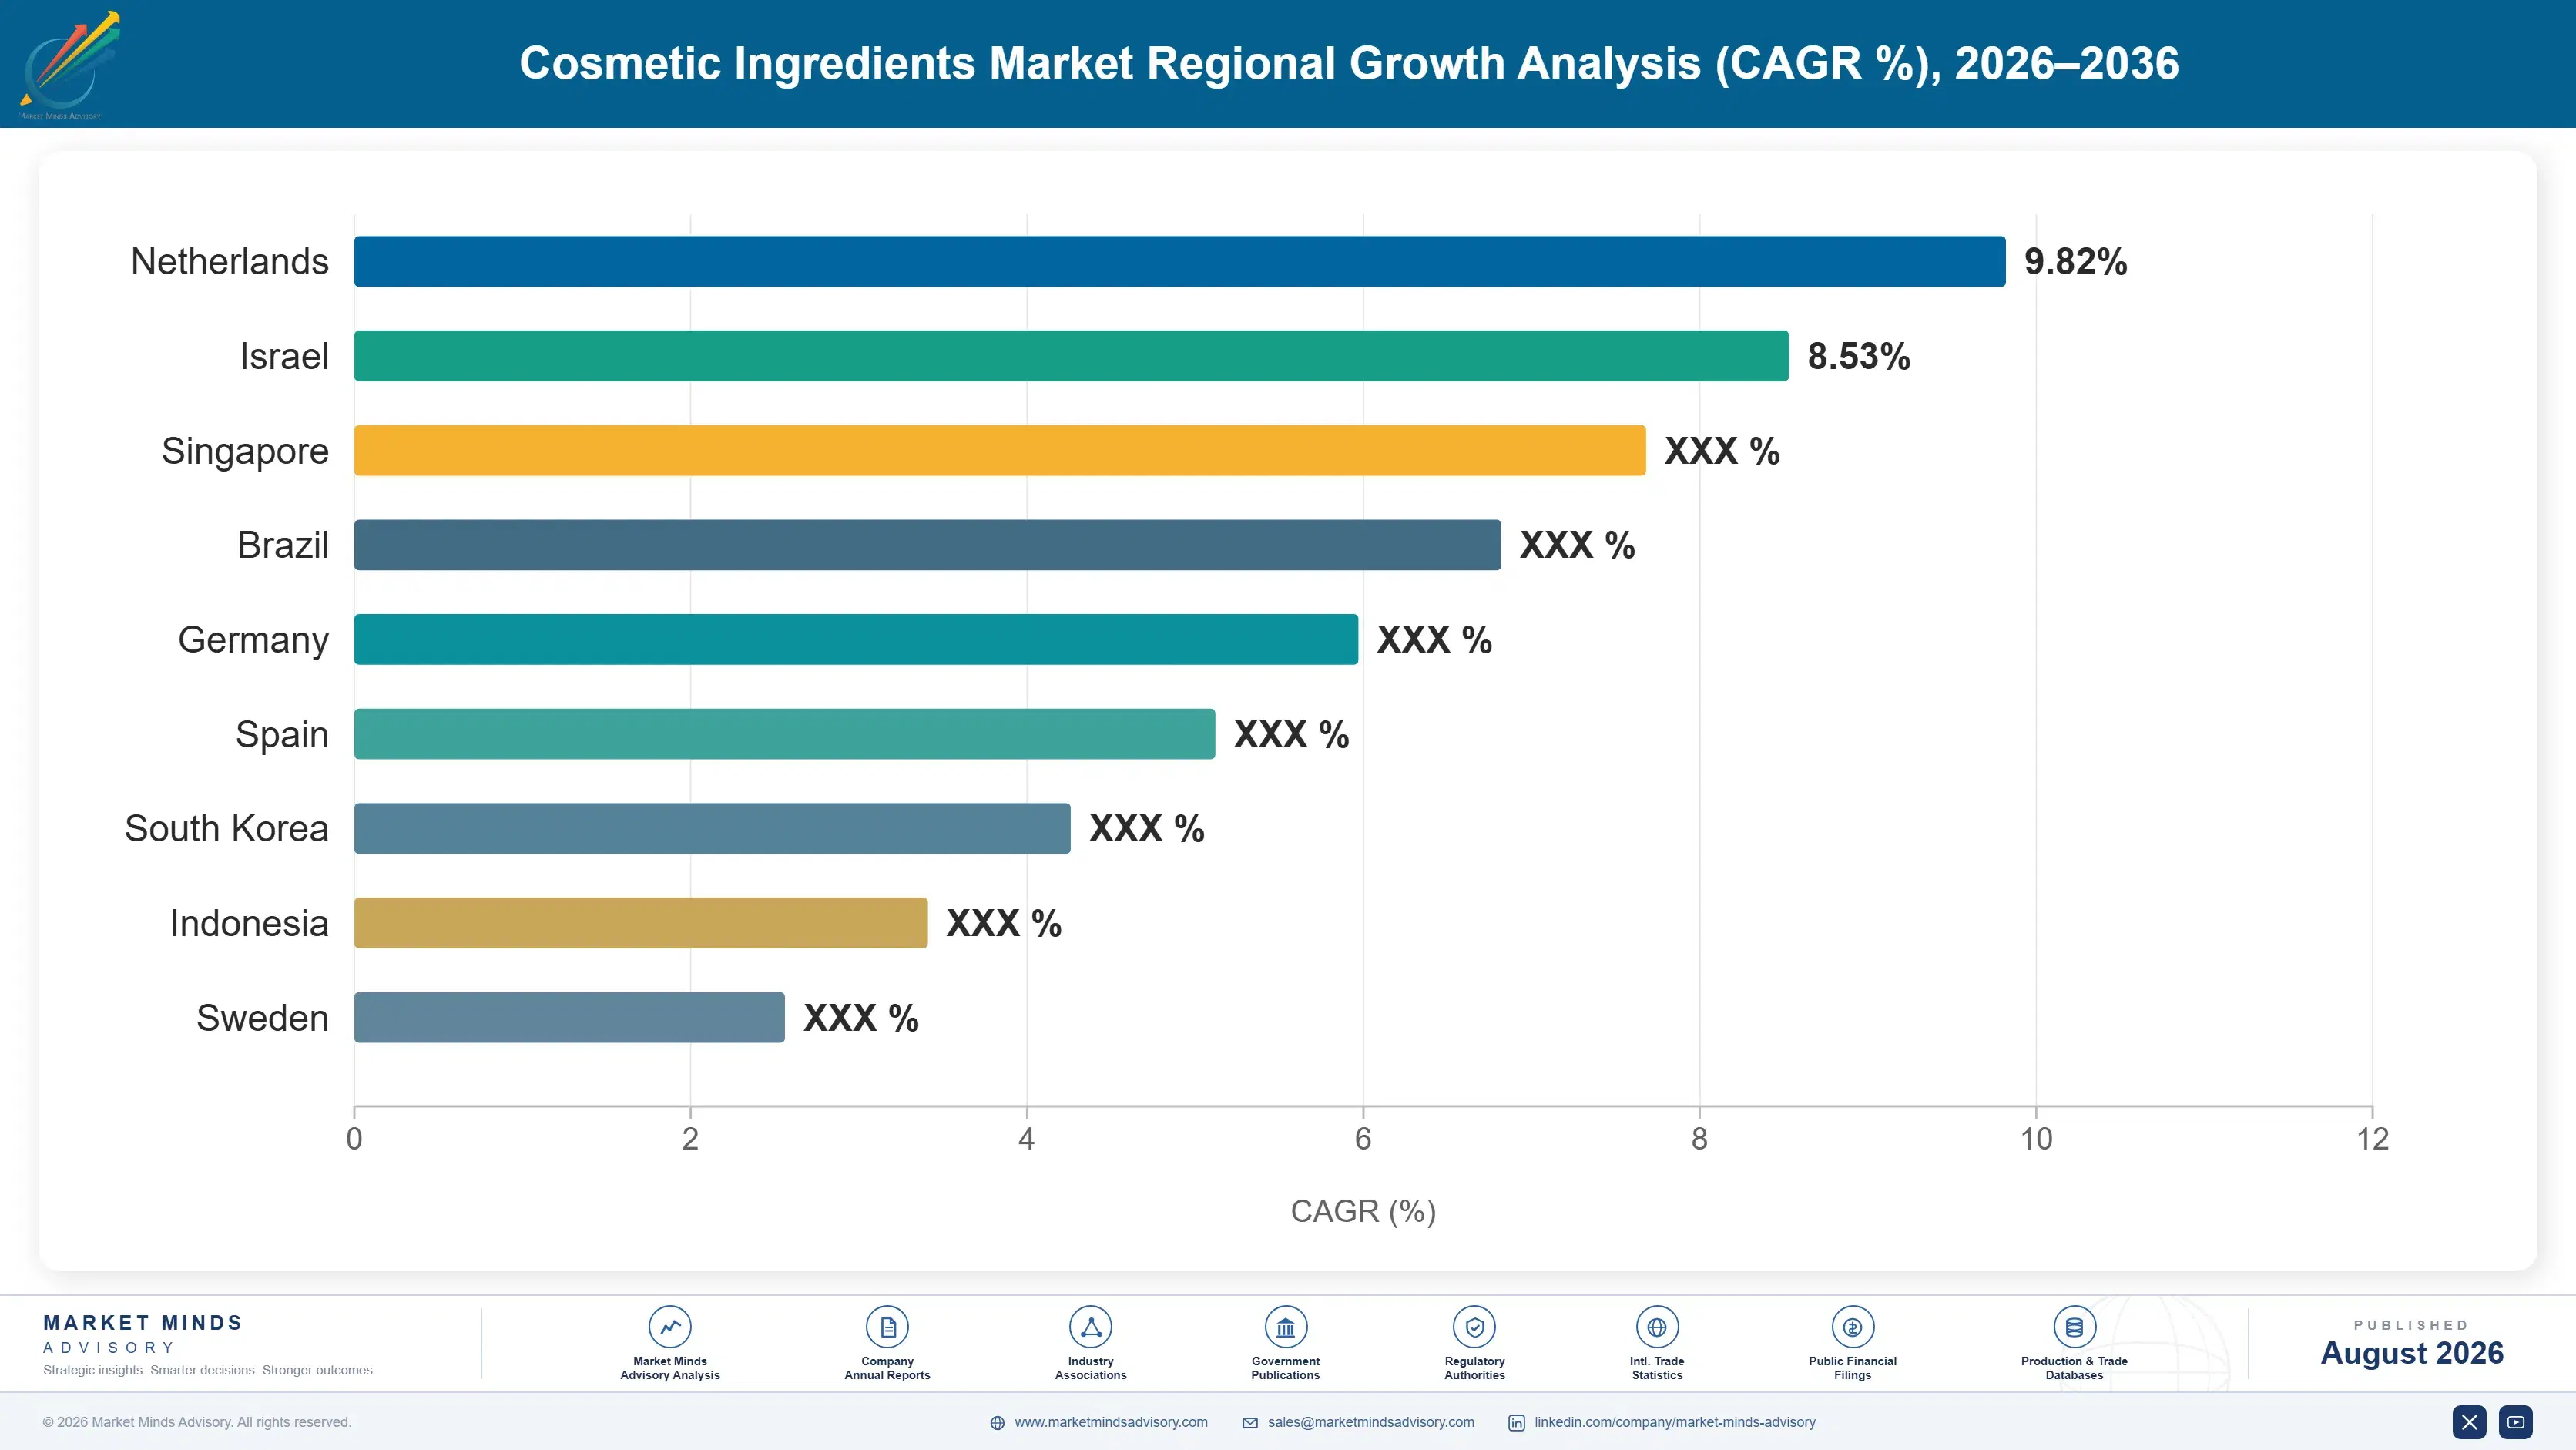
cosmetic-ingredients-market-trends-country-cagr-analysis-1787549032909

Four Moves That Change the Economics

Advantage in this market comes from clinical evidence, regulatory clearance breadth, and formulation service rather than from synthesis capability, which is rarely the difficult part. Four moves are worth capital and management attention across the forecast period, and three of them build assets that competitors cannot replicate by copying a molecule. The fourth makes a technical headache chargeable.

Fund published clinical substantiation on every active

Brands price ingredients against the claims they support, and a claim without published evidence is worth almost nothing to a marketing department facing advertising scrutiny. A properly designed instrumental and consumer study costs perhaps $180,000 to $350,000 and takes under a year, against an active that may sell for a decade at pricing 3 to 8 times its manufacturing cost. Suppliers who treat substantiation as a marketing expense underinvest badly. The evidence, not the molecule, is what a competitor cannot copy by reverse-engineering a sample. Treating it as product development rather than promotion changes the whole investment case.
Market Impact: Supports pricing 3 to 8 times production cost

Clear ingredients across all three major jurisdictions

An ingredient approved only in Europe forces a global brand to run separate formulations by region, which multiplies development cost and inventory complexity enough that many will simply choose something else. Clearance across the European Union, the United States, and China raises addressable demand by roughly 60% against single-jurisdiction status and makes the ingredient a default rather than an option. Chinese filing reform made this achievable where it previously was not. The dossier work costs above $1.2 million and takes years, which is precisely why it defends the position afterwards.
Market Impact: Raises addressable global demand by roughly 60% overall

Build a fermentation platform for high-value actives

Precision fermentation delivers consistency, traceability, and freedom from harvest risk that brands increasingly demand and agricultural extraction cannot provide reliably. It also counts toward the renewable carbon content that now averages 62% across new launches. Platform investment runs into tens of millions and pays back across a portfolio rather than a single molecule, which is the argument most finance functions miss. Suppliers without a platform are watching peptides, squalane, collagen, and hyaluronic acid migrate toward competitors who built one, and reacquiring those positions later will cost far more. Reacquiring lost positions later costs far more than building now.
Market Impact: Serves the 62% renewable carbon content target properly

Sell preservation systems rather than single preservatives

Regulatory attrition has cut the available preservative toolkit by over 40%, and formulators now assemble protection from combinations of weaker actives, multifunctional emollients, and packaging strategy. That complexity is a service opportunity: suppliers who provide validated preservation systems with challenge test data attached save brands months of formulation work. System supply carries margins 10 to 16 percentage points above single-ingredient sales and creates a technical relationship that price competition cannot easily interrupt. Challenge test data attached to the system is what brands actually pay for, since generating it themselves takes months.
Market Impact: Adds 10 to 16 points of gross margin

Who Controls the Margin Pool

Concentration is low: the top five hold roughly 33% of global cosmetic ingredient revenue, which is unusual in specialty chemicals and reflects how many distinct functional categories exist. BASF leads on breadth across every category from surfactants to actives. Croda competes with a deliberately premium position weighted toward actives and delivery systems, while Evonik, Clariant, and Ashland each hold strong positions in particular functional families rather than across the whole formulation.
Competitive activity runs on three fronts. Clinical evidence depth is the first, because brands buy substantiated claims and evaluate suppliers on the studies behind them. Regulatory clearance breadth is the second, and it decides whether a global brand can use the ingredient at all. Formulation service is the third, and it matters most to the smaller brands that drive trial rates far above their volume share.

Pressure is building from two directions. Chinese suppliers using the reformed filing route are building portfolios that will meet international competitors in export markets. And biotechnology entrants, several venture-funded rather than chemical companies, are taking high-value actives from established extraction-based positions. Both pressures target the highest-value part of the portfolio rather than the commodity end.
cosmetic-ingredients-market-trends-company-positioning-matrix-1787549033445

Competitive Moat and Risk Dimensions

BASF

Moat: Breadth across every functional category

No competitor supplies surfactants, emollients, emulsifiers, ultraviolet filters, and actives at comparable depth from a single organisation with global regulatory coverage behind it. That breadth lets BASF support a whole formulation and a brand's global rollout, which specialists cannot do, and it makes the company difficult to remove entirely from any large customer.
BASF

Risk: Commodity exposure diluting returns

A large share of volume sits in surfactants and emollients where feedstock position rather than technology decides competitiveness, and Asian producers with better oleochemical access compete effectively there. That drags blended returns below what a purely premium portfolio would deliver, and it ties considerable capital to assets earning commodity margins.
CRODA INTERNATIONAL

Moat: Premium actives and delivery systems

A deliberate portfolio shift toward high-value actives, delivery technology, and biotechnology-derived ingredients gives Croda margins well above the sector and a customer conversation centred on efficacy rather than on price. The accumulated clinical evidence behind those ingredients is an asset competitors cannot acquire by matching chemistry.
CRODA INTERNATIONAL

Risk: Exposure to premium demand cycles

A portfolio weighted toward premium skincare actives performs poorly when consumers trade down, and the destocking cycle that followed the pandemic demand surge demonstrated how sharply that can hit reported results. Without a commodity base to hold volumes, the earnings profile is considerably more volatile than diversified competitors carry.

Players Tracked

Prominent Players

BASF
Croda International
Evonik Industries
Clariant
Ashland

Other Key Players

Dow
Lonza
Symrise
Givaudan
Solvay
Innospec
Stepan Company
Lubrizol
Seppic
Nouryon
Eastman Chemical
Kao Corporation
Shin-Etsu Chemical
Nikkol Group
Gattefossé

Recent Developments

MARCH 2025

Croda expands biotechnology-derived active capacity

Additional fermentation capacity for high-value skincare actives entered service, extending a platform the company has built through acquisition and internal development. The investment targets peptides and biopolymers where brands increasingly require traceability that agricultural extraction cannot provide reliably at scale. Capacity was not disclosed publicly.
Signal: Biotechnology platforms are becoming table stakes in actives rather than a differentiating capability on their own
JULY 2025

Chinese new ingredient filings reach record level

The number of new cosmetic ingredients accepted under China's reformed notification route rose again, with domestic suppliers accounting for the substantial majority of submissions. The reform replaced an effectively closed approval system and has reopened formulation innovation in the largest single growth market. Approval timelines have shortened.
Signal: Domestic Chinese suppliers are now building regulatory portfolios that international competitors will meet in export markets
OCTOBER 2025

Supplier launches validated preservation system range

A multi-component preservation range with challenge test data attached was launched, aimed at formulators struggling with the shrinking approved preservative list. The offer bundles compatible actives, multifunctional emollients, and formulation guidance rather than supplying single ingredients against a specification. Pricing reflects the technical service content rather than material.
Signal: Preservation has shifted from an ingredient purchase to a technical service that suppliers can charge properly for

What Sets the Cost Base

The cost structure differs completely between categories. Surfactants and emollients are dominated by oleochemical and petrochemical feedstock at roughly 58% of cost, principally palm kernel oil, coconut oil, and ethylene oxide derivatives. Actives look nothing like that: raw materials often fall below 20% of cost while clinical substantiation, regulatory maintenance, and technical service absorb the majority. Blended across the portfolio, feedstock accounts for around 41% of industry cost.
Palm and coconut oil volatility through 2021 and 2022 hit the functional categories hard. Producer country export policy, freight disruption, and energy costs combined to move oleochemical pricing sharply, and surfactant producers passed through what annual contracts allowed. BASF and Croda both referenced raw material cost inflation and pricing actions across their reporting for those years. Deforestation rules have since added traceability cost to palm-derived chains.

Exposure divides on portfolio mix rather than on scale. Suppliers weighted toward surfactants and emollients carry feedstock risk that moves with agricultural and petrochemical markets, while actives-weighted portfolios carry almost none but face regulatory and study cost inflation instead. European producers pay more for energy and compliance than Asian competitors on identical functional chemistry. Traceability requirements now favour suppliers who invested in certified supply chains early.
cosmetic-ingredients-market-trends-cost-volatility-analysis-1787549033642

Secure certified traceable palm derivative supply chains

Deforestation regulation now requires geolocation evidence for palm-derived materials entering Europe, and non-compliant supply simply cannot be sold there. Suppliers who built certified chains ahead of the deadline avoided both scramble pricing and lost volume. The cost is a premium on certified material and audit overhead, and it converts compliance into a commercial advantage.

Shift active production toward fermentation feedstocks

Fermentation runs on sugar rather than on botanical harvest or petrochemical intermediates, which decouples active production from agricultural yield and extraction seasonality entirely. Cost per kilogram is often higher today and falls with platform scale. The larger benefit is consistency, since brands increasingly reject the batch variation that plant extraction produces and price accordingly for material that avoids it.

Amortise regulatory dossiers across multiple ingredient families

A dossier costing above USD 1.2 million is punishing for a single niche ingredient and reasonable across a family sharing toxicological and molecular characteristics. Planning development around families rather than individual molecules spreads that cost properly. It requires research direction to be set with regulatory strategy in mind from the outset rather than after a candidate is selected.

Portfolio Architecture for Margin Defence

Margin follows evidence and clearance rather than volume, and the spread across this market is enormous. Surfactants and standard emollients earn low to mid teens gross margin against producers with better oleochemical feedstock positions, and buyers switch on price without technical consequence. Clinically substantiated actives with global regulatory clearance earn several times that, because the brand is buying a defensible claim rather than a chemical.
The volume and premium tension is genuine but unusual in shape. Functional categories fund the technical organisation, the regulatory function, and the customer relationships that make active sales possible, so abandoning them looks attractive on a margin sheet and removes the platform underneath the profitable business. Croda's premium shift worked precisely because it retained enough breadth to stay in the formulation conversation.

High-value pools concentrate in three places: clinically substantiated actives, globally cleared ultraviolet filters, and validated preservation systems. Each is defended by evidence, regulatory position, or technical service rather than by price. Price competition arrives in each only when a competitor funds equivalent studies, secures the same clearances, or assembles comparable formulation service capability, and each of those takes years of deliberate investment rather than a commercial decision.

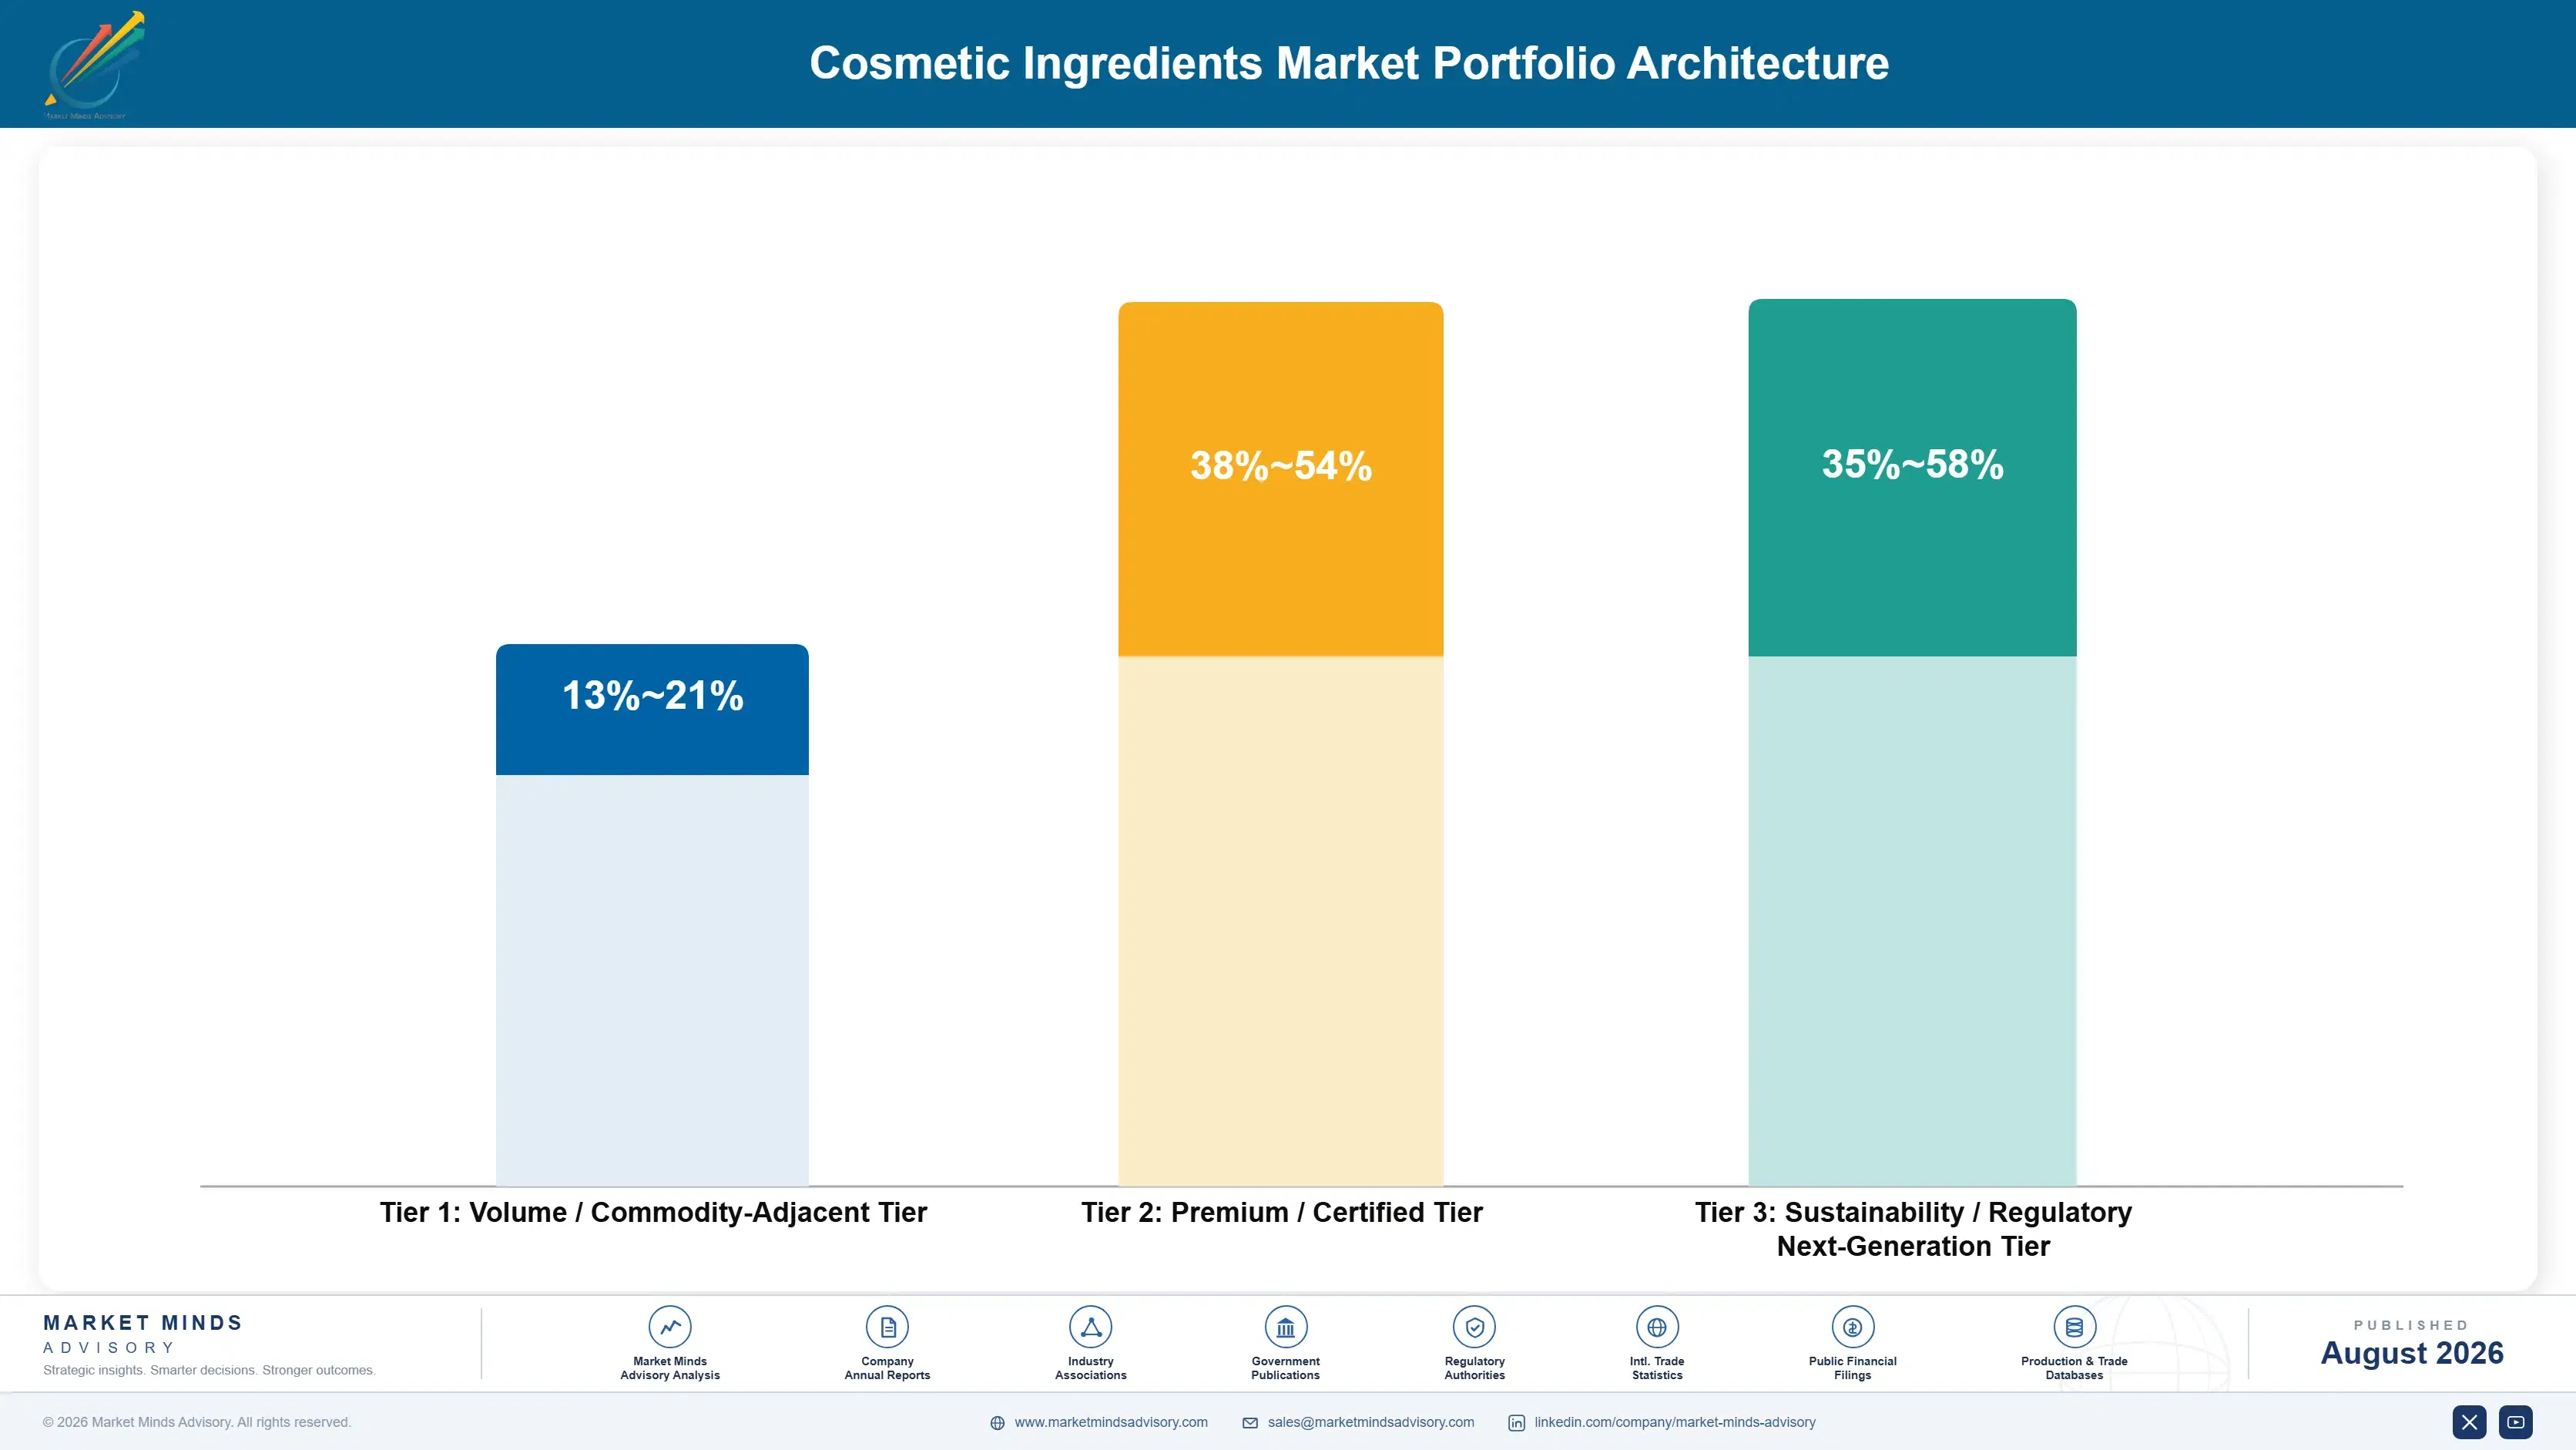
Volume / Commodity-Adjacent Tier

Standard surfactants, emollients, and emulsifiers sold on price per kilogram against oleochemical feedstock positions. Holds formulation presence and funds technical coverage. The wide range reflects large differences in feedstock access and regional production cost.
Gross Margin: 13%-21%

Premium / Certified Tier

Clinically substantiated actives and globally cleared ultraviolet filters supported by published evidence and regulatory dossiers. The brand purchases a defensible claim rather than a molecule, and switching means re-substantiating the product claim entirely.
Gross Margin: 38%-54%

Sustainability / Regulatory / Next-Generation Tier

Fermentation-derived actives, certified traceable naturals, and validated preservation systems sold on compliance and provenance. Growing fast on brand requirements. The range is wide because biotechnology cost positions vary enormously between platforms.
Gross Margin: 35%-58%
cosmetic-ingredients-market-trends-portfolio-architecture-1787549034159

High-value Sub-segments and Strategic Watch-out

Clinically Substantiated Skincare Actives

Where nearly all the profit in this market sits, at 21% of value on a small share of tonnage. Published evidence rather than chemistry defends the position, and it cannot be copied by reverse-engineering a sample. Fund the studies properly. Nothing else in the portfolio compounds this way.
Gross Margin: 40%-56%

Globally Cleared Ultraviolet Filters

Regulatory divergence between regions makes any filter approved everywhere disproportionately valuable to global brands. New filter development takes a decade and enormous cost, which keeps the competitive field almost closed. Demand rises with daily-wear protection habits. Positions here are close to unassailable once secured. Defend them.
Gross Margin: 36%-48%

Validated Preservation Systems

Regulatory attrition cut the preservative toolkit by over 40% and turned protection into a formulation problem brands struggle with. Selling validated systems with challenge test data converts that difficulty into a technical service relationship worth defending properly. Charge for the work rather than giving it away.
Gross Margin: 30%-44%

Commodity Surfactant Supply

The strategic watch-out. Competes on oleochemical feedstock position against Southeast Asian producers who sit next to the palm and coconut supply. It funds the technical organisation and holds formulation presence, and should be priced for that. Expect contribution and presence, and nothing more. Price accordingly.
Gross Margin: 13%-20%

How Demand Actually Reaches Suppliers

The annuity here is formulation lock rather than replacement. Once an ingredient is written into a formulation, tested for stability, and supported by a substantiated claim on the pack, changing it means reformulating, re-testing, and re-substantiating, which brands avoid unless regulation forces them. That holds positions for years. The countervailing force is the three-year reformulation cycle most mass market products run, which reopens supplier lists on a predictable rhythm and is where positions actually change hands.
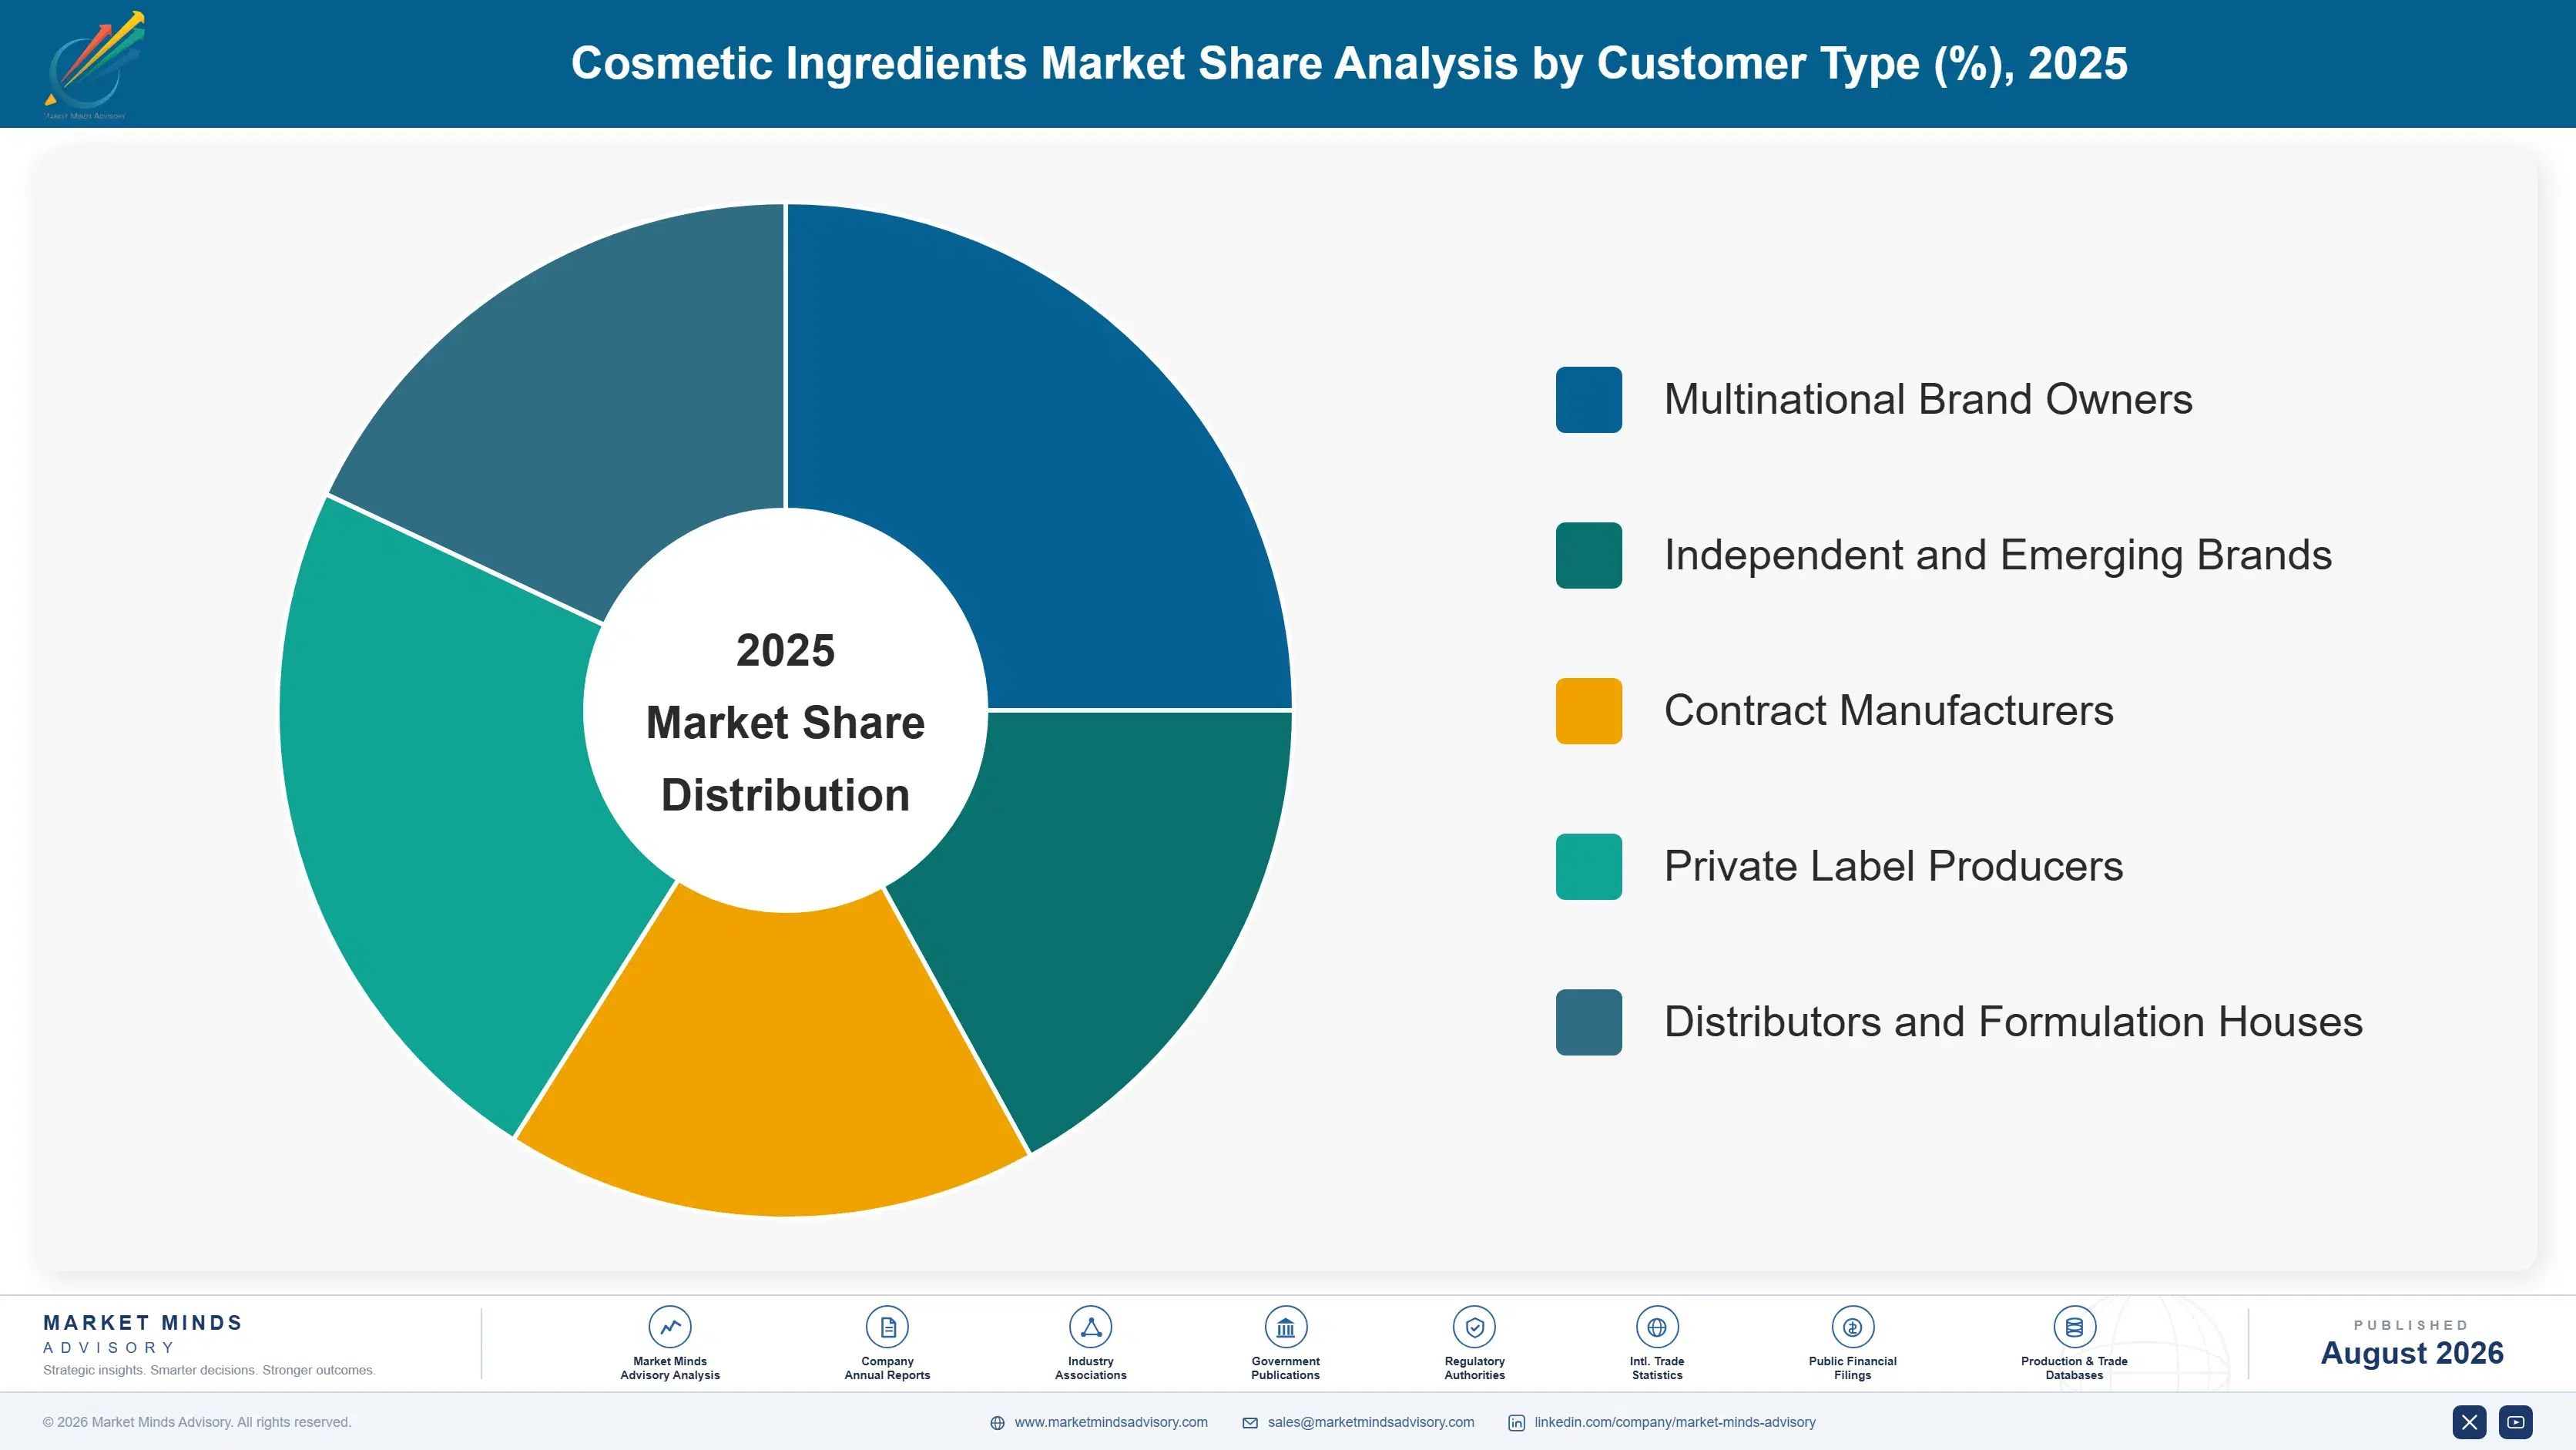
Adoption depth varies sharply by customer type. Multinational brands evaluate slowly, demand extensive documentation, and then commit across global ranges, which makes each win enormous. Indie and emerging brands adopt novel actives quickly on small volumes and function as the industry's trial mechanism. Contract manufacturers buy to specifications set by others. Private label operators buy almost purely on cost against a target formulation.

The buyer has shifted toward regulatory affairs and claims substantiation functions. What gets evaluated is the dossier and the study design, not the technical data sheet. A supplier whose technical documentation cannot survive a regulatory affairs review will not reach a formulator at all, however well the ingredient performs on the bench.
cosmetic-ingredients-market-trends-end-use-penetration-index-1787549034671

Where the Money Sits

These are among the four positions where our research anticipates prominent divergence between winners and laggards over the coming forecast period. Each is grounded in the demand model, the regulatory perimeter, and the announced capacity pipeline.
01 / CLINICAL EVIDENCE INVESTMENT

Fund the studies, because the data is the actual product

Brands price ingredients against the claims they can defend to advertising authorities, and an unsubstantiated benefit is worth close to nothing whatever the chemistry does in a laboratory. A properly designed instrumental and consumer study costs $180,000 to $350,000 against an active that may sell for a decade at 3 to 8 times its manufacturing cost. The evidence file, quite unlike the molecule itself, cannot be copied by any competitor who reverse-engineers a sample and simply matches the published specification.
02 / MULTI-JURISDICTION REGULATORY CLEARANCE

Clear everywhere, because regional-only ingredients get designed out

A global brand asked to run separate formulations by region because an ingredient lacks clearance in one market will almost always choose a different ingredient rather than carry that complexity. Clearance across the European Union, the United States, and China raises addressable demand roughly 60% and turns an option into a default specification. The dossier costs above $1.2 million and takes years, which is exactly why the resulting position holds so well against competitors once it has finally been secured.
03 / FERMENTATION PLATFORM BUILD

Build the platform, because actives are migrating toward biotechnology

Precision fermentation delivers the consistency, traceability, and harvest independence that brands now require, and it counts toward renewable carbon content averaging 62% across new launches. Platform investment runs to tens of millions and pays back across a whole portfolio rather than a single molecule, which is the argument finance functions consistently miss. Suppliers without one are watching peptides, squalane, and collagen migrate to competitors, and buying any of those positions back at a later date will cost considerably more than building now.
04 / PRESERVATION SYSTEM SELLING

Sell the system, because formulators have run out of preservatives

Regulatory attrition has cut the available preservative toolkit by over 40% and left formulators assembling protection from combinations of weaker actives, multifunctional emollients, and packaging strategy. Suppliers providing validated systems with challenge test data attached save brands months of difficult formulation work, and they earn 10 to 16 percentage points of margin above single-ingredient supply. It also builds a durable technical relationship in a category where price competition would otherwise be the only conversation available to anybody selling into it.

Engagement Snapshot From the Field

A live engagement with an industry participant carrying material or product regulatory and market exposure ahead of a defining policy shift, showing how our research translates into a defensible multi-year portfolio strategy.
MARKET MINDS ADVISORY · CLIENT ENGAGEMENT SUMMARY
Cosmetic Ingredients Producer Strategic Portfolio Review and Transition Roadmap 2026·Investment Scenario on Cosmetic Ingredients Exposure Evaluation 2025-26
CLIENT PROFILE
A European specialty ingredient supplier with strong positions in emollients and emulsifiers serving personal care formulators across Europe and North America, with revenue near EUR 175 million (client-reported, unverified by MMA). The business held a small actives portfolio, minimal published clinical evidence, and regulatory clearance concentrated in European markets only. Competitors published studies the client had never funded.
STRATEGIC CHALLENGE
Functional category margins had compressed for four consecutive years under Asian competition while the actives business the client held could not command premium pricing without evidence its competitors published routinely. Management needed to know where to direct limited development spend, and whether Chinese clearance was worth pursuing given the cost and timeline involved.
MMA APPROACH
MMA analysed pricing realisation across the client's portfolio against competitor evidence depth, mapped regulatory clearance status by ingredient and jurisdiction, and modelled returns on substantiation and dossier investment. Forty-seven expert interviews with brand formulators, regulatory affairs leads, and claims substantiation specialists established how ingredient selection decisions are genuinely made. Data sheets reveal none of this.
KEY FINDINGS
  1. Actives without published clinical evidence realised barely a third of the pricing achieved by directly comparable competitor ingredients that carried a single peer-reviewed study behind them.
  2. Eleven ingredients in the portfolio lacked Chinese clearance, and global brand customers had excluded all of them from formulations intended for worldwide launch as a matter of routine.
  3. Emollient margin compression traced entirely to Southeast Asian feedstock advantage that no European operational improvement could realistically close within the forecast period.
  4. Preservation enquiries reached the technical service team constantly and were being answered without charge, representing a service the client had never once attempted to price commercially.
CLIENT PROFILE
A European specialty ingredient supplier with strong positions in emollients and emulsifiers serving personal care formulators across Europe and North America, with revenue near EUR 175 million (client-reported, unverified by MMA). The business held a small actives portfolio, minimal published clinical evidence, and regulatory clearance concentrated in European markets only. Competitors published studies the client had never funded.
STRATEGIC CHALLENGE
Functional category margins had compressed for four consecutive years under Asian competition while the actives business the client held could not command premium pricing without evidence its competitors published routinely. Management needed to know where to direct limited development spend, and whether Chinese clearance was worth pursuing given the cost and timeline involved.
MMA APPROACH
MMA analysed pricing realisation across the client's portfolio against competitor evidence depth, mapped regulatory clearance status by ingredient and jurisdiction, and modelled returns on substantiation and dossier investment. Forty-seven expert interviews with brand formulators, regulatory affairs leads, and claims substantiation specialists established how ingredient selection decisions are genuinely made. Data sheets reveal none of this.
KEY FINDINGS
  1. Actives without published clinical evidence realised barely a third of the pricing achieved by directly comparable competitor ingredients that carried a single peer-reviewed study behind them.
  2. Eleven ingredients in the portfolio lacked Chinese clearance, and global brand customers had excluded all of them from formulations intended for worldwide launch as a matter of routine.
  3. Emollient margin compression traced entirely to Southeast Asian feedstock advantage that no European operational improvement could realistically close within the forecast period.
  4. Preservation enquiries reached the technical service team constantly and were being answered without charge, representing a service the client had never once attempted to price commercially.
RECOMMENDED STRATEGY
Phase 1: Phase one: commission clinical substantiation on the four actives with the strongest technical rationale, treating study cost as product development rather than as marketing expenditure. Phase 2: Phase two: pursue Chinese clearance for the ingredients that global brand customers had specifically excluded, sequencing filings by addressable revenue rather than by internal convenience. Phase 3: Phase three: package preservation advice into a validated system offer with challenge test data attached, and charge for the technical work already being given away.
OUTCOME
The client published studies on three actives within eighteen months and secured Chinese clearance for five ingredients. Actives revenue grew 34% over two years at pricing 2.7 times previous levels, and the preservation system range reached break-even inside its first year (client-reported, unverified by MMA).

Frequently Asked Questions

Foundational context covering the market sizes, CAGR, scope, country, region and competition that inform every finding below. This section is provided to cover basics and most often pre-purchase conversations, answered from the MMA Primary Research Dataset.

What is the current size of the Cosmetic Ingredients Market?

The market was valued at USD 13.4 billion in 2025, rising to an estimated USD 14.27 billion in 2026. East Asia holds the largest regional share at 30% of global value.

How large will the Cosmetic Ingredients Market be by 2036?

MMA forecasts USD 26.79 billion by 2036 under the base case, an expansion multiple of 1.88 times the 2026 value. That represents USD 12.52 billion of incremental value across the forecast period.

What is the CAGR for the Cosmetic Ingredients Market 2026 to 2036?

The base case CAGR is 6.5%, with a bull case of 7.7% and a bear case of 5.2%. The spread reflects uncertainty over premium skincare demand and biotechnology cost trajectories.

Which segment is growing fastest?

Active ingredients grow fastest at 9.8%, roughly 1.51 times the market rate, and already hold 21% of value. Ultraviolet filters follow at 7.2% on daily-wear protection demand.

Who are the major companies in the Cosmetic Ingredients Market?

BASF, Croda International, Evonik Industries, Clariant, and Ashland lead on cosmetic ingredient revenue. The top five hold only 33% of global value, with a long specialist tail behind them.

Which country is growing fastest?

India grows fastest at 10.4%, driven by rising incomes, organised retail expansion, and domestic brands building genuine formulation capability. Sun protection and pigmentation actives are unusually large categories there.

Report Segmentation Architecture

The full report scope spans multiple orthogonal segmentation dimensions, with cross-tabulated demand data provided for each dimension pair. Coverage extends further to regional breakdowns, trend trajectories, and the competitive detail needed to support segment-level decision-making.

By Ingredient Function

  • Surfactants and Cleansing Agents
  • Emollients and Moisturising Agents
  • Emulsifiers and Rheology Modifiers
  • Active Ingredients
  • Ultraviolet Filters
  • Preservatives and Antimicrobials

By End-Use Industry

  • Skin Care Products
  • Hair Care Products
  • Colour Cosmetics
  • Sun Care Products
  • Bath and Body Products

By Customer Type

  • Multinational Brand Owners
  • Independent and Emerging Brands
  • Contract Manufacturers
  • Private Label Producers
  • Distributors and Formulation Houses

By Region

  • North America
  • Western Europe
  • East Asia
  • South Asia and Pacific
  • Latin America
  • Middle East and Africa
  • Eastern Europe

Scope, Methodology, and Coverage

Every figure in this report is reproducible from documented input assumptions. The scope below maps the historical period, the forecast horizon, the segmentation dimensions, and the countries covered, alongside the underlying primary and qualitative methodology.
Historical Period
2020 to 2025
Forecast Period
2026 to 2036
Base Year
2025 (USD billions; MMA Primary Research Dataset, August 2026)
Market Definition
The market comprises ingredients formulated into cosmetic and personal care products, covering surfactants and cleansing agents, emollients and moisturising agents, emulsifiers and rheology modifiers, active ingredients, ultraviolet filters, and preservatives and antimicrobials. Value is measured at ingredient supplier level across skin care, hair care, colour cosmetics, sun care, and bath and body applications. Fragrance compositions and aroma chemicals, packaging materials, contract manufacturing services, finished cosmetic products, and topical actives regulated as pharmaceuticals fall outside scope.
Quantitative Units
USD billions (current prices); metric tonnes of ingredient supplied annually; USD per kilogram by functional category
Segmentation Dimensions
By Ingredient Function; By End-Use Industry; By Customer Type; By Region
Regions Covered
North America, Western Europe, East Asia, South Asia and Pacific, Latin America, Middle East and Africa, Eastern Europe
Countries Covered
United States, Canada, Mexico, Germany, France, United Kingdom, Italy, Spain, Netherlands, Switzerland, Poland, Czechia, China, Japan, South Korea, Taiwan, India, Australia, Indonesia, Thailand, Brazil, Colombia, Chile, Saudi Arabia, United Arab Emirates, Egypt, South Africa
Key Companies Profiled
BASF, Croda International, Evonik Industries, Clariant, Ashland, Dow, Lonza, Symrise, Givaudan, Solvay, Innospec, Stepan Company, Lubrizol, Seppic, Nouryon, Eastman Chemical, Kao Corporation, Shin-Etsu Chemical, Nikkol Group, Gattefossé
Quantitative Methodology
Primary survey, n=3,800 respondents, Q4 2025, six countries; demand-side model with trade association cross-validation
Qualitative Methodology
47 expert interviews, Q4 2025; applied to validate demand model assumptions, identify emerging dynamics, and assess competitive positioning
Report Format
PDF and XLSX data workbook (Word format preview document)
Publisher
Market Minds Advisory
Report Code
MMA-2026-CHM-149
Published
August 2026
Contact
sales@marketmindsadvisory.com | www.marketmindsadvisory.com

Purchase the full Cosmetic Ingredients Market Report (2026 to 2036).

The full report sizes cosmetic ingredient demand across six functional categories, five end-use applications, and seven regions with 2026 to 2036 forecasts under base, bull, and bear cases. It separates active ingredient value from functional volume, which behave as entirely different businesses with different pricing logic. Competitive profiles cover twenty suppliers assessed consistently on cosmetic ingredient revenue, clinical evidence depth, and regulatory clearance breadth. Cost analysis traces oleochemical feedstock exposure alongside substantiation and dossier cost inflation. Commercial guidance addresses clinical investment, multi-jurisdiction clearance, fermentation platform build, and preservation system selling.
Six functional ingredient categories sized separately by region
Active ingredient value separated from functional volume
Regulatory clearance status mapped across three major jurisdictions
Clinical evidence depth assessed across twenty suppliers
Preservative attrition tracked against reformulation demand
Fermentation-derived active economics compared with extraction routes

Built For The People Who Decide

From boardroom strategy to bench-side execution, this report is read cover-to-cover by leaders shaping the next decade of their industry, turning demand scenarios, market dynamics and valuation benchmarks into decisions.
CXOs/ Presidents/ VPs/ Managers
M&A and Corporate Development
Strategy Teams and R&D Heads
Procurement and Product Directors
Regulatory and Compliance Leaders
Investor Relations and Equity Analysts