Corrosion Under Insulation and Spray On Insulation Coating Market
Corrosion Under Insulation and Spray On Insulation Coating Market: Applied Cost, Inspection-Led Demand, and Which Performance Claims Survive Contact With a Refinery
Surface preparation costs three times the coating itself, which means every commercial argument in this market is really an argument about how often a plant has to shut down and prepare steel again.
2025 MARKET VALUE$2.7BMarket Size 2025
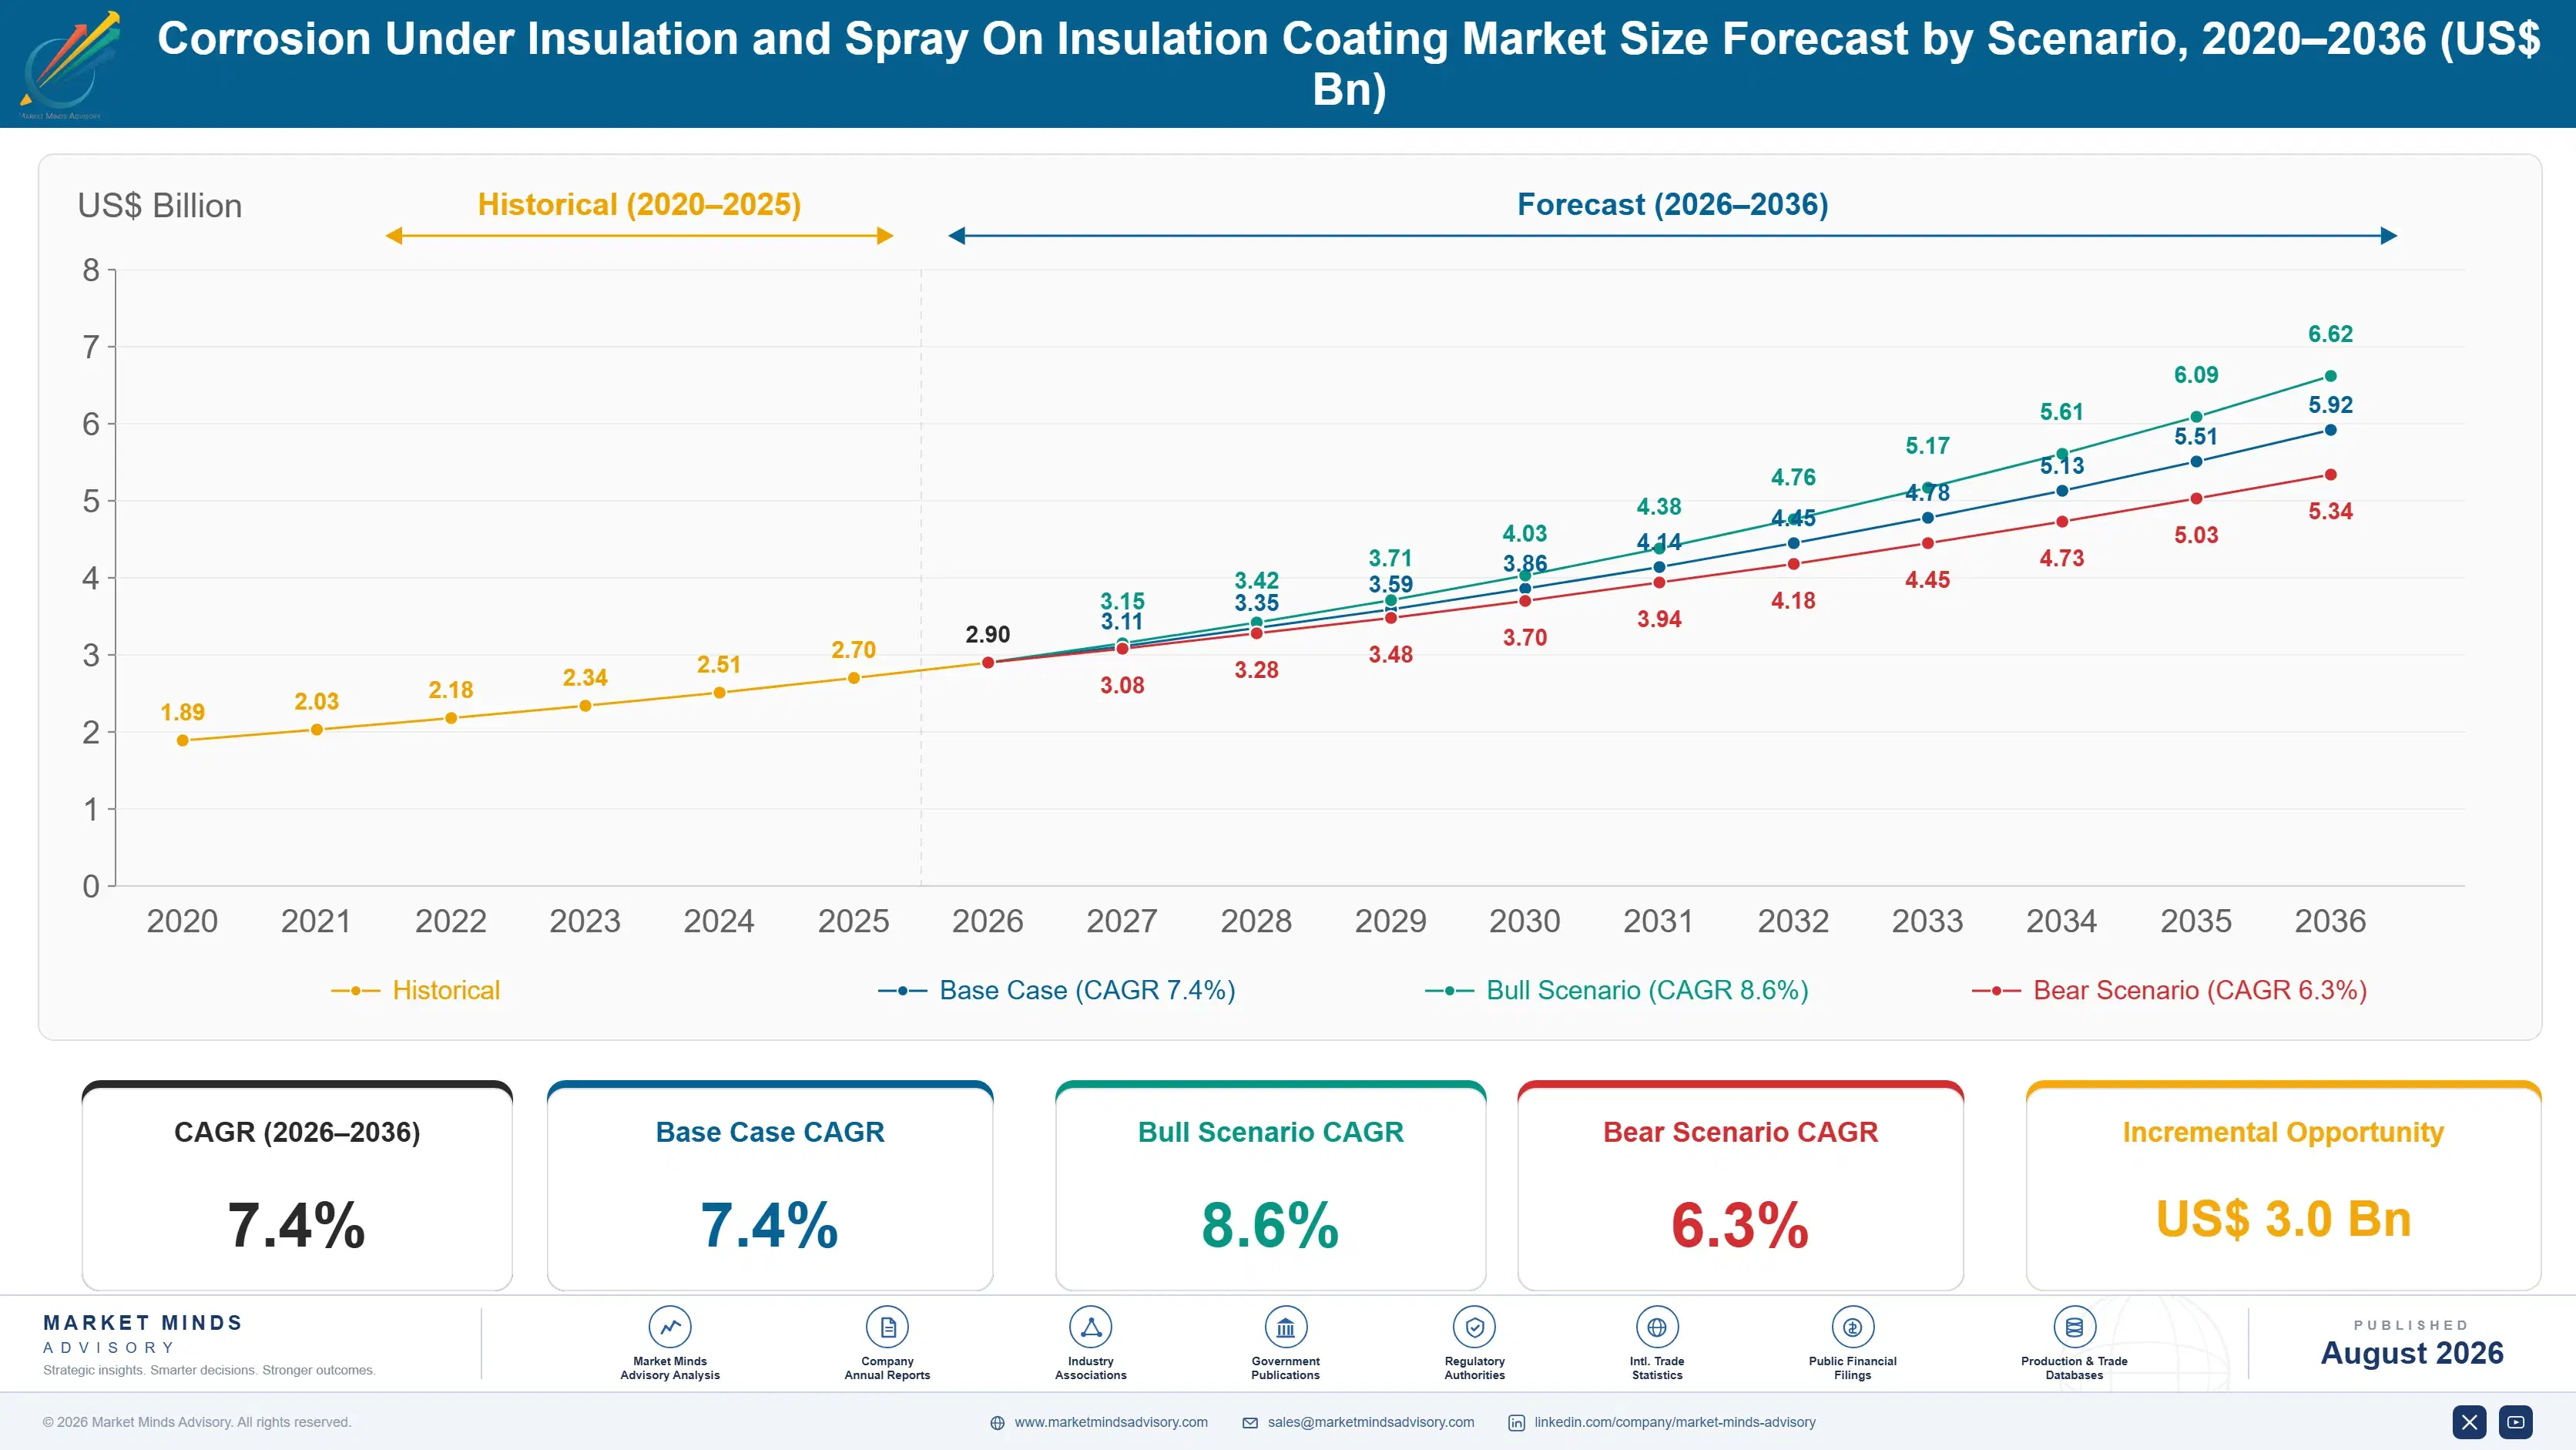
2036 FORECAST VALUE$5.9BBase Case , 2026 to 2036
CAGR 2026 TO 20367.4 %Bull 8.6% / Bear 6.3%
INCREMENTAL OPPORTUNITY$3.0BNet 10- year value creation
EXPANSION MULTIPLE2.04x2036 value over 2026 base
Strategic Levers
M&A Pipeline
Regional Outlook
Country Rankings
Competitive Intelligence
Segmental Deep-dive
Executive Snapshot and Market Trajectory
Corrosion under insulation is the most expensive failure mode in process industry that nobody sees coming. Water reaches carbon steel through a breach in the vapour barrier and works quietly for years until an inspection or a leak finds it. Insulation hides the damage entirely until somebody actually removes it.
Commercial power sits with coating suppliers who own the applicator relationship and the specification, because surface preparation costs roughly three times the material and the applicator decides what goes on the steel. Aerogel-based insulating coatings grow fastest at 12.6%, roughly 1.70 times the market, from a small base and against genuine scepticism about performance claims. East Asia holds 28% of global value, on the largest installed asset base anywhere.
Concentration is high at roughly 52% for the top five, and specification listing on operator approved-product schedules matters more than price in any account worth winning. Inspection-led programmes generate 44% of demand, which makes revenue far less cyclical than new construction coatings. Remediation funds this industry far more reliably than construction does. Remediation, not construction, funds this industry now, and the ageing asset base keeps enlarging that work. Recoat intervals average nine years.
Market Definition
The market comprises protective and insulating coatings applied to process equipment operating under insulation or requiring surface thermal management, covering thermal spray aluminium, epoxy phenolic and novolac systems, inert multipolymeric matrix coatings, silicone and silicone hybrid coatings, aerogel-based insulating coatings, and ceramic microsphere insulating coatings. Value is measured at coating supplier level. Bulk insulation materials, jacketing and vapour barriers, general marine and structural steelwork coatings, application labour, and inspection services fall outside scope.
Base Year Value
$2.7B in 2025 (MMA Primary Research Dataset, August 2026)
Forecast Period
2026 to 2036, eleven discrete annual values
CAGR
7.4% base case. Bull 8.6%. Bear 6.3%.
Fastest Growth Segment
Aerogel-Based Insulating Coatings: 12.6% CAGR
Fastest Growth Country
India: 10.2% CAGR
Fastest Growth Region
South Asia and Pacific: 9.6% CAGR
Largest Region
East Asia: 28% of 2025 global value
Market Leaders
AkzoNobel, PPG Industries, Hempel, Jotun, and Sherwin-Williams lead on protective coating revenue in this application. Source: company annual reports and MMA Analysis, July 2026.
Primary Survey
n=3,800 procurement and R&D decision-makers, Q4 2025, six countries
Methodology
Demand-side build-up, cross-validated against public data, 47 expert interviews
Corrosion Under Insulation and Spray On Insulation Coating Market Forecast Scenarios

Between 2020 and 2025 the market grew on inspection findings rather than on construction. Operators shifted from reactive repair toward risk-based inspection programmes that specifically target corrosion under insulation, and each survey generated remediation scope. Liquefied gas construction added new-build volume after 2022. Raw material costs rose sharply through the same period as epoxy and silicone feedstocks tightened. The 6.1% historical growth mixes programme expansion with price pass-through.
The 7.4% base case rests on three mechanisms. Inspection-led integrity programmes keep converting hidden corrosion into funded remediation scope on a schedule set by asset age rather than by capital cycles. Liquefied gas, hydrogen, and petrochemical construction adds new-build specification where operators now write coating requirements into project standards from the outset. And thin insulating coatings are finding genuine application in personnel protection, a compliance requirement rather than an efficiency argument.
The 8.6% bull case assumes integrity budgets hold through any industrial downturn and that insulating coatings win acceptance in mainstream process specifications. The 6.3% bear case reflects deferred maintenance during weak refining margins, project delays, and continued scepticism toward thermal performance claims that field results have not always supported. Credibility, not chemistry, decides the insulating coating part of it.
The 7.4% base case rests on three mechanisms. Inspection-led integrity programmes keep converting hidden corrosion into funded remediation scope on a schedule set by asset age rather than by capital cycles. Liquefied gas, hydrogen, and petrochemical construction adds new-build specification where operators now write coating requirements into project standards from the outset. And thin insulating coatings are finding genuine application in personnel protection, a compliance requirement rather than an efficiency argument.
The 8.6% bull case assumes integrity budgets hold through any industrial downturn and that insulating coatings win acceptance in mainstream process specifications. The 6.3% bear case reflects deferred maintenance during weak refining margins, project delays, and continued scepticism toward thermal performance claims that field results have not always supported. Credibility, not chemistry, decides the insulating coating part of it.
Why Applied Cost Beats Material Price Every Time
Three things set the commercial shape of this market. Applied cost comes first, because surface preparation runs roughly three times the material cost and the coating is the cheapest part of the job. Specification listing comes second, since operators maintain approved-product schedules and a coating not on the list cannot be quoted whatever it costs. Applicator capability comes third, and it decides whether the specified system actually performs.
TOP-FIVE CONCENTRATION52%Share of global protective coating supply held by leading producers
AVERAGE APPLIED COSTUSD 96 per sq mTypical surface preparation and application cost on process equipment
INSPECTION DRIVEN SHARE44%Portion of demand arising from integrity inspection programmes
RESIN COST SHARE34%Binder resin input within total coating manufacturing cost
RECOAT CYCLE LENGTH9 yearsTypical interval before reapplication on hot service equipment
PREPARATION COST MULTIPLE3.1xSurface preparation cost relative to the coating material itself
The applied cost point reshapes every commercial argument. A coating that costs 30% more per litre but extends the recoat interval from six years to twelve is dramatically cheaper over the asset life, because the saving is in avoided blasting, scaffolding, insulation removal, and shutdown time rather than in material. Suppliers who cannot make that argument with field data compete on price per litre and lose money doing it.
Thin insulating coatings occupy an awkward position. Marketed for thermal efficiency, they deliver a small fraction of what bulk insulation achieves per millimetre, and independent field results have frequently disappointed. Where they genuinely earn their place is personnel protection on hot surfaces and elimination of the annular gap that traps water, which are compliance and corrosion arguments rather than energy ones.
"Half the marketing in insulating coatings compares a two millimetre film to no insulation at all, which is a comparison nobody in a refinery is actually making. The honest case is burn protection and getting rid of the gap where water sits. That case is strong enough on its own, and overselling the energy story has cost this category years of credibility."
Market Trends
Operators have moved from opening insulation on a fixed schedule to targeting inspection where temperature, age, and design details make corrosion under insulation likely, following guidance that industry bodies formalised over the past decade. That approach finds more damage in fewer openings, and each finding becomes funded remediation scope rather than a deferred observation. Roughly 44% of coating demand now originates this way. Commercially the effect is that revenue tracks asset age and inspection budgets instead of capital spending, which makes it considerably steadier through industrial downturns than new construction work.
Market Impact: Recoat cycles average 9 years
Personnel Protection Becomes the Honest Case for Thin Coatings
Hot surfaces above roughly sixty degrees Celsius create burn risk that operators must manage, and traditional answers are bulk insulation with jacketing or physical guarding, both of which are bulky and expensive on complex geometry. Thin insulating coatings solve that specific problem well: a few millimetres drops touch temperature below the threshold on valves, flanges, and small-bore pipework where nothing else fits. That is a compliance-driven purchase with a clear specification test behind it, unlike thermal efficiency claims that field measurement has often failed to support convincingly. The specification writes itself, unusually.
Market Impact: Adds specification value above 20%
Market Opportunities and Growth Drivers
Ageing Process Assets Generate Remediation Demand Regardless of Capital Cycles
Much of the refining and petrochemical base across North America, Western Europe, and Japan was built between the nineteen sixties and eighties, and corrosion under insulation accumulates with time rather than with throughput. Recoat intervals average nine years on hot service, which means an operator with a large insulated inventory faces continuous remediation whatever the market does. This demand is funded from maintenance and integrity budgets that boards protect far more carefully than growth capital. It is the single most reliable revenue stream in protective coatings and it grows as the asset base ages further.
Market Impact: Preparation costs 3.1 times material
New Energy Construction Writes Coating Specifications From the Outset
Liquefied gas terminals, hydrogen facilities, and new petrochemical complexes are being designed by operators who learned expensive lessons about corrosion under insulation on their existing assets. Project standards now specify coating systems, surface preparation grades, and inspection holds before insulation is applied, rather than leaving it to contractor discretion. That raises specification value per project considerably and locks suppliers in through approved-product listing. The projects also concentrate in the Gulf, East Asia, and North America, which shifts where suppliers need approval listings and applicator relationships to compete. Designing the problem out costs far less than remediating it later.
Market Impact: Trials run over 24 months
Market Restraints and Challenges
Surface Preparation Dominates Cost and Constrains Every Application
Preparation runs roughly 3.1 times the coating material cost once blasting, containment, scaffolding, and insulation removal are counted. The root cause is physical: these coatings need a clean, profiled steel surface and the equipment is usually insulated, elevated, and often still operating. That makes any application a shutdown event with associated production loss. Suppliers mitigate through surface-tolerant chemistry that performs over less perfect preparation, systems applicable at lower temperatures, and single-coat products that reduce application time. None of it removes the fundamental access problem. Access, not chemistry, is the binding cost. Shutdown scheduling governs everything else.
Market Impact: Inspection drives 44% of demand
Performance Claims Face Justified Scepticism From Technical Buyers
Insulating coating marketing has frequently compared thin films against bare steel rather than against the bulk insulation an operator would otherwise fit, and field results have disappointed enough integrity engineers to create lasting caution. The root cause is a genuine physics limit: thermal resistance scales with thickness, and a few millimetres cannot substitute for fifty. That scepticism now slows adoption even where the application is legitimate. Suppliers are responding with third-party validated test data, instrumented field trials, and honest positioning around personnel protection rather than energy savings. Honest positioning is finally rebuilding trust.
Market Impact: Protects above 60 degrees Celsius
4 additional market trends, 3 additional growth drivers, and 2 additional restraints and challenges are covered in the full report. Contact sales@marketmindsadvisory.com to access the complete intelligence.
Segment CAGR and Growth Architecture
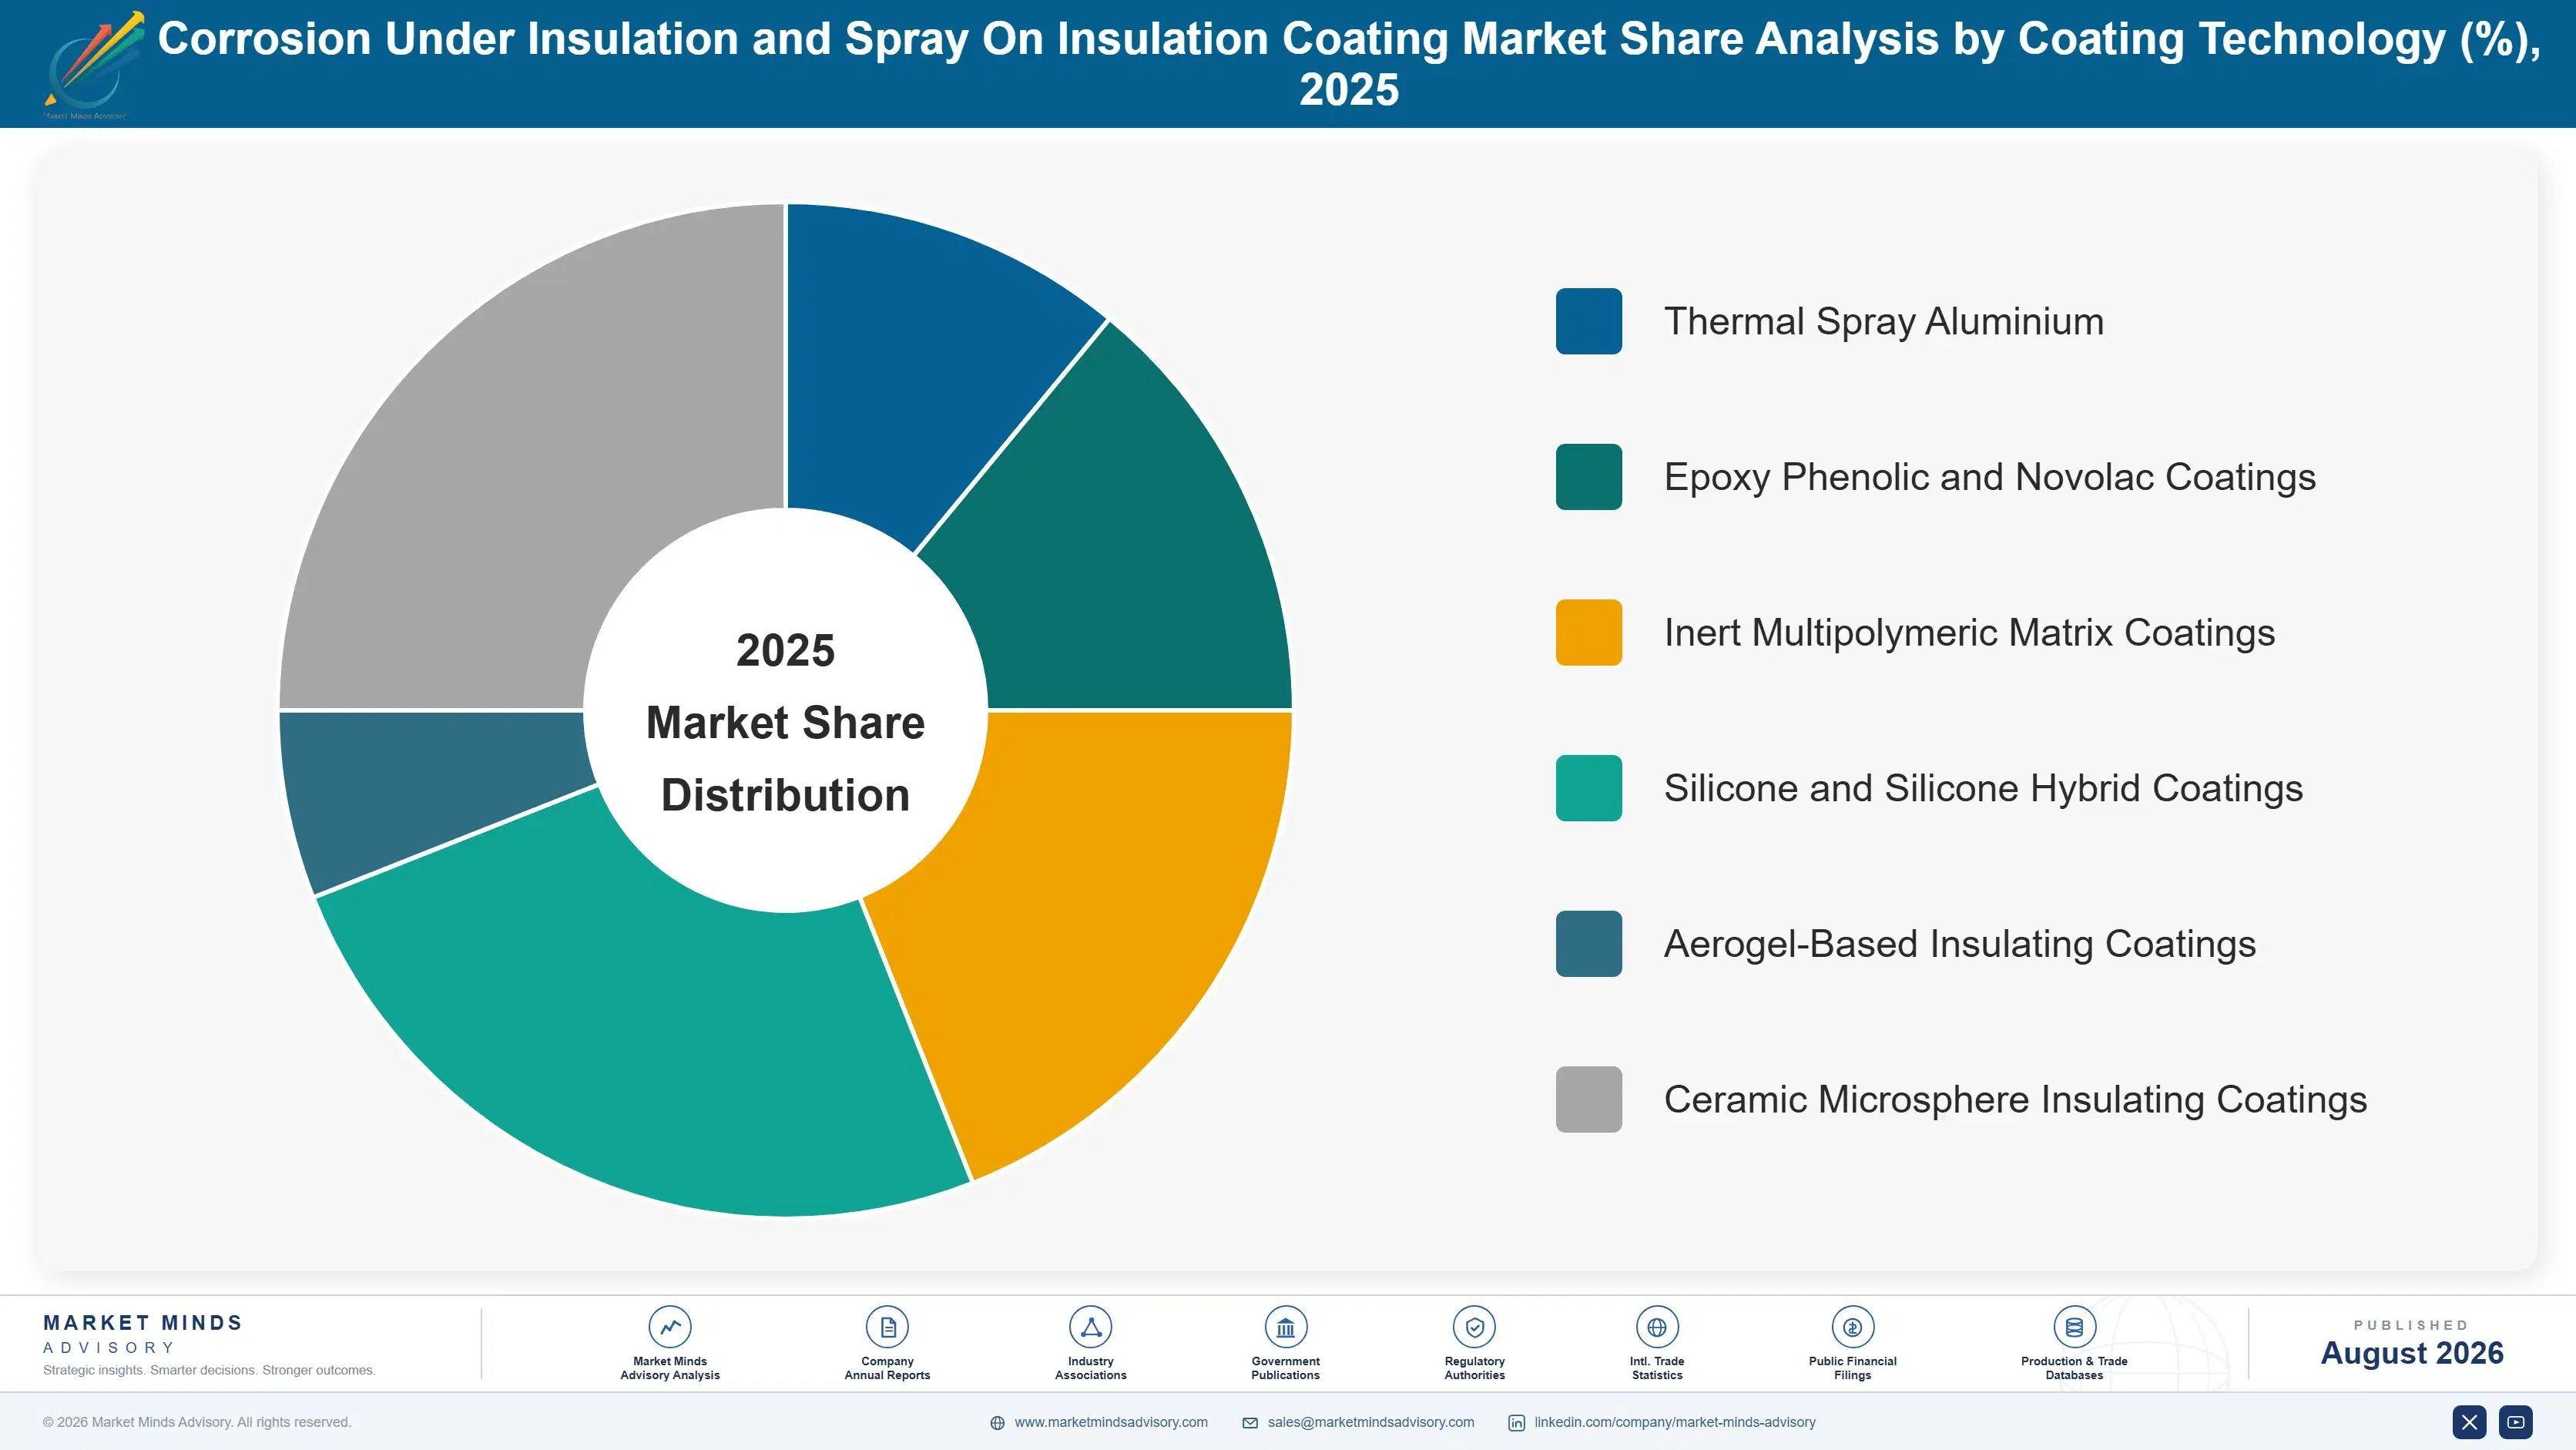
Segmentation follows coating technology, because the chemistry determines maximum service temperature, tolerance of cyclic wet and dry conditions, achievable film thickness, surface preparation requirement, and expected recoat interval. Six technologies cover commercial supply, and they compete only partially, since service temperature and geometry exclude several from any given application. Recoat interval is the metric that actually decides selection.

Aerogel-Based Insulating Coatings
The fastest-growing technology at 12.6%, roughly 1.70 times the market, and the smallest by volume. Silica aerogel particles loaded into a flexible binder deliver the lowest thermal conductivity available in any sprayable film, and the material is hydrophobic, which addresses water retention rather than merely resisting it. Personnel protection on complex geometry is the strongest application, because a few millimetres brings touch temperature below the burn threshold where bulk insulation physically will not fit. Cost per square metre runs several times conventional coatings. Adoption is held back less by price than by scepticism carried over from earlier insulating coating claims that field data failed to support. Honest positioning around burn compliance is rebuilding the category's credibility.
CAGR 12.6%
Inert Multipolymeric Matrix Coatings
Second fastest at 8.9%, and increasingly the preferred single-coat answer for cyclic service between cryogenic and around two hundred degrees Celsius. The chemistry tolerates wet and dry cycling without the thermal degradation that catches conventional epoxies, and it can be applied over marginally prepared surfaces, which matters enormously when preparation is 3.1 times material cost. Single-coat application at higher film build cuts shutdown duration, and that saving usually dwarfs the material price premium. Operators who have run these systems through a full inspection cycle tend to specify them again, which is the strongest endorsement available in this market. Field evidence from a completed inspection cycle outweighs any laboratory comparison here.
CAGR 8.9%
Full segment breakdown across 6 segments available in the complete report.
Regional Architecture and Country Demand Map
Regional shares follow installed process asset base and how formally integrity is managed. Ageing refining and petrochemical inventory drives remediation demand, while new liquefied gas and chemical construction drives specification demand, and the two behave as quite different commercial businesses. Approved-product listing practice varies just as much between them.
North America
The most formally managed integrity environment anywhere, and coating spend per unit of asset reflects it. Refining and petrochemical infrastructure across the Gulf Coast and Midwest is old enough that corrosion under insulation is a continuous programme rather than an occasional finding, and risk-based inspection is standard practice at every major operator. Gulf Coast liquefaction construction adds new-build specification work with coating requirements written into project standards. Approved-product listings at the large operators are the practical barrier to entry, and they take years to secure. Applicator capability is a genuine constraint, with certified crews in short supply during turnaround season. Growth of 7.9% blends steady remediation with project-driven specification demand.
Share: 27% | CAGR: 7.9% (2026 to 2036)
Western Europe
Regulation and asset age together define this market. The refining and chemical base is among the oldest in the world and much of it faces closure decisions, which cuts both ways: operators approaching shutdown defer coating spend while those committing to continued operation invest heavily in integrity. North Sea offshore assets represent a distinct and demanding sub-market where corrosion under insulation on process modules carries safety consequences beyond economics. NORSOK and ISO specification frameworks set qualification requirements that suppliers must meet before quoting. AkzoNobel, Hempel, and Jotun all hold strong regional positions built on offshore qualification. Growth of 5.8% is the slowest in the report and reflects a contracting asset base.
Share: 20% | CAGR: 5.8% (2026 to 2036)
Regional intelligence for 5 additional markets available in the complete report: East Asia, South Asia and Pacific, Latin America, Middle East and Africa, Eastern Europe. Contact sales@marketmindsadvisory.com.

Four Moves That Change the Economics
Advantage in this market comes from approved-product listing, applicator relationships, and credible field data rather than from coating chemistry, which competitors reformulate within a couple of years. Four moves are worth capital and management attention across the forecast period, and three of them cost technical resource rather than plant. The fourth simply requires abandoning a marketing story that never worked.
Sell recoat interval, not price per litre
Surface preparation costs 3.1 times the material, so extending a recoat cycle from six years to twelve saves the operator far more than any material discount could. A system priced 30% above the alternative that doubles the interval cuts lifetime applied cost by roughly 40%, and that arithmetic wins with integrity engineers even when procurement resists it. Making the argument requires instrumented field data from assets that have actually run a full cycle, which takes years to accumulate and cannot be substituted with laboratory results. Procurement will still resist, and integrity engineers usually overrule them.
Market Impact: Cuts total lifetime applied cost by roughly 40%
Secure approved-product listing at major operators
Large operators maintain schedules of qualified coating systems, and a product not on the list cannot be quoted regardless of performance or price. Listing requires qualification testing, field references, and technical engagement that typically runs two to three years and costs perhaps $400,000 to $900,000 per major operator. Once listed, the position holds across every site that operator runs, and removal is rare. Suppliers treat this as a sales expense when it is properly a capital investment with a decade-long return profile behind it. The return profile runs a decade or more.
Market Impact: Costs $400,000 to $900,000 for each major operator
Certify and equip the applicator network directly
The applicator decides whether a specified system performs, and a coating failure blamed on preparation still damages the supplier's field record. Certified applicator programmes with training, equipment support, and inspection protocols reduce warranty exposure and hold 7 to 12 percentage points of price advantage where operators require certified application. They also create advocates: crews trained on one system recommend it because they know it applies predictably. The investment is training infrastructure and field technical staff rather than any manufacturing spend. Warranty exposure falls at the same time, which most suppliers never quantify.
Market Impact: Holds 7 to 12 points of price advantage
Position insulating coatings for burn protection first
Thermal efficiency claims have damaged the credibility of this whole category, and technical buyers now discount them automatically before any conversation begins. Personnel protection is a compliance requirement with a defined test, and thin coatings genuinely solve it on valves, flanges, and small-bore pipework where bulk insulation cannot fit. Repositioning around that application typically converts trial rates from below 20% to well above half, because the buyer is comparing against physical guarding rather than against fifty millimetres of mineral wool. Withdrawing the efficiency claims entirely is the necessary first step, and most suppliers find that harder than it should be.
Market Impact: Lifts trial conversion rates above 50% in practice
Who Controls the Margin Pool
Concentration is high: the top five hold roughly 52% of global protective coating revenue in this application, and approved-product listing rather than manufacturing scale separates them. AkzoNobel leads on breadth of qualification across operators and geographies. PPG and Hempel compete on similar terms with different regional strengths, while Jotun holds a particularly strong offshore and marine-derived position and Sherwin-Williams anchors North American industrial coverage.
Competitive activity runs on three fronts. Approved-product listing is the first, because it determines who can even quote at a major operator. Field performance record is the second, and it accumulates only through assets that have run a full recoat cycle. Applicator network reach is the third, and it decides whether a specified system performs in practice rather than on paper. Scale helps with none of the three directly.
Pressure is building from two directions. Specialist insulating coating suppliers with aerogel technology are entering from outside the traditional coatings industry with genuinely different chemistry. And regional producers across Asia are competing effectively wherever approved-product listing is less rigidly enforced by the operator. Neither has yet displaced anyone from the approved-product schedules that decide who competes.

Competitive Moat and Risk Dimensions
Moat: Breadth of operator qualification
Approved-product listings across a very wide range of operators and geographies took decades to assemble and function as a permission structure competitors cannot shortcut. A supplier listed at most major operators can quote everywhere, while a technically superior product without listings cannot quote at all, which turns qualification breadth into the dominant commercial asset.
Risk: Slow response to new chemistry
Large qualification portfolios create inertia, because introducing a genuinely new system means requalifying it everywhere the incumbent product is already listed. Specialist entrants with aerogel and inert matrix chemistry face no such burden and are winning trials on technical merit, particularly in applications where conventional epoxy systems have visibly underperformed.
Moat: Applicator network and technical service
Field technical representatives and certified applicator relationships give PPG influence over how coatings actually get applied, which matters because preparation and application determine outcomes far more than formulation does. That presence also generates the field performance data that wins the next specification, compounding the position over time.
Risk: Exposure to refining asset closures
A heavy weighting toward mature North American and European refining and chemical assets creates exposure to the closure decisions now facing much of that base. Operators approaching shutdown defer coating spend entirely, and the demand does not transfer to whoever replaces the capacity, which is usually in a different region with different approved-product schedules.
Players Tracked
Prominent Players
AkzoNobel
PPG Industries
Hempel
Jotun
Sherwin-Williams
Other Key Players
Axalta Coating Systems
Chugoku Marine Paints
Kansai Paint
Nippon Paint Holdings
Sika
Carboline
Belzona International
Aspen Aerogels
Cabot Corporation
Mascoat
Teknos Group
Tnemec Company
Wacker Chemie
Evonik Industries
KCC Corporation
Recent Developments
Hempel extends inert matrix coating range
The company broadened its single-coat corrosion under insulation range into additional service temperature bands, targeting cyclic wet and dry conditions that conventional epoxy systems handle poorly. Single-coat application reduces shutdown duration, which is where the operator saving actually sits rather than in material cost. Qualification work continues.
Signal: Shutdown duration, and not coating price, is becoming the argument suppliers now lead with in remediation work
Aerogel coating wins refinery personnel protection specification
A European refinery adopted an aerogel-loaded insulating coating for burn protection on valves and small-bore pipework where bulk insulation could not be fitted practically. The specification was written around touch temperature compliance rather than around any thermal efficiency claim being made for the product. Touch temperature was verified on site.
Signal: Positioning around personnel protection is converting trials that thermal efficiency claims had consistently failed to win
Jotun expands certified applicator programme in Asia
Additional applicator training and certification capacity opened across Southeast Asia, responding to specification demand that regional crew capability had been unable to execute reliably. Coating failures attributed to preparation quality had been damaging field records across several operator accounts in the region. Certification capacity roughly doubled.
Signal: Applicator capability is now the binding constraint on converting any specification win into applied coating revenue
What Sets the Cost Base
Binder resin dominates at roughly 34% of coating manufacturing cost, principally epoxy, novolac, silicone, and specialty polymer chemistries whose pricing tracks petrochemical and siloxane markets. Functional pigments and fillers, including aluminium flake, zinc, and micaceous iron oxide, contribute 21%. Aerogel and hollow microsphere fillers cost several times conventional pigments and dominate the cost of insulating grades specifically. Solvents, additives, packaging, and quality control absorb the balance.
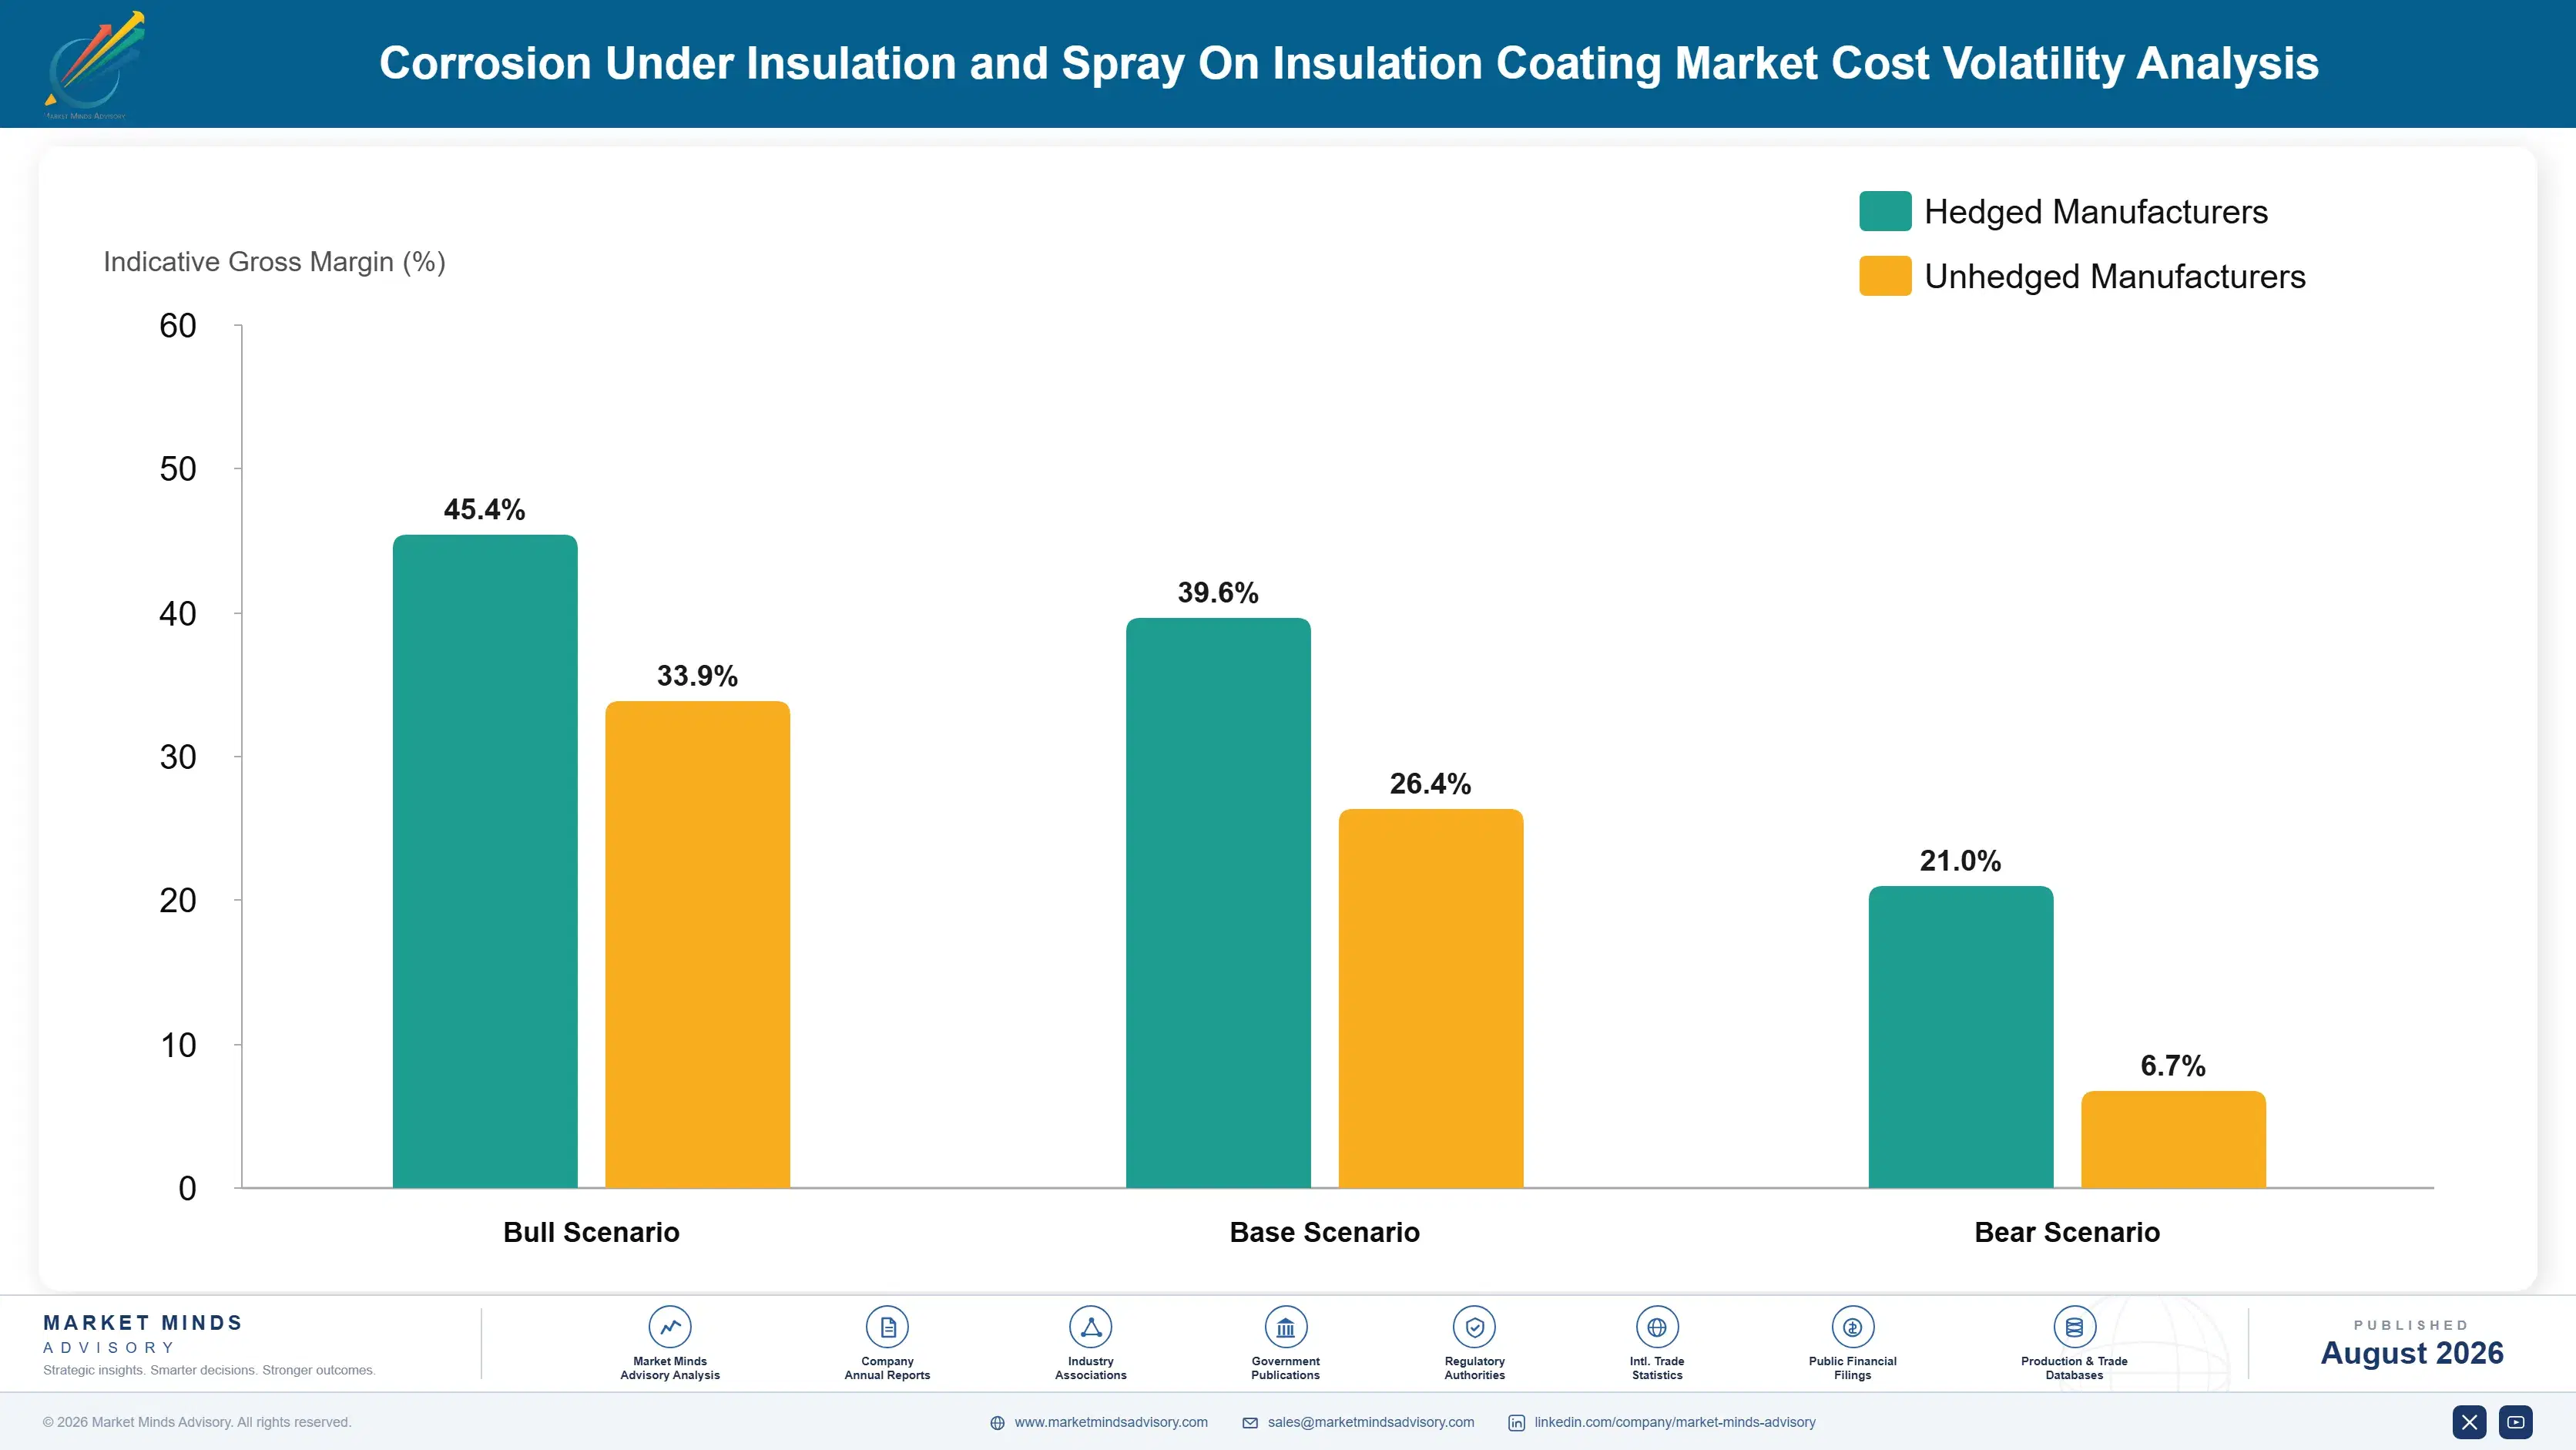
Epoxy and silicone feedstocks both moved sharply through 2021 and 2022. European chemical output fell under the energy conditions IEA reporting documented, epichlorohydrin and siloxane supply tightened, and coating producers passed through what contract terms allowed. AkzoNobel and PPG both referenced raw material cost inflation and pricing actions across their reporting for those years. Project contracts priced a year ahead absorbed the increase, while maintenance business repriced faster.
Exposure divides on product mix rather than on scale. Producers weighted toward epoxy and novolac systems carry petrochemical feedstock risk that moves with oil, while silicone-weighted portfolios track siloxane markets that behave quite differently. Insulating grades face a third structure entirely, dominated by aerogel and microsphere filler cost that sits with a narrow supplier base. European manufacturing carries higher energy cost than Asian production.

Index project contracts to published resin benchmarks
Project coating contracts are frequently priced a year or more before application, and fixed terms left producers absorbing the last resin cycle in full. Indexing to published epoxy or siloxane benchmarks moves that risk to buyers who carry it across a whole project cost base. Engineering contractors resist, and resistance softens after any severe input cycle.
Qualify second sources for aerogel and microsphere fillers
Insulating grade cost is dominated by fillers sourced from a narrow supplier base, several of whom also sell finished insulating products. Qualifying alternatives costs formulation and testing work before any shortage arrives. Producers who deferred this found themselves allocated when personnel protection demand accelerated, and allocation in a growing category costs specification positions permanently.
Reformulate toward higher solids and single-coat systems
Solvent content adds cost, regulatory exposure, and application time without contributing to performance. Higher solids formulations reduce material volume per square metre and cut the number of coats required, which shortens shutdown duration for the operator. Reformulation work is significant and requalification at listed operators is the real obstacle rather than the chemistry itself.
Portfolio Architecture for Margin Defence
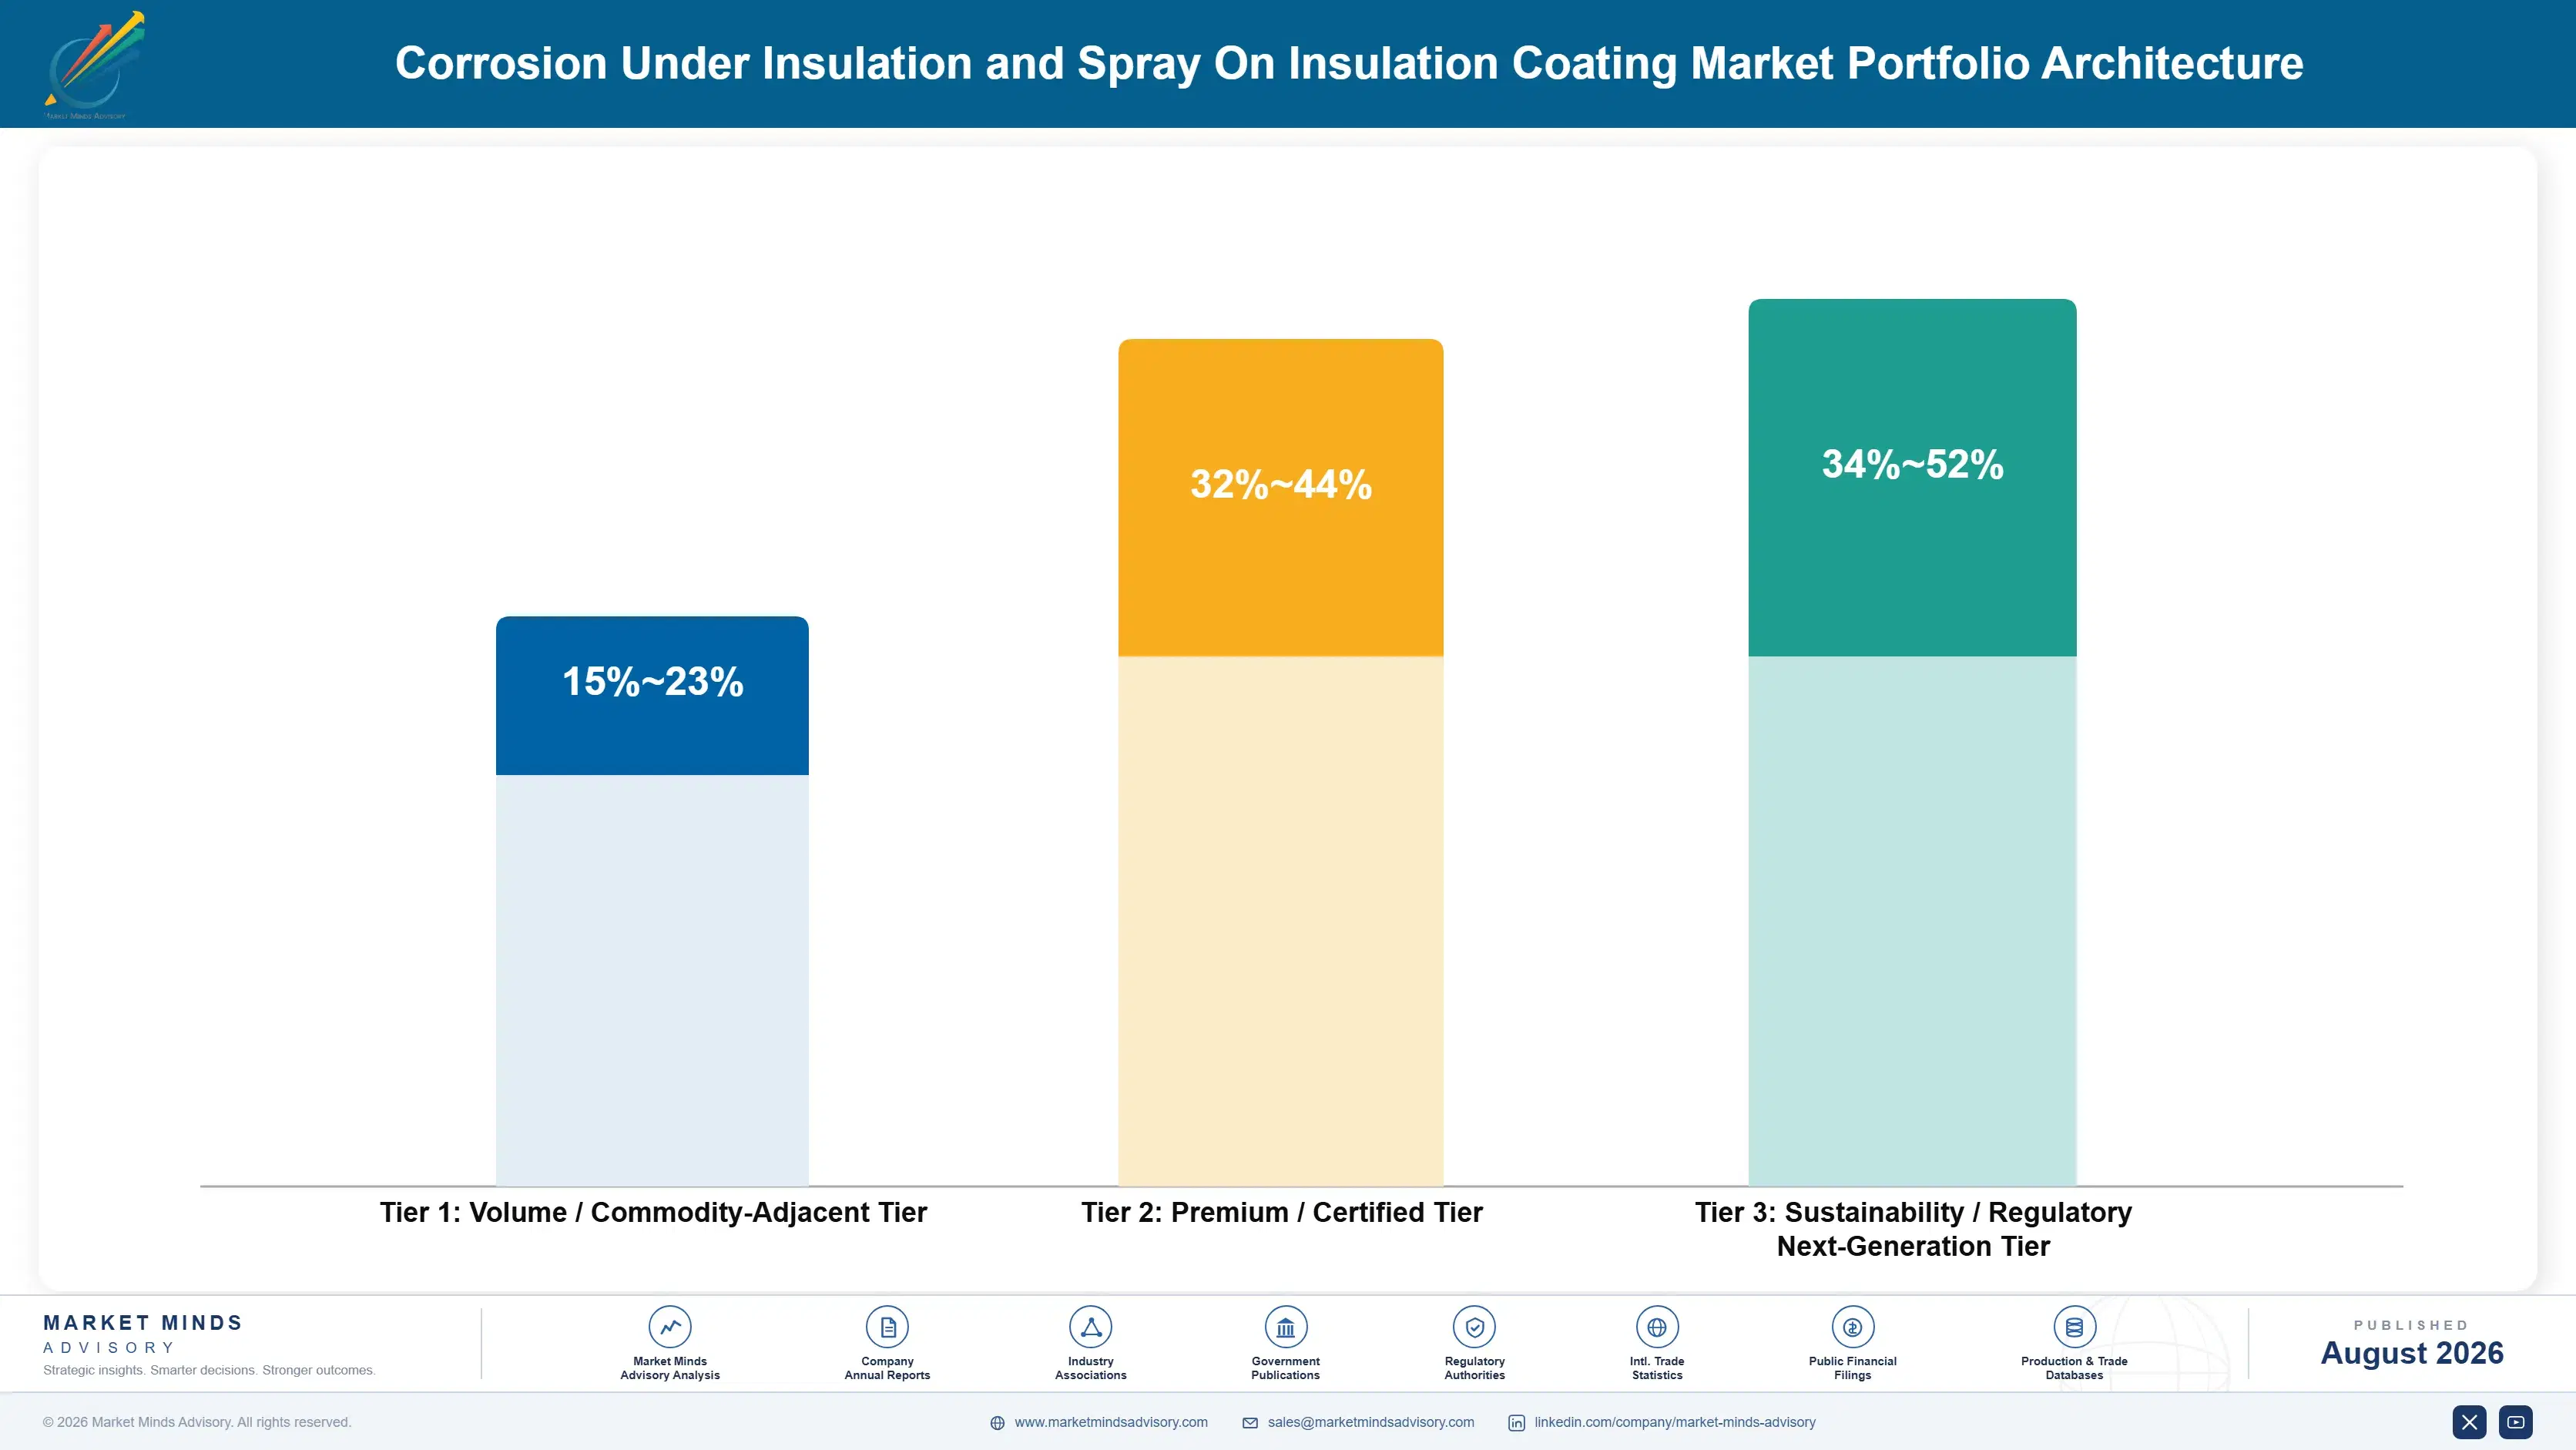
Margin follows qualification and service temperature rather than volume. General-purpose epoxy systems sold into undemanding service earn low to mid teens gross margin, because several producers meet the specification and applicators buy on delivered price. Qualified high-temperature and cyclic-service systems earn considerably more, since approved-product listing limits the field and the operator is buying avoided shutdown rather than a coating.
The volume and premium tension shows in qualification economics rather than in plant loading. Approved-product listing costs hundreds of thousands per operator and only pays where the operator has a large insulated inventory, so producers chase general industrial volume to fund the technical organisation that pursues listings. That works while the general volume holds, and Asian competition is steadily eroding it at the commodity end.
High-value pools concentrate in three places: qualified cyclic-service systems for corrosion under insulation, aerogel-based personnel protection coatings, and offshore-qualified systems under demanding specification frameworks. Each is defended by qualification or physics rather than by price. Price competition arrives in each only when a competitor secures the same listing, accumulates a comparable field record, or matches the thermal physics, and none of those can be bought or accelerated with capital.
Volume / Commodity-Adjacent Tier
General-purpose epoxy and alkyd systems for ambient and low-temperature service sold through distribution to applicators. Competes on delivered price. The range reflects large differences in resin sourcing and regional manufacturing cost.
Gross Margin: 15%-23%
Premium / Certified Tier
Qualified cyclic-service and high-temperature systems listed on operator approved-product schedules. The buyer purchases avoided shutdown and a field performance record rather than a coating, and substitution requires requalification. Field evidence is what secures the listing.
Gross Margin: 32%-44%
Sustainability / Regulatory / Next-Generation Tier
Aerogel-based insulating coatings, low-solvent high-solids systems, and personnel protection products sold on compliance grounds. Small volumes at premium pricing. The range is wide because insulating grade pricing has not yet settled.
Gross Margin: 34%-52%

High-value Sub-segments and Strategic Watch-out
Qualified Cyclic Service Systems
The commercial foundation of this market, sold against avoided shutdown rather than material price. Approved-product listing keeps the bidding field narrow, and a full recoat cycle of field evidence is what secures the next specification. Defend listings above everything else. Nothing else in the portfolio compounds this way.
Gross Margin: 34%-46%
Aerogel Personnel Protection Coatings
The highest-growth pool at 12.6%, and it wins on burn compliance rather than on any thermal efficiency argument. Complex geometry where bulk insulation cannot fit is the natural application. Credibility damage from earlier overselling is the obstacle to manage. Position it honestly and the conversion rate transforms.
Gross Margin: 36%-50%
Offshore Qualified Coating Systems
Demanding specification frameworks and safety consequences support pricing that onshore work does not. Qualification under those frameworks takes years and screens out most competitors before commercial discussion. The asset base is mature but integrity spending stays protected. Qualification breadth here is genuinely hard to replicate.
Gross Margin: 33%-45%
General Industrial Epoxy Supply
The strategic watch-out. Competes on delivered price against Asian producers with lower manufacturing cost and no qualification overhead to carry. It funds the technical organisation and holds applicator relationships, and it should be priced for exactly that. Manage it for coverage rather than for margin.
Gross Margin: 15%-22%
How Demand Actually Reaches Suppliers
The annuity here is unusually good because the failure mechanism never stops. Water reaches steel under insulation, corrosion proceeds, and coatings degrade on a recoat interval averaging nine years whether or not anything new is built. Inspection-led programmes now convert that physics into funded scope on a predictable schedule, supplying 44% of demand from maintenance budgets that boards protect through downturns far more reliably than they protect growth capital.
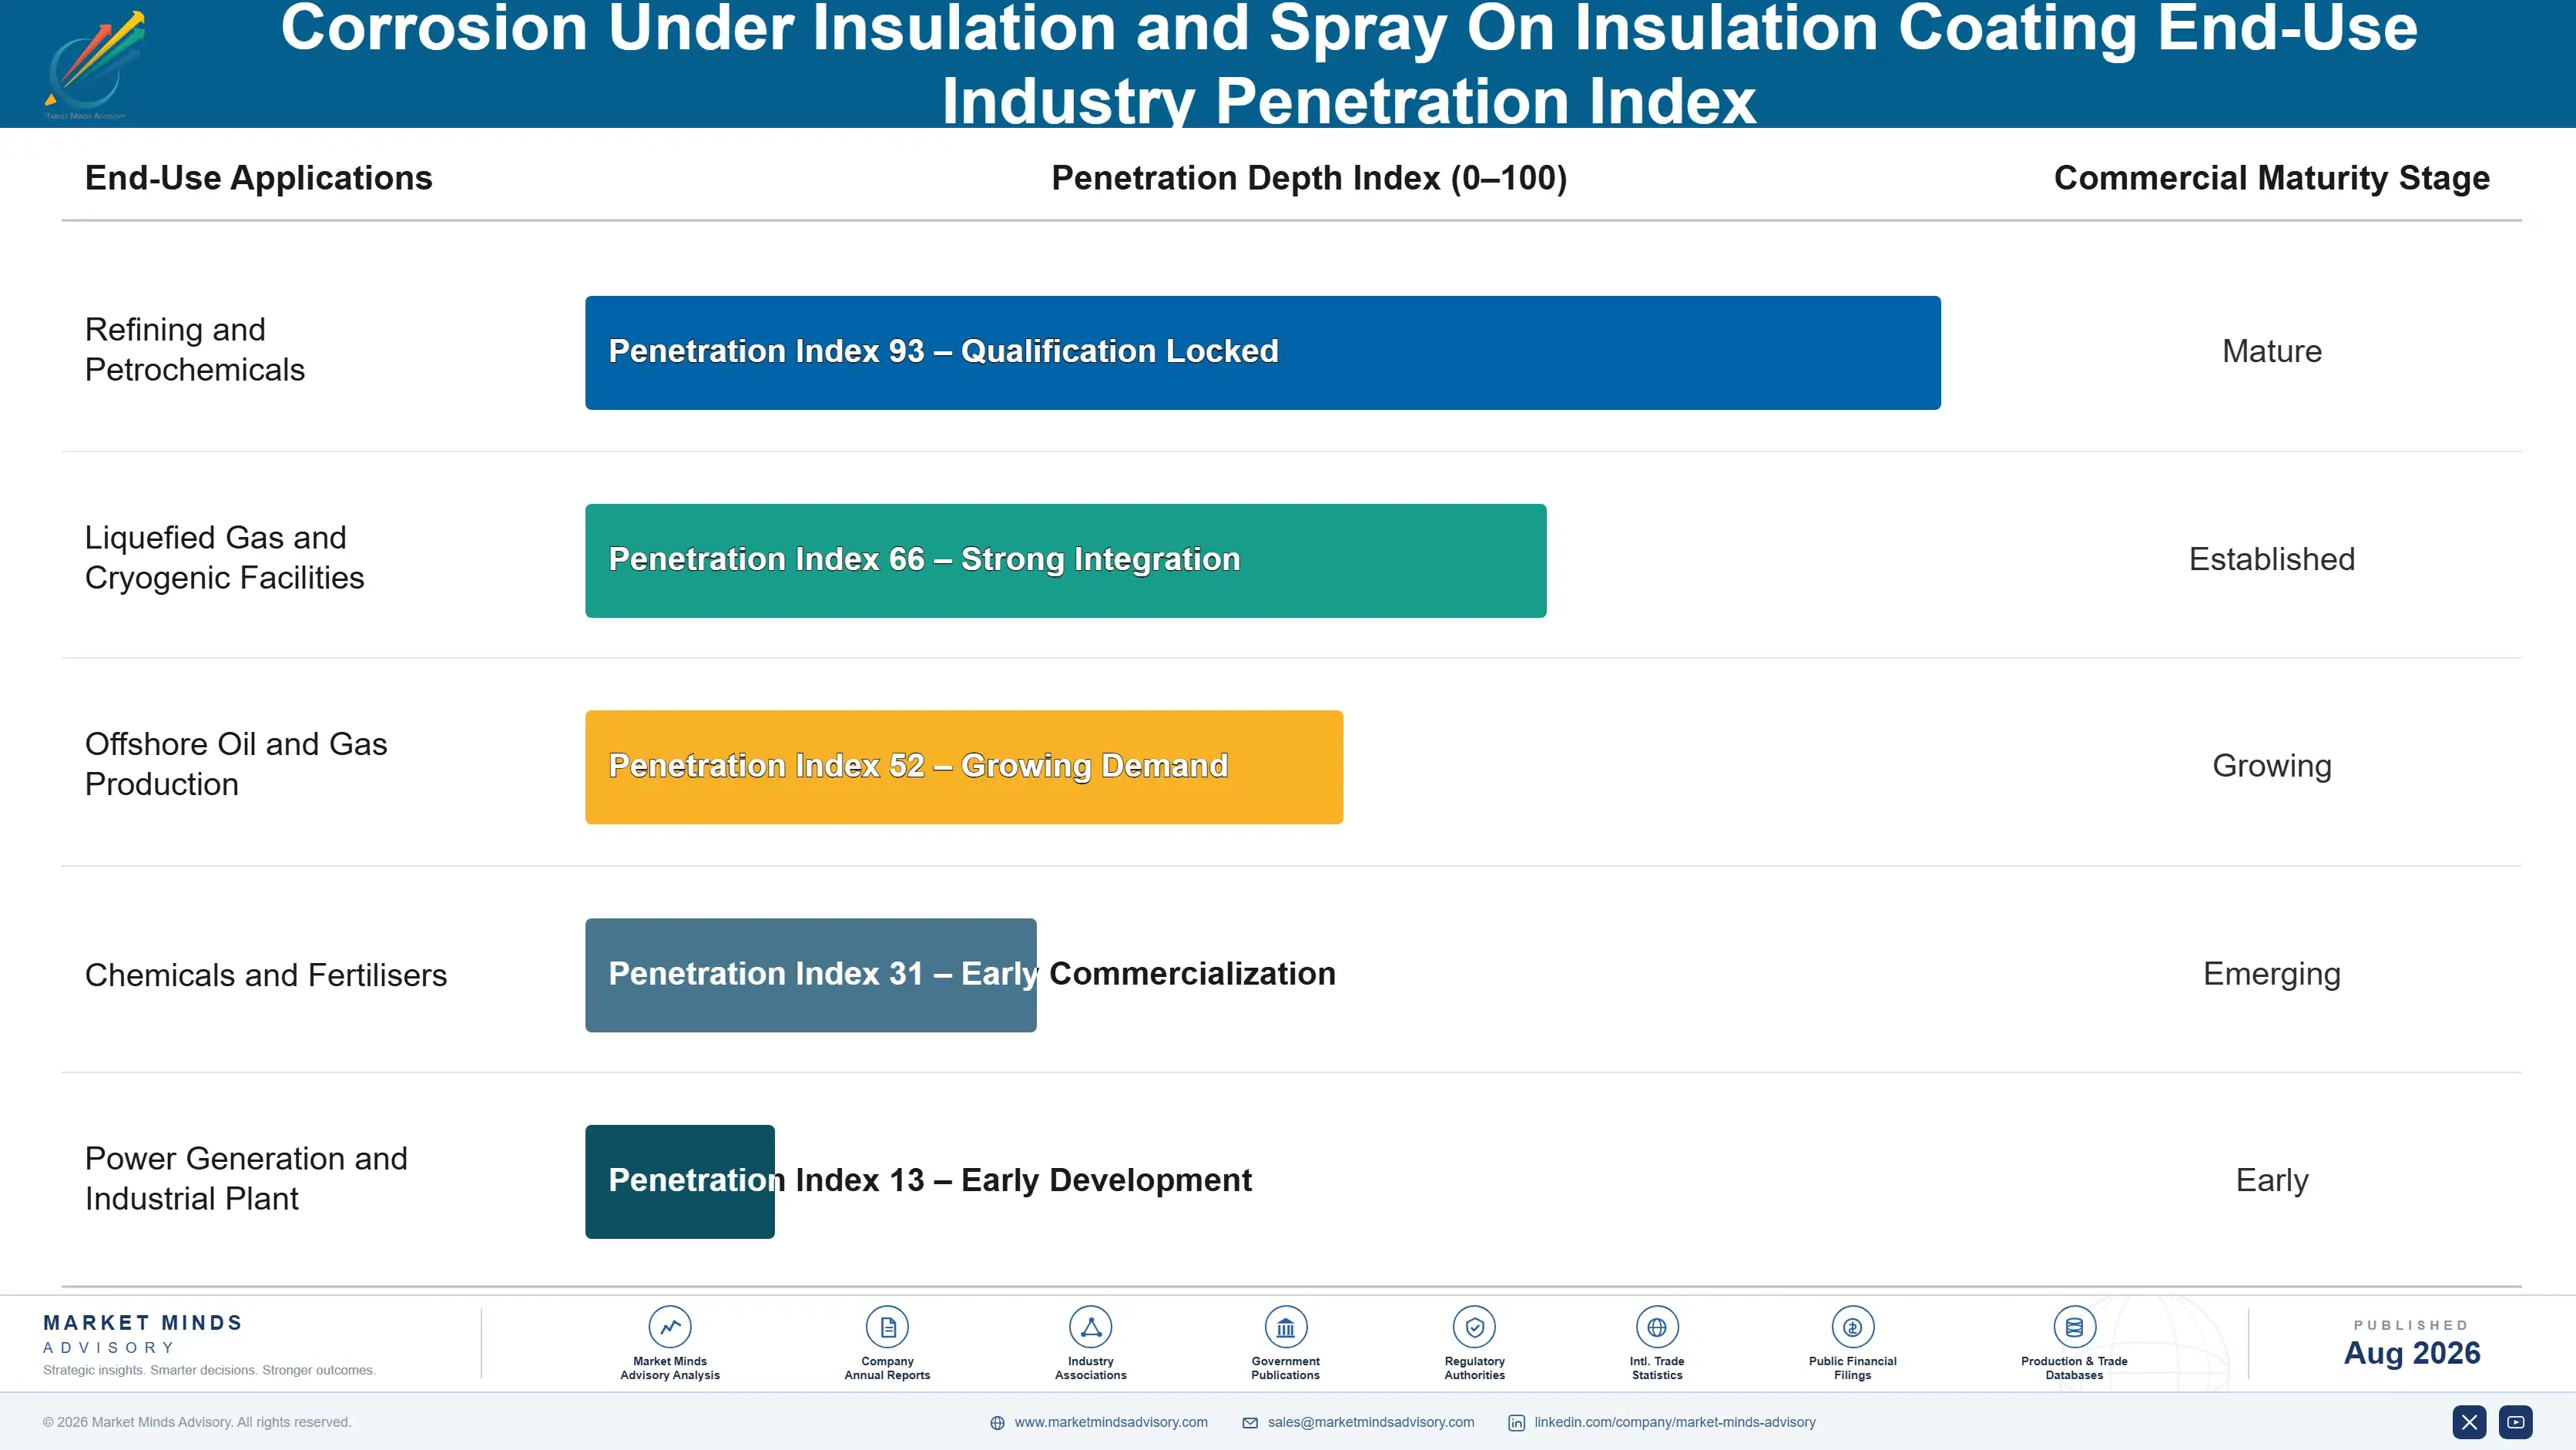
Adoption depth varies sharply by vertical. Offshore operators run the deepest specifications because a corrosion failure carries safety consequences beyond economics. Refining and petrochemical operators sit close behind, with formal integrity programmes and approved-product schedules. Liquefied gas facilities specify from project standards written by owners who learned expensive lessons elsewhere. General industrial users are the shallowest, buying to a generic standard and switching on price.
The buyer has shifted decisively toward asset integrity engineers and away from procurement. Those engineers read inspection data and field performance records rather than product literature. What convinces them is a coating that has completed a full cycle on a comparable asset and been opened up for inspection, which means the argument rests on evidence accumulated years earlier.

Where the Money Sits
These are among the four positions where our research anticipates prominent divergence between winners and laggards over the coming forecast period. Each is grounded in the demand model, the regulatory perimeter, and the announced capacity pipeline.
Argue recoat interval, because material price is nearly irrelevant
Surface preparation runs 3.1 times the coating material cost once blasting, scaffolding, insulation removal, and lost production are counted properly. A system priced 30% higher that then doubles the recoat interval cuts lifetime applied cost by roughly 40%, and integrity engineers understand that arithmetic even when procurement resists it. Making the case needs instrumented field data from assets that have completed a full cycle, which takes years to accumulate and which no amount of laboratory testing can ever substitute for.
Treat qualification as capital investment, not sales expense
Major operators maintain approved-product schedules, and a system not listed cannot be quoted anywhere that operator runs regardless of its technical merit or price. Listing typically costs perhaps $400,000 to $900,000 and takes two to three years of qualification testing and field references to secure properly. Once achieved it holds across every site and is rarely removed, which makes listing an asset carrying a decade-long return profile rather than the ordinary marketing cost that most suppliers still book it as.
Certify the crews, because preparation decides your field record
The applicator alone determines whether a specified system actually performs in service, and a failure attributed to poor surface preparation still damages the coating supplier's field performance record permanently. Certification programmes with training, equipment support, and inspection protocols hold 7 to 12 percentage points of price advantage where the operator requires certified application. They also produce crews who actively advocate for the system because they know it applies predictably every time, which no amount of specification selling can ever replicate.
Lead with burn protection, because efficiency claims destroyed credibility
Thermal efficiency marketing compared thin films against bare steel rather than against the bulk insulation an operator would otherwise fit, and technical buyers now discount every such claim automatically before any conversation starts. Personnel protection is a compliance requirement with a defined touch temperature test, and thin coatings genuinely solve it where bulk insulation cannot physically fit. Repositioning typically lifts trial conversion above 50%, because the buyer is then comparing the product against physical guarding rather than against fifty millimetres of mineral wool.
Engagement Snapshot From the Field
A live engagement with an industry participant carrying material or product regulatory and market exposure ahead of a defining policy shift, showing how our research translates into a defensible multi-year portfolio strategy.
MARKET MINDS ADVISORY · CLIENT ENGAGEMENT SUMMARY
Corrosion Under Insulation and Spray On Insulation Coating Producer Strategic Portfolio Review and Transition Roadmap 2026·Investment Scenario on Corrosion Under Insulation and Spray On Insulation Coating Exposure Evaluation 2025-26
CLIENT PROFILE
A regional protective coatings producer serving refining and petrochemical applicators across three countries, with revenue near USD 118 million (client-reported, unverified by MMA). The business held strong applicator relationships and competitive epoxy formulations, but appeared on the approved-product schedules of only two of the eleven major operators in its territory. Regional integrity spending had grown steadily throughout.
STRATEGIC CHALLENGE
Revenue had been flat for three years despite growing regional integrity spending, because the accounts adding scope were operators where the client could not quote at all. Management needed to know whether pursuing approved-product listings was economically justified, which operators to target first, and what the qualification programme would realistically cost and take.
MMA APPROACH
MMA mapped approved-product schedules and qualification requirements across all eleven operators, sized insulated inventory and remediation spend per operator, and modelled listing cost against addressable revenue. Forty-seven expert interviews with integrity engineers, specification authorities, and applicators established how listing decisions are actually made and defended internally. Published schedules reveal none of that.
KEY FINDINGS
- Nine of the eleven major operators were entirely closed to the client, and together they represented roughly four times the addressable spend of the two where listing already existed.
- Qualification cost averaged USD 600,000 and took twenty-six months per operator, but three operators shared enough of their testing framework to be pursued as a single combined programme.
- The client's applicator relationships proved more valuable than management realised, since several operators weighted certified application capability heavily in their listing decisions.
- Insulating coating enquiries were being lost on thermal performance questions the client could not answer, while personnel protection applications went entirely unpursued across the whole territory.
CLIENT PROFILE
A regional protective coatings producer serving refining and petrochemical applicators across three countries, with revenue near USD 118 million (client-reported, unverified by MMA). The business held strong applicator relationships and competitive epoxy formulations, but appeared on the approved-product schedules of only two of the eleven major operators in its territory. Regional integrity spending had grown steadily throughout.
STRATEGIC CHALLENGE
Revenue had been flat for three years despite growing regional integrity spending, because the accounts adding scope were operators where the client could not quote at all. Management needed to know whether pursuing approved-product listings was economically justified, which operators to target first, and what the qualification programme would realistically cost and take.
MMA APPROACH
MMA mapped approved-product schedules and qualification requirements across all eleven operators, sized insulated inventory and remediation spend per operator, and modelled listing cost against addressable revenue. Forty-seven expert interviews with integrity engineers, specification authorities, and applicators established how listing decisions are actually made and defended internally. Published schedules reveal none of that.
KEY FINDINGS
- Nine of the eleven major operators were entirely closed to the client, and together they represented roughly four times the addressable spend of the two where listing already existed.
- Qualification cost averaged USD 600,000 and took twenty-six months per operator, but three operators shared enough of their testing framework to be pursued as a single combined programme.
- The client's applicator relationships proved more valuable than management realised, since several operators weighted certified application capability heavily in their listing decisions.
- Insulating coating enquiries were being lost on thermal performance questions the client could not answer, while personnel protection applications went entirely unpursued across the whole territory.
RECOMMENDED STRATEGY
Phase 1: Phase one: pursue combined qualification at the three operators sharing a testing framework, funding it as capital investment rather than from the annual sales budget. Phase 2: Phase two: formalise and certify the existing applicator network, using it as supporting evidence within the qualification submissions rather than treating it separately. Phase 3: Phase three: reposition insulating products around personnel protection compliance and withdraw all thermal efficiency claims from technical literature entirely. Rebuild the technical literature accordingly.
OUTCOME
The client secured listing at two of the three targeted operators within twenty-eight months and certified thirty-one applicator crews. Revenue from newly accessible operators reached 19% of the total by the second year, and personnel protection coating sales grew from nothing to a meaningful line (client-reported, unverified by MMA).
Frequently Asked Questions
Foundational context covering the market sizes, CAGR, scope, country, region and competition that inform every finding below. This section is provided to cover basics and most often pre-purchase conversations, answered from the MMA Primary Research Dataset.
What is the current size of the Corrosion Under Insulation and Spray On Insulation Coating Market?
The market was valued at USD 2.7 billion in 2025, rising to an estimated USD 2.90 billion in 2026. East Asia holds the largest regional share at 28% of global value.
How large will the Corrosion Under Insulation and Spray On Insulation Coating Market be by 2036?
MMA forecasts USD 5.92 billion by 2036 under the base case, an expansion multiple of 2.04 times the 2026 value. That represents USD 3.02 billion of incremental value across the forecast period.
What is the CAGR for the Corrosion Under Insulation and Spray On Insulation Coating Market 2026 to 2036?
The base case CAGR is 7.4%, with a bull case of 8.6% and a bear case of 6.3%. The spread reflects uncertainty over maintenance budgets and acceptance of insulating coating performance claims.
Which segment is growing fastest?
Aerogel-based insulating coatings grow fastest at 12.6%, roughly 1.70 times the market rate. Inert multipolymeric matrix coatings follow at 8.9%, favoured for single-coat application in cyclic service.
Who are the major companies in the Corrosion Under Insulation and Spray On Insulation Coating Market?
AkzoNobel, PPG Industries, Hempel, Jotun, and Sherwin-Williams lead on protective coating revenue here. The top five hold roughly 52% of global value, separated by approved-product listing breadth.
Which country is growing fastest?
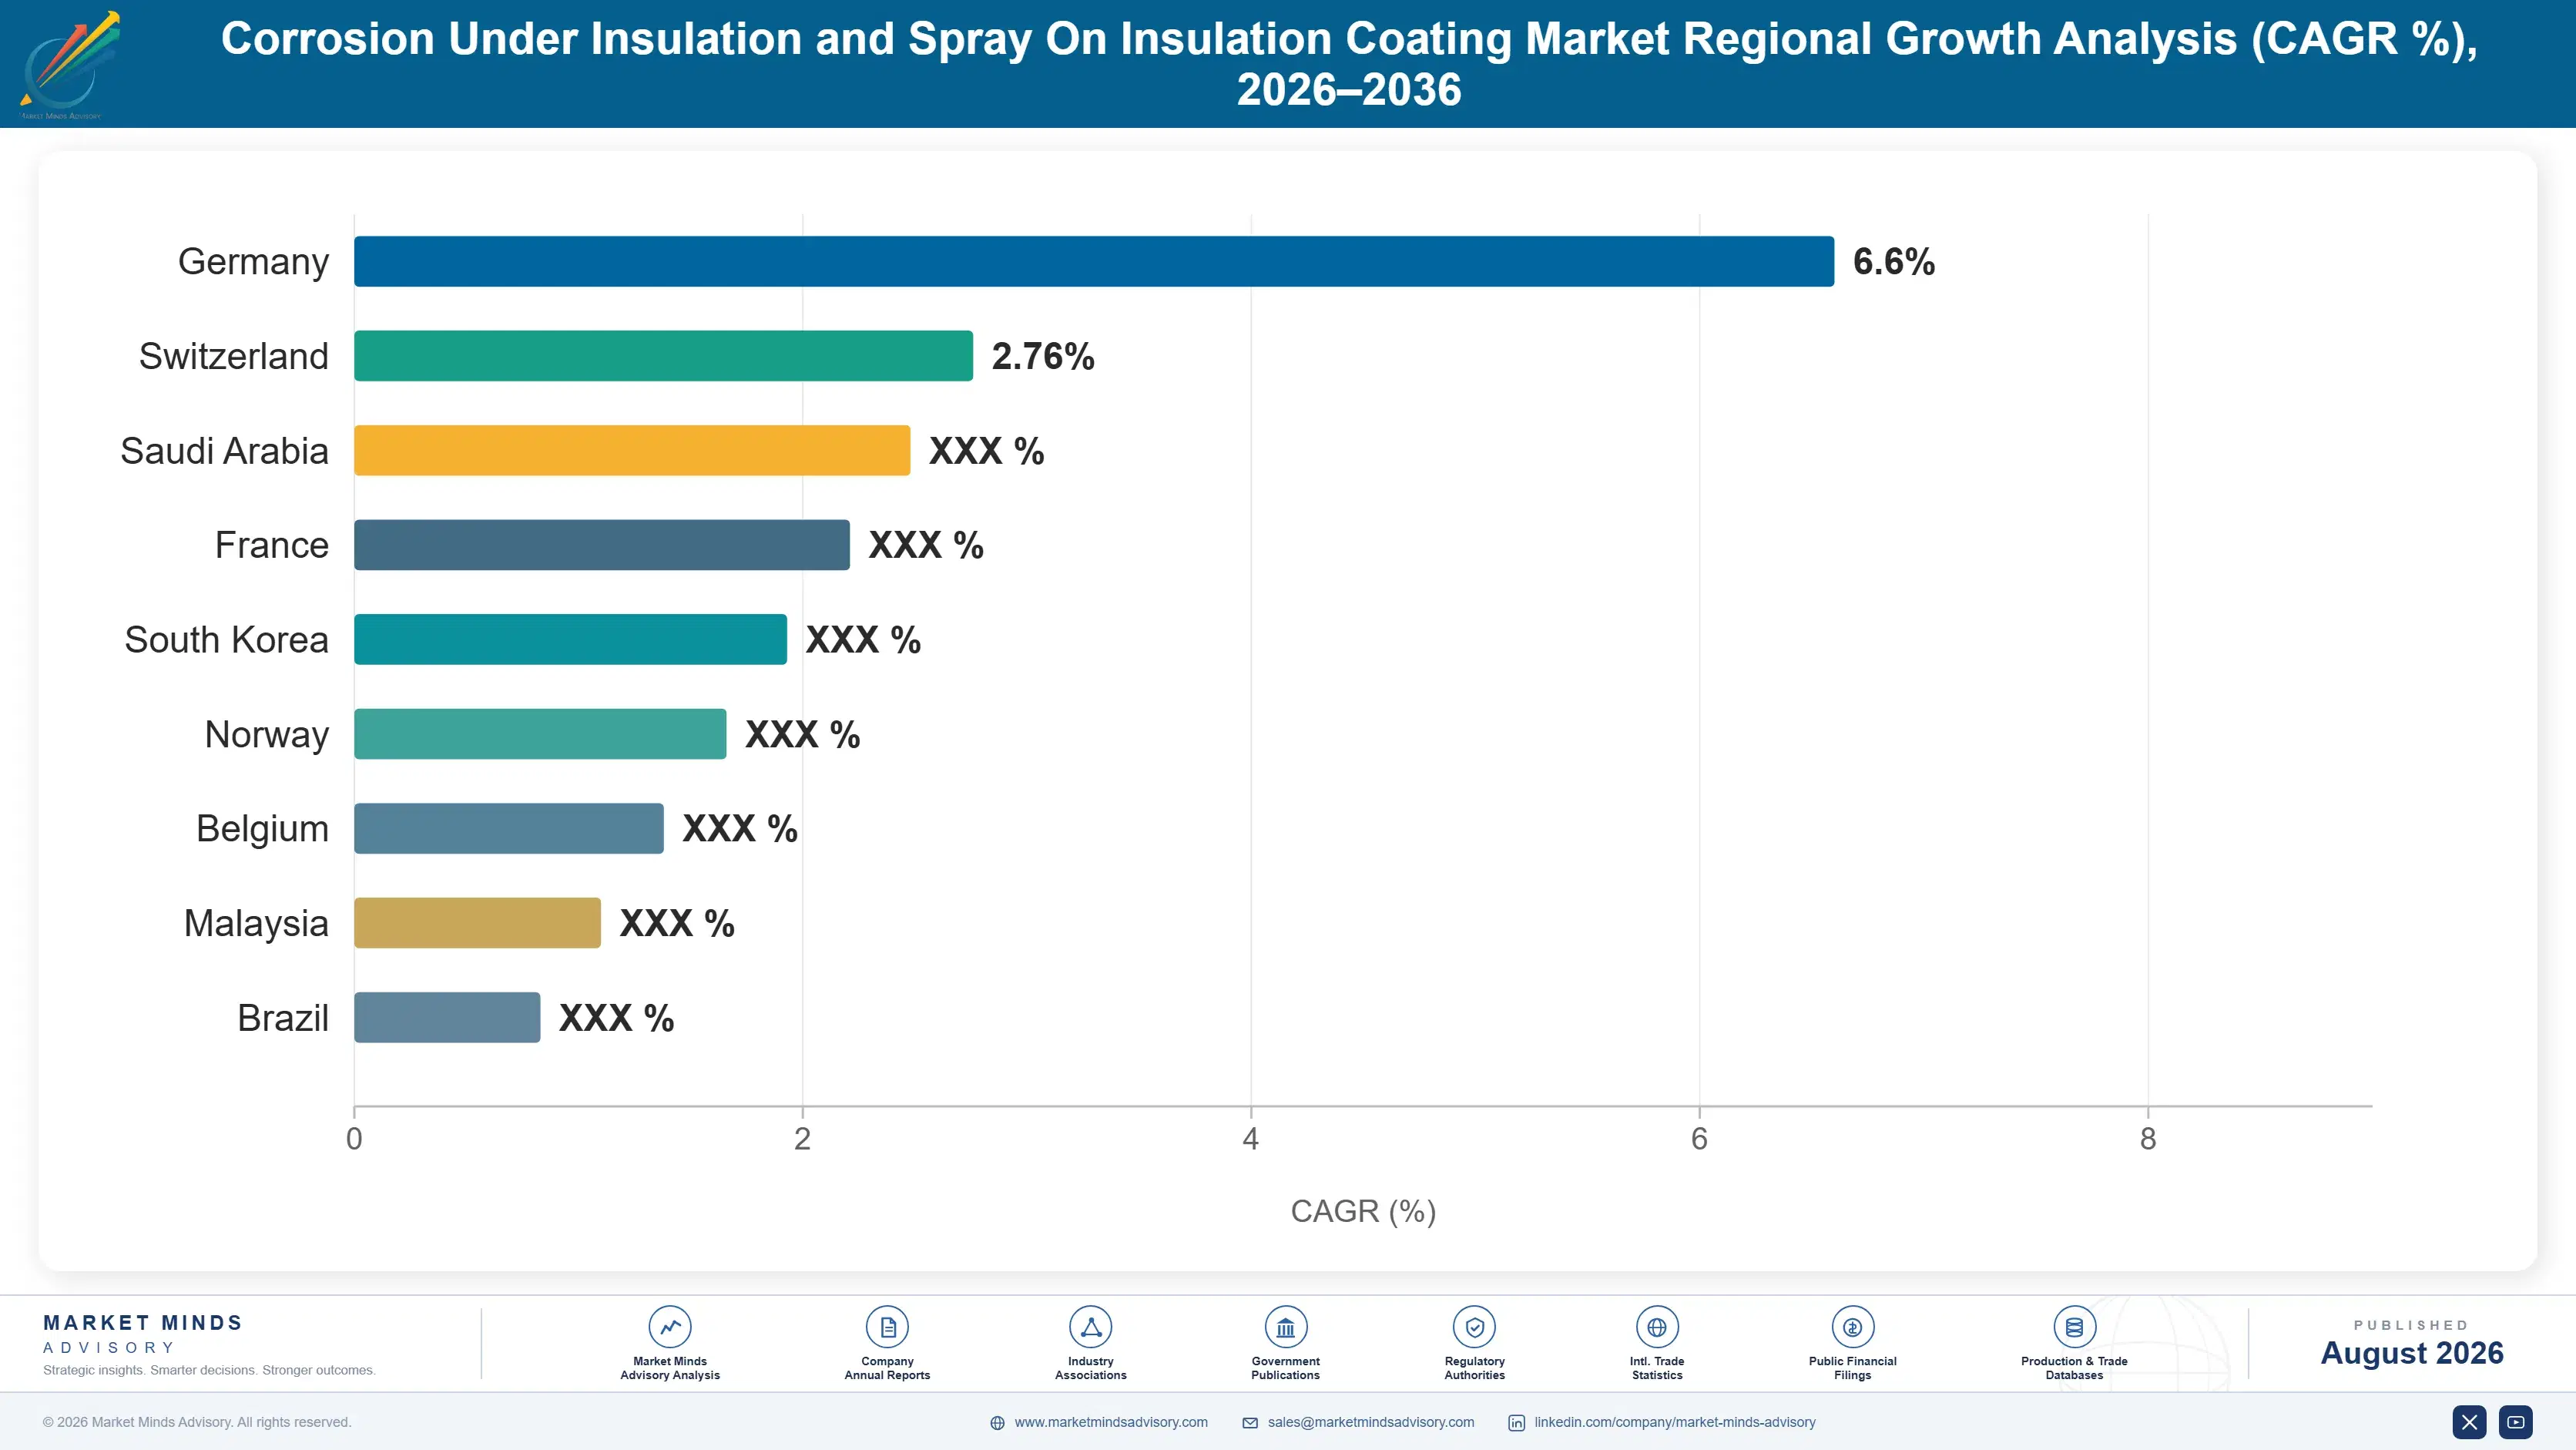
India grows fastest at 10.2%, driven by refinery and petrochemical expansion alongside coastal humidity that makes corrosion under insulation unusually aggressive. Operators increasingly write coating specifications into project standards.
Report Segmentation Architecture
The full report scope spans multiple orthogonal segmentation dimensions, with cross-tabulated demand data provided for each dimension pair. Coverage extends further to regional breakdowns, trend trajectories, and the competitive detail needed to support segment-level decision-making.
By Coating Technology
- Thermal Spray Aluminium
- Epoxy Phenolic and Novolac Coatings
- Inert Multipolymeric Matrix Coatings
- Silicone and Silicone Hybrid Coatings
- Aerogel-Based Insulating Coatings
- Ceramic Microsphere Insulating Coatings
By End-Use Industry
- Refining and Petrochemicals
- Liquefied Gas and Cryogenic Facilities
- Offshore Oil and Gas Production
- Chemicals and Fertilisers
- Power Generation and Industrial Plant
By Sales Model
- Operator Direct Specification Supply
- Applicator and Contractor Channel
- Engineering Contractor Project Supply
- Distributor and Reseller Channel
- Maintenance Framework Agreement Supply
By Region
- North America
- Western Europe
- East Asia
- South Asia and Pacific
- Latin America
- Middle East and Africa
- Eastern Europe
Scope, Methodology, and Coverage
Every figure in this report is reproducible from documented input assumptions. The scope below maps the historical period, the forecast horizon, the segmentation dimensions, and the countries covered, alongside the underlying primary and qualitative methodology.
Historical Period
2020 to 2025
Forecast Period
2026 to 2036
Base Year
2025 (USD billions; MMA Primary Research Dataset, August 2026)
Market Definition
The market comprises protective and insulating coatings applied to process equipment operating under insulation or requiring surface thermal management, covering thermal spray aluminium, epoxy phenolic and novolac systems, inert multipolymeric matrix coatings, silicone and silicone hybrid coatings, aerogel-based insulating coatings, and ceramic microsphere insulating coatings. Value is measured at coating supplier level across new construction and remediation demand. Bulk insulation materials, jacketing and vapour barrier systems, general marine and structural steelwork coatings, surface preparation and application labour, and inspection services fall outside scope.
Quantitative Units
USD billions (current prices); litres of coating supplied annually; USD per square metre of coated surface at reference film thickness
Segmentation Dimensions
By Coating Technology; By End-Use Industry; By Sales Model; By Region
Regions Covered
North America, Western Europe, East Asia, South Asia and Pacific, Latin America, Middle East and Africa, Eastern Europe
Countries Covered
United States, Canada, Mexico, Germany, Netherlands, United Kingdom, Norway, France, Italy, Belgium, Poland, Romania, Czechia, China, Japan, South Korea, India, Australia, Singapore, Malaysia, Brazil, Argentina, Saudi Arabia, United Arab Emirates, Qatar, Egypt, South Africa
Key Companies Profiled
AkzoNobel, PPG Industries, Hempel, Jotun, Sherwin-Williams, Axalta Coating Systems, Chugoku Marine Paints, Kansai Paint, Nippon Paint Holdings, Sika, Carboline, Belzona International, Aspen Aerogels, Cabot Corporation, Mascoat, Teknos Group, Tnemec Company, Wacker Chemie, Evonik Industries, KCC Corporation
Quantitative Methodology
Primary survey, n=3,800 respondents, Q4 2025, six countries; demand-side model with trade association cross-validation
Qualitative Methodology
47 expert interviews, Q4 2025; applied to validate demand model assumptions, identify emerging dynamics, and assess competitive positioning
Report Format
PDF and XLSX data workbook (Word format preview document)
Publisher
Market Minds Advisory
Report Code
MMA-2026-CHM-134
Published
August 2026
Contact
sales@marketmindsadvisory.com | www.marketmindsadvisory.com
Purchase the full Corrosion Under Insulation and Spray On Insulation Coating Market Report (2026 to 2036).
The full report sizes coating demand across six technologies, five end-use categories, and seven regions with 2026 to 2036 forecasts under base, bull, and bear cases. It separates inspection-led remediation demand from new construction specification, which behave as different businesses with different buyers and cycles. Competitive profiles cover twenty suppliers assessed consistently on protective coating revenue in this application, approved-product listing breadth, and applicator network reach. Cost analysis traces resin, pigment, and aerogel filler exposure through recent supply cycles. Commercial guidance addresses lifetime cost selling, qualification investment, applicator certification, and insulating coating positioning.
Six coating technologies sized separately by region
Inspection-led remediation separated from new construction specification
Approved-product listing breadth assessed across twenty suppliers
Applied cost modelled against material price by system
Aerogel filler supply concentration examined as a risk
Personnel protection application sized against thermal efficiency claims
Built For The People Who Decide
From boardroom strategy to bench-side execution, this report is read cover-to-cover by leaders shaping the next decade of their industry, turning demand scenarios, market dynamics and valuation benchmarks into decisions.
CXOs/ Presidents/ VPs/ Managers
M&A and Corporate Development
Strategy Teams and R&D Heads
Procurement and Product Directors
Regulatory and Compliance Leaders
Investor Relations and Equity Analysts