Market Minds Advisory
Cornstarch Packaging Market

Cornstarch Packaging Market: Regulatory-Driven Foodservice and Film Adoption Dynamics

Single-use plastic bans and brand sustainability commitments are pushing packaging buyers toward cornstarch-based compostable materials, concentrating value among the handful of producers with certified compostability credentials and commercial-scale fermentation capacity.

Lead Analyst

Bilal Shaikh

Published

August 2026

Make Smarter Decisions with Customized Research Insights

Request a free sample report and evaluate market opportunities, growth trends, and competitive dynamics relevant to your business needs.

2025 MARKET VALUE$1.3BMarket Size 2025
2036 FORECAST VALUE$3.6BBase Case , 2026 to 2036
CAGR 2026 TO 20369.8 %Bull 11.0% / Bear 8.5%
INCREMENTAL OPPORTUNITY$2.2BNet 10- year value creation
EXPANSION MULTIPLE2.55x2036 value over 2026 base
Strategic Levers
M&A Pipeline
Regional Outlook
Country Rankings
Competitive Intelligence
Segmental Deep-dive
Call-Us : 91 93563 13602

Executive Snapshot and Market Trajectory

Cornstarch packaging is shifting from a niche protective packaging category into mainstream foodservice and retail applications as single-use plastic regulation and brand sustainability commitments push buyers toward certified compostable alternatives worldwide each year, particularly across major metropolitan markets. Buyers face a genuinely narrowing field of certified suppliers.
Food service packaging is the fastest-growing segment as restaurants and food delivery platforms replace polystyrene and conventional plastic containers with certified compostable cornstarch-based alternatives ahead of regulatory deadlines in several major markets. Western Europe anchors the deepest commercial concentration, reflecting the world's most advanced single-use plastic regulation, established industrial composting infrastructure, and producer headquarters presence that developing packaging markets still cannot fully replicate at comparable scale.
NatureWorks and Novamont set the technology benchmark through large-scale PLA production and deep compostability certification respectively, while a fragmented tail of smaller regional converters competes on price and local distribution relationships. Expanding foodservice adoption and tightening plastic regulation are both reshaping which producers capture packaging volume as compliance deadlines accelerate faster than smaller competitors can follow. Smaller manufacturers increasingly form distribution partnerships to remain competitive against this consolidation pressure across the industry.
Market Definition
The cornstarch packaging market covers packaging products manufactured from cornstarch-derived bioplastics, including polylactic acid and thermoplastic starch materials, used across foodservice, protective packaging, and retail applications. It spans loose-fill packaging, molded inserts, films, bags, and rigid foodservice containers manufactured primarily from corn-derived feedstock. Petroleum-based bioplastics and packaging derived from non-corn feedstocks such as sugarcane or cassava are excluded from this scope.
Base Year Value
$1.3B in 2025 (MMA Primary Research Dataset, August 2026)
Forecast Period
2026 to 2036, eleven discrete annual values
CAGR
9.8% base case. Bull 11.0%. Bear 8.5%.
Fastest Growth Segment
Food Service Packaging (Trays, Containers, Cutlery): 14.6% CAGR
Fastest Growth Country
India: 12.6% CAGR
Fastest Growth Region
South Asia and Pacific: 12.1% CAGR
Largest Region
Western Europe: 30% of 2025 global value
Market Leaders
NatureWorks, BASF, Novamont, Total Corbion PLA, Biotec. Source: MMA Analysis based on company annual reports.
Primary Survey
n=3,800 procurement and R&D decision-makers, Q4 2025, six countries
Methodology
Demand-side build-up, cross-validated against public data, 47 expert interviews

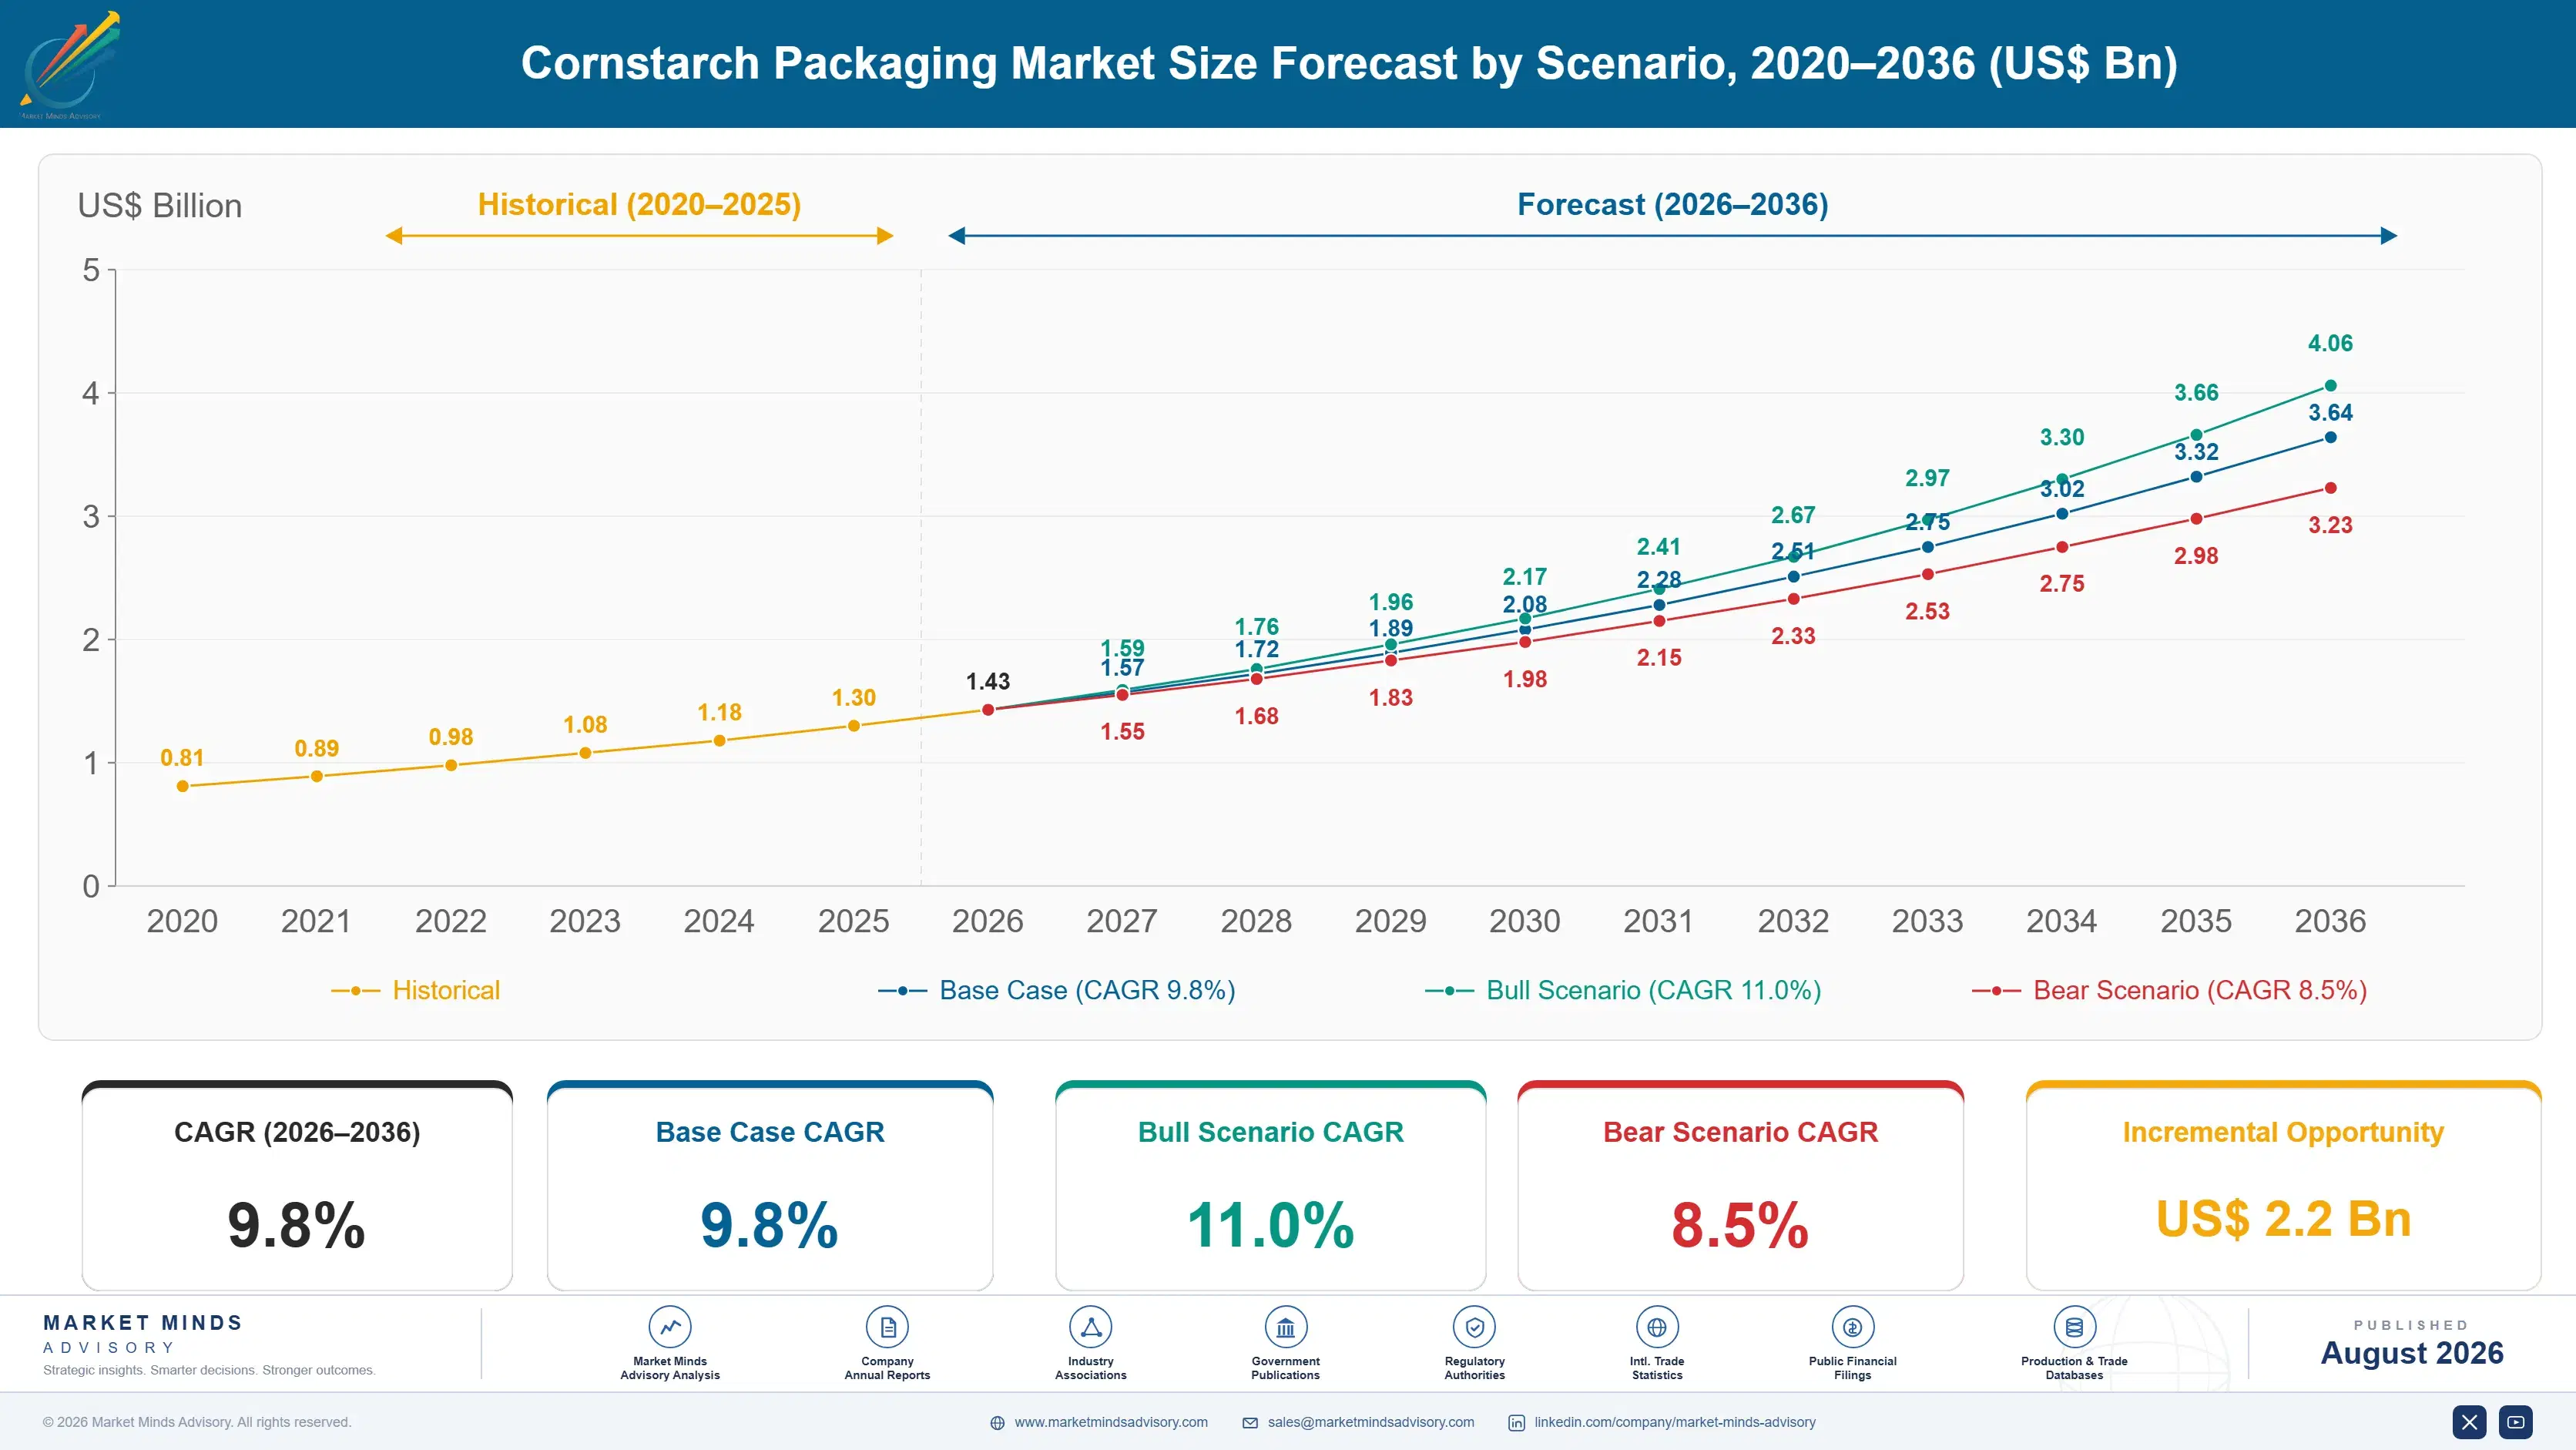
Cornstarch Packaging Market Forecast Scenarios

cornstarch-packaging-market-size-forecast-scenario-1787304352962
Cornstarch packaging demand grew steadily across 2020 to 2025 as single-use plastic regulation expanded across major markets, even as raw material cost volatility periodically slowed converter investment in new production capacity. The market grew at an estimated 8.8% historical CAGR across the period, reflecting accelerating regulatory-driven adoption offsetting periodic feedstock cost pressure. Regulatory momentum in Europe continued setting the pace that other regions gradually followed.
The base case assumes single-use plastic regulation continues tightening across major markets through 2030, foodservice adoption broadens as brand sustainability commitments mature into enforced procurement policy, and production capacity expands to narrow the current cost gap with conventional plastics. Together these three commercial mechanisms support a 9.8% forecast CAGR, with protective packaging remaining a meaningful volume category even as foodservice applications capture a growing share of total value each year across every major packaging market worldwide.
The bull case centers on faster-than-expected regulatory tightening that pushes foodservice adoption well ahead of current compliance timelines. The bear case centers on renewed corn feedstock price volatility, which would widen the cost gap with conventional plastics and slow adoption among cost-sensitive foodservice operators across price-competitive markets for several years across both developed and emerging markets nationwide and abroad.

Regulatory Compliance and Cost Gap Dynamics

Cornstarch packaging sits at the intersection of specialty materials science and regulatory compliance, since compostability certification requires rigorous testing infrastructure while foodservice adoption depends heavily on regional composting infrastructure availability that varies considerably by market. That split has kept the vendor base divided between large diversified bioplastics producers competing on production scale and specialized converters competing on application-specific design.
TOP 5 CONCENTRATION52%share held by leading five cornstarch packaging producers
AVERAGE PRICE PREMIUM35% over plastictypical average cost premium versus conventional plastic packaging
LEADING COUNTRY SHAREGermany, 13%share of global cornstarch packaging production volume overall
COMPOSTABILITY CERTIFICATION RATE68% of productionshare of production volume carrying formal compostability certification
FOODSERVICE ADOPTION RATE22% of eligible operatorsshare of eligible foodservice operators using cornstarch packaging
INDUSTRIAL COMPOSTING ACCESS41% of regional populationtypical share of population with access to industrial composting
Commercially, the market splits between a mature protective packaging base sold through established industrial distribution channels, and a smaller but faster-growing foodservice tier sold on regulatory compliance and brand sustainability positioning rather than price alone. Films and bags round out demand with application-specific purchasing tied to retail and agricultural packaging needs. Distribution increasingly bundles multiple certification tiers within a single supplier relationship.
Over the next decade, compostability certification and cost competitiveness will matter more than raw production volume alone, since buyers increasingly select producers based on regulatory compliance credentials rather than which supplier offers the lowest per-unit price. Producers that can expand production capacity into mid-tier foodservice distribution networks fastest stand to capture a widening share of a market that regulatory pressure is reshaping as much as sustainability positioning is.
"Buyers aren't asking whether cornstarch packaging costs more anymore. They're asking whether it's certified for the composting facilities in their specific municipality."
Director, Sustainable Packaging Materials Practice · MMA Packaging / Biodegradab

Market Trends

Foodservice Operators Accelerate Compostable Packaging Transition

Restaurant chains and food delivery platforms are replacing polystyrene and conventional plastic foodservice packaging with certified compostable cornstarch-based alternatives ahead of regulatory compliance deadlines taking effect across several major markets. NatureWorks and Novamont have both expanded foodservice-grade production capacity since 2023 to meet growing operator demand, targeting chains that want reliable compostable supply at commercial-scale pricing rather than niche premium positioning. Smaller foodservice operators are following more slowly, constrained by the cost premium involved, but adoption is broadening steadily each year across major metropolitan foodservice markets worldwide and increasingly beyond early-adopter regions.
Market Impact: Covers 2 billion consumers under ba
Brand Sustainability Commitments Formalize Into Procurement Policy

Major consumer brands are converting voluntary sustainability commitments into formal procurement policy requiring certified compostable packaging across their supply chains, moving beyond aspirational marketing language into binding supplier requirements with defined compliance timelines. This formalization is giving cornstarch packaging producers clearer demand visibility for capacity planning purposes, since binding procurement policy carries more commercial certainty than voluntary sustainability aspirations previously offered. Producers with strong brand relationships are capturing disproportionate volume as this policy formalization continues. Producers increasingly build dedicated brand relationship teams to manage this growing procurement complexity effectively and capture more binding volume commitments over time.
Market Impact: Adds 12% protective packaging deman

Market Opportunities and Growth Drivers

Single-Use Plastic Regulation Expands Across Major Markets

Single-use plastic bans and restrictions continue expanding across major markets, with the European Union's Single-Use Plastics Directive setting the global regulatory benchmark that other jurisdictions increasingly reference when designing their own restrictions on conventional plastic foodservice packaging. This regulatory expansion has accelerated meaningfully since 2023 as additional national and municipal jurisdictions adopt similar restrictions following the European precedent. Similar regulatory tightening is expected to continue across additional markets as governments respond to public pressure regarding plastic waste and pollution concerns. Producers positioning around this durable regulatory trend gain a stable long-term planning foundation for capacity investment decisions.
Market Impact: Limits adoption to under 25% volunt

E-Commerce Growth Expands Protective Packaging Demand

Continued e-commerce growth expands overall protective packaging demand each year, with online retailers increasingly favoring compostable cushioning and void-fill materials as part of broader sustainability positioning that appeals to environmentally conscious consumers. This demand growth sustains long-term protective packaging volume regardless of near-term foodservice regulatory timelines in any single market, providing a durable baseline growth floor beneath the faster-growing foodservice adoption layered on top of it. Major e-commerce platforms increasingly specify compostable packaging requirements to third-party sellers. Producers with strong e-commerce relationships increasingly capture this steadily expanding protective packaging volume first.
Market Impact: Excludes 59% of regional population

Market Restraints and Challenges

Cost Premium Versus Conventional Plastic Limits Adoption

Cornstarch packaging typically carries a meaningful cost premium over conventional plastic alternatives, creating adoption resistance among cost-sensitive foodservice operators and packaging buyers who cannot fully pass through the higher cost to price-sensitive end consumers. This constraint is most severe in markets where regulatory mandates have not yet forced adoption, leaving cost as the primary decision factor for buyers evaluating packaging options absent compliance pressure. Producers are responding by scaling production capacity and improving feedstock efficiency to narrow this cost gap, though achieving full cost parity with conventional plastics will likely take considerable additional time.
Market Impact: Adds 35% cost premium per container

Composting Infrastructure Gaps Undermine End-of-Life Claims

Industrial composting infrastructure required to properly process compostable cornstarch packaging remains unevenly available across markets, meaning packaging marketed as compostable often ends up in conventional landfill or incineration streams where its environmental advantage over conventional plastic is substantially diminished or eliminated entirely. This infrastructure gap is most pronounced in markets where municipal waste management systems were not originally designed to separate and process compostable materials at meaningful scale. Producers and municipalities are investing in expanded composting infrastructure to close this gap, though meaningful improvement will take considerable time across most affected regions.
Market Impact: Locks in 18% of packaging volume
3 additional market trends, 2 additional growth drivers, and 3 additional restraints and challenges are covered in the full report. Contact sales@marketmindsadvisory.com to access the complete intelligence.

Segment CAGR and Growth Architecture

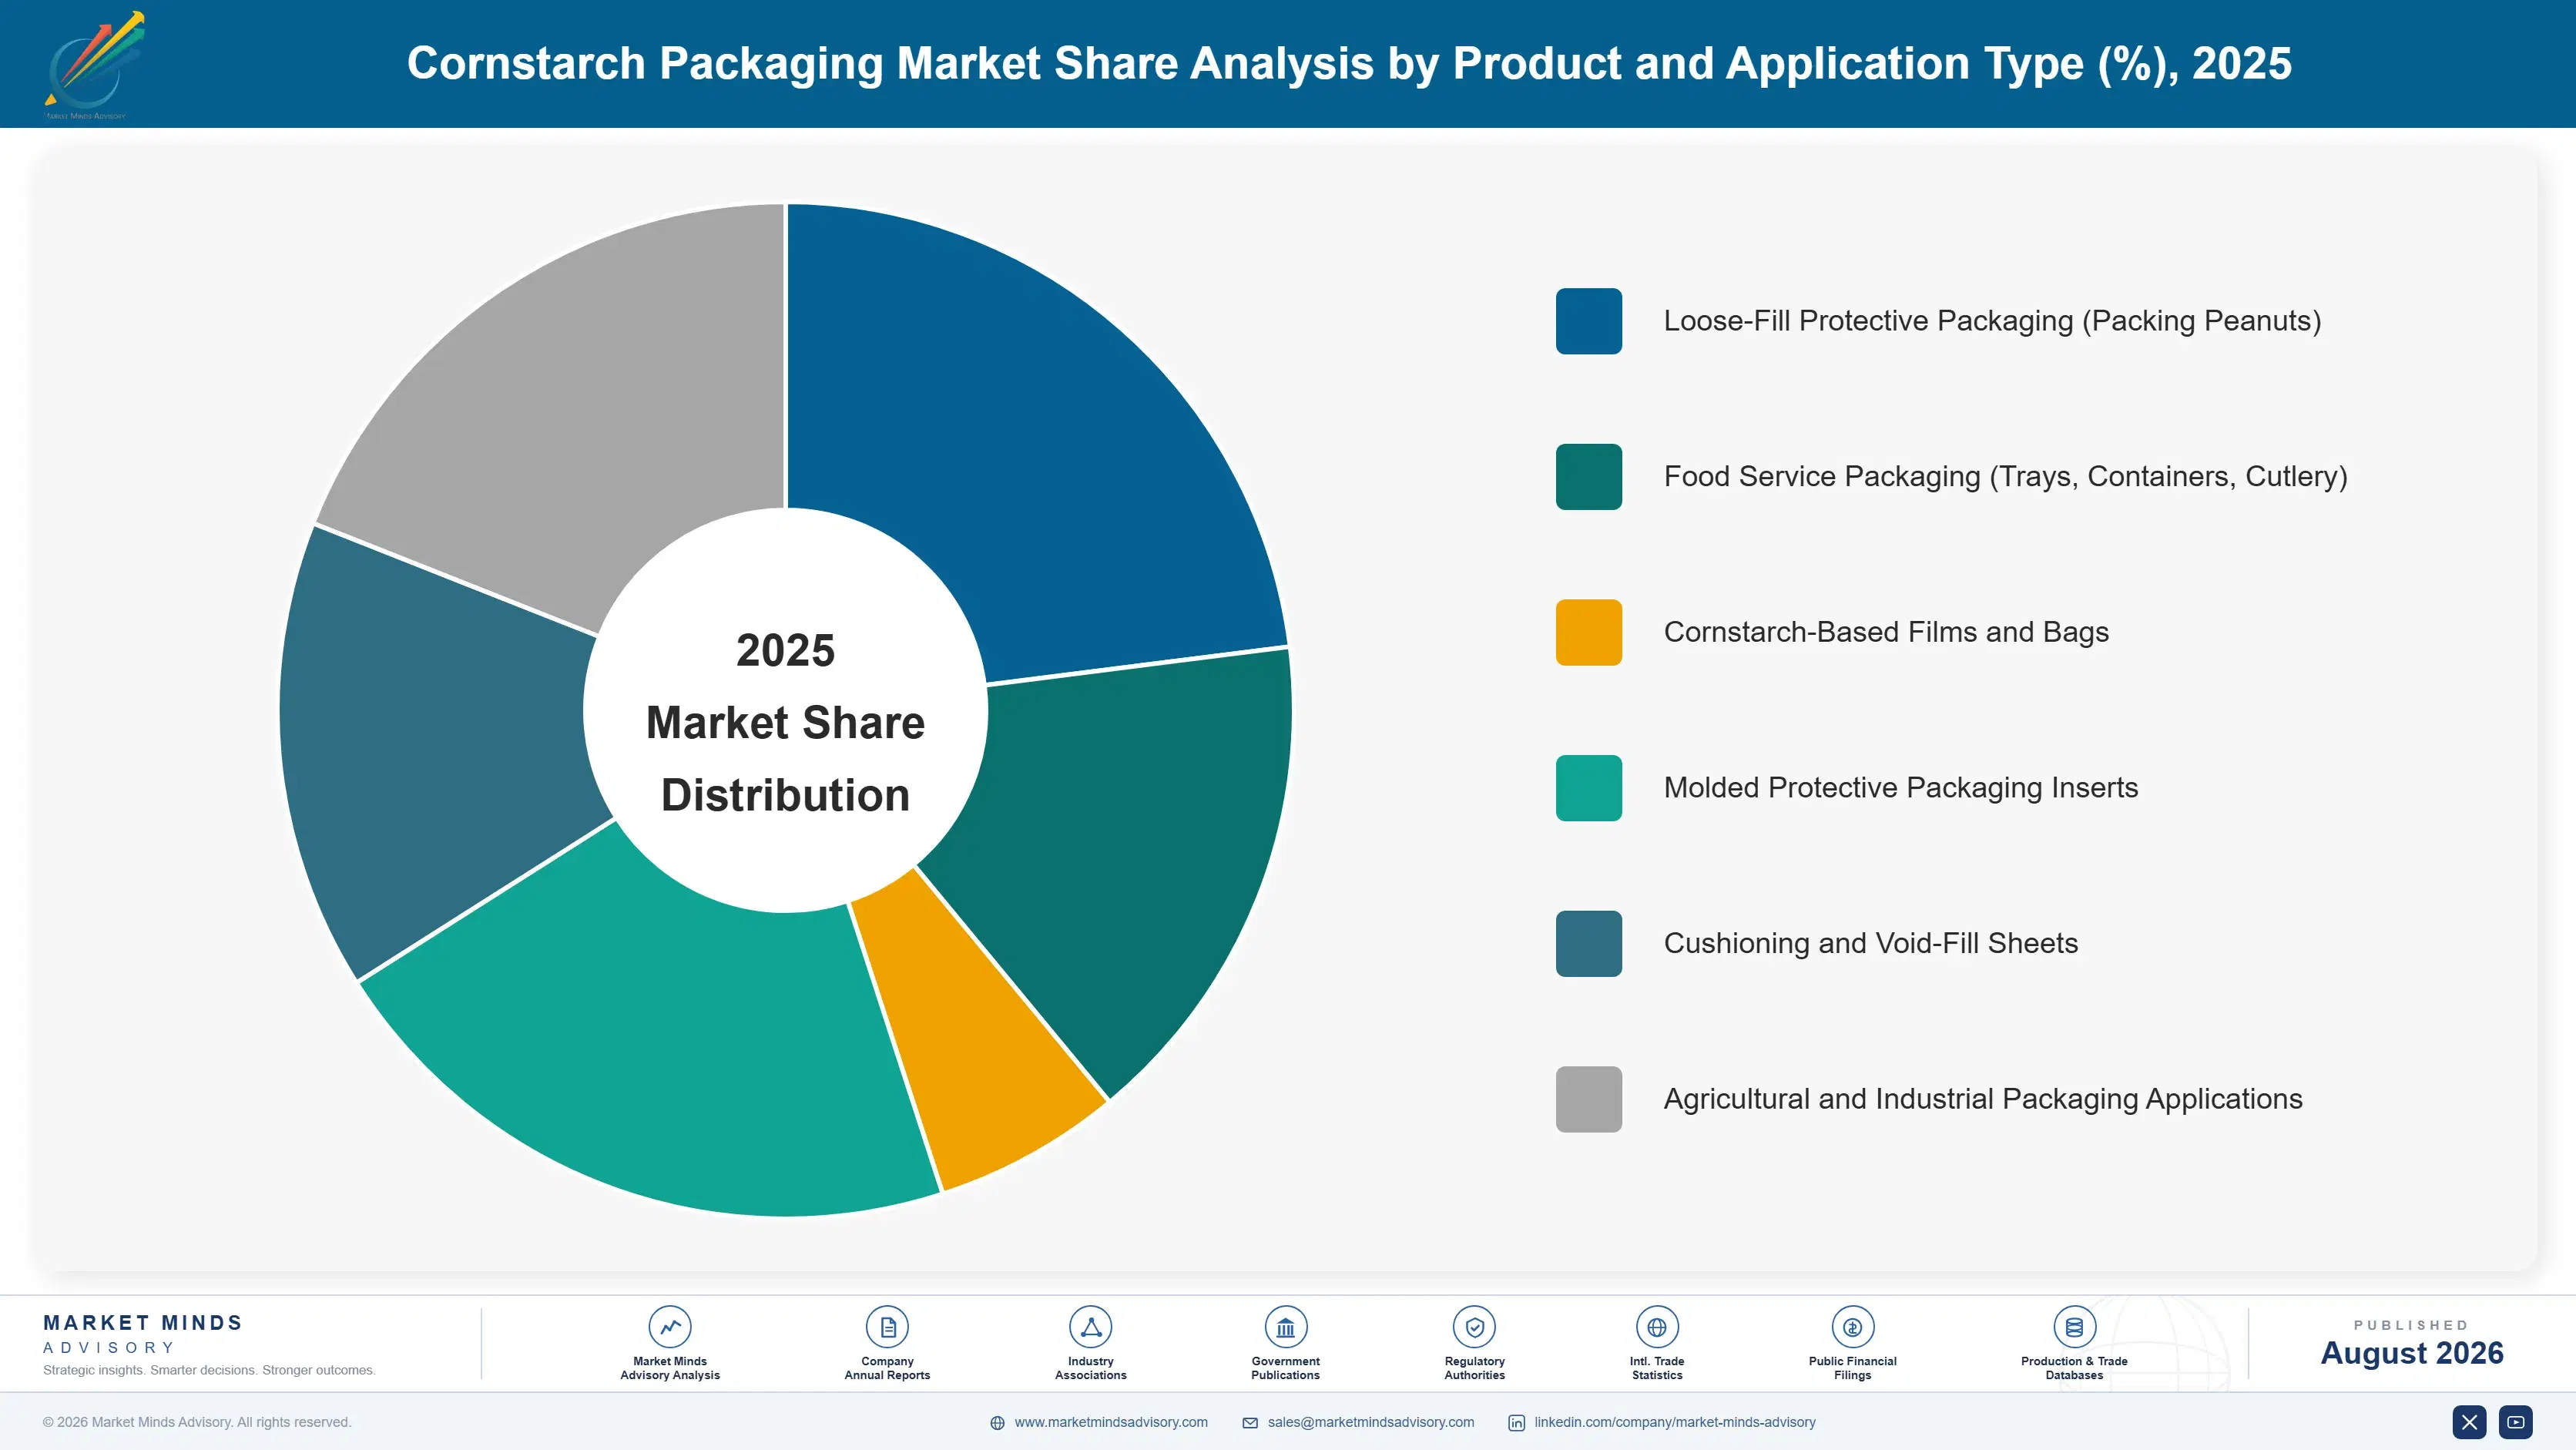
Cornstarch packaging segments by application and product type, the classification converters and brand owners use to set material specification, certification requirements, and pricing tier, since foodservice, protective, and film buyers each negotiate under distinct commercial terms. Vendors price each category differently depending on application complexity and certification requirements involved. Buyers weigh both factors closely when selecting a supplier.
cornstarch-packaging-market-market-share-analysis-1787304353501

Food Service Packaging (Trays, Containers, Cutlery)

Food service packaging forms the fastest-growing segment as restaurants and food delivery platforms replace conventional plastic containers with certified compostable cornstarch-based alternatives ahead of regulatory compliance deadlines across major markets. NatureWorks and Novamont have both expanded foodservice-grade production capacity since 2023, targeting operators that want reliable compostable supply at commercial-scale pricing rather than niche premium positioning exclusively. Producers that secure early foodservice chain relationships are capturing volume from smaller converters that lack production scale to meet large operator requirements, an advantage that compounds as more chains standardize around compostable packaging. If foodservice adoption continues at the current pace, this segment could approach a meaningful share of total category value within the next decade.
CAGR 14.6%

Cornstarch-Based Films and Bags

Cornstarch-based films and bags form the second-fastest segment as retailers and agricultural applications increasingly adopt compostable film alternatives to conventional plastic bags ahead of regulatory restrictions taking effect across several markets. BASF and Biotec have both expanded film production capacity since 2023, targeting retailers that want certified compostable options for produce bags and retail packaging applications. Producers that build strong retail relationships early are capturing volume from smaller converters lacking comparable film production scale, an advantage that compounds as more retailers standardize around compostable film requirements. This segment increasingly serves agricultural mulch film applications alongside traditional retail uses. Retailers increasingly view compostable film as a durable long-term differentiator worth monitoring closely across their broader packaging portfolio.
CAGR 12.4%
Full segment breakdown across 6 segments available in the complete report.

Regional Architecture and Country Demand Map

Cornstarch packaging commercial activity concentrates where plastic regulation and composting infrastructure are most advanced, even though raw packaging consumption volume runs highest in regions still building the regulatory and infrastructure foundation needed to capture that value commercially each year. particularly across major regulated foodservice markets worldwide.

North America

The United States accounts for the overwhelming majority of North America's cornstarch packaging commercial value, reflecting dense foodservice industry concentration, growing state and municipal plastic restrictions, and comprehensive brand sustainability commitment adoption among major consumer packaged goods companies. Canada contributes a smaller but meaningful share through its established composting infrastructure and provincial plastic restriction policies. Foodservice adoption runs meaningfully ahead of the global average across most large metropolitan markets in the region. Composting infrastructure investment continues expanding steadily each year across major urban centers, supporting broader end-of-life processing capability. particularly across major United States metropolitan foodservice markets nationwide, reinforcing steady demand growth each successive year. Consumer awareness of compostable alternatives continues rising across major demographic segments.
Share: 24% | CAGR: 10.6% (2026 to 2036)

Western Europe

Germany, France, and Italy together anchor Western Europe's cornstarch packaging demand, reflecting the world's most advanced single-use plastic regulation under the European Union's Single-Use Plastics Directive and comparatively strong industrial composting infrastructure built over more than a decade, which is why this region commands the largest global commercial share for this specific packaging category. Novamont's Italian headquarters and deep regional distributor relationships anchor particularly strong adoption across southern European markets. Smaller Western European markets rely more heavily on regional converters rather than domestic large-scale production, concentrating manufacturing volume at fewer high-throughput facilities. Regional composting infrastructure continues expanding to support growing compostable packaging volume. Regional composting facility density continues to support broader compostable packaging end-of-life processing capability effectively.
Share: 30% | CAGR: 8.5% (2026 to 2036)
Regional intelligence for 5 additional markets available in the complete report: East Asia, South Asia and Pacific, Latin America, Middle East and Africa, Eastern Europe. Contact sales@marketmindsadvisory.com.
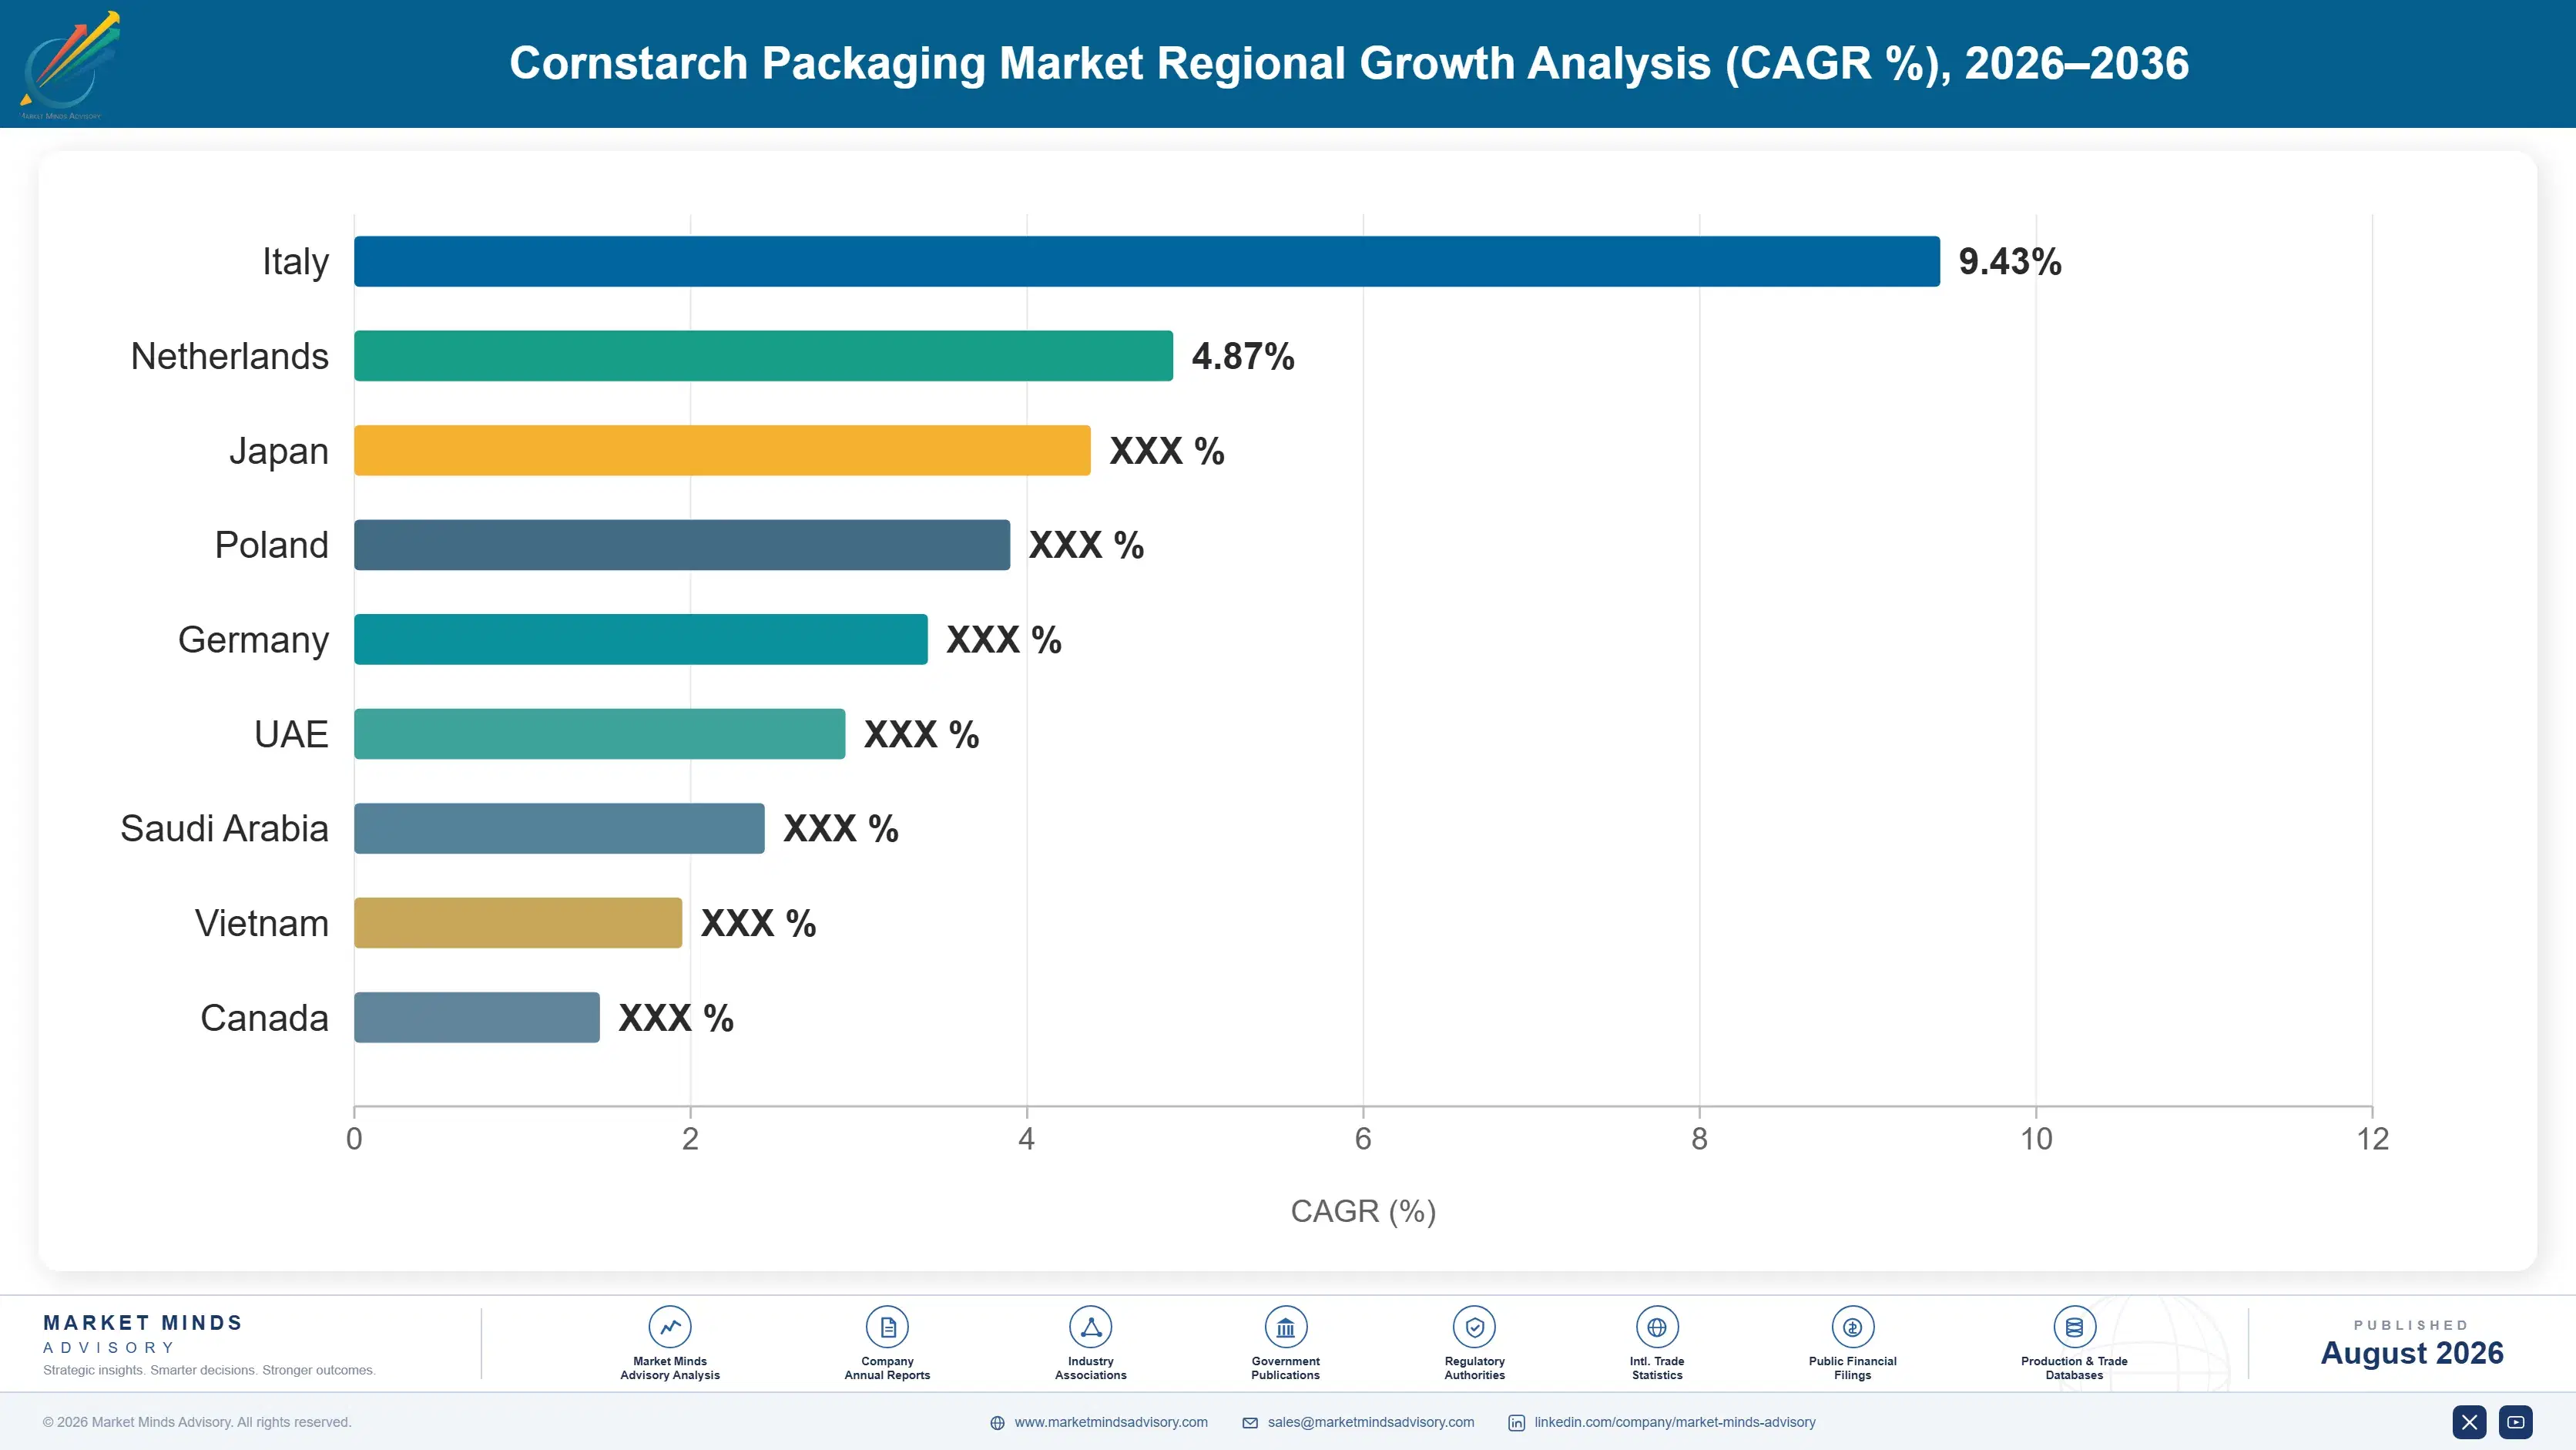
cornstarch-packaging-market-country-cagr-analysis-1787304354025

Where Compliance Value Concentrates Next

Revenue growth in cornstarch packaging increasingly depends on capturing regulatory compliance-driven demand, brand procurement policy adoption, and production scale efficiency rather than raw protective packaging volume alone, since regulatory pressure, not raw packaging consumption, is reshaping where category value concentrates. The levers below outline where that value is concentrating fastest across the packaging pathway today.

Expanding Foodservice-Grade Production Capacity Very Fast

Producers expanding foodservice-grade production capacity are capturing operator relationships that capacity-constrained competitors cannot fulfill, particularly as more foodservice chains face approaching regulatory compliance deadlines requiring compostable alternatives. Building competitive foodservice-grade capacity typically costs $30 million to $70 million in facility, fermentation equipment, and certification investment. Producers without adequate capacity increasingly lose operator relationships to better-capitalized competitors offering reliable compliance-ready supply. Producers without such investment risk losing operator relationships to better-capitalized competitors permanently over time. That advantage compounds as more chains standardize around compliant compostable packaging nationwide and internationally. Regulatory deadlines keep pulling this compliance-driven volume forward each successive year.
Market Impact: Costs $30 to $70 million to fully b

Building Deeper In-House Certification Testing Capability

Producers building in-house compostability certification testing capability are capturing customer trust that third-party dependent competitors cannot match on turnaround speed for new product certification. Developing competitive certification testing capability typically costs $4 million to $10 million in laboratory equipment, accredited staff, and regulatory relationship investment. Producers with faster certification turnaround increasingly win brand relationships from competitors facing longer third-party testing queues. Producers without such capability risk losing time-sensitive brand relationships to better-positioned competitors indefinitely. That advantage compounds as more brands seek faster certification turnaround for new product launches broadly. Faster certification turnaround increasingly determines which producers win time-sensitive brand launches.
Market Impact: Costs $4 to $10 million to fully bu

Securing Brand Procurement Policy Compliance Partnerships

Producers securing formal procurement policy compliance partnerships with major consumer brands are capturing volume commitments that transactional spot-market relationships cannot match on reliability and long-term planning visibility. These partnerships typically carry a 12 to 22% margin premium over spot-market sales given the volume commitment and compliance documentation support brands value. Producers able to demonstrate reliable compliance documentation increasingly win these partnerships over less-prepared competitors. Producers without such partnerships compete purely on spot-market volume when brand procurement channels remain closed. That advantage compounds further as more brands consolidate spend with fewer, deeper compliance partners.
Market Impact: Commands a 12 to 22% margin premium

Investing In Feedstock Efficiency Cost Reduction

Producers investing in feedstock efficiency and process optimization are positioned to narrow the cost gap with conventional plastics that currently limits voluntary adoption among cost-sensitive buyers evaluating packaging options absent regulatory mandates. Developing competitive feedstock efficiency typically costs $15 million to $35 million in process engineering, fermentation optimization, and pilot facility investment. Producers with lower production costs increasingly win price-sensitive volume from competitors unable to match improved cost structures. Producers without such investment risk losing voluntary adoption volume once regulatory mandates alone no longer drive sufficient demand. That advantage compounds as mandates alone no longer sustain sufficient demand growth.
Market Impact: Costs $15 to $35 million to fully b

Who Controls the Margin Pool

The top five vendors hold an estimated 52% of global cornstarch packaging revenue, a meaningful concentration reflecting the high capital barriers protecting established large-scale PLA producers and the technical certification complexity smaller entrants must navigate. NatureWorks and Novamont lead on production scale and compostability certification depth respectively, while a fragmented tail of smaller regional converters competes on price and local distribution relationships.
Current competitive activity centers on three fronts. Foodservice-grade capacity expansion is opening a new front for producers willing to invest ahead of confirmed regulatory compliance deadlines. Certification testing capability is becoming increasingly important as producers compete on speed to market for new compliant products. And several mid-sized converters are pursuing brand procurement partnerships to differentiate beyond commoditized spot-market packaging sales.

Emerging pressure comes from mid-sized regional producers moving into foodservice-grade cornstarch packaging as they partner with local composting infrastructure operators, though matching NatureWorks or Novamont's production scale and certification depth remains years away for most. If these challengers close that scale gap, expect share to shift within specific regional foodservice markets first, before any material pressure reaches the largest incumbents given how embedded existing brand relationships are.
cornstarch-packaging-market-company-positioning-matrix-1787304354552

Competitive Moat and Risk Dimensions

NATUREWORKS LLC

Moat: Largest Global PLA Production Scale

NatureWorks operates the industry's largest polylactic acid production capacity, built through decades of continuous investment in fermentation and polymerization infrastructure at commercial scale. That production scale gives NatureWorks a durable cost advantage that smaller competitors with thinner production volume cannot quickly replicate, even as new entrants continue entering the category.
NATUREWORKS LLC

Risk: Corn Feedstock Price Volatility Exposure

NatureWorks' large-scale corn feedstock dependence creates meaningful exposure to agricultural commodity price volatility, since corn prices fluctuate with weather, planting decisions, and competing demand from food and biofuel markets beyond NatureWorks' direct control. If corn prices spike meaningfully, NatureWorks faces margin pressure that smaller, more diversified feedstock competitors may navigate more easily.
NOVAMONT S.P.A.

Moat: Deep Mater-Bi Compostability Certification

Novamont's Mater-Bi product line carries one of the industry's deepest compostability certification track records, built through decades of continuous testing and regulatory relationship development across European certification bodies. That certification depth gives Novamont a durable credibility advantage that newer entrants without comparable regulatory history cannot quickly replicate.
NOVAMONT S.P.A.

Risk: High-Cost Structure Versus Conventional Plastics

Novamont's premium-positioned Mater-Bi products carry meaningfully higher production costs than conventional plastic alternatives, limiting adoption among cost-sensitive buyers absent regulatory mandates forcing compostable material selection. If regulatory tailwinds weaken in any major market, Novamont risks losing volume to lower-cost conventional plastic alternatives. Manufacturers with lower-cost production increasingly capture share from Novamont in price-sensitive market segments.

Players Tracked

Prominent Players

NatureWorks LLC
BASF SE
Novamont S.p.A.
Total Corbion PLA
Biotec GmbH & Co. KG

Other Key Players

Plantic Technologies Ltd.
Cardia Bioplastics Ltd.
Futerro SA
Green Dot Bioplastics Inc.
FKuR Kunststoff GmbH
Tianan Biologic Materials Co., Ltd.
Anhui BBCA Biochemical Co., Ltd.
Eco-Products Inc.
World Centric
Vegware Ltd.
BioPak Pty Ltd.
Genpak LLC
Plastic Suppliers Inc.
Zhejiang Hisun Biomaterials Co., Ltd.
Kuraray Co., Ltd.

Recent Developments

APRIL 2025

NatureWorks Expands Foodservice-Grade Production Capacity

NatureWorks commissioned additional foodservice-grade PLA production capacity to meet rising demand from restaurant chains transitioning ahead of regulatory compliance deadlines, following distributor commitments signed as more chains sought reliable compostable supply. The expansion followed sustained customer pressure for dedicated foodservice-grade infrastructure. Several other manufacturers are expected to follow.
Signal: Confirms foodservice-grade capacity remain
OCTOBER 2024

Novamont Signs Multi-Year Brand Procurement Agreement

Novamont secured a multi-year procurement agreement with a major consumer packaged goods company, guaranteeing supply volume and compliance documentation support through 2029 across several affiliated packaging categories. The agreement reflects brands' push to lock in reliable compostable supply ahead of expanding regulatory mandates. Similar agreements are expected across other competitors.
Signal: Shows brands prioritizing long-term procur
JANUARY 2025

Anhui BBCA Biochemical Announces China Capacity Expansion

Anhui BBCA Biochemical announced expanded domestic PLA production capacity to serve growing demand from Chinese foodservice and retail companies transitioning toward compostable packaging under government plastic reduction initiatives. Similar expansions are expected across other qualified Chinese competitors soon. Additional capacity announcements are expected across other regional manufacturers soon.
Signal: Signals China's domestic production capaci

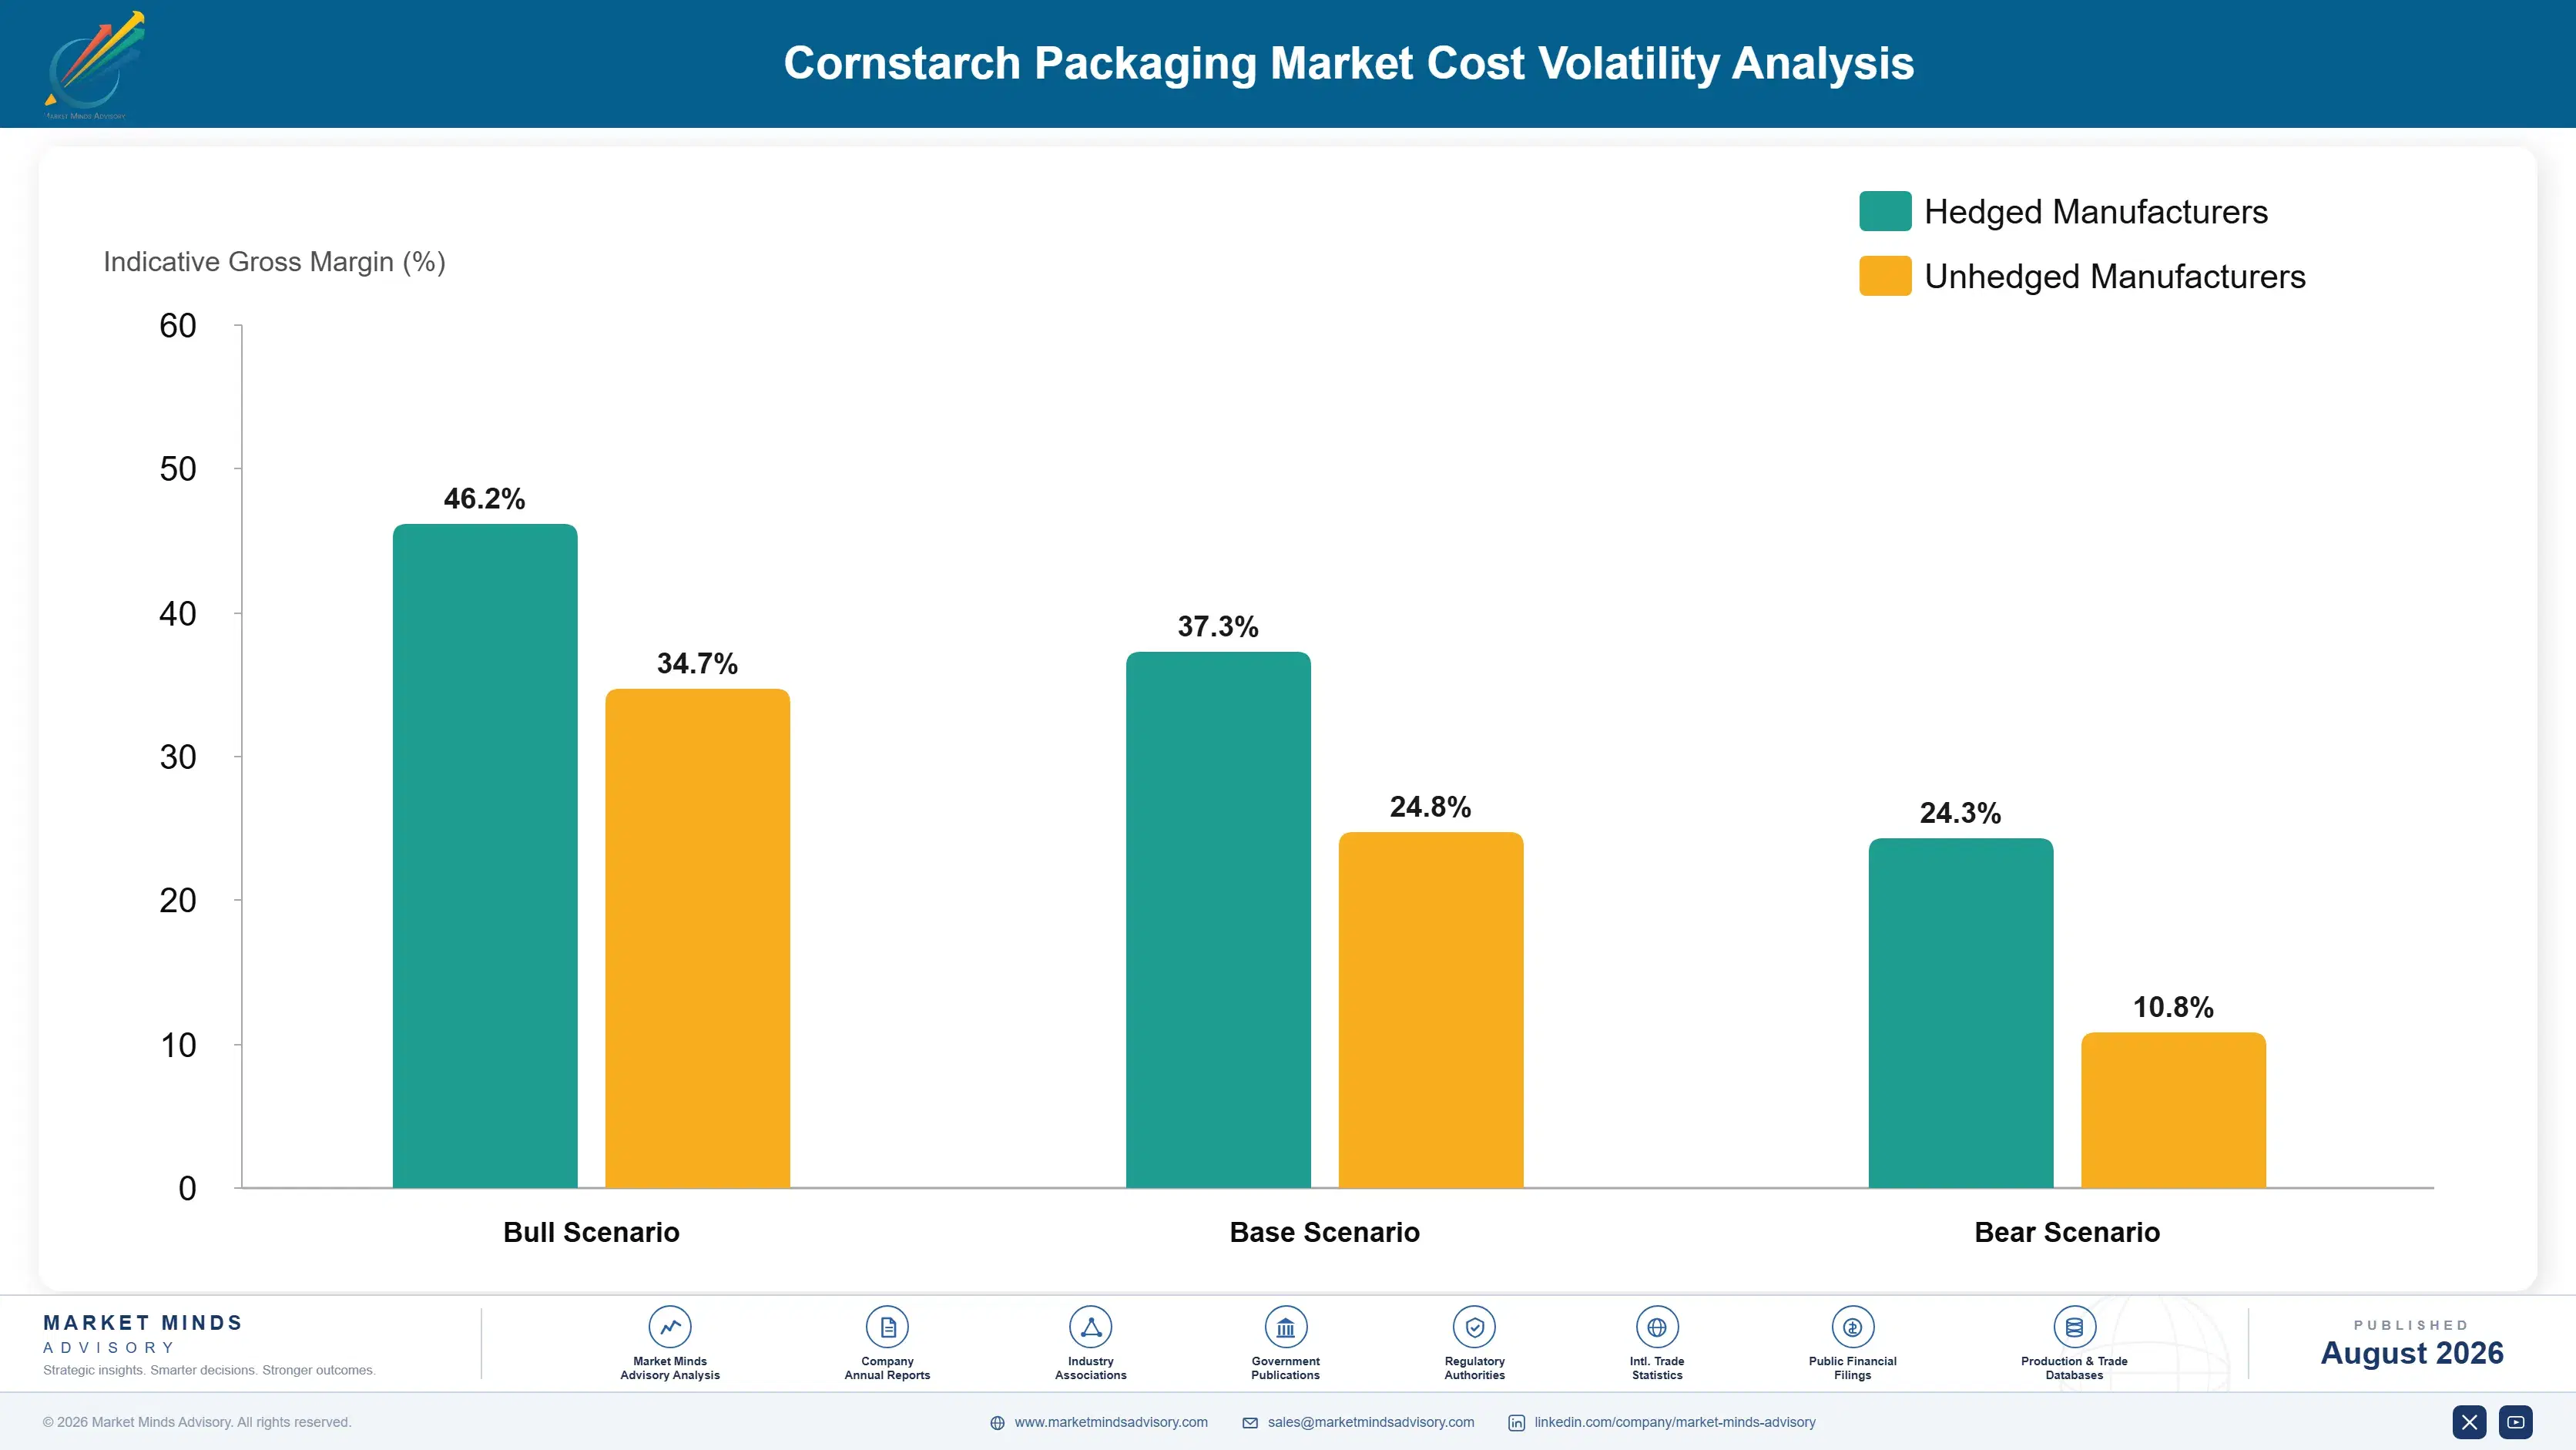
Corn Feedstock and Fermentation Cost Pressure

Corn feedstock and fermentation process inputs together account for roughly 42% of effective cost of goods for cornstarch packaging manufacturers, given the agricultural commodity exposure and specialized fermentation infrastructure required for polylactic acid production. Certification and compliance documentation costs add a further meaningful share, particularly for producers serving multiple regulatory jurisdictions. Distribution and packaging logistics costs round out the remaining share of
Corn feedstock prices rose meaningfully following 2022 global agricultural supply disruption, with several manufacturers reporting input cost increases exceeding 24% in their annual reports before pricing stabilized through 2023 and into 2024. Industry supply chain reviews have flagged corn feedstock pricing as this market's single most concentrated input, more than fermentation equipment or certification costs combined. Several manufacturers have flagged feedstock price volatility as an ongoing operational risk.

Smaller regional converters without long-term feedstock supply agreements absorbed the 2022 cost increases hardest, losing brand contract bids to larger competitors including NatureWorks and BASF that had negotiated priority supplier allocation years in advance. Manufacturers with secured feedstock supply weathered the cost increases far better than those dependent on spot market purchasing, a cost advantage that persists most sharply across smaller regional converters today.
cornstarch-packaging-market-cost-volatility-analysis-1787304354751

Long-Term Feedstock Supplier Agreements Secure Pricing

Manufacturers increasingly negotiate multi-year corn feedstock supply agreements with priority allocation clauses, reducing exposure to spot market price volatility during periods of agricultural commodity disruption. This approach has helped several manufacturers maintain more stable packaging pricing even during periods of broader input cost inflation across the industry. This approach is becoming increasingly standard practice across the broader industry today.

Shared Fermentation Infrastructure Lowers Fixed Cost

Smaller regional converters increasingly share fermentation and polymerization infrastructure through partnership arrangements, spreading fixed equipment cost across broader production volume than any single smaller operation could support alone economically. This shared infrastructure model has helped smaller players remain price-competitive against larger integrated manufacturers. This model has become increasingly common as smaller converters scale operations without heavy capital investment.

Vertical Integration Into Corn Sourcing Reduces Exposure

Several larger manufacturers are investing in direct corn sourcing relationships with regional agricultural producers to reduce dependence on commodity markets, gaining pricing control and supply security that non-integrated competitors cannot match during periods of tightening supply. This integration also reduces exposure to spot market volatility across the supply chain. This has helped several companies weather recent cost volatility better.

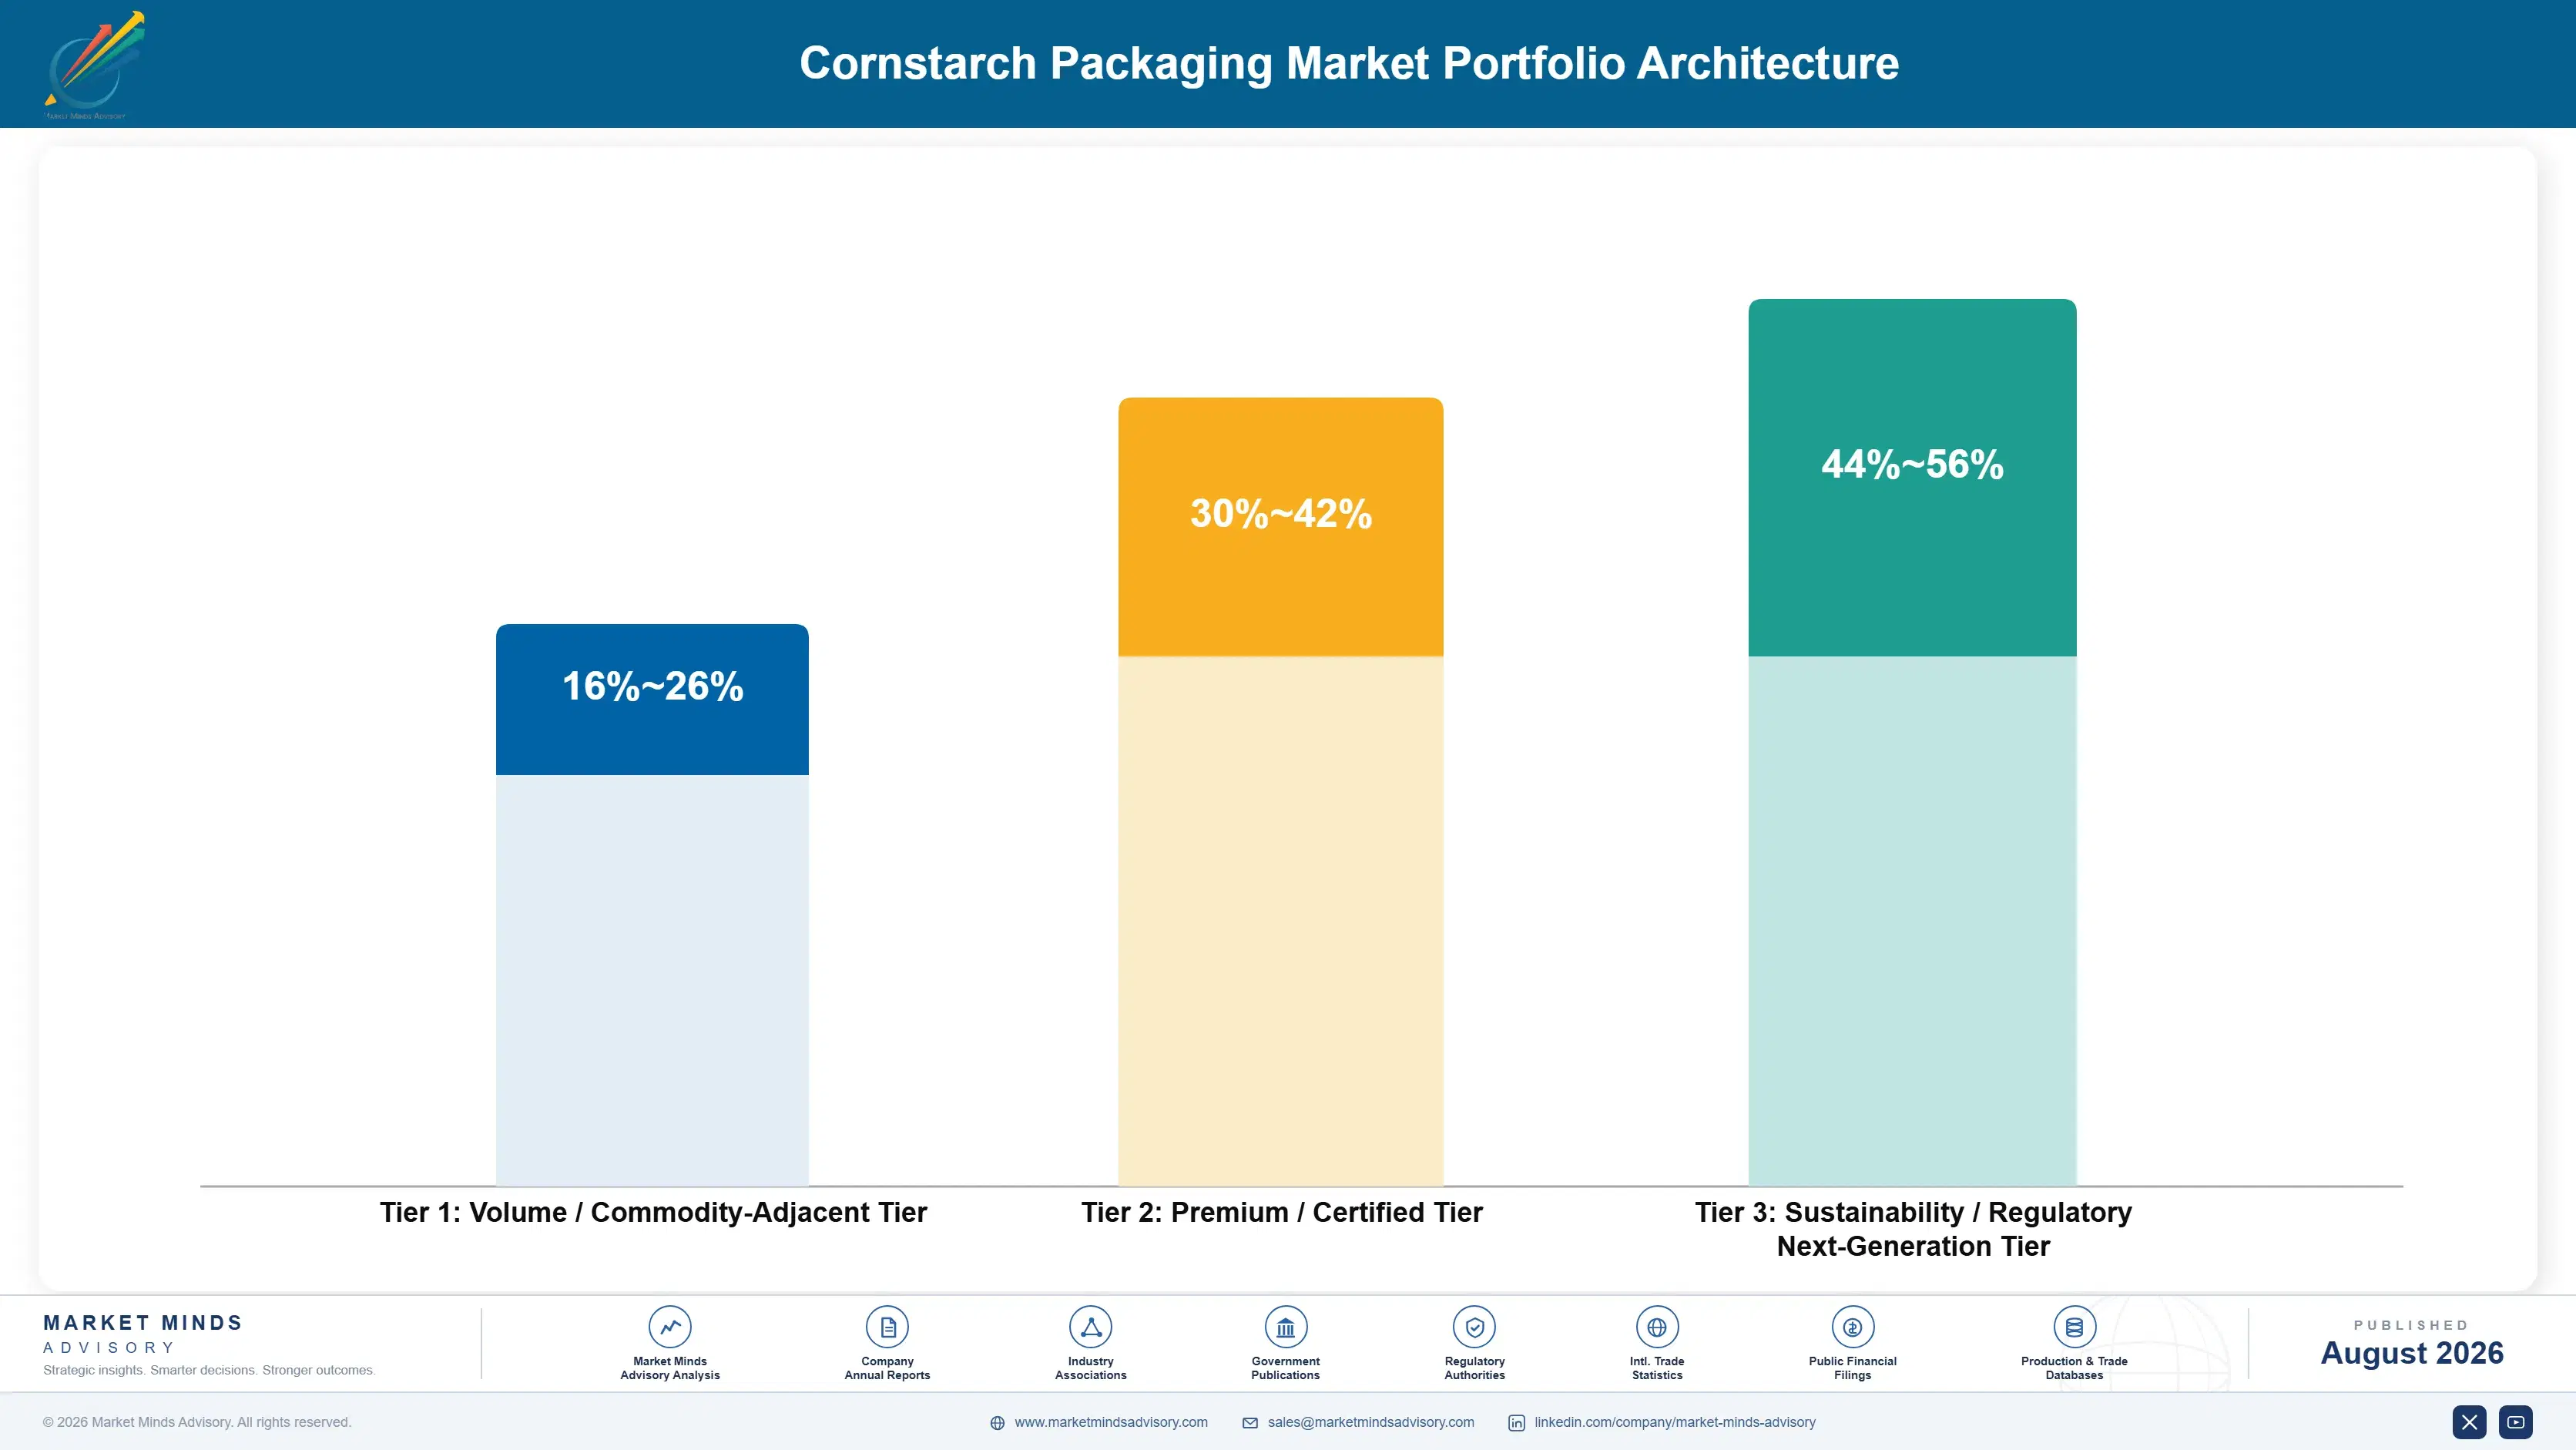
Portfolio Architecture for Margin Defence

Cornstarch packaging portfolios span three margin tiers, from commodity-adjacent protective packaging sold largely on price, through certified foodservice packaging carrying compliance-driven premiums, toward an emerging next-generation tier built around brand procurement partnerships still gaining share. Gross margin widens meaningfully at each tier as certification depth and regulatory compliance credentials increase across the industry today, reflecting growing willingness to pay for complian
The volume versus premium tension centers on production and certification investment allocation. Manufacturers must choose between dedicating capital to high-margin foodservice and brand partnership programs with growing but still-smaller volume, or serving reliable protective packaging demand that fills out most production volume across a typical year. Manufacturers without spare capital increasingly favor higher-margin next-generation programs where competition remains comparatively thin still. Smaller manufacturers face this tension most acutely.

High-value margin pools concentrate in foodservice packaging and brand procurement partnerships, where certification investment and compliance documentation keep competition thin and buyers pay a premium for regulatory compliance certainty. Protective packaging remains a meaningful volume category but carries thinner margins across the portfolio, leaving smaller manufacturers with fewer diversification options than larger integrated competitors today.

Volume / Commodity-Adjacent Tier

Protective packaging and loose-fill materials sold largely on price and distributor availability without certification-driven premiums, across most standard industrial buyer segments worldwide each year. Pricing pressure from distributors and conventional plastic competition keeps margins comparatively thin across this tier.
Gross Margin: 16-26%

Premium / Certified Tier

Certified foodservice packaging sold under brand and operator contracts carrying compliance-driven pricing power built through years of proven certification performance across major markets worldwide. Buyers increasingly compare certification performance data before committing to a long-term relationship.
Gross Margin: 30-42%

Sustainability / Regulatory / Next-Generation Tier

Brand procurement compliance partnerships in active adoption, commanding premium pricing against limited proven alternatives as certification depth and regulatory relationships expand across major markets. Manufacturers with the deepest certification and brand relationship network capture most of this premium value.
Gross Margin: 44-56%
cornstarch-packaging-market-portfolio-architecture-1787304355250

Contract-Driven Recurring Supply Relationship

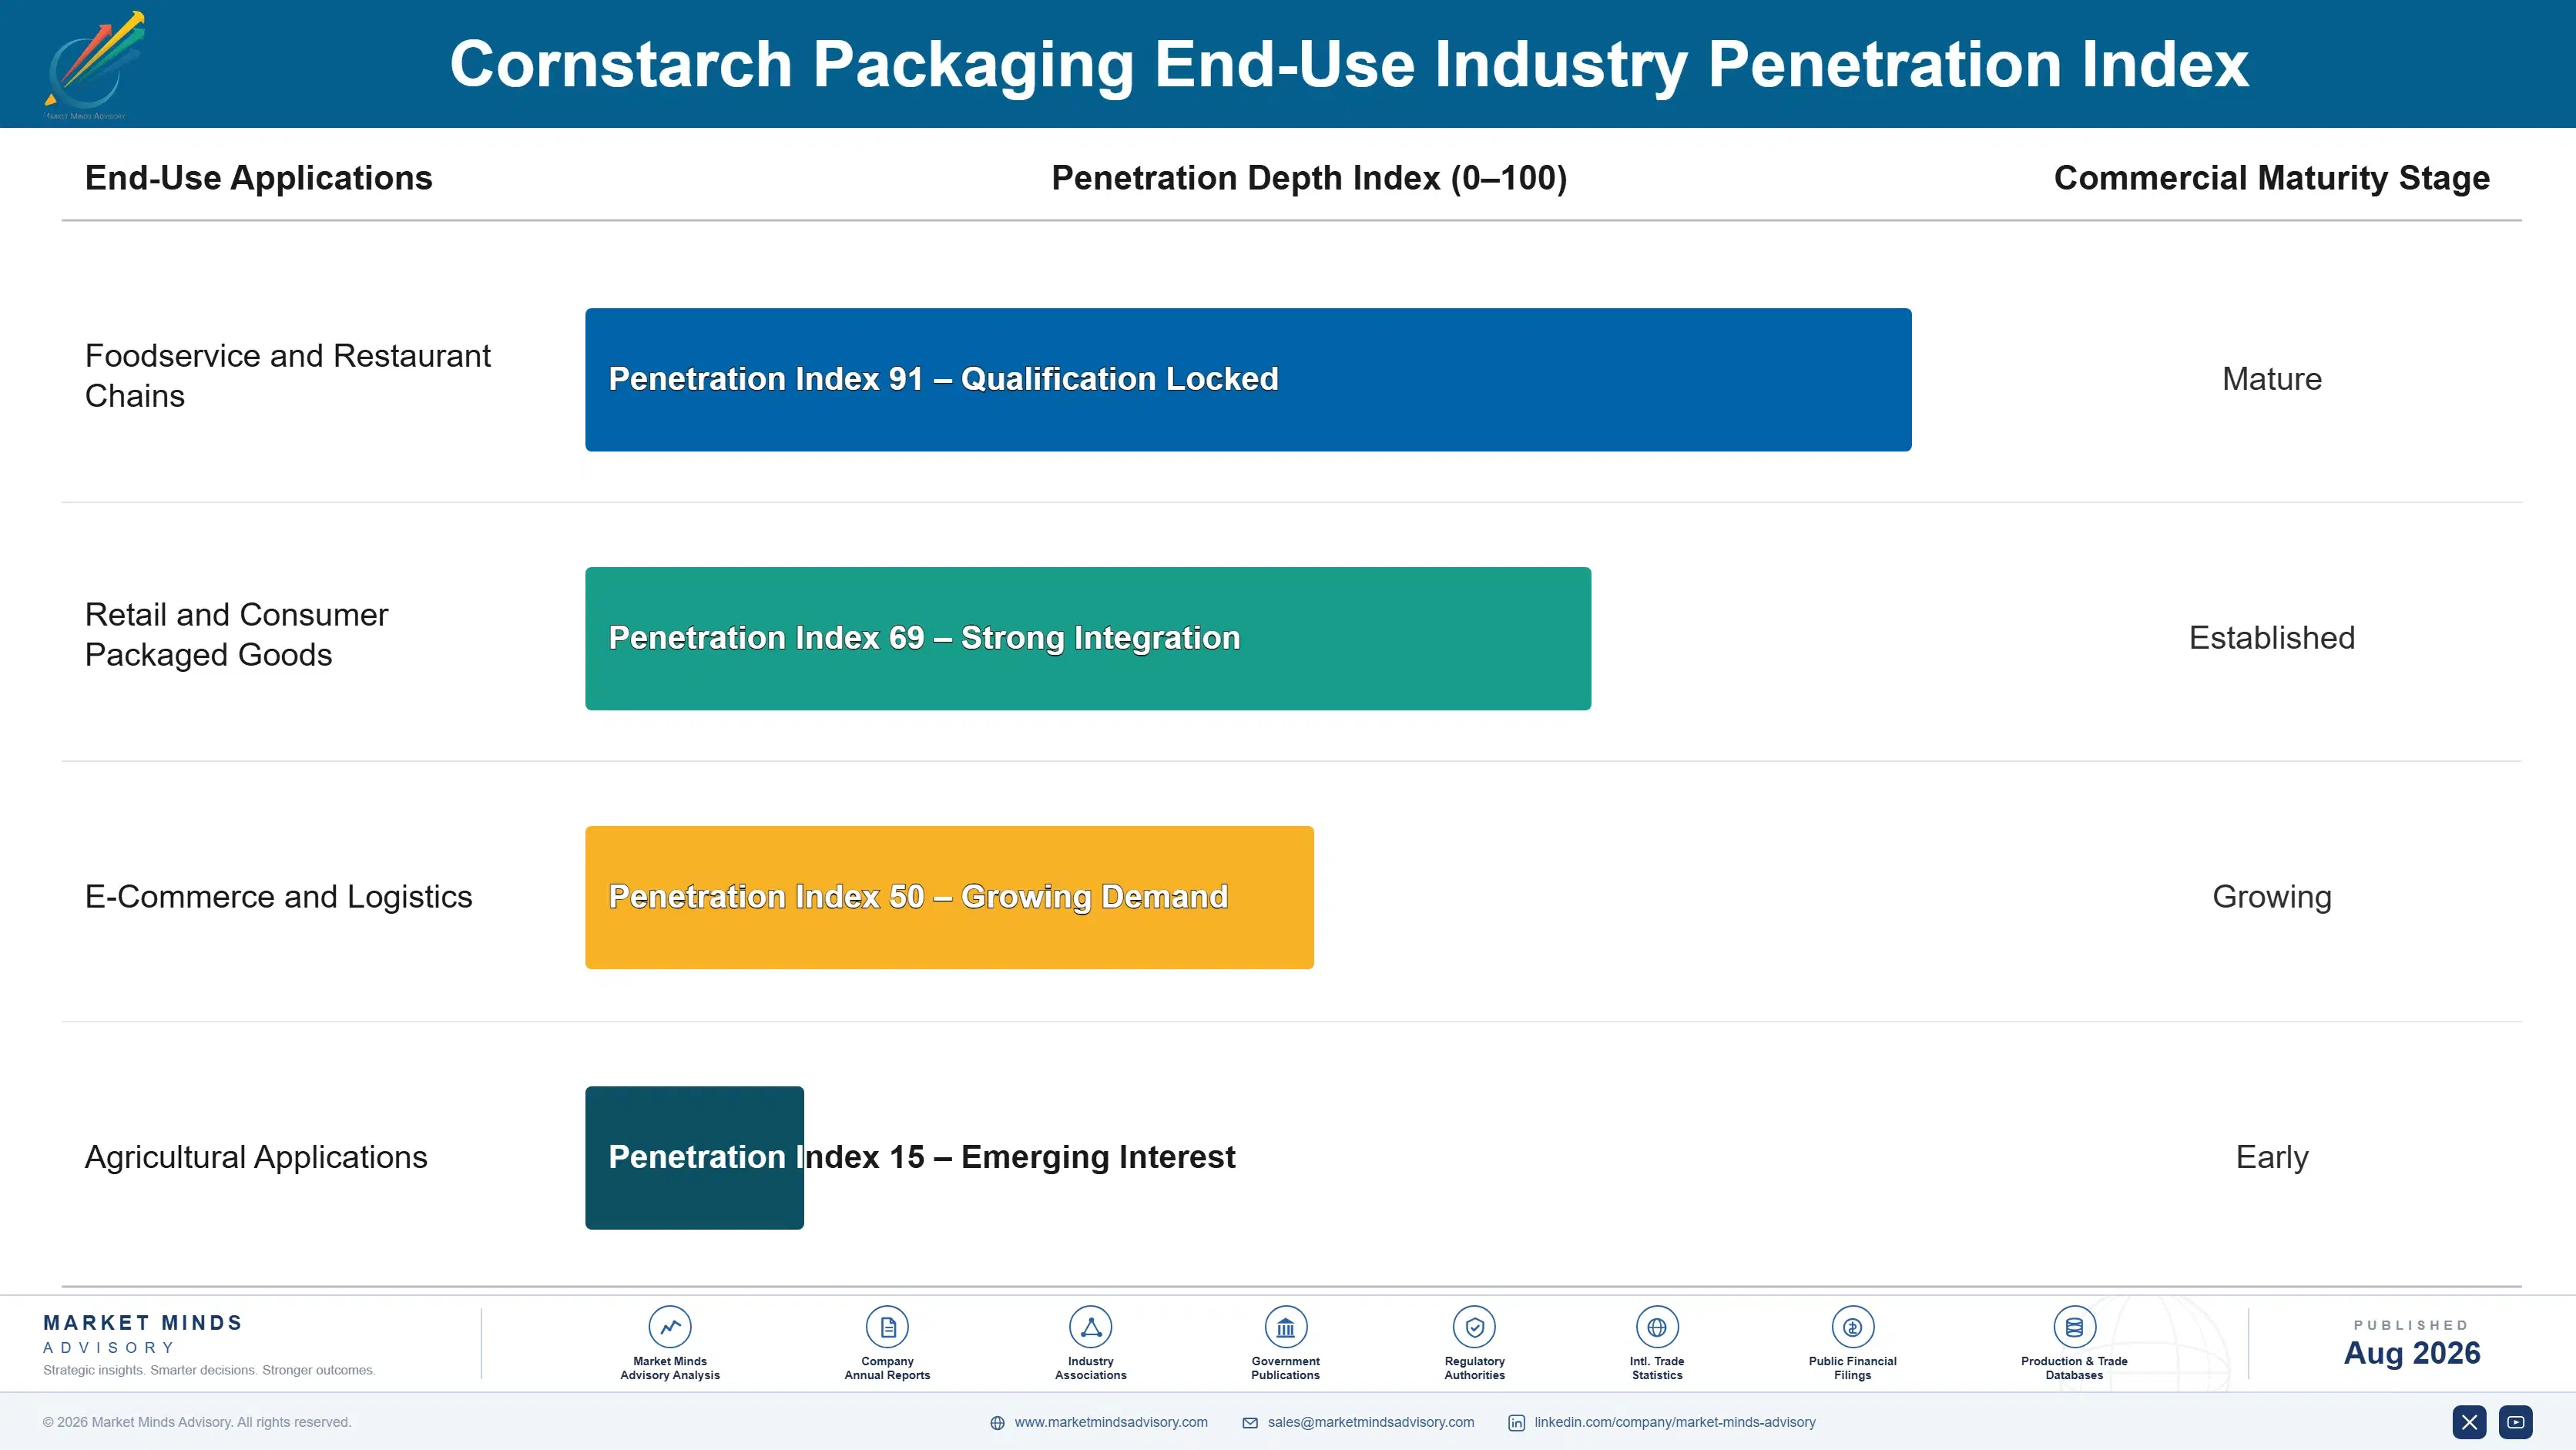
Cornstarch packaging purchasing functions closer to a recurring annuity than a single transaction for foodservice chains and brand owners, since compliance requirements and supplier qualification processes typically lock in multi-year purchasing relationships once a producer secures initial contract approval and certification verification. Protective packaging purchasing behaves somewhat differently, tracking broader industrial shipment volume rather than any regulatory compliance calendar speci
Adoption depth varies sharply by end-use vertical. Large foodservice chains and major consumer brands show the deepest engagement with certified compostable packaging, given dedicated sustainability compliance staff and formal procurement policy requirements, while smaller independent operators adopt more slowly since compliance investment rarely gets justified by comparatively low individual purchasing volume. That divide shapes where manufacturers concentrate commercial investment.

A generational shift is underway as younger procurement managers, trained during the era of routine sustainability compliance requirements, evaluate packaging suppliers on certification depth and regulatory relationship strength rather than decades-long familiarity with conventional plastic packaging vendors. That openness gives compliance-forward manufacturers a rare opening to win brand share in a category where legacy plastic relationships have otherwise been difficult to dislodge, across several major markets today.
cornstarch-packaging-market-end-use-penetration-index-1787304355739

Where MMA Sees The Opportunity

These are among the four positions where our research anticipates prominent divergence between winners and laggards over the coming forecast period. Each is grounded in the demand model, the regulatory perimeter, and the announced capacity pipeline.
01 / FOODSERVICE CAPACITY INVESTMENT

Expand Foodservice-Grade Capacity Before Deadlines Fully Bite

Foodservice chains are increasingly requiring compliant packaging before regulatory deadlines take effect, and manufacturers without adequate capacity investment are losing operator relationships to better-equipped competitors as this shift accelerates. Capacity investment requires meaningful upfront capital but opens durable operator relationships that capacity-constrained competitors cannot match once compliance deadlines fully bite. Manufacturers waiting until deadlines fully arrive will find themselves racing to catch up against incumbents who invested years earlier, a gap that widens each quarter capacity investment lags behind competitor programs already underway.
02 / CERTIFICATION CAPABILITY INVESTMENT

Build In-House Certification Before Testing Queues Lengthen

Brands have not universally committed to a single certification testing partner, leaving a genuine opportunity for manufacturers willing to fund in-house testing capability ahead of confirmed testing queue lengthening trends. Waiting for third-party testing capacity to formally tighten risks missing the certification speed advantage entirely once queues lengthen industry-wide. The investment required is meaningful but positions early movers to capture a certification-driven category growing faster than uncertified packaging today, a window that will not stay open indefinitely once testing queues fully lengthen across the industry.
03 / BRAND PARTNERSHIP DEVELOPMENT

Pursue Procurement Partnerships Before Brands Consolidate Suppliers

Brand procurement policy has repeatedly favored early-mover suppliers first, and manufacturers without dedicated partnership strategies risk ceding this growing procurement channel to competitors who invest in brand relationships earlier. Procurement partnerships represent a meaningful differentiation opportunity even though spot-market sales currently drive most category revenue. Manufacturers pursuing partnership development now, while competitive density remains manageable, protect volume against the next wave of competitors entering this category as more brands formalize compliance requirements across their broader global supply chains and vendor networks.
04 / REGIONAL ACCESS INVESTMENT

Prioritize South Asia and East Asia Access Investment Now

South Asia and Pacific and East Asia carry rapidly growing regulatory-driven demand relative to their current commercial cornstarch packaging value, as plastic restriction policy accelerates across India, China, and neighboring markets. Manufacturers concentrating capacity expansion solely around legacy Western European relationships risk ceding share in the regions where demand growth will be steepest through 2036. Early investment in regional production and distribution partnerships offers a meaningful head start over competitors still anchored entirely to legacy Western customer bases and distribution habits.

Engagement Snapshot From the Field

A live engagement with an industry participant carrying material or product regulatory and market exposure ahead of a defining policy shift, showing how our research translates into a defensible multi-year portfolio strategy.
MARKET MINDS ADVISORY · CLIENT ENGAGEMENT SUMMARY
Cornstarch Packaging Producer Strategic Portfolio Review and Transition Roadmap 2026·Investment Scenario on Cornstarch Packaging Exposure Evaluation 2025-26
CLIENT PROFILE
The client is a mid-sized regional restaurant chain operating multiple locations across a major United States metropolitan area, serving several million customers annually across its affiliated locations. The chain reported annual revenue of approximately $180 million (client-reported, unverified by MMA) and was evaluating whether to transition fully to certified compostable packaging ahead of anticipated regulatory deadlines or delay the transition until mandates took effect instead.
STRATEGIC CHALLENGE
Leadership needed to decide whether early voluntary transition to compostable packaging, which carried a meaningful cost premium, would generate sufficient brand and customer loyalty benefits to justify the cost relative to waiting until regulatory mandates forced the transition. Competing regional chains were beginning to transition voluntarily, raising competitive pressure. Delaying the decision risked ceding competitive ground to peer regional chains.
MMA APPROACH
MMA benchmarked the client's transition options against comparable restaurant chains that had already completed voluntary packaging transitions, modeling customer perception and cost impact against transition timing and marketing investment requirements. The analysis incorporated primary survey data from restaurant chain executives at eleven comparable regional organizations. Findings were cross-checked against customer perception benchmarks published in recent industry surveys.
KEY FINDINGS
  1. Customer perception improvement from early transition exceeded management's initial projections once regional sustainability awareness campaign timing was properly incorporated into the brand positioning model used.
  2. Peer chains that transitioned early reported measurably stronger customer loyalty metrics than chains that waited for mandatory regulatory compliance deadlines to force the transition.
  3. Cost premium impact on overall margin was smaller than initially feared once modest menu price adjustments were incorporated into the financial model used for this specific transition.
  4. Delaying the transition carried a quantifiable competitive risk as customers increasingly viewed compostable packaging as a marker of overall brand quality and environmental responsibility.
CLIENT PROFILE
The client is a mid-sized regional restaurant chain operating multiple locations across a major United States metropolitan area, serving several million customers annually across its affiliated locations. The chain reported annual revenue of approximately $180 million (client-reported, unverified by MMA) and was evaluating whether to transition fully to certified compostable packaging ahead of anticipated regulatory deadlines or delay the transition until mandates took effect instead.
STRATEGIC CHALLENGE
Leadership needed to decide whether early voluntary transition to compostable packaging, which carried a meaningful cost premium, would generate sufficient brand and customer loyalty benefits to justify the cost relative to waiting until regulatory mandates forced the transition. Competing regional chains were beginning to transition voluntarily, raising competitive pressure. Delaying the decision risked ceding competitive ground to peer regional chains.
MMA APPROACH
MMA benchmarked the client's transition options against comparable restaurant chains that had already completed voluntary packaging transitions, modeling customer perception and cost impact against transition timing and marketing investment requirements. The analysis incorporated primary survey data from restaurant chain executives at eleven comparable regional organizations. Findings were cross-checked against customer perception benchmarks published in recent industry surveys.
KEY FINDINGS
  1. Customer perception improvement from early transition exceeded management's initial projections once regional sustainability awareness campaign timing was properly incorporated into the brand positioning model used.
  2. Peer chains that transitioned early reported measurably stronger customer loyalty metrics than chains that waited for mandatory regulatory compliance deadlines to force the transition.
  3. Cost premium impact on overall margin was smaller than initially feared once modest menu price adjustments were incorporated into the financial model used for this specific transition.
  4. Delaying the transition carried a quantifiable competitive risk as customers increasingly viewed compostable packaging as a marker of overall brand quality and environmental responsibility.
RECOMMENDED STRATEGY
Phase 1: Phase 1 (Months 1 to 5): Secure compostable packaging supplier agreements and begin pilot testing across select locations ahead of full transition. Phase 2: Phase 2 (Months 6 to 13): Complete full packaging transition across all locations while tracking customer perception and cost performance against the modeled benchmark closely. Phase 3: Phase 3 (Months 14 to 22): Expand sustainability marketing to capture broader brand loyalty benefits once the transition demonstrates measurable customer response.
OUTCOME
Within eighteen months of transition, the client reported customer loyalty metric improvement of approximately 16% (client-reported, unverified by MMA), exceeding initial projections meaningfully. Overall packaging cost increase remained below initial budget projections (client-reported, unverified by MMA), and the chain now serves as a regional reference model for peer restaurant organizations.

Frequently Asked Questions

Foundational context covering the market sizes, CAGR, scope, country, region and competition that inform every finding below. This section is provided to cover basics and most often pre-purchase conversations, answered from the MMA Primary Research Dataset.

What is the current size of the Cornstarch Packaging Market?

The global cornstarch packaging market was valued at approximately $1.3 billion in 2025. Growth is driven primarily by tightening single-use plastic regulation and rising foodservice adoption.

How large will the Cornstarch Packaging Market be by 2036?

The market is forecast to reach approximately $3.64 billion by 2036, roughly 2.55 times its 2026 value as foodservice and film applications broaden globally. Growth reflects broadening application adoption across multiple packaging categories.

What is the CAGR for the Cornstarch Packaging Market 2026 to 2036?

The market is forecast to grow at a 9.8% CAGR between 2026 and 2036. Bull and bear scenarios range from roughly 8.5% to 11.0% depending on regulatory and feedstock cost trends.

Which segment is growing fastest?

Food service packaging is the fastest-growing segment at approximately 14.6% CAGR, roughly 1.49 times the overall market growth rate. Cornstarch-based films and bags follow as the second-fastest segment.

Who are the major companies in the Cornstarch Packaging Market?

Leading companies include NatureWorks, BASF, Novamont, Total Corbion PLA, and Biotec, together holding an estimated 52% of global commercial revenue. Smaller regional converters make up the remaining fragmented share.

Which country is growing fastest?

India is the fastest-growing country at approximately 12.6% CAGR, driven by national plastic restriction initiatives and rapidly expanding food delivery platforms. Germany still commands the largest overall share of commercial value.

Report Segmentation Architecture

The full report scope spans multiple orthogonal segmentation dimensions, with cross-tabulated demand data provided for each dimension pair. Coverage extends further to regional breakdowns, trend trajectories, and the competitive detail needed to support segment-level decision-making.

By Product and Application Type

  • Loose-Fill Protective Packaging (Packing Peanuts)
  • Food Service Packaging (Trays, Containers, Cutlery)
  • Cornstarch-Based Films and Bags
  • Molded Protective Packaging Inserts
  • Cushioning and Void-Fill Sheets
  • Agricultural and Industrial Packaging Applications

By End-Use Industry

  • Foodservice and Restaurant Chains
  • Retail and Consumer Packaged Goods
  • E-Commerce and Logistics
  • Agricultural Applications

By Commercial Dimension

  • Direct Brand Procurement Contracts
  • Distributor and Wholesale Channels
  • Spot-Market Transactional Sales
  • Certification and Compliance Services

By Region

  • North America
  • Western Europe
  • East Asia
  • South Asia and Pacific
  • Latin America
  • Middle East and Africa
  • Eastern Europe

Scope, Methodology, and Coverage

Every figure in this report is reproducible from documented input assumptions. The scope below maps the historical period, the forecast horizon, the segmentation dimensions, and the countries covered, alongside the underlying primary and qualitative methodology.
Historical Period
2020 to 2025
Forecast Period
2026 to 2036
Base Year
2025 (USD billions; MMA Primary Research Dataset, August 2026)
Market Definition
The cornstarch packaging market covers packaging products manufactured from cornstarch-derived bioplastics, including polylactic acid and thermoplastic starch materials, used across foodservice, protective packaging, and retail applications. It spans loose-fill packaging, molded inserts, films, bags, and rigid foodservice containers manufactured primarily from corn-derived feedstock. Petroleum-based bioplastics and packaging derived from non-corn feedstocks such as sugarcane or cassava are excluded from this scope.
Quantitative Units
USD billions (current prices); production volume in thousands of tonnes where applicable
Segmentation Dimensions
By Product and Application Type; By End-Use Industry; By Commercial Dimension; By Region
Regions Covered
North America, Western Europe, East Asia, South Asia and Pacific, Latin America, Middle East and Africa, Eastern Europe
Countries Covered
USA, China, Germany, France, UK, Japan, South Korea, India, Australia, Canada, Brazil, Mexico, Indonesia, Vietnam, Thailand, Malaysia, UAE, Saudi Arabia, South Africa, Nigeria, Turkey, Poland, Netherlands, Italy, Spain, Sweden, Switzerland, Argentina, Colombia, Singapore, and additional markets relevant to this sector
Key Companies Profiled
NatureWorks LLC, BASF SE, Novamont S.p.A., Total Corbion PLA, Biotec GmbH & Co. KG, Plantic Technologies Ltd., Cardia Bioplastics Ltd., Futerro SA, Green Dot Bioplastics Inc., FKuR Kunststoff GmbH, Tianan Biologic Materials Co., Ltd., Anhui BBCA Biochemical Co., Ltd., Eco-Products Inc., World Centric, Vegware Ltd., BioPak Pty Ltd., Genpak LLC, Plastic Suppliers Inc., Zhejiang Hisun Biomaterials Co., Ltd., Kuraray Co., Ltd.
Quantitative Methodology
Primary survey, n=3,800 respondents, Q4 2025, six countries; demand-side model with trade association cross-validation
Qualitative Methodology
47 expert interviews, Q4 2025; applied to validate demand model assumptions, identify emerging dynamics, and assess competitive positioning
Report Format
PDF and XLSX data workbook (Word format preview document)
Publisher
Market Minds Advisory
Report Code
MMA-2026-PAC-119
Published
August 2026
Contact
sales@marketmindsadvisory.com | www.marketmindsadvisory.com

Purchase the full Cornstarch Packaging Market Report (2026 to 2036).

This report provides a comprehensive analysis of the global cornstarch packaging market, covering protective, foodservice, and film segments across all seven MMA-tracked global regions. It includes detailed market sizing and forecasts through 2036, competitive benchmarking of the top twenty vendors across large diversified and specialty producers, and segment-level analysis of application adoption. The report draws on MMA's primary survey of 3,800 respondents and 47 expert interviews conducted in the fourth quarter of 2025, supplemented by company disclosures and government trade agency data. Buyers receive full access to regional data tables, competitive profiles, and strategic recommendations tailored to packaging producers, brand owners, and materials investors worldwide.
Full seven-region market sizing and forecast data
Competitive benchmarking of twenty profiled industry vendors
Segment-level analysis of application adoption trends
Primary survey data from 3,800 global respondents
Expert interview insights from 47 packaging materials specialists
Strategic recommendations for producers and brand owners

Built For The People Who Decide

From boardroom strategy to bench-side execution, this report is read cover-to-cover by leaders shaping the next decade of their industry, turning demand scenarios, market dynamics and valuation benchmarks into decisions.
CXOs/ Presidents/ VPs/ Managers
M&A and Corporate Development
Strategy Teams and R&D Heads
Procurement and Product Directors
Regulatory and Compliance Leaders
Investor Relations and Equity Analysts