Market Minds Advisory
Copper Mining Market Premium Report

Copper Mining Market Premium Report: Electrification Demand Meets A Geologically Fixed Supply Map

Electric vehicles, grid buildout, and data centres compete for the same finite copper supply, and that supply sits overwhelmingly in Chile, Peru, and the Democratic Republic of Congo, regardless of where manufacturing happens.

Lead Analyst

David Horsley

Published

September 2026

Make Smarter Decisions with Customized Research Insights

Request a free sample report and evaluate market opportunities, growth trends, and competitive dynamics relevant to your business needs.

2025 MARKET VALUE$195.0BMarket Size 2025
2036 FORECAST VALUE$351.4BBase Case , 2026 to 2036
CAGR 2026 TO 20365.5 %Bull 6.7% / Bear 4.3%
INCREMENTAL OPPORTUNITY$145.7BNet 10- year value creation
EXPANSION MULTIPLE1.71x2036 value over 2026 base
Strategic Levers
M&A Pipeline
Regional Outlook
Country Rankings
Competitive Intelligence
Segmental Deep-dive
Call-Us : 91 93563 13602

Executive Snapshot and Market Trajectory

Copper mining has moved from a cyclical industrial commodity to a strategically tracked input, because electric vehicle, grid, and data centre demand now compete directly for concentrate that fixed ore bodies cannot expand quickly enough to satisfy. Producers now lock in offtake agreements years before a new mine breaks ground.
Commercial demand concentrates around electrification infrastructure, grid transmission buildout, and data centre power delivery, where copper's electrical conductivity has no genuinely competitive substitute at scale. In-situ recovery and heap leach-SX-EW production are pulling ahead of traditional concentrate flotation as lower-capital extraction routes reach commercial maturity faster than new large-scale mines can be permitted. Latin America dominates production on Chile and Peru's output, with the DRC-Zambia Copperbelt closing fastest. That split shapes exploration capital flows.
Competitive character splits between diversified mining majors operating across multiple commodities and copper-focused pure plays whose entire value depends on the metal's price cycle. Regulatory pressure is a genuine constant here: permitting timelines, water rights, and community consultation requirements in multiple jurisdictions increasingly determine which projects reach production. Producers navigating these requirements early reach production years ahead of less prepared competitors.
Market Definition
The copper mining market covers copper ore extraction, concentration, and primary production through the concentrate and cathode stage, spanning open-pit and underground mining, in-situ recovery and heap leach-SX-EW production, concentrate flotation processing, byproduct and tailings recovery, and exploration-stage development projects. It excludes downstream copper fabrication, copper recycling and scrap processing, and copper trading and distribution.
Base Year Value
$195.0B in 2025 (MMA Primary Research Dataset, August 2026)
Forecast Period
2026 to 2036, eleven discrete annual values
CAGR
5.5% base case. Bull 6.7%. Bear 4.3%.
Fastest Growth Segment
In-Situ Recovery and Heap Leach-SX-EW: 7.5% CAGR
Fastest Growth Country
Democratic Republic of Congo: 9.4% CAGR
Fastest Growth Region
South Asia and Pacific: 7.5% CAGR
Largest Region
Latin America: 40% of 2025 global value
Market Leaders
Codelco, Freeport-McMoRan, BHP Group, Glencore, Southern Copper Corporation. Source: MMA Analysis based on company annual reports.
Primary Survey
n=3,800 procurement and R&D decision-makers, Q4 2025, six countries
Methodology
Demand-side build-up, cross-validated against public data, 47 expert interviews

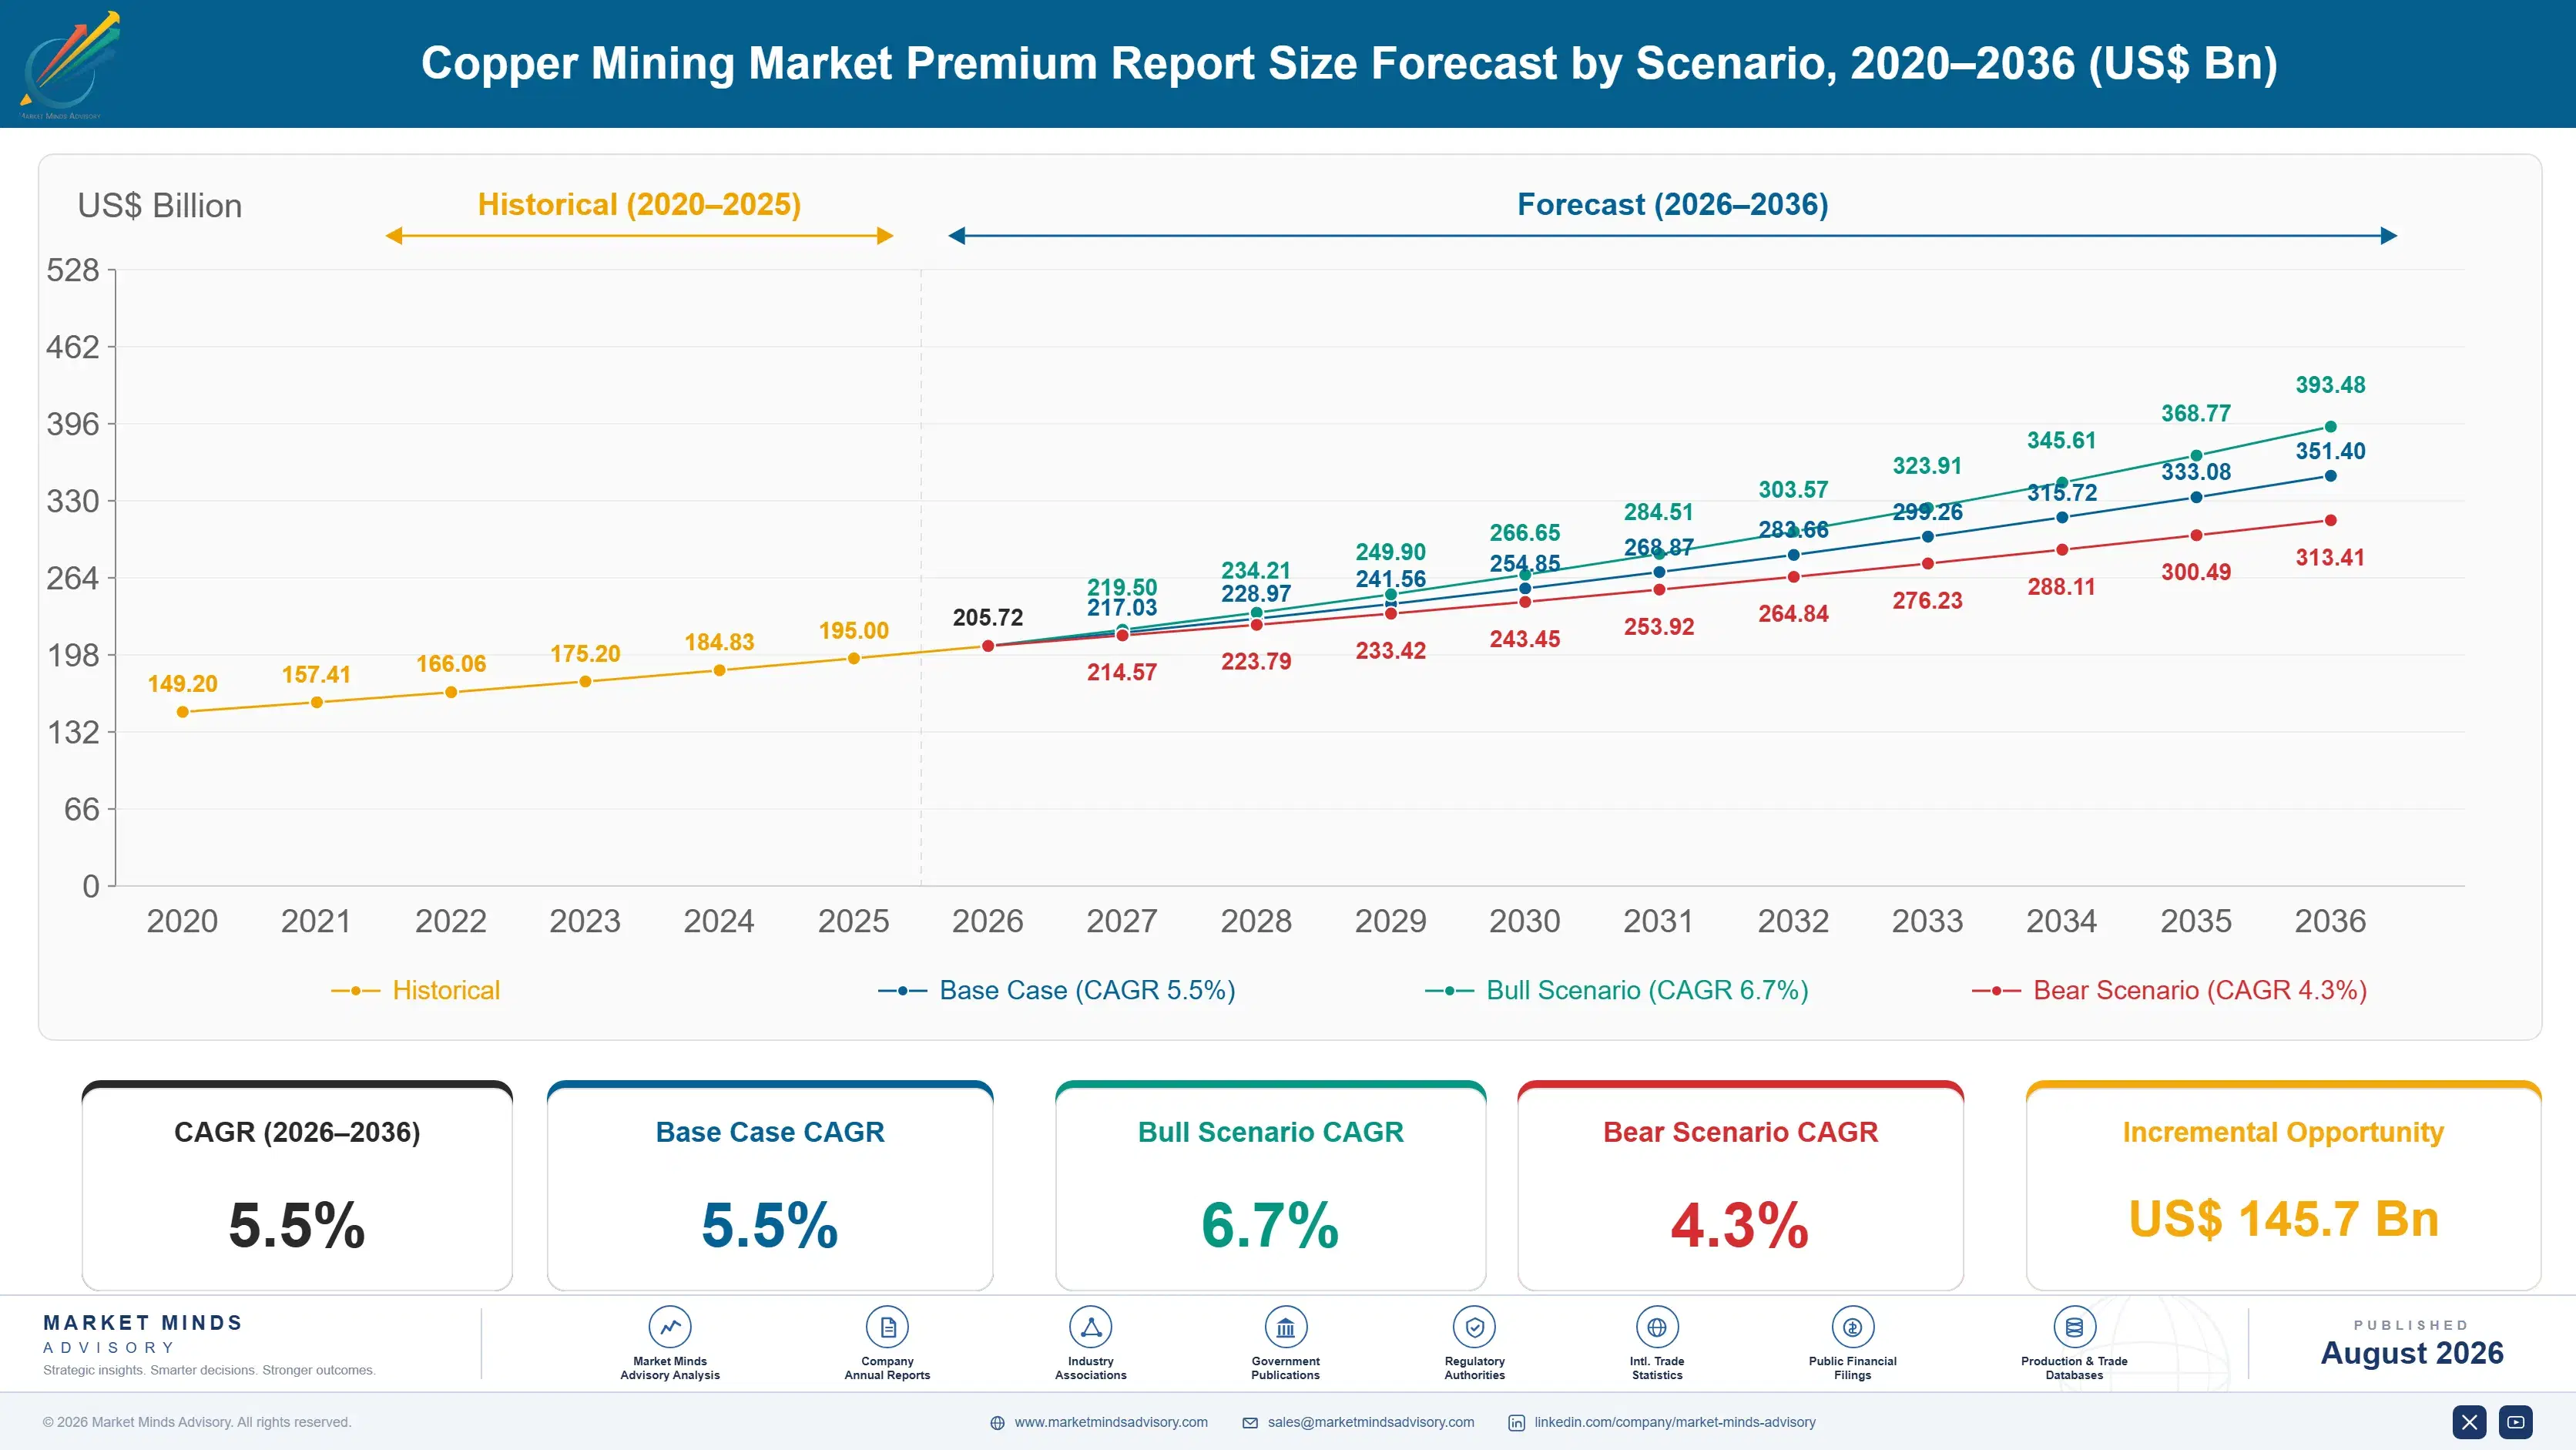
Copper Mining Market Forecast Scenarios

copper-mining-market-size-forecast-scenario-1787302938409
Between 2020 and 2025 the market grew at a 4.9% historical CAGR, tracking global industrial demand growth with electrification only beginning to register as a distinct demand driver toward the end of the period. Growth was steady rather than cyclical-only. Electric vehicle and grid-linked demand only became a clearly visible growth driver from 2023 onward.
The base case carries the market to a 5.5% CAGR through 2036 on three mechanisms. First, electric vehicle production and grid transmission buildout multiply copper intensity per unit of electrification investment across every major economy. Second, the Democratic Republic of Congo and Zambia's Copperbelt continue converting exploration investment into producing capacity faster than any other global region currently manages. Third, ore grade decline at established mines in Chile and Peru forces continuous capital investment just to sustain existing output levels.
The bull case reaches 6.7% if electric vehicle adoption and grid modernisation spending accelerate faster than currently modelled, pulling forward demand that existing supply cannot easily absorb without price appreciation. The bear case falls to 4.3% if global industrial activity slows broadly, easing the immediate pressure on a supply base that otherwise struggles to keep pace with demand.

Why Ore Body Geology Now Sets The Global Price Floor

Three forces converge on copper mining at once. Electric vehicle production and grid buildout multiply copper intensity per electrification dollar invested. The Democratic Republic of Congo and Zambia's Copperbelt continue converting exploration investment into producing capacity faster than any other region. And ore grade decline at established Chilean and Peruvian mines forces continuous capital investment just to sustain existing output.
MARKET CONCENTRATIONCR5: 38%Diversified majors and copper-focused pure plays split over a third
AVERAGE CASH COSTUSD 1.80 to 2.60 per poundCosts vary sharply by ore grade and extraction method used
TOP PRODUCING COUNTRY SHAREChile: 23% of global mine outputAndean ore bodies concentrate production at a single national scale
ORE GRADE DECLINE RATE1.5 to 2.5% annuallyEstablished mines require continuous investment just to sustain output
INPUT COST SHARE25 to 32% of COGSDiesel and electricity dominate recurring operating cost spending
PROJECT DEVELOPMENT LEAD TIME10 to 15 yearsPermitting and construction runs considerably longer than most industries
Commercially, the market behaves like a capital-intensive extraction industry rather than a manufactured-goods category. Buyers specify by concentrate grade, delivery logistics, and long-term offtake reliability rather than by spot price alone, because a smelter cannot easily substitute concentrate mid-contract without costly processing adjustments. That specification discipline protects margin for producers with genuine ore body scale and keeps smaller, marginal-grade operators exposed to price cycles that larger diversified miners can absorb more comfortably.
Over the next decade, extraction method becomes a genuine differentiator alongside geology itself. In-situ recovery and heap leach-SX-EW production are closing the cost gap with traditional flotation as lower-capital extraction routes reach commercial maturity faster than new large-scale mines can be permitted. Producers combining reliable ore body access with flexible extraction technology, rather than conventional mining alone, will capture the lower-grade deposits increasingly dominating new project development.
"Everyone talks about copper demand from electric vehicles, but the number that actually matters is ore grade decline, because the industry is running considerably harder just to keep total output flat before any electrification-driven growth even shows up."
Director, Metals and Mining Practice · MMA Metals and Mining Practice &mid

Market Trends

DRC-Zambia Copperbelt Converts Exploration Into The Fastest Growth Anywhere

The Democratic Republic of Congo has scaled copper production faster than any other major producing country over the past several years, converting exploration investment into operating capacity at a pace that established Chilean and Peruvian operations, constrained by ore grade decline, simply cannot match. Zambia's adjacent Copperbelt operations add a further production layer, and together the two countries now represent a meaningful and rapidly growing share of global mine output. Glencore and Ivanhoe Mines have both expanded Copperbelt investment specifically to capture this fastest-growing production region before infrastructure constraints slow the pace of expansion.
Market Impact: Adds 5-8% copper per transmission m

Electric Vehicle Production Multiplies Copper Intensity Per Vehicle

Electric vehicles require considerably more copper per unit than internal combustion vehicles, since electric motors, battery systems, and charging infrastructure all depend on copper wiring and components at a scale conventional vehicles never required. That intensity multiplier means electric vehicle production growth translates into copper demand growth at a faster rate than unit sales figures alone would suggest, and automakers increasingly negotiate direct or indirect supply agreements to secure this exposure. Freeport-McMoRan and Southern Copper have both expanded direct engagement with automotive supply chain customers specifically to capture this accelerating demand relationship.
Market Impact: Requires 1.5-2.5% annual output rei

Market Opportunities and Growth Drivers

Grid Transmission Buildout Multiplies Copper Demand Per Dollar Invested

Grid modernisation and transmission expansion programmes across multiple major economies require substantial copper content per mile of new transmission line, and utilities planning decade-long capital programmes increasingly negotiate long-term supply agreements directly with producers rather than depending entirely on spot market purchasing. That direct engagement gives producers demand visibility that spans years rather than quarters, since transmission infrastructure investment follows published utility capital plans rather than uncertain consumer purchasing decisions. Grid-linked demand has become a genuine planning input for producers evaluating which new projects justify the capital commitment required to reach production.
Market Impact: Adds 5-10 years to project timeline

Ore Grade Decline Forces Continuous Capital Reinvestment

Established mines in Chile and Peru have worked their highest-grade ore bodies first, and remaining reserves increasingly require deeper extraction, more processing per tonne of ore, or entirely new capital investment just to sustain historical output levels rather than expand them. That declining grade dynamic means a meaningful share of the industry's total capital spending goes toward maintaining existing production rather than adding genuinely new supply, a distinction that matters considerably when forecasting how much new mine capacity the market actually needs. Producers are increasingly evaluating deeper underground extraction and processing technology upgrades specifically to offset this persistent grade decline.
Market Impact: Adds 15-25% capital cost

Market Restraints and Challenges

Permitting Timelines Delay New Supply By A Decade Or More

New copper mine development requires extensive environmental review, water rights approval, and community consultation processes that routinely extend project timelines to a decade or more from discovery to first production, the root cause being that copper deposits increasingly sit in ecologically sensitive or water-scarce regions where regulatory scrutiny has intensified considerably over the past decade. That delay means today's demand growth cannot be met by projects that have not already cleared permitting, regardless of how much capital producers are willing to commit immediately. Producers are responding by front-loading regulatory engagement years ahead, and by prioritising brownfield expansion over greenfield development.
Market Impact: Adds 1-2 major new mines annually

Water Scarcity Constrains Expansion In Key Andean Districts

Chilean and Peruvian copper districts increasingly compete with agricultural and municipal users for scarce water resources, the root cause being that many of the largest remaining ore bodies sit in genuinely arid regions where traditional water-intensive flotation processing faces mounting community and regulatory opposition. That water constraint has already delayed or reshaped several major expansion projects, forcing producers to invest in desalination and water recycling infrastructure that adds meaningful capital cost before a single additional tonne of copper reaches production. Producers are responding with seawater desalination investment and closed-loop water recycling systems specifically to address this constraint directly.
Market Impact: Multiplies vehicle copper content 3
3 additional market trends, 3 additional growth drivers, and 2 additional restraints and challenges are covered in the full report. Contact sales@marketmindsadvisory.com to access the complete intelligence.

Segment CAGR and Growth Architecture

Segmentation follows production route, the single operational logic that determines capital intensity, extraction speed, and ore grade requirements. Open-pit, underground, in-situ recovery and heap leach-SX-EW, concentrate flotation, byproduct recovery, and exploration-stage projects each carry genuinely distinct economics evaluated consistently throughout this report. Downstream fabrication and recycling sit outside this hierarchy, evaluated as a separate category entirely.
copper-mining-market-market-share-analysis-1787302939256

In-Situ Recovery and Heap Leach-SX-EW

In-situ recovery and heap leach-SX-EW production grow fastest at 7.5%, about 1.36 times the market's 5.5% overall rate, as lower-capital extraction routes reach commercial maturity faster than new large-scale conventional mines can be permitted and constructed. These extraction methods use chemical leaching to dissolve copper directly from ore rather than requiring the crushing, grinding, and flotation infrastructure conventional processing demands, cutting both capital cost and environmental footprint per tonne of copper produced considerably. Freeport-McMoRan and Southern Copper have both expanded heap leach-SX-EW capacity specifically to capture lower-grade deposits that conventional flotation economics cannot justify processing. Adoption concentrates first in oxide and lower-grade sulphide deposits, spreading into tailings byproduct recovery as extraction technology improves.
CAGR 7.5%

Byproduct and Tailings Recovery

Byproduct and tailings recovery grows second-fastest at 7.0%, driven by producers seeking to extract additional copper value from historical mine waste rather than developing entirely new greenfield ore bodies that face lengthy permitting timelines. Rather than requiring new mine permits and community consultation processes, reprocessing existing tailings deposits often qualifies for expedited regulatory review given that the environmental disturbance already occurred decades earlier, giving producers a genuinely faster path to incremental production. BHP and Rio Tinto have both expanded tailings reprocessing capability specifically to capture this permitting-advantaged production pathway. Adoption is fastest among producers with large legacy tailings inventories accumulated across decades of prior mining activity. Growth here is accelerating as more producers evaluate their own legacy inventories.
CAGR 7.0%
Full segment breakdown across 6 segments available in the complete report.

Regional Architecture and Country Demand Map

Global production concentrates where ore body geology genuinely determines output, not where manufacturing or consumption happen. Latin America dominates on Chile and Peru's combined scale, the DRC-Zambia Copperbelt is closing the gap fastest, and every other region trails geology by a margin. Regional shares here reflect geology, not industrial capacity.

North America

The United States anchors regional production through established mines in Arizona and Utah, including Freeport-McMoRan's long-running operations, though ore grade decline at these decades-old sites has kept output growth modest relative to newer producing regions elsewhere. Canada contributes a smaller layer through several mid-sized operations serving both domestic and export markets. North America's 9% share sits well below the standard 22 to 32% band that applies to manufacturing-driven categories, a deliberate reflection of copper mining's fundamentally geological rather than industrial-capacity-driven distribution: the region simply does not host ore bodies at anything close to its economic scale. Growth of 5.8% reflects steady investment in extending mine life at existing operations rather than major new discoveries.
Share: 9% | CAGR: 5.8% (2026 to 2036)

Western Europe

Sweden and Portugal hold the region's only meaningful primary copper mining operations, both small relative to global scale and unlikely to expand materially given limited remaining ore body potential across the wider region. Boliden operates the region's most significant mining assets, though its output represents a negligible share of global production by any reasonable comparison. Western Europe's 7% share sits far below the standard 18 to 26% band that applies to manufacturing-driven categories, reflecting a straightforward geological reality: the region simply lacks primary copper ore reserves at meaningful scale, regardless of its refining and fabrication capacity downstream. Growth of 3.8% reflects the slowest pace of any tracked region given genuinely limited expansion potential.
Share: 7% | CAGR: 3.8% (2026 to 2036)
Regional intelligence for 5 additional markets available in the complete report: East Asia, South Asia and Pacific, Latin America, Middle East and Africa, Eastern Europe. Contact sales@marketmindsadvisory.com.
copper-mining-market-country-cagr-analysis-1787302940067

Where Copper Producers Can Defend Margin

Capital budgets are shifting toward extraction methods that reach production faster than conventional greenfield mine development allows. The four levers below capture value before a decade-long permitting cycle even begins, and each rewards producers who can prove ore body access credibly across a customer's full offtake horizon. That reliability increasingly wins the largest long-term contracts outright.

Sell Long-Term Offtake Agreements Directly To Grid And Automotive Buyers

Utilities and automakers planning decade-long electrification capital programmes increasingly want guaranteed copper supply locked in years before a new mine reaches production, since scrambling for spot market supply during a genuine shortage risks both cost and project timeline exposure. Producers that sell long-term offtake agreements directly to end demand customers capture pricing power and demand visibility that spot market sales never provide, and offtake customers rarely switch suppliers once a reliable relationship covering their full capital programme is established. Freeport-McMoRan reports that direct offtake agreements carry pricing terms roughly 15% more favourable than comparable spot-market sales over a multi-year horizon.
Market Impact: Lifts realised pricing roughly 15%

Expand Heap Leach-SX-EW To Reach Production Faster Than Permitting Allows

Conventional greenfield mine development faces permitting timelines extending a decade or more, and producers that instead expand heap leach-SX-EW extraction at existing permitted sites or on lower-grade deposits reach incremental production considerably faster than any new mine could achieve regardless of available capital. That speed advantage captures margin during periods of genuine supply tightness that slower-moving competitors waiting on new mine permits simply cannot access in time, protecting roughly 60% of near-term production growth from permitting delay risk. Southern Copper has pursued exactly this expansion strategy since 2023. That speed matters most during genuine supply tightness.
Market Impact: Protects roughly 60% of near-term p

Reprocess Tailings To Access Expedited Permitting Pathways

Tailings reprocessing at historical mine sites often qualifies for expedited regulatory review given that the environmental disturbance already occurred decades earlier, giving producers a genuinely faster path to incremental production than any greenfield alternative could offer under current permitting regimes. Producers with large legacy tailings inventories capture this permitting-advantaged pathway before competitors without comparable historical assets can replicate it, cutting typical project development timelines by roughly 50% relative to greenfield development. BHP has expanded tailings reprocessing specifically to capture this faster-to-market opportunity across its legacy asset base. That advantage increasingly determines which producers reach incremental production fastest.
Market Impact: Cuts project development timelines

Invest In Copperbelt Infrastructure Ahead Of Competing Capital

The Democratic Republic of Congo and Zambia's Copperbelt represents the industry's fastest-growing production region, but infrastructure constraints, power, transport, and processing capacity, increasingly determine which producers can actually convert known reserves into operating mines on a competitive timeline. Producers that invest directly in supporting infrastructure ahead of competing capital secure a durable position in the region's best remaining ore bodies before infrastructure bottlenecks force later entrants into materially worse terms. Ivanhoe Mines has pursued exactly this infrastructure-first strategy across its Copperbelt developments since 2023. That infrastructure advantage now spans a meaningful share of Ivanhoe's active development portfolio.
Market Impact: Secures access to 10+ major ore bod

Who Controls the Margin Pool

Concentration sits at CR5 38%, moderate for a capital-intensive extraction industry where geology, not manufacturing scale, ultimately determines market position. Codelco and Freeport-McMoRan lead on production volume, while the gap to diversified majors like BHP and Glencore is more about portfolio breadth across multiple commodities than copper-specific operating scale. All participants are assessed on one consistent basis, attributable copper production volume.
Current competitive activity runs across three dimensions. Extraction investment concentrates on heap leach-SX-EW and tailings reprocessing to reach production faster than conventional greenfield permitting allows. Regional investment focuses on the DRC-Zambia Copperbelt rather than established but grade-declining Andean districts alone. And commercial activity centres on direct long-term offtake agreements with grid and automotive buyers rather than spot market sales, a shift that rewards producers with genuine multi-decade ore body visibility.

Emerging pressure comes from Chinese-backed Copperbelt investment scaling behind the region's exceptional ore body quality, winning production share that established Andean producers once assumed was theirs indefinitely. Rankings will shift toward producers combining Copperbelt access with proven technology diversification, since that is what large buyers now specify. Single-region producers without credible geographic diversification face the sharpest exposure ahead.
copper-mining-market-company-positioning-matrix-1787302940868

Competitive Moat and Risk Dimensions

CODELCO

Moat: State-backed Chilean ore body scale

Codelco controls some of the world's largest and longest-established copper ore bodies under Chilean state ownership, giving it a genuine scale and reserve-life advantage that privately held competitors cannot replicate without comparable geological access built up over decades of operation. That reserve depth is difficult for privately held or newer entrants to replicate quickly at comparable scale.
CODELCO

Risk: Severe ore grade decline exposure

Codelco's flagship mines have worked their highest-grade ore first for decades, and remaining reserves increasingly require deeper, more expensive extraction that pressures margin even as the company invests heavily in maintaining historical output levels across its ageing asset base. That reinvestment burden grows as remaining reserves push extraction depth and processing complexity higher every year.
FREEPORT-MCMORAN

Moat: Diversified geographic asset base

Freeport-McMoRan operates major mines across the Americas and Indonesia's Grasberg complex, giving it a genuine geographic diversification advantage that reduces single-region political and permitting risk relative to producers concentrated in one jurisdiction alone. That diversification is difficult for producers concentrated in a single jurisdiction to replicate quickly at comparable scale.
FREEPORT-MCMORAN

Risk: Grasberg partnership structure complexity

Freeport-McMoRan's Grasberg operations depend on a complex partnership structure with the Indonesian state that has required periodic renegotiation, leaving the company more exposed than wholly owned operators to political and contractual risk in that specific jurisdiction. That risk has materialised before and remains a genuine consideration for investors evaluating the company's long-term production reliability.

Players Tracked

Prominent Players

Codelco
Freeport-McMoRan
BHP Group
Glencore
Southern Copper Corporation

Other Key Players

Anglo American plc
Rio Tinto Group
Zijin Mining Group Co. Ltd
Grupo México S.A.B. de C.V.
Antofagasta plc
First Quantum Minerals Ltd
Teck Resources Limited
KGHM Polska Miedź S.A.
Vale S.A.
MMG Limited
Ivanhoe Mines Ltd
Hudbay Minerals Inc.
Lundin Mining Corporation
Jiangxi Copper Corporation
Boliden AB

Recent Developments

APRIL 2025

BHP expands Escondida processing capacity

BHP announced expanded ore processing capacity at its Escondida operation in Chile, the world's largest copper mine by production volume. This was an organic capacity expansion rather than an acquisition, extending Escondida's throughput to help offset ongoing ore grade decline at the long-running operation. across its full processing infrastructure directly.
Signal: Even the world's largest mine requires con
SEPTEMBER 2025

Glencore acquires controlling stake in Zambian copper operation

Glencore completed the acquisition of a controlling stake in a Zambian Copperbelt mining operation with substantial defined reserves. The deal brought established production assets and infrastructure in-house, expanding Glencore's Copperbelt footprint considerably beyond its prior direct presence in the region. across its broader African portfolio directly.
Signal: Major diversified miners are prioritising
JUNE 2025

Freeport-McMoRan signs supply agreement with Asian copper smelter

Freeport-McMoRan entered a multi-year concentrate supply agreement with a major Asian copper smelter covering deliveries across several of its production sites. The agreement was a commercial supply contract, not a joint venture or equity transaction, securing long-term offtake volume for the smelter's refining operations. across the smelter's schedule.
Signal: Multi-year, multi-site concentrate agreeme

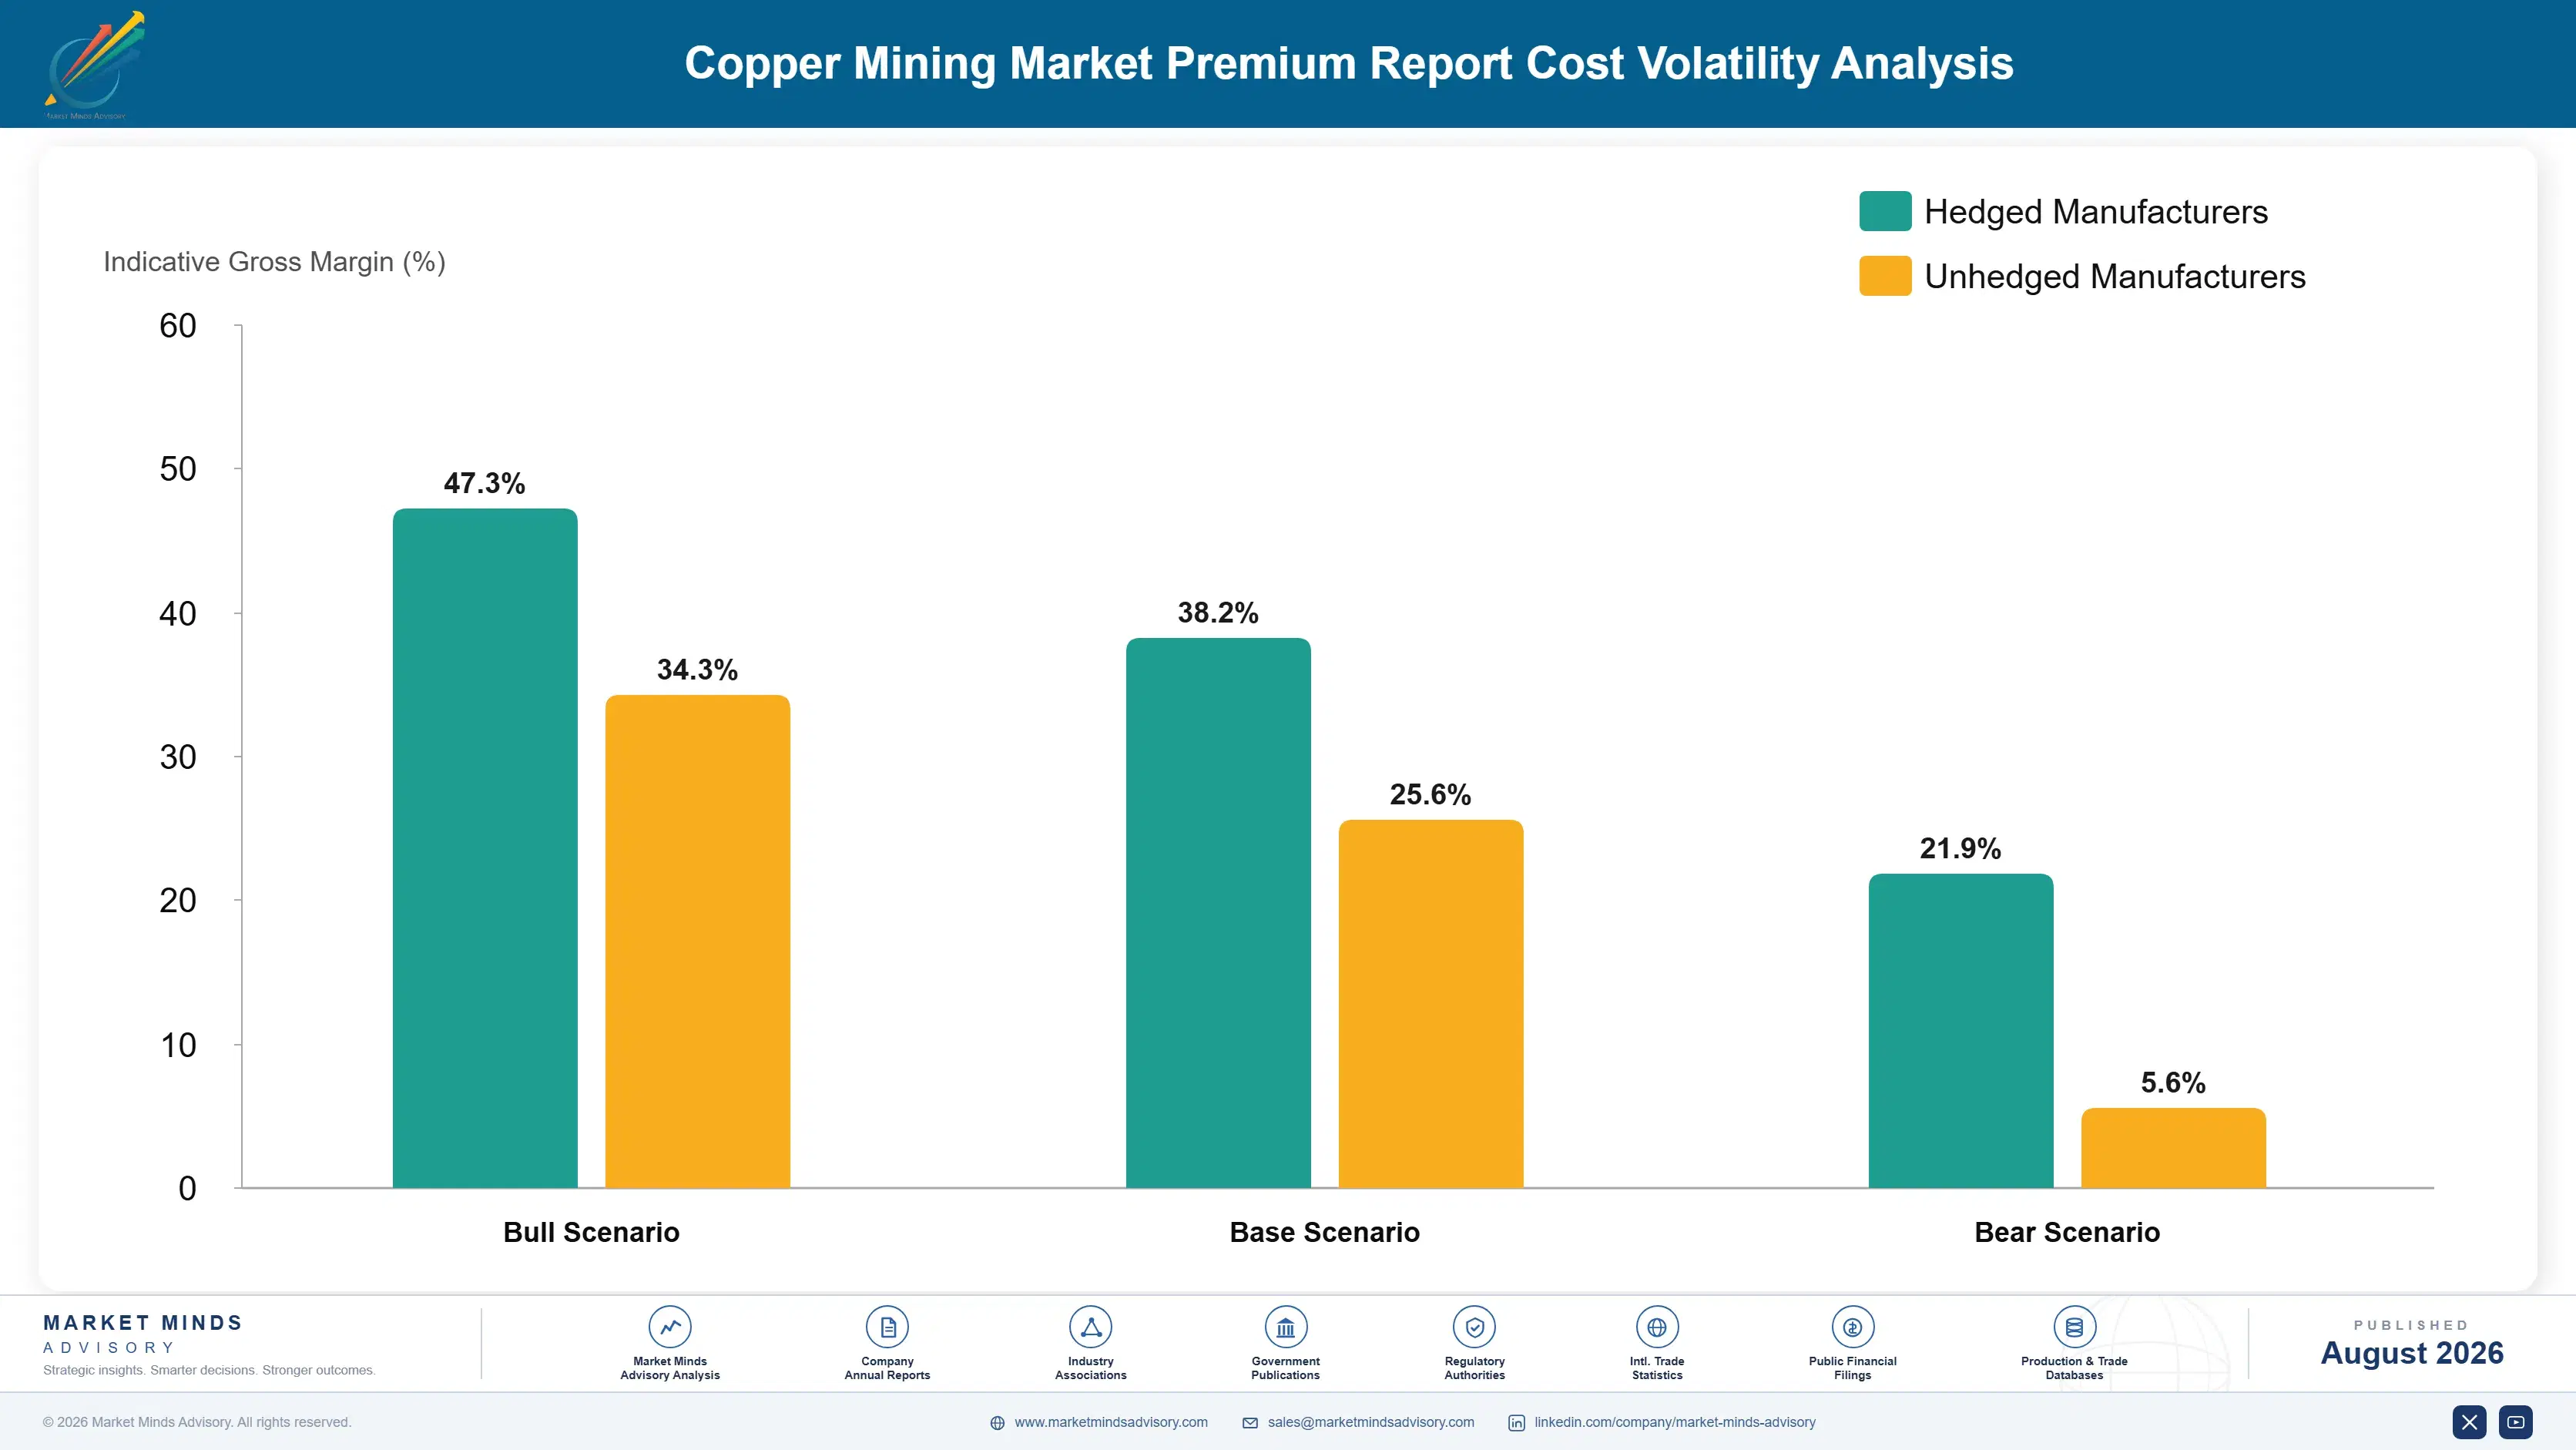
Diesel, Electricity, And Consumable Cost Exposure

Diesel fuel and electricity together run 25 to 32% of COGS, powering the haul trucks, grinding mills, and processing equipment that copper mining depends on at every stage from ore extraction through concentrate production. Labour costs add a further 20 to 25%, with explosives, grinding media, and processing reagents accounting for most of the remainder across both open-pit and underground operations.
The energy price spike running through 2021 and 2022 hit mining operating cost directly, since diesel and electricity pricing moved sharply during that period alongside broader global energy market disruption tied to the war in Ukraine. The EIA recorded diesel prices reaching multi-year highs across 2022, and Freeport-McMoRan's 2022 Annual Report disclosed elevated operating costs across its mining segment, attributing part of the pressure to energy and consumable inflation.

Exposure varies sharply by player type. Vertically integrated majors like BHP negotiate long-term power supply agreements that insulate them from the worst spot electricity volatility, while smaller producers depend on shorter-term energy contracts and absorb price spikes directly into thinner margins. Geography matters too, since remote operations in the DRC and parts of Latin America face higher diesel logistics cost than mines with established grid electricity access nearby.
copper-mining-market-cost-volatility-analysis-1787302941164

Lock Long-Term Power Supply Agreements Ahead Of Demand

Fixed-price, multi-year power purchase agreements with grid operators or dedicated renewable generation smooth electricity costs across price cycles. Several producers moved a majority of their power procurement onto contract pricing rather than spot markets after the 2021 spike exposed their exposure directly. That approach has meaningfully reduced spot-market exposure across the largest producers' operations.

Invest In On-Site Renewable Generation Where Feasible

Solar and wind generation installed directly at remote mine sites reduces diesel dependence for both haul truck fleets and processing power, cutting exposure to volatile fuel markets. Several major Chilean operations have pursued exactly this on-site renewable investment since energy prices spiked in 2021. That investment continues expanding as remote sites seek reliable, lower-cost power alternatives.

Diversify Consumable Supply Across Multiple Regional Suppliers

Explosives and grinding media sourced from a single regional supplier create genuine allocation risk during supply disruptions, giving producers a durable reason to qualify multiple suppliers across different regions simply to protect continuous operations against any single point of failure. Several producers have adopted this diversification as standard practice across their operations. across their supply base.

Portfolio Architecture for Margin Defence

The portfolio splits into three tiers with real margin separation, and the gap between tiers has widened as extraction method and ore body quality both become genuine differentiators. Volume-tier declining-grade legacy operations require continuous reinvestment just to sustain output and earn modestly after that reinvestment. Premium high-grade Copperbelt and large-scale Andean operations earn considerably more because they combine genuine reserve quality with production scale that smaller opera
The tension is between sustaining legacy production and developing genuinely new capacity. Producers running declining-grade established mines push hard on cost control just to maintain historical output, while those investing in Copperbelt and heap leach-SX-EW capacity capture growth that legacy operations alone cannot deliver. Producers running both portfolio types manage genuinely different capital allocation priorities under one corporate structure.

High-value pools concentrate in high-grade Copperbelt reserves and large-scale Andean operations with decades of remaining mine life, where switching cost for customers is highest and long-term offtake demand is most durable. Legacy declining-grade operations remain large in volume but persistently thin in margin, as continuous reinvestment requirements absorb an increasing share of the cash flow these mature assets generate.

Volume / Commodity-Adjacent Tier

Declining-grade legacy operations requiring continuous capital reinvestment just to sustain historical output levels. Margin stays thin because reinvestment absorbs a growing share of operating cash flow. Buyers rarely differentiate between producers on anything beyond cost per pound delivered.
Gross Margin: 22-32%

Premium / Certified Tier

Large-scale Andean operations and established Copperbelt mines with genuine reserve depth and multi-decade remaining mine life. Buyers pay for supply reliability and long-term offtake certainty. Delivery reliability and reserve depth matter as much as the production volume itself.
Gross Margin: 34-46%

Sustainability / Regulatory / Next-Generation Tier

Heap leach-SX-EW and tailings reprocessing projects with expedited permitting pathways and lower environmental footprint per tonne. Margin reflects both permitting speed advantage and technology scarcity. Few producers currently combine both elements convincingly at meaningful commercial scale.
Gross Margin: 36-50%
copper-mining-market-portfolio-architecture-1787302942022

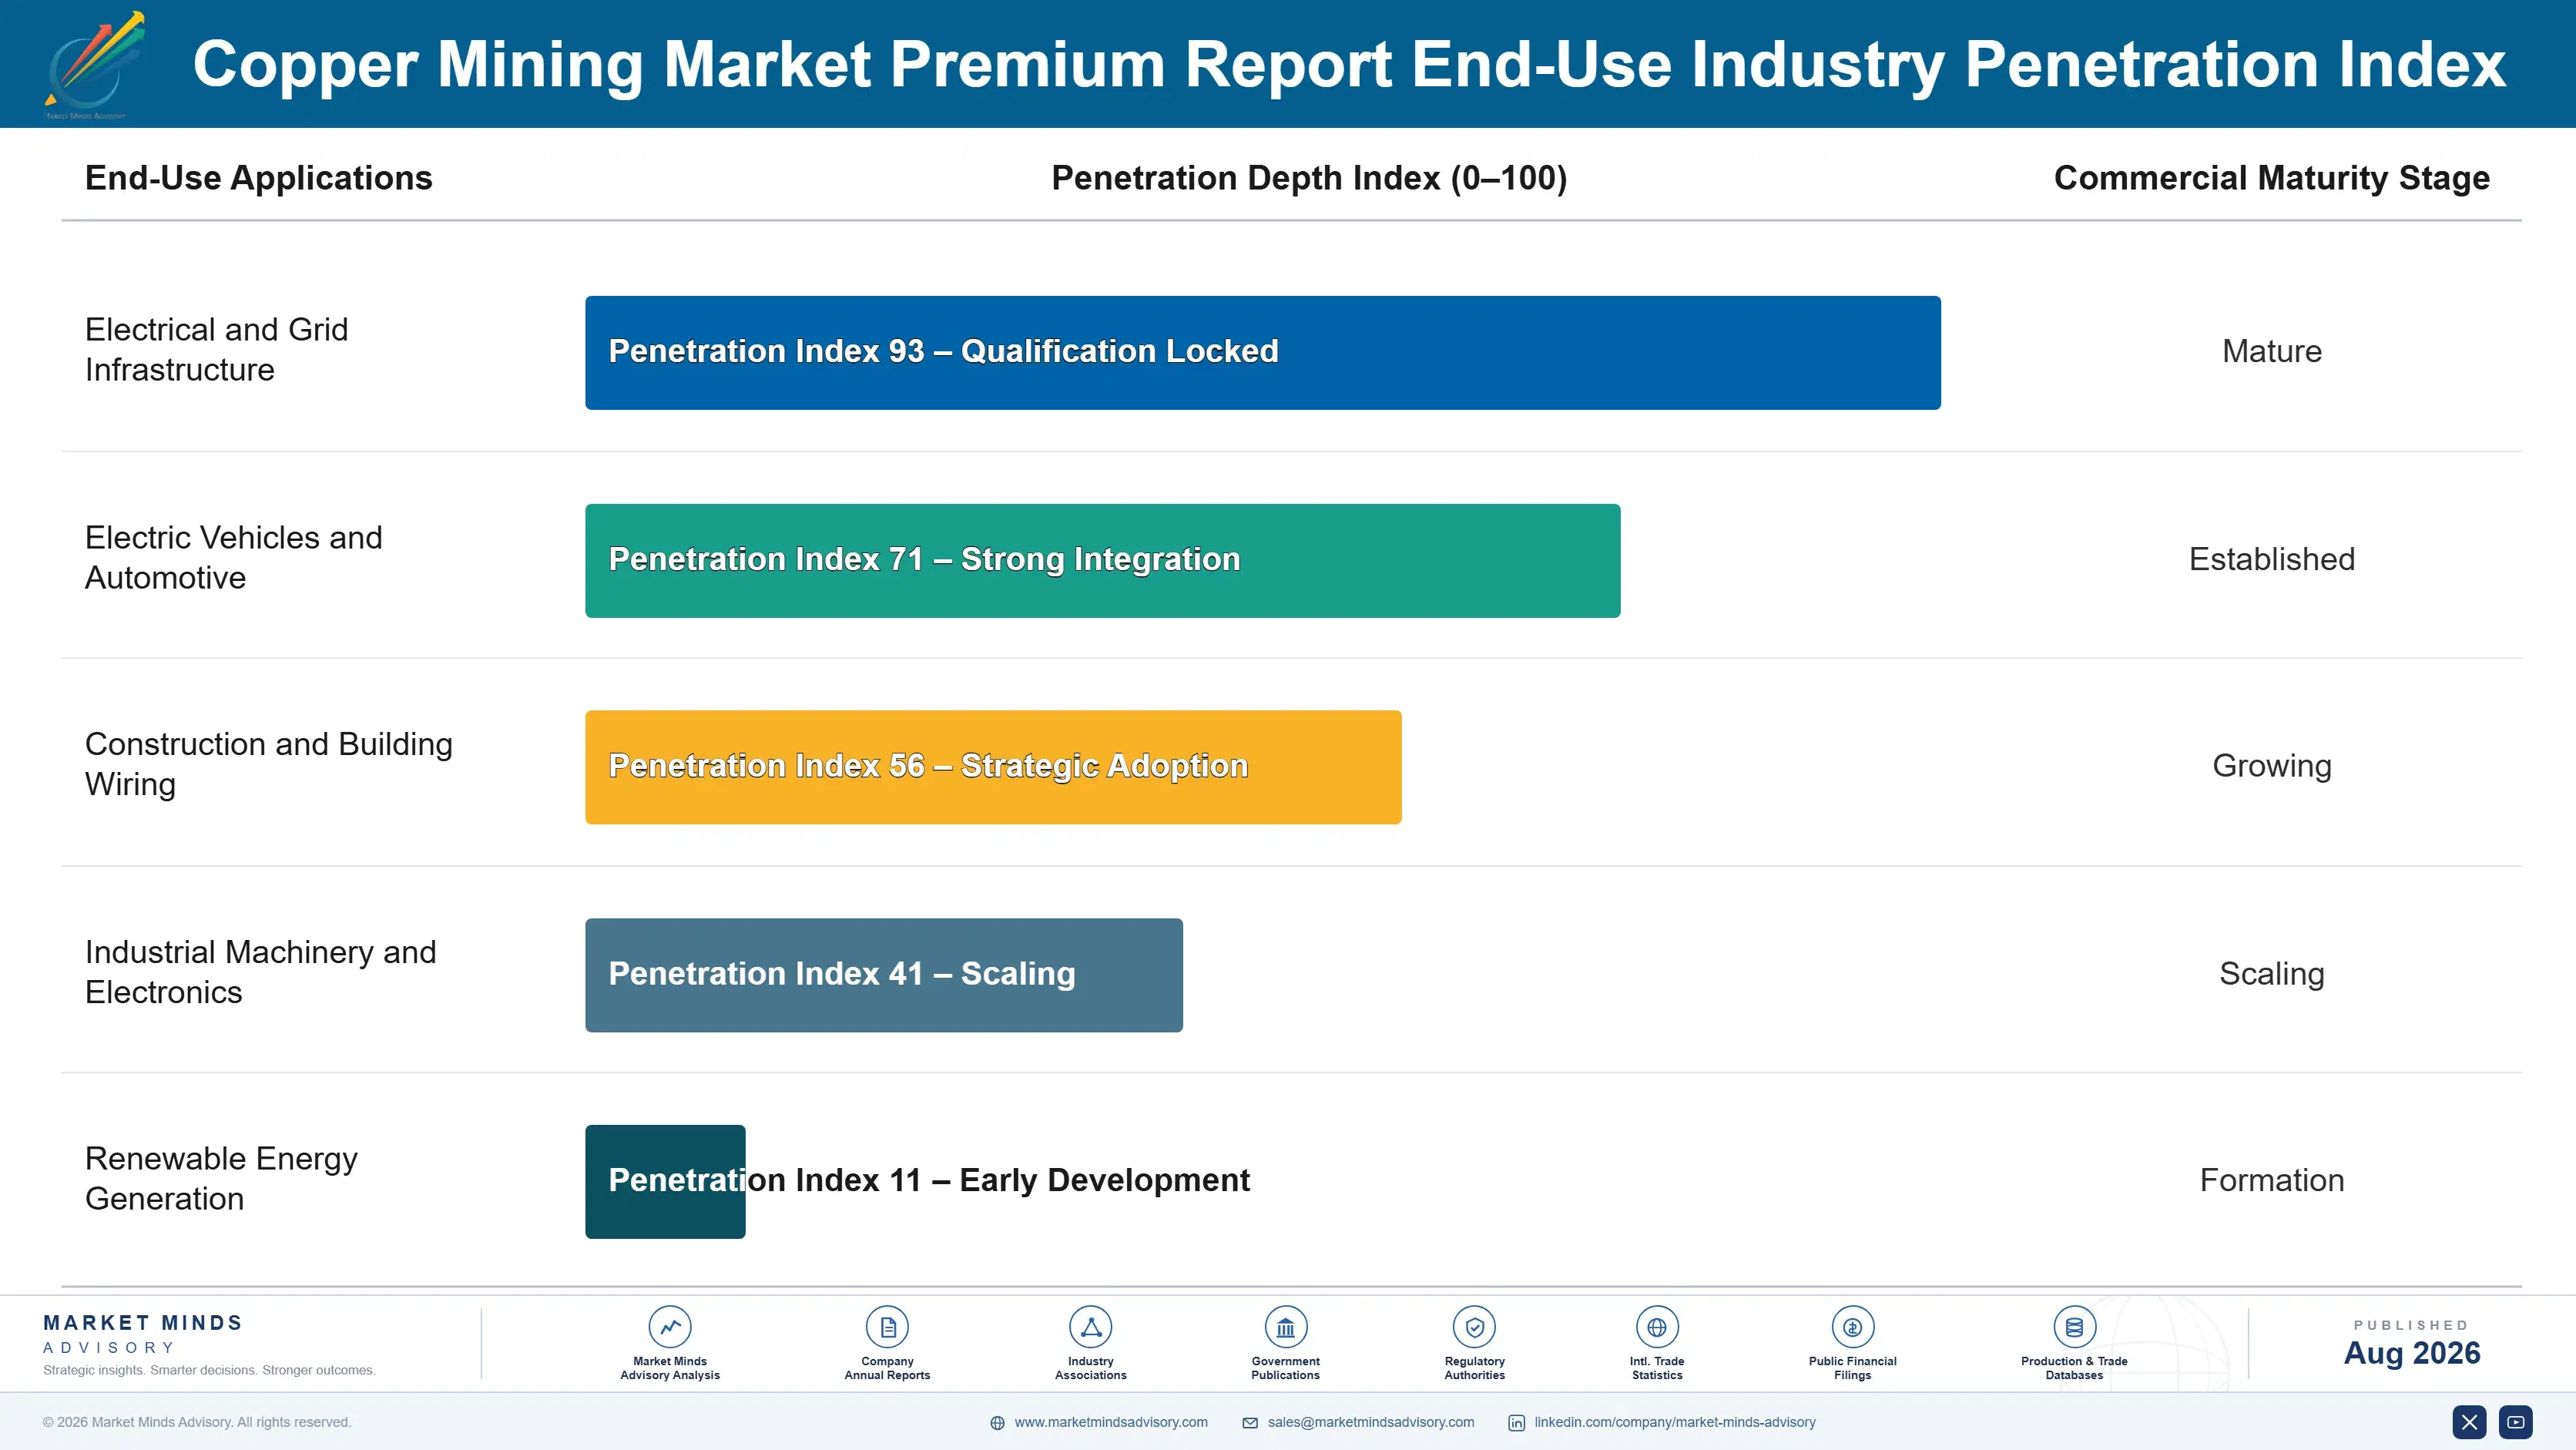
Offtake-Anchored Multi-Decade Demand

Demand behaves like long-horizon project finance rather than a traditional replacement cycle, because grid and automotive buyers increasingly lock in supply agreements spanning a decade or more to match their own capital programme timelines. That long-horizon demand pattern, combined with the underlying reinvestment cycle that established mines require just to sustain output, gives producers a revenue profile that is capital-intensive upfront but increasingly predictable once a major offtake rel
Adoption depth varies sharply by end-use vertical. Grid operators and utilities adopt long-term offtake fastest and deepest, since transmission infrastructure investment follows published multi-year capital plans that require matching supply certainty. Automotive buyers follow closely on electric vehicle production ramp timelines. Construction and general industrial buyers adopt more selectively, often relying on spot and shorter-term contracts rather than decade-long offtake commitments.

Buyer profiles are shifting generationally. Procurement once sat with metals traders evaluating spot price and delivery logistics; it now increasingly involves corporate strategy and supply chain security leaders who specify long-term offtake requirements before a single contract is signed. That shift moves the real purchasing decision earlier into the capital planning cycle and rewards producers who can prove multi-decade reserve reliability credibly.
copper-mining-market-end-use-penetration-index-1787302942786

Where Copper Mining Value Concentrates

These are among the four positions where our research anticipates prominent divergence between winners and laggards over the coming forecast period. Each is grounded in the demand model, the regulatory perimeter, and the announced capacity pipeline.
01 / COPPERBELT POSITIONING STRATEGY

DRC-Zambia Access Now Decides Long-Run Category Position

In-situ recovery and heap leach-SX-EW production is growing at 7.5%, about 1.36 times the market's 5.5% overall rate, and that gap is widening as the DRC-Zambia Copperbelt converts exploration investment into producing capacity faster than any established Andean district currently manages. Producers still concentrated purely in Chile and Peru risk losing the fastest-growing reserve access to rivals who have already secured Copperbelt infrastructure and community relationships. The window to build credible Copperbelt positioning is closing within this forecast period, not the next one,.
02 / LONG-TERM OFFTAKE STRATEGY

Direct Grid And Automotive Agreements Are Becoming Table Stakes

Utilities and automakers increasingly refuse to depend entirely on spot market copper purchasing for capital programmes spanning a decade or more, since a genuine supply shortfall mid-programme threatens their own project timelines directly. Producers who sell long-term offtake agreements ahead of demand capture pricing power and relationship durability that spot-market-dependent competitors simply cannot replicate. Those without secured long-term demand relationships will find themselves more exposed to price volatility than producers with locked-in offtake covering a meaningful share of their production.
03 / EXTRACTION TECHNOLOGY CHANNEL

Heap Leach-SX-EW Will Outgrow Conventional Flotation Growth

Producers are increasingly folding heap leach-SX-EW and tailings reprocessing into corporate growth strategy rather than depending entirely on new greenfield mine permits that take a decade or more to clear regulatory review, concentrating genuine near-term growth in producers with credible extraction technology diversification. Producers who invest in this faster-to-market pathway capture incremental production that permitting-constrained competitors cannot access on a comparable timeline. Those relying purely on conventional greenfield development risk losing this fastest-growing production channel to more technologically diversified rivals.
04 / REGIONAL ORE BODY POSITIONING

Copperbelt Scale Will Keep Pressuring Traditional Andean Dominance

The DRC and Zambia have scaled production fast enough to challenge Chile and Peru's historical dominance of global copper output, and that shift is starting to influence how major buyers structure their long-term sourcing diversification decisions as well. Producers concentrated purely in traditional Andean districts will find their relative share pressured over any meaningful time horizon as Copperbelt capacity continues expanding. The more durable response is building genuine multi-region reserve exposure, a strategy where geographically diversified majors still hold a genuine, durable advantage over single-region pure plays.

Engagement Snapshot From the Field

A live engagement with an industry participant carrying material or product regulatory and market exposure ahead of a defining policy shift, showing how our research translates into a defensible multi-year portfolio strategy.
MARKET MINDS ADVISORY · CLIENT ENGAGEMENT SUMMARY
Copper Mining Premium Report Producer Strategic Portfolio Review and Transition Roadmap 2026·Investment Scenario on Copper Mining Premium Report Exposure Evaluation 2025-26
CLIENT PROFILE
A large regional grid transmission utility approached MMA while planning a decade-long transmission expansion programme requiring substantial cumulative copper volume across the build-out period. The client reported the programme represented a meaningful share of its total capital budget over the coming decade, with copper price exposure representing a significant portion of projected cost overrun risk if left entirely unhedged (client-reported, unverified by MMA).
STRATEGIC CHALLENGE
The utility had historically purchased copper through short-term spot contracts negotiated separately for each transmission project phase, leaving it fully exposed to price volatility across a capital programme spanning many years. Management wanted a procurement strategy that provided genuine cost certainty without requiring the utility to take on commodity trading risk beyond its core transmission business.
MMA APPROACH
MMA benchmarked long-term offtake structures used by comparable utilities and automotive buyers against the client's specific volume and timeline requirements, modelling the cost and risk trade-off between direct producer offtake agreements and financial hedging instruments. We evaluated three qualified producer counterparties on long-term supply reliability and contract structure flexibility specifically for a utility buyer profile.
KEY FINDINGS
  1. A direct long-term offtake agreement with a diversified producer priced more favourably than the client's historical blended spot purchasing cost once volatility risk was incorporated into the comparison.
  2. Two of three producer counterparties evaluated could structure volume commitments matching the utility's phased transmission build-out schedule; the third required rigid annual volumes regardless of actual project timing.
  3. Combining a direct offtake agreement with a smaller financial hedge for volume above the base commitment gave the utility flexibility without sacrificing the core cost certainty its board required.
  4. The utility's existing credit profile qualified it for offtake terms considerably more favourable than smaller regional utilities without comparable balance sheet strength typically receive (client-reported, unverified by MMA).
CLIENT PROFILE
A large regional grid transmission utility approached MMA while planning a decade-long transmission expansion programme requiring substantial cumulative copper volume across the build-out period. The client reported the programme represented a meaningful share of its total capital budget over the coming decade, with copper price exposure representing a significant portion of projected cost overrun risk if left entirely unhedged (client-reported, unverified by MMA).
STRATEGIC CHALLENGE
The utility had historically purchased copper through short-term spot contracts negotiated separately for each transmission project phase, leaving it fully exposed to price volatility across a capital programme spanning many years. Management wanted a procurement strategy that provided genuine cost certainty without requiring the utility to take on commodity trading risk beyond its core transmission business.
MMA APPROACH
MMA benchmarked long-term offtake structures used by comparable utilities and automotive buyers against the client's specific volume and timeline requirements, modelling the cost and risk trade-off between direct producer offtake agreements and financial hedging instruments. We evaluated three qualified producer counterparties on long-term supply reliability and contract structure flexibility specifically for a utility buyer profile.
KEY FINDINGS
  1. A direct long-term offtake agreement with a diversified producer priced more favourably than the client's historical blended spot purchasing cost once volatility risk was incorporated into the comparison.
  2. Two of three producer counterparties evaluated could structure volume commitments matching the utility's phased transmission build-out schedule; the third required rigid annual volumes regardless of actual project timing.
  3. Combining a direct offtake agreement with a smaller financial hedge for volume above the base commitment gave the utility flexibility without sacrificing the core cost certainty its board required.
  4. The utility's existing credit profile qualified it for offtake terms considerably more favourable than smaller regional utilities without comparable balance sheet strength typically receive (client-reported, unverified by MMA).
RECOMMENDED STRATEGY
Phase 1: Phase 1 (0 to 4 months): Negotiate a multi-year offtake agreement with a diversified producer covering the programme's base volume requirement. Phase 2: Phase 2 (4 to 8 months): Layer a supplementary financial hedge covering volume above the base offtake commitment for flexibility. Phase 3: Phase 3 (8 to 24 months): Review offtake performance annually against the transmission programme's actual phasing and adjust volume commitments accordingly.
OUTCOME
The client signed a multi-year offtake agreement covering the majority of its projected transmission programme copper requirement, reducing budget volatility considerably compared with its prior spot-purchasing approach. The procurement framework has since been adopted as the utility's standard approach for other major capital-intensive material categories (client-reported, unverified by MMA).

Frequently Asked Questions

Foundational context covering the market sizes, CAGR, scope, country, region and competition that inform every finding below. This section is provided to cover basics and most often pre-purchase conversations, answered from the MMA Primary Research Dataset.

What is the current size of the Copper Mining Market?

The market was valued at USD 195.0 billion in 2025, with demand heavily concentrated in electrification infrastructure, grid transmission, and heavy industrial applications worldwide today.

How large will the Copper Mining Market be by 2036?

The market is projected to reach USD 351.4 billion by 2036, an expansion multiple of 1.71 times its 2026 value. Electrification demand drives much of that growth.

What is the CAGR for the Copper Mining Market 2026 to 2036?

The base case CAGR is 5.5%, with a bull case of 6.7% and a bear case of 4.3%. The range reflects uncertainty around electric vehicle and grid investment pace.

Which segment is growing fastest?

In-situ recovery and heap leach-SX-EW production grows fastest at 7.5%, about 1.36 times the overall market rate, as lower-capital extraction reaches maturity considerably faster today.

Who are the major companies in the Copper Mining Market?

Codelco, Freeport-McMoRan, BHP Group, Glencore, and Southern Copper Corporation lead the market at CR5 38%, reflecting genuine geological and operational production scale across the industry.

Which country is growing fastest?

The Democratic Republic of Congo grows fastest at 9.4%, driven by exceptional Copperbelt ore body quality and rapid infrastructure investment. Chile remains the largest producer by volume.

Report Segmentation Architecture

The full report scope spans multiple orthogonal segmentation dimensions, with cross-tabulated demand data provided for each dimension pair. Coverage extends further to regional breakdowns, trend trajectories, and the competitive detail needed to support segment-level decision-making.

By Production Route

  • Open-Pit Mining
  • Underground Mining
  • In-Situ Recovery and Heap Leach-SX-EW
  • Concentrate Flotation Processing
  • Byproduct and Tailings Recovery
  • Exploration-Stage Development Projects

By End-Use Industry

  • Electrical and Grid Infrastructure
  • Electric Vehicles and Automotive
  • Construction and Building Wiring
  • Industrial Machinery and Electronics
  • Renewable Energy Generation

By Commercial Dimension

  • Long-Term Producer Offtake Agreements
  • Spot Concentrate and Cathode Sales
  • Smelter Supply Contracts
  • Byproduct and Tailings Sales Agreements

By Region

  • North America
  • Western Europe
  • East Asia
  • South Asia and Pacific
  • Latin America
  • Middle East and Africa
  • Eastern Europe

Scope, Methodology, and Coverage

Every figure in this report is reproducible from documented input assumptions. The scope below maps the historical period, the forecast horizon, the segmentation dimensions, and the countries covered, alongside the underlying primary and qualitative methodology.
Historical Period
2020 to 2025
Forecast Period
2026 to 2036
Base Year
2025 (USD billions; MMA Primary Research Dataset, August 2026)
Market Definition
The copper mining market comprises copper ore extraction, concentration, and primary production through the concentrate and cathode stage, spanning open-pit and underground mining, in-situ recovery and heap leach-SX-EW production, concentrate flotation processing, byproduct and tailings recovery, and exploration-stage development projects. Downstream copper fabrication, copper recycling and scrap processing, and copper trading and distribution are excluded.
Quantitative Units
USD billions (current prices); mine production volume in tonnes of contained copper where applicable
Segmentation Dimensions
By Production Route; By End-Use Industry; By Commercial Dimension; By Region
Regions Covered
North America, Western Europe, East Asia, South Asia and Pacific, Latin America, Middle East and Africa, Eastern Europe
Countries Covered
USA, China, Germany, France, UK, Japan, South Korea, India, Australia, Canada, Brazil, Mexico, Indonesia, Vietnam, Thailand, Malaysia, UAE, Saudi Arabia, South Africa, Nigeria, Turkey, Poland, Netherlands, Italy, Spain, Sweden, Switzerland, Argentina, Colombia, Singapore, and additional markets relevant to this sector
Key Companies Profiled
Codelco, Freeport-McMoRan, BHP Group, Glencore, Southern Copper Corporation, Anglo American plc, Rio Tinto Group, Zijin Mining Group Co. Ltd, Grupo México S.A.B. de C.V., Antofagasta plc, First Quantum Minerals Ltd, Teck Resources Limited, KGHM Polska Miedź S.A., Vale S.A., MMG Limited, Ivanhoe Mines Ltd, Hudbay Minerals Inc., Lundin Mining Corporation, Jiangxi Copper Corporation, Boliden AB
Quantitative Methodology
Primary survey, n=3,800 respondents, Q4 2025, six countries; demand-side model with trade association cross-validation
Qualitative Methodology
47 expert interviews, Q4 2025; applied to validate demand model assumptions, identify emerging dynamics, and assess competitive positioning
Report Format
PDF and XLSX data workbook (Word format preview document)
Publisher
Market Minds Advisory
Report Code
MMA-2026-CHM-105
Published
August 2026
Contact
sales@marketmindsadvisory.com | www.marketmindsadvisory.com

Purchase the full Copper Mining Market Premium Report Report (2026 to 2036).

The full MMA Copper Mining report sizes the market across six production routes, five end-use industries, four commercial dimensions, and seven regions through 2036. It profiles twenty participants on a consistent attributable copper production revenue basis, scoring each on reserve quality, extraction technology diversification, and long-term offtake delivery capability. Scenario models quantify how electric vehicle production, grid transmission investment, and Copperbelt infrastructure development move both demand and realised pricing. The report also includes delivered-cost modelling by production route and an offtake-agreement benchmarking tool built for procurement, project finance, and supply chain security teams.
Production route cost and reserve quality benchmarking
Copperbelt infrastructure investment and expansion tracker
Long-term offtake agreement structure and pricing comparison
Electric vehicle and grid demand forecasting model
Energy and consumable supply chain risk screen
Ore grade decline and reinvestment requirement model

Built For The People Who Decide

From boardroom strategy to bench-side execution, this report is read cover-to-cover by leaders shaping the next decade of their industry, turning demand scenarios, market dynamics and valuation benchmarks into decisions.
CXOs/ Presidents/ VPs/ Managers
M&A and Corporate Development
Strategy Teams and R&D Heads
Procurement and Product Directors
Regulatory and Compliance Leaders
Investor Relations and Equity Analysts