Market Minds Advisory
Continuous Threat Exposure Management Market

Continuous Threat Exposure Management Market: Continuous Threat Exposure Management Market. Real-Time Attack Surface Validation Reshapes Security Operations

Security teams drowning in vulnerability scan backlogs while board directors demand proof that patching priorities actually reduce breach risk are colliding as automated attack path validation platforms scale fast enough to replace static scanning entirely.

Lead Analyst

Published

September 2026

Make Smarter Decisions with Customized Research Insights

Request a free sample report and evaluate market opportunities, growth trends, and competitive dynamics relevant to your business needs.

2025 MARKET VALUE$1.9BMarket Size 2025
2036 FORECAST VALUE$16.9BBase Case , 2026 to 2036
CAGR 2026 TO 203622.0 %Bull 23.3% / Bear 20.7%
INCREMENTAL OPPORTUNITY$14.6BNet 10- year value creation
EXPANSION MULTIPLE7.31x2036 value over 2026 base
Strategic Levers
M&A Pipeline
Regional Outlook
Country Rankings
Competitive Intelligence
Segmental Deep-dive
Call-Us : 91 93563 13602

Executive Snapshot and Market Trajectory.

Security teams are drowning in vulnerability scan output that lists thousands of theoretical weaknesses without indicating which ones an actual attacker could realistically chain together, pushing budget toward platforms that validate exploitability directly. This shift is reshaping how security operations teams prioritize remediation work across the entire organization.
Board-level demand for quantified breach risk reduction is pulling security budget away from traditional vulnerability scanning toward continuous validation platforms that simulate real attack paths, and South Asian technology companies are adopting these platforms fastest given rapidly scaling cloud infrastructure footprints requiring constant reassessment. Cyber insurance underwriters are separately driving demand as policy terms increasingly require demonstrated continuous exposure validation rather than periodic point-in-time assessments alone.
A fragmented vendor landscape still includes traditional vulnerability management platforms treating exposure validation as an add-on module, but specialist attack path simulation vendors are entering directly from offensive security backgrounds rather than the compliance scanning side, changing who counts as a credible competitor. Regulatory frameworks increasingly referencing continuous validation requirements are forcing vendors to navigate a genuinely more complex compliance mapping landscape. Vendors combining both offensive expertise and compliance mapping increasingly win the largest contracts.
Market Definition
This report covers software platforms that continuously discover, validate, and prioritize exploitable attack paths across an organization's digital infrastructure, measured on a global software revenue basis. It excludes traditional periodic vulnerability scanning tools without continuous validation capability and general security information and event management platforms not centered on exposure prioritization.
Base Year Value
$1.9B in 2025 (MMA Primary Research Dataset, September 2026)
Forecast Period
2026 to 2036, eleven discrete annual values
CAGR
22.0% base case. Bull 23.3%. Bear 20.7%.
Fastest Growth Segment
Automated Attack Path Validation Platforms: 28.0% CAGR
Fastest Growth Country
India: 28.5% CAGR
Fastest Growth Region
South Asia and Pacific: 24.2% CAGR
Largest Region
North America: 32% of 2025 global value
Market Leaders
Tenable, Rapid7, Qualys, XM Cyber, Cymulate
Primary Survey
n=3,800 procurement and R&D decision-makers, Q4 2025, six countries
Methodology
Demand-side build-up, cross-validated against public data, 47 expert interviews

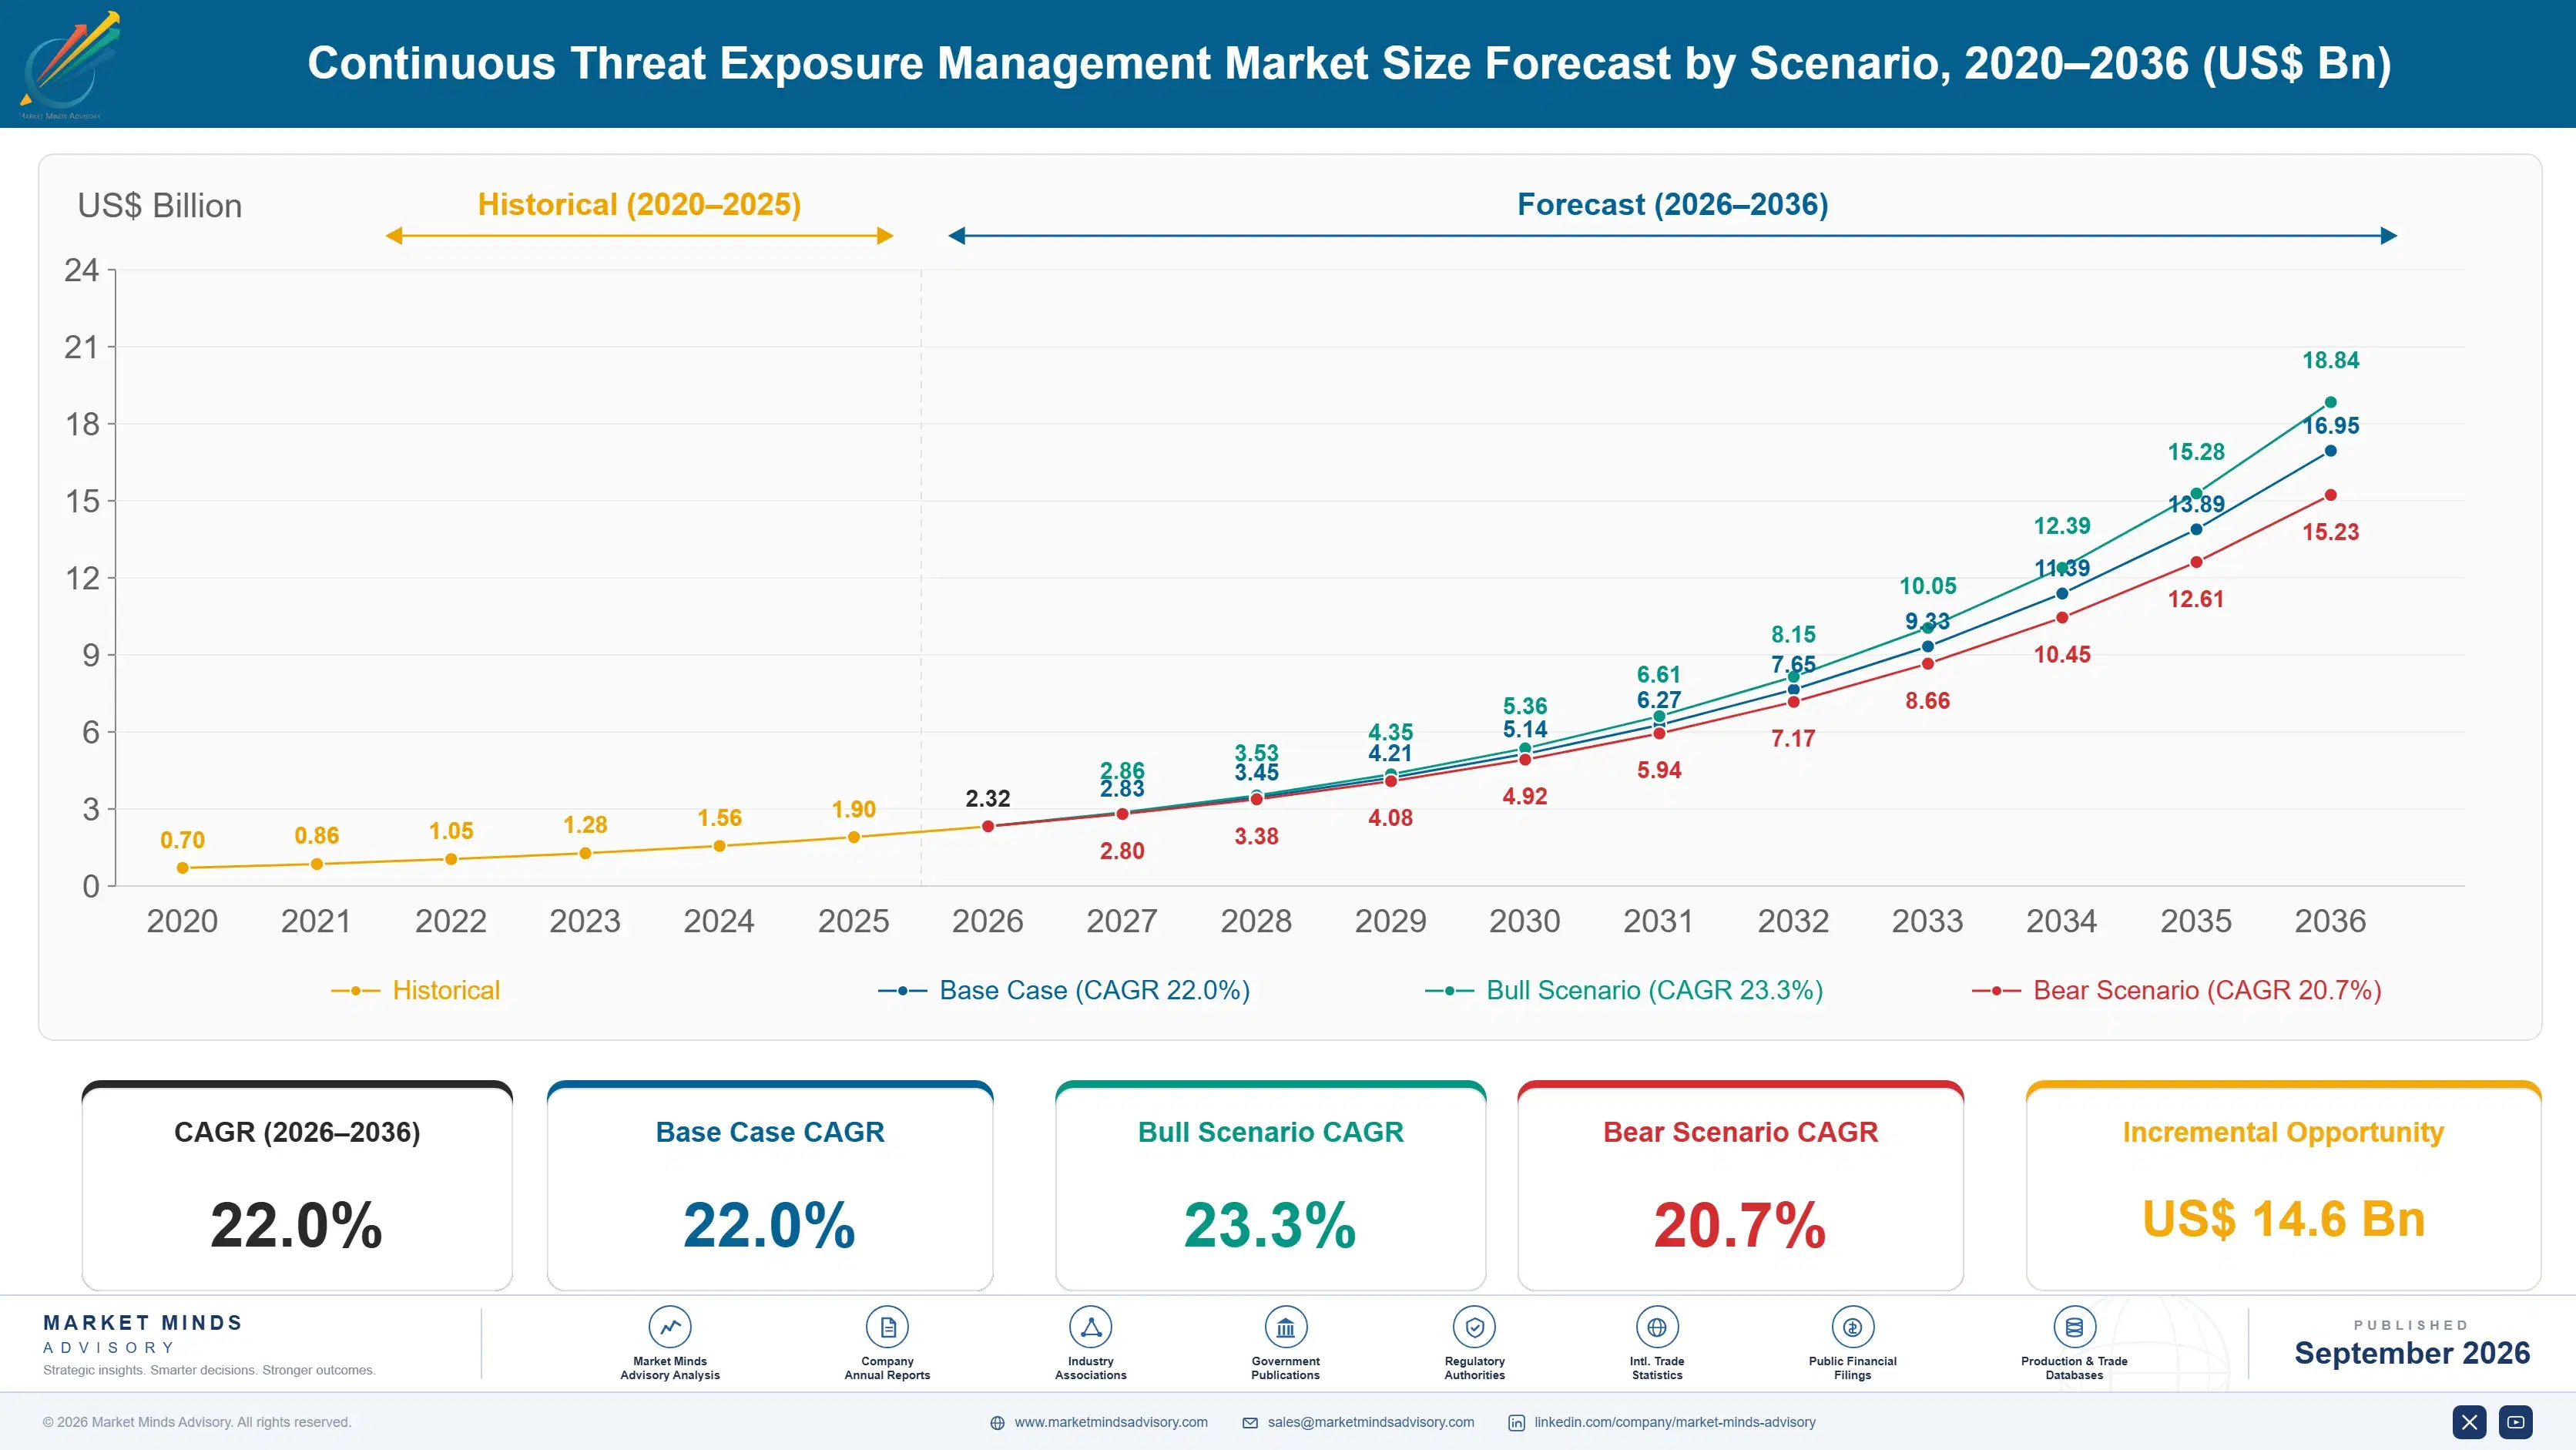
Continuous Threat Exposure Management Market Forecast Scenarios

continuous-threat-exposure-management-market-size-forecast-scenario-1788418986935
Between 2020 and 2025 the continuous threat exposure management market grew at roughly 20.2 percent annually from a small base as cloud infrastructure sprawl outpaced traditional periodic vulnerability scanning cadences. Growth accelerated sharply once Gartner formally named the category, giving security budget holders a defined line item to fund rather than treating it as an extension of existing scanning tools.
The base case assumes continued rapid expansion as three commercial mechanisms compound: cyber insurance underwriters extend continuous validation requirements to a wider tier of policyholders beyond the largest enterprises, cloud infrastructure complexity keeps growing fast enough that periodic point-in-time scanning cannot keep pace, and boards demand quantified breach risk metrics that only continuous attack path validation can credibly provide. Vendors respond by building dedicated offensive security research teams rather than treating validation as a secondary feature layered onto scanning infrastructure.
The bull case centers on a major regulatory body mandating continuous exposure validation for critical infrastructure sectors, accelerating adoption sharply across a defined compliance deadline. The bear case centers on security budget constraints during a broader economic slowdown, delaying platform upgrades and extending reliance on legacy periodic scanning tools well beyond their intended replacement timeline.

Exposure Management Becomes Continuous Validation

Exposure management vendors are no longer selling a vulnerability scanner, they are selling continuous attack validation, and that shift is rewriting who counts as a credible supplier to a large enterprise security team. A vendor without genuine attack path simulation capability cannot win a contract that now requires demonstrating validated exploitability rather than raw vulnerability counts.
MARKET CONCENTRATION34% CR5Top five vendors hold a modest share of platform revenue
AVERAGE SEAT LICENSE COST$45,000 per enterprise deploymentPrice varies widely based on infrastructure size and validation scope
TOP ADOPTION COUNTRY SHAREUnited States, 38% of platform revenueSingle country accounts for largest share of platform subscription spending
AUTOMATED VALIDATION PENETRATION45% of new deploymentsShare of new implementations including automated attack path validation
CYBER INSURANCE LINKAGE28% of enterprise customersPortion of large customers citing insurance as a purchase driver
AVERAGE CONTRACT LENGTHTwo years per enterprise dealTypical duration of a continuous exposure management platform agreement
Vendors that historically sold basic vulnerability scanning are being squeezed out unless they build genuine attack path simulation capability, since security leaders increasingly demand exploitability validation rather than raw vulnerability counts alone. Several smaller vendors have already exited direct enterprise sales entirely, choosing instead to license their scanning engine technology wholesale to larger platforms that already own the customer relationship.
Offensive security consultancies are moving directly into automated platform territory, competing with traditional vulnerability management vendors who never built red-team-grade simulation capability, creating a market where neither pure scanning nor pure offensive security positioning is defensible alone anymore. Security leaders increasingly evaluate vendors on validated attack path accuracy almost as closely as raw scan coverage, a criterion that barely mattered in procurement decisions a decade ago when a comprehensive vulnerability count was considered sufficient.
"A vulnerability list with ten thousand entries and no prioritization is not a security program, it is a to-do list nobody will ever finish. The count was never the point."
Practice Lead, Cybersecurity Risk Management · MMA Enterprise Cybersecurity Risk Management Software Practice · September 2026

Market Trends

Cyber Insurance Underwriters Mandate Continuous Validation

Cyber insurance underwriters are increasingly writing continuous exposure validation requirements directly into policy terms, treating demonstrated attack path testing as a baseline underwriting requirement rather than an optional security enhancement. Over 40 percent of large enterprise cyber insurance policies now reference continuous validation or equivalent testing requirements, up sharply from a small minority just a few years ago. This shift is forcing organizations without dedicated exposure management platforms to adopt one simply to maintain insurability at reasonable premium levels, independent of any internal security team's own risk assessment priorities. each cycle.
Market Impact: Asset counts surpass 500,000 resources
Gartner Category Definition Accelerates Enterprise Budget Allocation

Formal analyst category definition for continuous threat exposure management has given enterprise security budget holders a defined line item to fund, accelerating procurement conversations that previously stalled without a clear category framework to justify spending against. Enterprise adoption of formally categorized platforms has grown by over 50 percent since the category received formal analyst recognition, reflecting how much category naming itself influences procurement momentum in enterprise security software. This dynamic is pulling budget away from adjacent categories that lack similarly clear analyst framing. Vendors that shaped this category definition early continue capturing disproportionate mindshare among enterprise buyers.
Market Impact: Incidents cost over 5 million dollars

Market Opportunities and Growth Drivers

Cloud Infrastructure Sprawl Outpaces Manual Security Review

Enterprise cloud infrastructure footprints are expanding faster than security teams can manually review through periodic scanning cycles, creating a widening gap between actual attack surface and what traditional assessment schedules can credibly cover. Average enterprise cloud asset counts have grown past 500,000 tracked resources at large organizations, an infrastructure scale that periodic quarterly scanning simply cannot assess meaningfully between review cycles. This scale gap is forcing organizations toward continuous, automated validation as the only credible way to maintain current attack surface visibility. Security teams facing this gap increasingly view manual review as unable to keep pace regardless of headcount investment.
Market Impact: Alert volume can exceed 10,000 monthly

Rising Ransomware Losses Push Boards Toward Prevention Investment

Rising ransomware incident costs are pushing corporate boards to demand demonstrable proof that security investment actually reduces breach probability rather than accepting security spending as an unquantified cost center. Average ransomware incident costs have exceeded 5 million dollars when including downtime and recovery expenses, a figure substantial enough to command board-level attention and scrutiny of prevention spending effectiveness. Continuous exposure management platforms directly address this pressure by quantifying breach risk reduction in terms boards can evaluate against investment. Board audit committees increasingly request quantified exposure reduction metrics as a standing agenda item at quarterly meetings.
Market Impact: Talent gap exceeds 3 million roles

Market Restraints and Challenges

Alert Fatigue Undermines Continuous Validation Value

Security teams already overwhelmed by existing vulnerability alert volumes are skeptical that a continuous validation platform will reduce noise rather than adding another dashboard generating its own stream of findings requiring review. The root cause is that many early deployments prioritized comprehensive attack path discovery over genuinely prioritized, actionable output, replicating the same alert fatigue problem the category was meant to solve. This forces vendors to prove genuine signal-to-noise improvement before teams trust platform output enough to act on it. Vendors mitigate this by building tighter integration with existing ticketing and remediation workflows rather than adding a separate dashboard.
Market Impact: Over 40 percent of policies

Skilled Security Talent Shortage Limits Platform Utilization

Organizations that purchase continuous exposure management platforms often lack sufficient skilled security staff to interpret attack path findings and execute remediation at the pace the platform identifies new exposures. The underlying cause is that the cybersecurity talent shortage affects offensive security and attack path analysis skills particularly acutely, since these specialized skills take years to develop beyond general security operations experience. This forces some organizations to purchase platforms that ultimately deliver less value than their licensing cost would suggest. Vendors mitigate this by offering managed remediation services alongside the core platform for customers lacking internal capacity.
Market Impact: Adoption grew over 50 percent
3 additional market trends, 4 additional growth drivers, and 3 additional restraints and challenges are covered in the full report. Contact sales@marketmindsadvisory.com to access the complete intelligence.

Segment CAGR and Growth Architecture

The continuous threat exposure management market splits across five technology-defined segments spanning discovery, validation, and prioritization capability used across enterprise security operations broadly. Automated attack path validation platforms lead growth as boards demand quantified breach risk metrics, while traditional periodic vulnerability scanning tools still represent the largest installed base by seat count across smaller organizations worldwide.
continuous-threat-exposure-management-market-market-share-analysis-1788418987468

Automated Attack Path Validation Platforms

Automated attack path validation platforms continuously simulate how a real attacker could chain together individual vulnerabilities, misconfigurations, and exposed credentials into an actual breach path, moving well beyond static vulnerability lists into dynamic exploitability assessment. This capability requires substantial investment in offensive security research and simulation engine development, a barrier that favors vendors with deep red-team expertise accumulated over years of real-world engagement experience. Growth here outpaces every other segment because boards and insurers increasingly demand quantified, validated risk metrics that only genuine attack simulation can credibly provide rather than theoretical vulnerability counts. Vendors with the deepest red-team research capability are capturing the largest share of new enterprise contracts requiring genuine validation.
CAGR 28.0%

Traditional Periodic Vulnerability Scanning

Traditional periodic vulnerability scanning tools remain the largest segment by installed seat count, covering the foundational network and application scanning capability that most organizations adopted years before continuous validation became commercially viable. This tooling predates the current validation boom and continues serving smaller organizations that lack budget or infrastructure complexity to justify premium continuous validation tiers. Growth here is comparatively modest since these organizations face less complex exposure surfaces, with most new spending going toward incremental scan coverage additions rather than a full platform upgrade to continuous validation. Vendors serving this segment compete primarily on scan coverage breadth and price rather than the deeper simulation sophistication that differentiates validation platforms overall.
CAGR 9.0%
Full segment breakdown across 6 segments available in the complete report.

Regional Architecture and Country Demand Map

North America leads global platform revenue on the strength of key vendor headquarters concentration and mature cyber insurance underwriting infrastructure, while East Asia holds a strong secondary share tied to regional enterprise digitization. South Asia and Pacific grows fastest as India's technology sector scales rapidly.

North America

Vendor headquarters concentration defines North America's share more than raw enterprise count alone. Tenable, Rapid7, and Qualys all book the majority of their global platform revenue through United States entities, reinforced by the region's mature cyber insurance underwriting market that increasingly mandates continuous validation as a policy condition. Critical infrastructure operators face particularly strict regulatory scrutiny tied to sector-specific cybersecurity mandates extending beyond general enterprise requirements. Canada's smaller enterprise sector follows a similar adoption pattern, concentrated among a handful of major national financial and technology companies. Enterprises here increasingly bundle exposure management procurement decisions together with broader cyber insurance renewal negotiations and requirements. Insurance underwriters continue tightening these requirements each renewal cycle.
Share: 32% | CAGR: 23.0% (2026 to 2036)

Western Europe

Western Europe's growth trails the global rate mainly because the region's data protection regulatory framework already forced meaningful baseline security investment before continuous exposure validation became a distinct industry focus elsewhere. Germany's manufacturing sector, running extensive operational technology alongside traditional IT infrastructure, has driven some of the region's most sophisticated converged exposure management deployments spanning both domains. The United Kingdom's critical national infrastructure framework continues extending security requirements to an expanding list of regulated sectors requiring continuous validation. France and the Nordic countries are following a more gradual adoption path, tied to their comparatively smaller enterprise cloud infrastructure footprint relative to Germany and the United Kingdom. Italy adds modest incremental demand too.
Share: 19% | CAGR: 20.5% (2026 to 2036)
Regional intelligence for 5 additional markets available in the complete report: East Asia, South Asia and Pacific, Latin America, Middle East and Africa, Eastern Europe. Contact sales@marketmindsadvisory.com.
continuous-threat-exposure-management-market-country-cagr-analysis-1788418987986

Where Security Vendors Can Still Add Margin

Commoditizing basic scanning features and thinning per-seat licensing margins are pushing vendors toward adjacent revenue lines that ride on top of the same enterprise security relationship rather than the platform subscription itself. Four levers stand out as genuinely additive to core revenue rather than cannibalistic of it, each drawing on data or expertise the vendor already has.

Offering Managed Remediation Services for Identified Exposures

Vendors with attack path validation data can offer managed remediation services that actually fix identified exposures rather than just reporting them, capturing service revenue from customers lacking sufficient internal security staff capacity. This service converts platform output into completed work rather than another item on an overwhelmed security team's backlog. Vendors offering this capability command service fees running roughly 15 to 20 percent of the base platform contract value annually. Building this remediation capability requires operational staffing most pure software vendors historically never developed internally. Some customers prefer this fully managed option entirely.
Market Impact: Service fees add 15 to 20 percent yearly

Providing Cyber Insurance Compliance Certification Services

Vendors with proven continuous validation methodology can offer formal certification services that enterprises use to satisfy cyber insurance underwriter requirements, capturing revenue from a compliance requirement enterprises must satisfy regardless of vendor choice. This certification converts a growing insurance industry requirement into an integrated revenue line rather than leaving customers to manage a separate assessment relationship. Vendors offering this capability report certification fees reaching 6 to 10 percent of total platform contract value. Building this certification credibility requires accumulating a track record most newer entrants have not yet established. each cycle.
Market Impact: Certification revenue reaches 6 to 10 percent share

Selling Board-Level Risk Reporting and Benchmarking

Vendors that aggregate anonymized exposure data across their customer base can sell board-level risk benchmarking reports comparing a customer's exposure posture against industry peers, capturing revenue from data the vendor already collects for its own platform purposes. This reporting has proven especially valuable to board audit committees seeking external validation of internal security team performance claims. Attach rates above 30 percent among enterprise customers are now achievable for vendors with sufficient customer base density to generate meaningful benchmarks. Building this benchmarking capability requires sufficient customer scale that smaller vendors cannot easily replicate.
Market Impact: Attach rates now exceed a 30 percent mark

Offering Custom Attack Simulation for Regulated Industries

Vendors that build dedicated simulation teams can offer large regulated enterprise customers custom attack path scenarios tuned to their specific industry threat models and compliance frameworks, capturing premium revenue beyond the standard platform subscription. This capability has proven especially valuable to financial services and critical infrastructure customers where generic simulation scenarios underperform on industry-specific attack patterns and regulatory requirements. Vendors offering this capability report custom engagements reaching over 300,000 dollars for the largest regulated enterprise accounts. Building this custom simulation capability requires deep industry-specific threat research most vendors must develop over time.
Market Impact: Custom engagements now reach well over 300,000 dollars

Who Controls the Margin Pool

Global platform revenue concentrates modestly, with the top five vendors holding roughly 34 percent share on a platform revenue basis, the consistent yardstick applied throughout this assessment. Tenable and Rapid7 lead the enterprise category, though XM Cyber's attack-path-first scale gives it a distinct competitive position built on simulation depth rather than broad vulnerability management breadth. The gap between these leaders and mid-tier challengers remains narrow enough that near-term ranking changes look plausible.
Current activity centers on attack path simulation expansion and remediation service bundling rather than price competition on basic scanning. Vendors are racing to extend validation coverage across cloud, on-premises, and identity infrastructure simultaneously, since enterprise buyers increasingly refuse to purchase point solutions covering only one environment type. Several mid-tier players have pursued offensive security team acquisitions specifically to close the simulation capability gap with established leaders.

Emerging pressure comes from offensive security consultancies entering automated platform territory directly, competing with traditional vulnerability management vendors who never built red-team-grade simulation capability. Ranking shifts are most likely in the mid-tier, where vendors lacking genuine attack simulation depth risk losing enterprise contracts to faster-moving specialists. The very top of the market remains comparatively unsettled, unlike more mature cybersecurity categories.
continuous-threat-exposure-management-market-company-positioning-matrix-1788418988512

Competitive Moat and Risk Dimensions

TENABLE

Moat: Broad Vulnerability Management Installed Base

Tenable's vulnerability management platform holds one of the largest enterprise installed bases in the category, letting it extend continuous validation into an existing customer relationship rather than selling a standalone point solution to new accounts. Displacing this installed base would require migrating not just scanning data but years of accumulated remediation history.
TENABLE

Risk: Less Offensive Security Depth

Tenable's broad vulnerability management heritage means its attack path simulation depth sometimes trails specialist vendors like XM Cyber who focus more narrowly on offensive validation, risking share loss on the most technically demanding enterprise contracts. Closing this gap would require dedicated investment in offensive security research that Tenable has only recently prioritized.
XM CYBER

Moat: Deep Offensive Security Simulation Expertise

XM Cyber's origins in offensive security and red-team consulting give it attack path simulation depth that general vulnerability management vendors struggle to match technically, appealing to security leaders who prioritize genuine exploitability validation. This specialization has made XM Cyber a preferred choice among the most security-conscious enterprise buyers.
XM CYBER

Risk: Narrower Platform Breadth Overall

XM Cyber lacks the broader vulnerability management platform bundle that Tenable and Rapid7 offer, limiting its ability to win enterprise contracts where buyers prefer a single integrated vendor relationship across the full security stack. Expanding this bundle would require years of new product development that pure-play specialists rarely prioritize quickly.

Players Tracked

Prominent Players

Tenable
Rapid7
Qualys
XM Cyber
Cymulate

Other Key Players

CrowdStrike
Palo Alto Networks
Mandiant (Google)
Pentera
Randori (IBM)
SafeBreach
AttackIQ
NopSec
Vulcan Cyber
Balbix
Brinqa
Kenna Security (Cisco)
Ivanti Neurons for RBVM
Skybox Security
FireCompass

Recent Developments

MARCH 2026

Tenable Launches Automated Remediation Workflow Module

Tenable launched a new automated remediation workflow module integrated directly into its exposure management platform, letting security teams route validated attack paths directly to ticketing systems without manual triage steps. The module works with several major ticketing platforms already widely used across enterprise security teams.
Signal: Automated remediation routing is becoming a standard platform feature rather than a premium differentiator. broadly across the market.
OCTOBER 2025

XM Cyber Wins Multi-Year Government Contract in India

XM Cyber secured a multi-year exposure management contract with a major Indian government agency, expanding its presence in a market central to the region's fastest-growing continuous validation demand and technology adoption. Financial terms of the multi-year contract were not disclosed by either party involved. today.
Signal: Government agencies are becoming a primary channel for winning meaningful platform volume in emerging markets. today.
MAY 2025

Cymulate Acquires Cyber Insurance Analytics Startup

Cymulate completed the acquisition of a smaller cyber insurance analytics startup, adding certification and underwriting compliance capability to its existing platform portfolio rather than partnering with a third-party insurance analytics vendor. Financial terms of the acquisition were not disclosed by either company involved. publicly by either firm.
Signal: Vertical integration into insurance compliance is becoming a competitive necessity across the category. across the category.

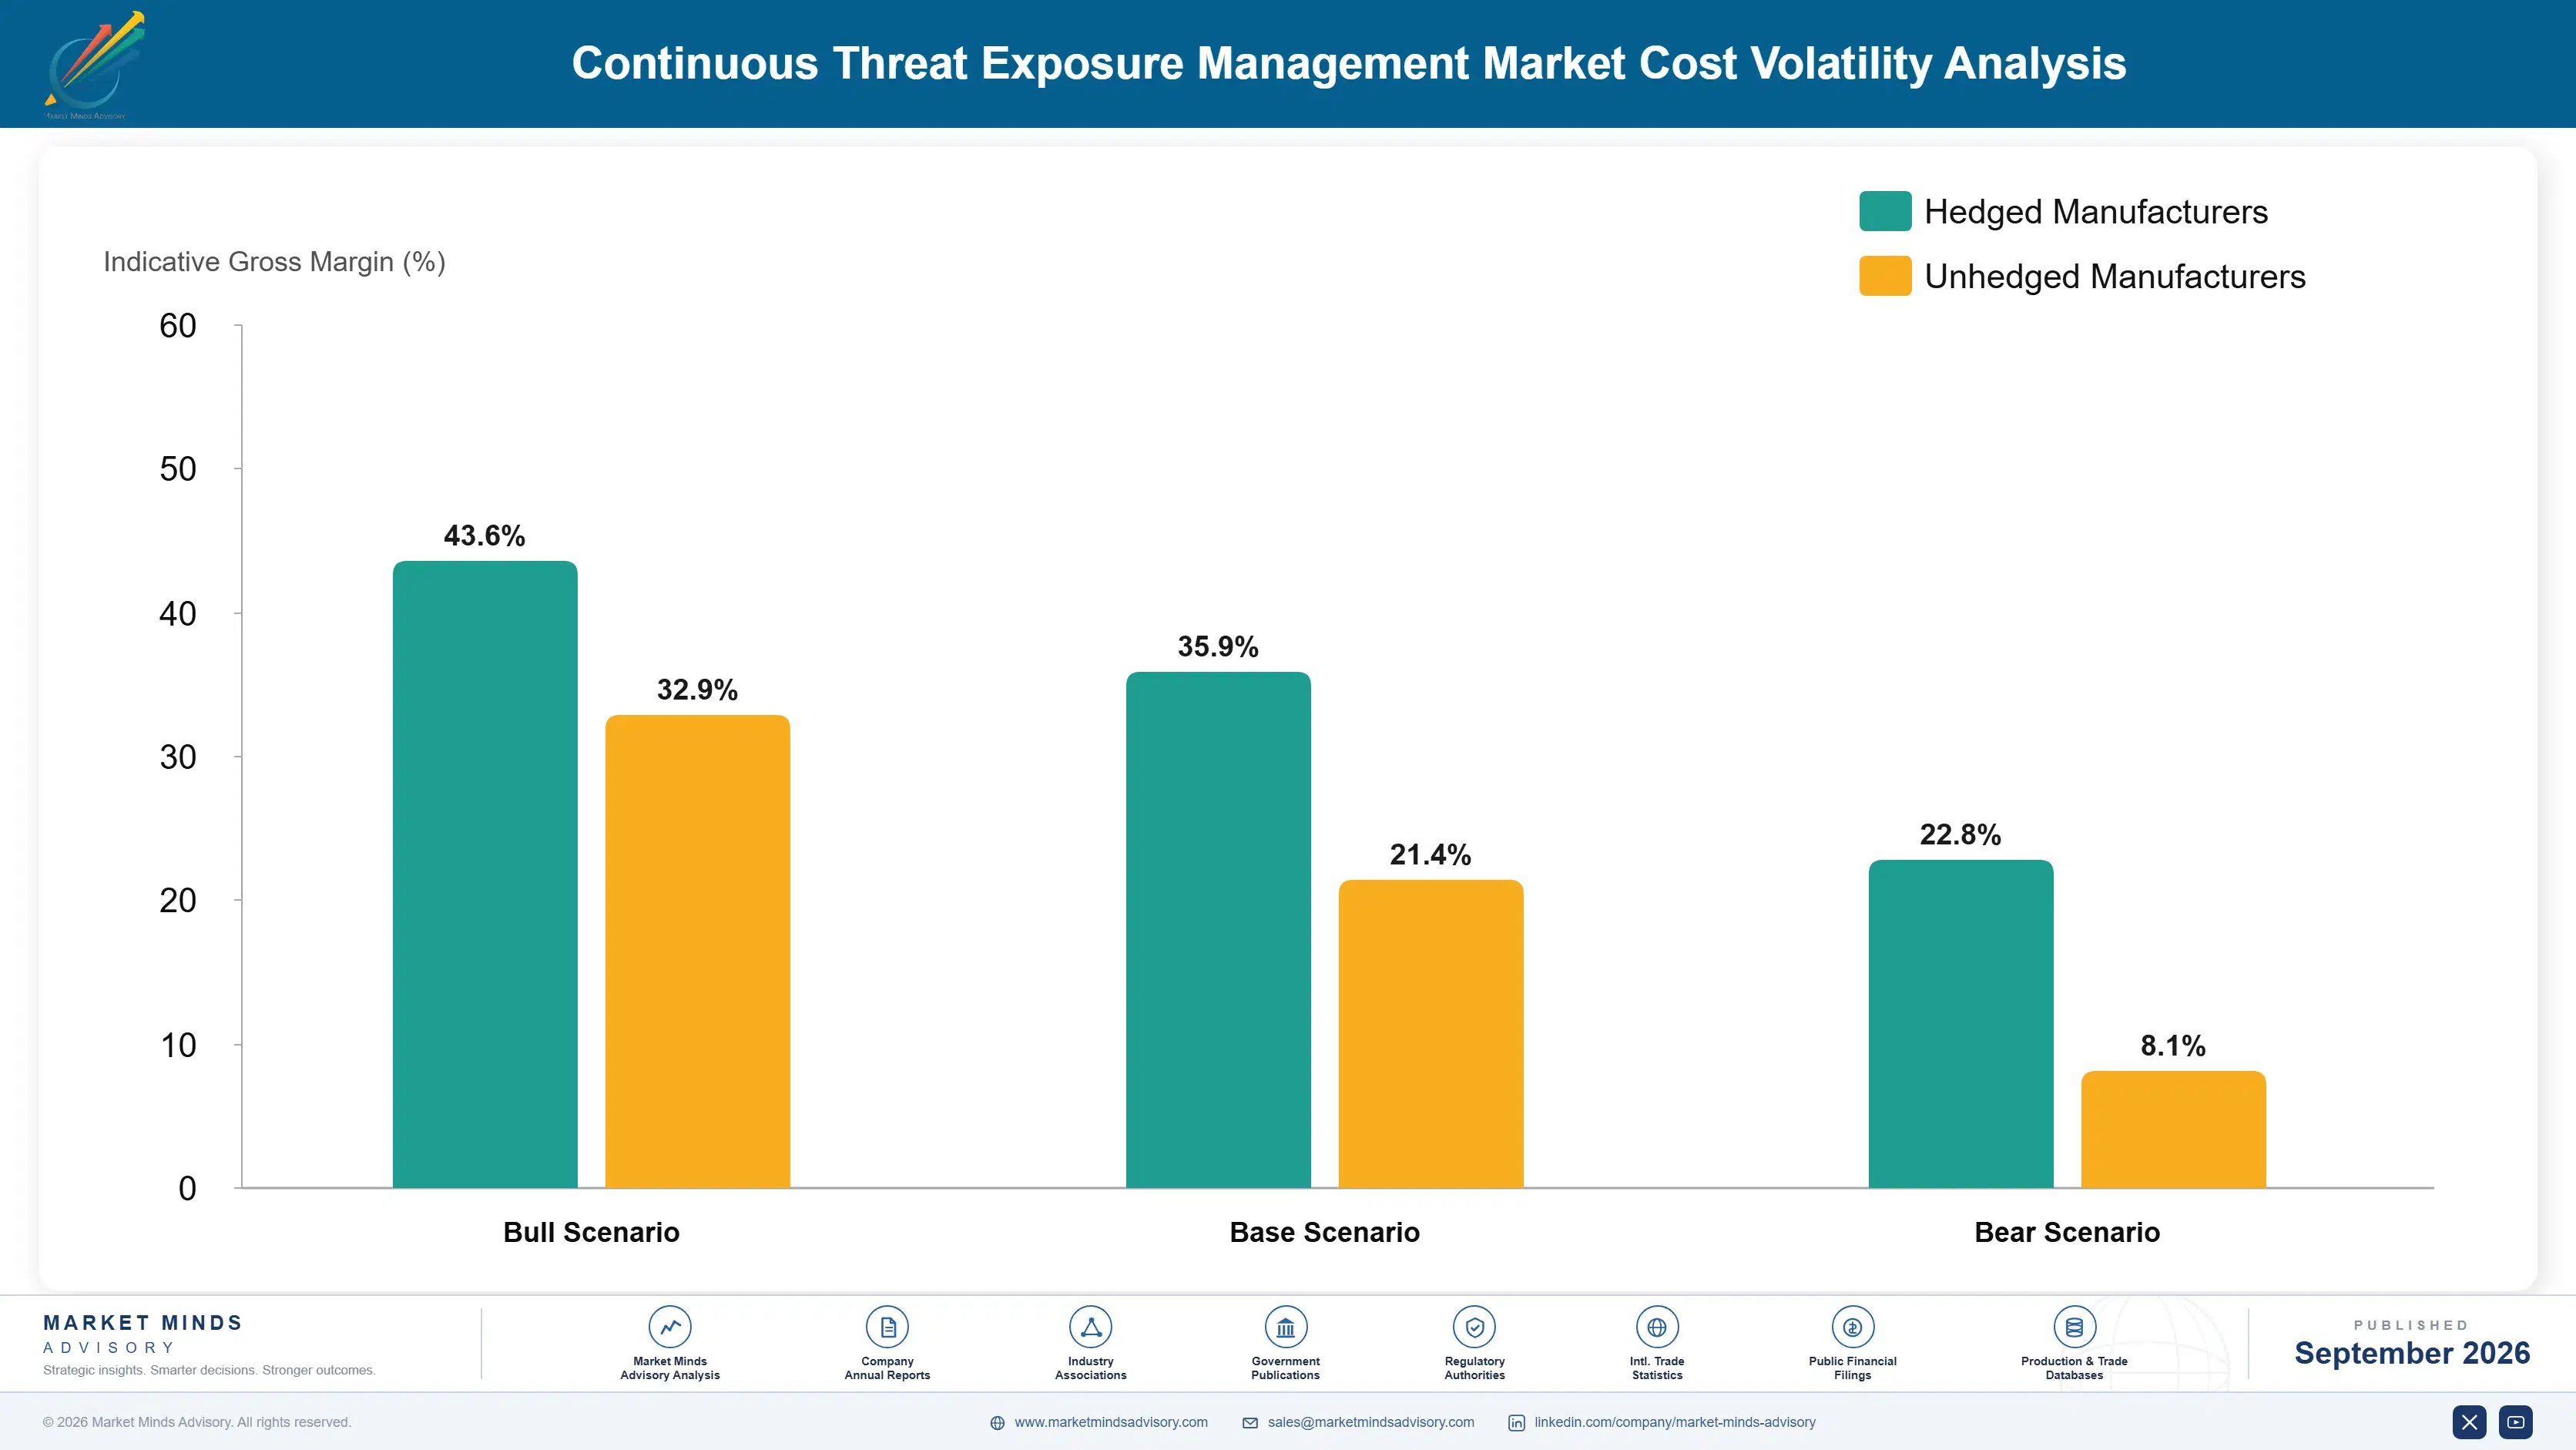
Cloud Infrastructure and Talent Cost Exposure

Cloud infrastructure and simulation compute costs account for roughly 25 to 32 percent of a typical exposure management vendor's cost of goods sold, sourced primarily from major hyperscale cloud providers running large-scale attack path simulation workloads. Offensive security engineering talent costs add a further 35 to 42 percent, reflecting the specialized nature of red-team-grade product development.
A 2023 cloud pricing restructuring by a major hyperscale provider, documented in that provider's own investor disclosures, increased hosting costs for several exposure management vendors running compute-intensive simulation workloads. Tenable's 2023 annual report cited rising cloud infrastructure cost as a factor in its pricing strategy review, prompting several vendors across the category to optimize simulation workload efficiency. These optimizations became a recurring supply chain planning exercise across the broader exposure management category.

Smaller vendors face a genuine disadvantage here because they lack the negotiating position to secure favorable enterprise cloud pricing agreements that larger competitors with greater committed spend can access. Vendors based in regions with a smaller domestic offensive security talent pool face additional exposure, since they must compete globally for scarce red-team and simulation engineering expertise. This dynamic particularly affects vendors headquartered outside major offensive security talent hubs.
continuous-threat-exposure-management-market-cost-volatility-analysis-1788418988708

Multi-Cloud Simulation Cost Optimization

Vendors are increasingly distributing simulation workloads across multiple cloud providers to negotiate better pricing and avoid single-vendor lock-in, adding operational complexity but reducing exposure to any single provider's pricing decisions. Vendors serving large enterprise contracts increasingly treat this flexibility as a resilience requirement rather than an optional engineering choice made independently. reliably at scale.

Remote-First Offensive Security Hiring

Hiring offensive security and red-team engineers from lower-cost regions through fully remote arrangements reduces overall talent cost without sacrificing quality, a strategy several vendors have adopted to offset rising simulation infrastructure expense. This approach requires mature remote collaboration processes and management practices that not every organization has successfully built reliably at scale. reliably at scale.

Long-Term Committed Use Cloud Discounts

Locking in multi-year committed use discount agreements with cloud providers secures meaningfully lower unit pricing than on-demand rates, trading some flexibility for cost predictability that helps vendors plan margin more reliably. Vendors combine this with usage forecasting models to avoid over-committing spend beyond actual projected customer growth trajectories each year. each budget cycle precisely.

Portfolio Architecture for Margin Defence

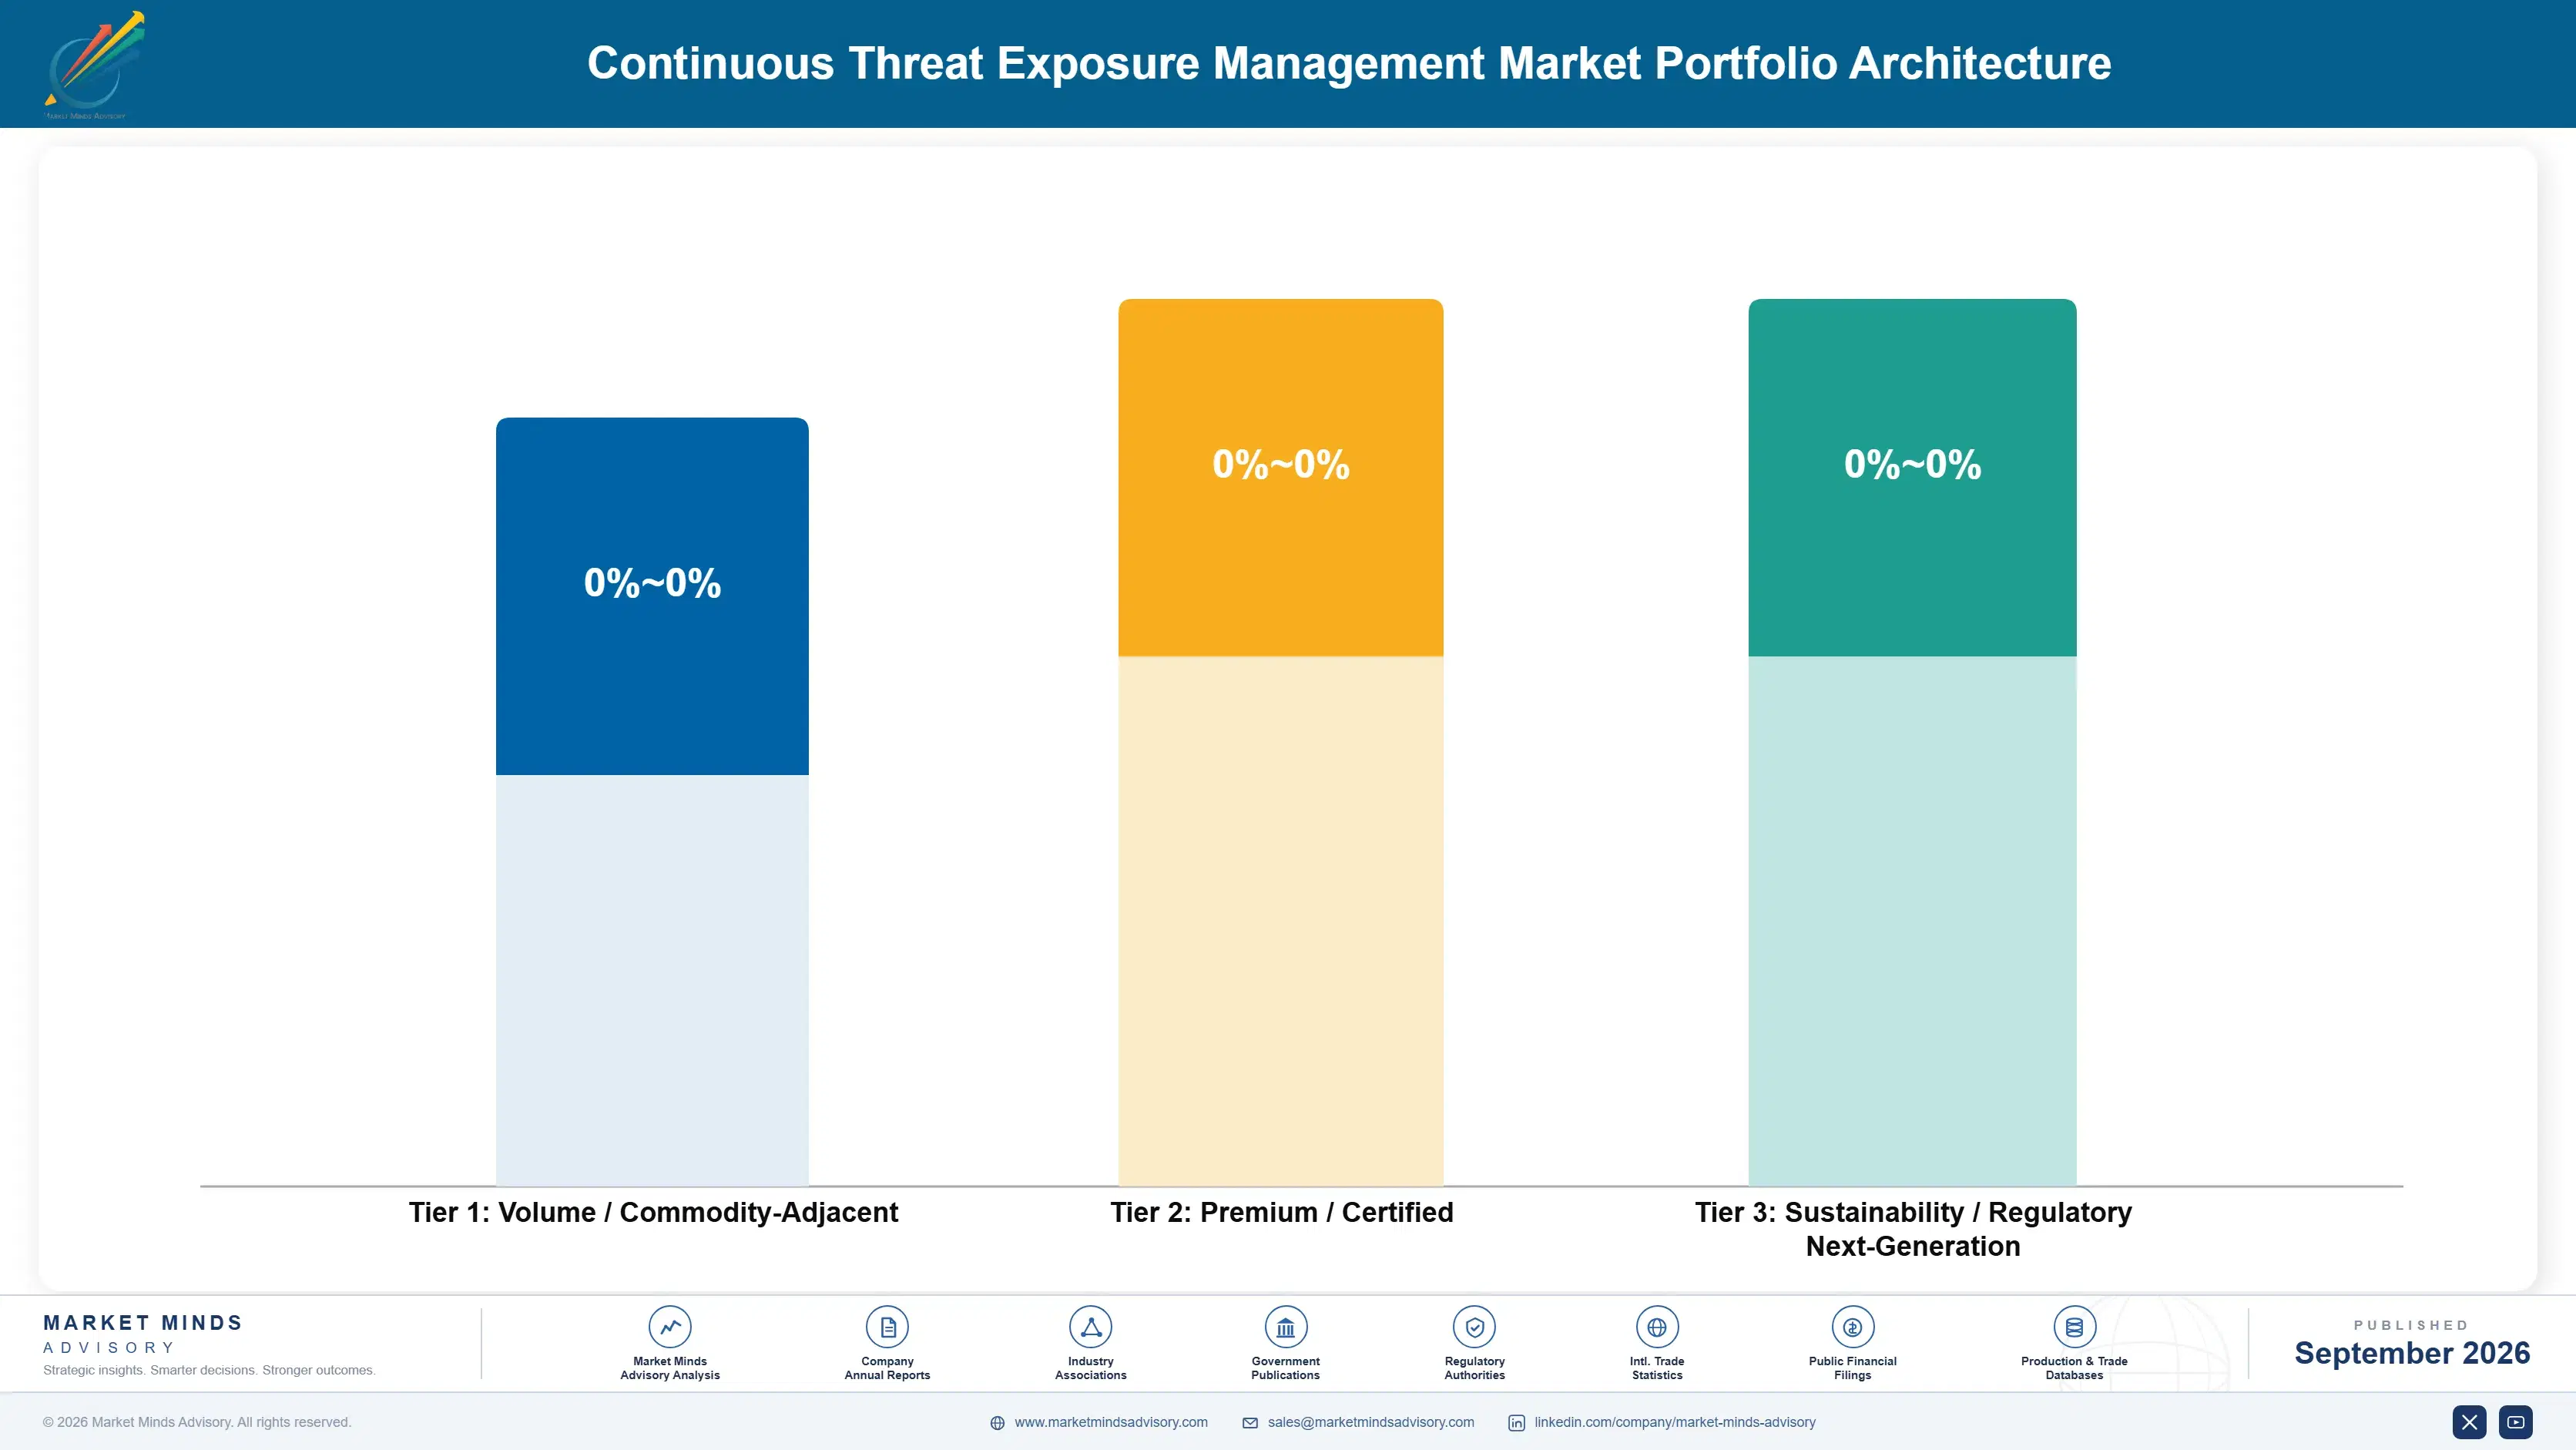
Exposure management vendors operate across a widening tier structure as basic scanning commoditizes and higher-margin remediation and certification services concentrate pricing power elsewhere in the stack. Volume-tier scanning now carries gross margins compressed by increasing competition, while premium validation platforms retain meaningfully stronger pricing. Portfolio strategy increasingly determines profitability more than raw seat count growth across the vendor landscape.
The tension between chasing seat count and defending premium validation positioning defines strategic choice across the industry. Vendors competing purely on scanning price find margin eroding faster than their cost base can adjust, while vendors segmenting customers by remediation and certification service uptake are protecting margin even as basic scanning fees compress across the broader market. This divergence is reshaping how vendors allocate engineering and sales investment across their enterprise customer base.

High-value margin pools concentrate in managed remediation, insurance certification, and custom attack simulation sold as standalone offerings rather than bundled features. These pools grow faster than core licensing revenue because they scale with expertise a vendor already owns rather than requiring incremental seat sales, making them the most defensible source of margin expansion available today. Vendors without such a plan risk the commodity tier over time.

Volume / Commodity-Adjacent

Basic periodic vulnerability scanning sold to price-sensitive small organizations where per-seat pricing is the primary purchase driver and switching cost remains modest. Organizations in this tier churn readily toward whichever vendor offers the lowest visible per-seat price.
Gross Margin: 10 to 16%

Premium / Certified

Continuous validation platforms bundled with cyber insurance certification and dedicated account management for large enterprises that value compliance assurance over marginal cost savings. These enterprises typically sign multi-year contracts, reducing acquisition cost per dollar of recurring revenue.
Gross Margin: 24 to 34%

Sustainability / Regulatory / Next-Generation

Custom attack simulation, managed remediation services, and board-level risk benchmarking built to meet emerging regulatory and insurance mandates ahead of competitors, commanding premium pricing while scarce. Vendors here often price on a subscription basis tied to service scope rather than pure seat count.
Gross Margin: 28 to 40%
continuous-threat-exposure-management-market-portfolio-architecture-1788418989204

High-value Sub-segments and Strategic Watch-out

Managed Remediation Service Programs

High-value, high-growth pool as enterprises pay premium pricing for completed remediation rather than raw findings, rewarding vendors who build effective service delivery earliest with durable multi-year contracts locked in ahead of rivals. Vendors absent from this capability risk losing the largest enterprise contracts entirely to faster-moving specialists.

Cyber Insurance Certification Services

High-value, moderate-growth pool constrained by the limited number of specialists with genuine underwriting expertise, but delivering strong margin once a vendor has built a credible certification practice and reputation. Expansion here depends heavily on how quickly a vendor can build a credible underwriting reputation in a competitive field.

Traditional Periodic Vulnerability Scanning

Volume core segment carrying the bulk of installed seats but facing steady margin compression as continuous validation platforms and commoditized pricing erode differentiation across most basic offerings. Consolidation among smaller scanning-only vendors is likely as scale becomes the primary way to defend margin. over time.

Custom Attack Simulation for Regulated Sectors

Strategic watch-out segment where shifting regulatory mandates and industry-specific threat models could rapidly change the competitive map, rewarding vendors with flexible simulation infrastructure already established. A sudden shift in regulatory mandates in any single major industry could reroute meaningful demand quickly. quite suddenly and abruptly.

Recurring Revenue Across the Security Stack

Vendor revenue behaves like an annuity once a security team integrates continuous validation into daily remediation workflows, since switching vendors requires re-mapping infrastructure discovery and retraining analysts, a cost most teams avoid unless service quality deteriorates. This stickiness means vendors earn recurring revenue across every infrastructure asset for years after deployment, with almost no incremental sales cost.
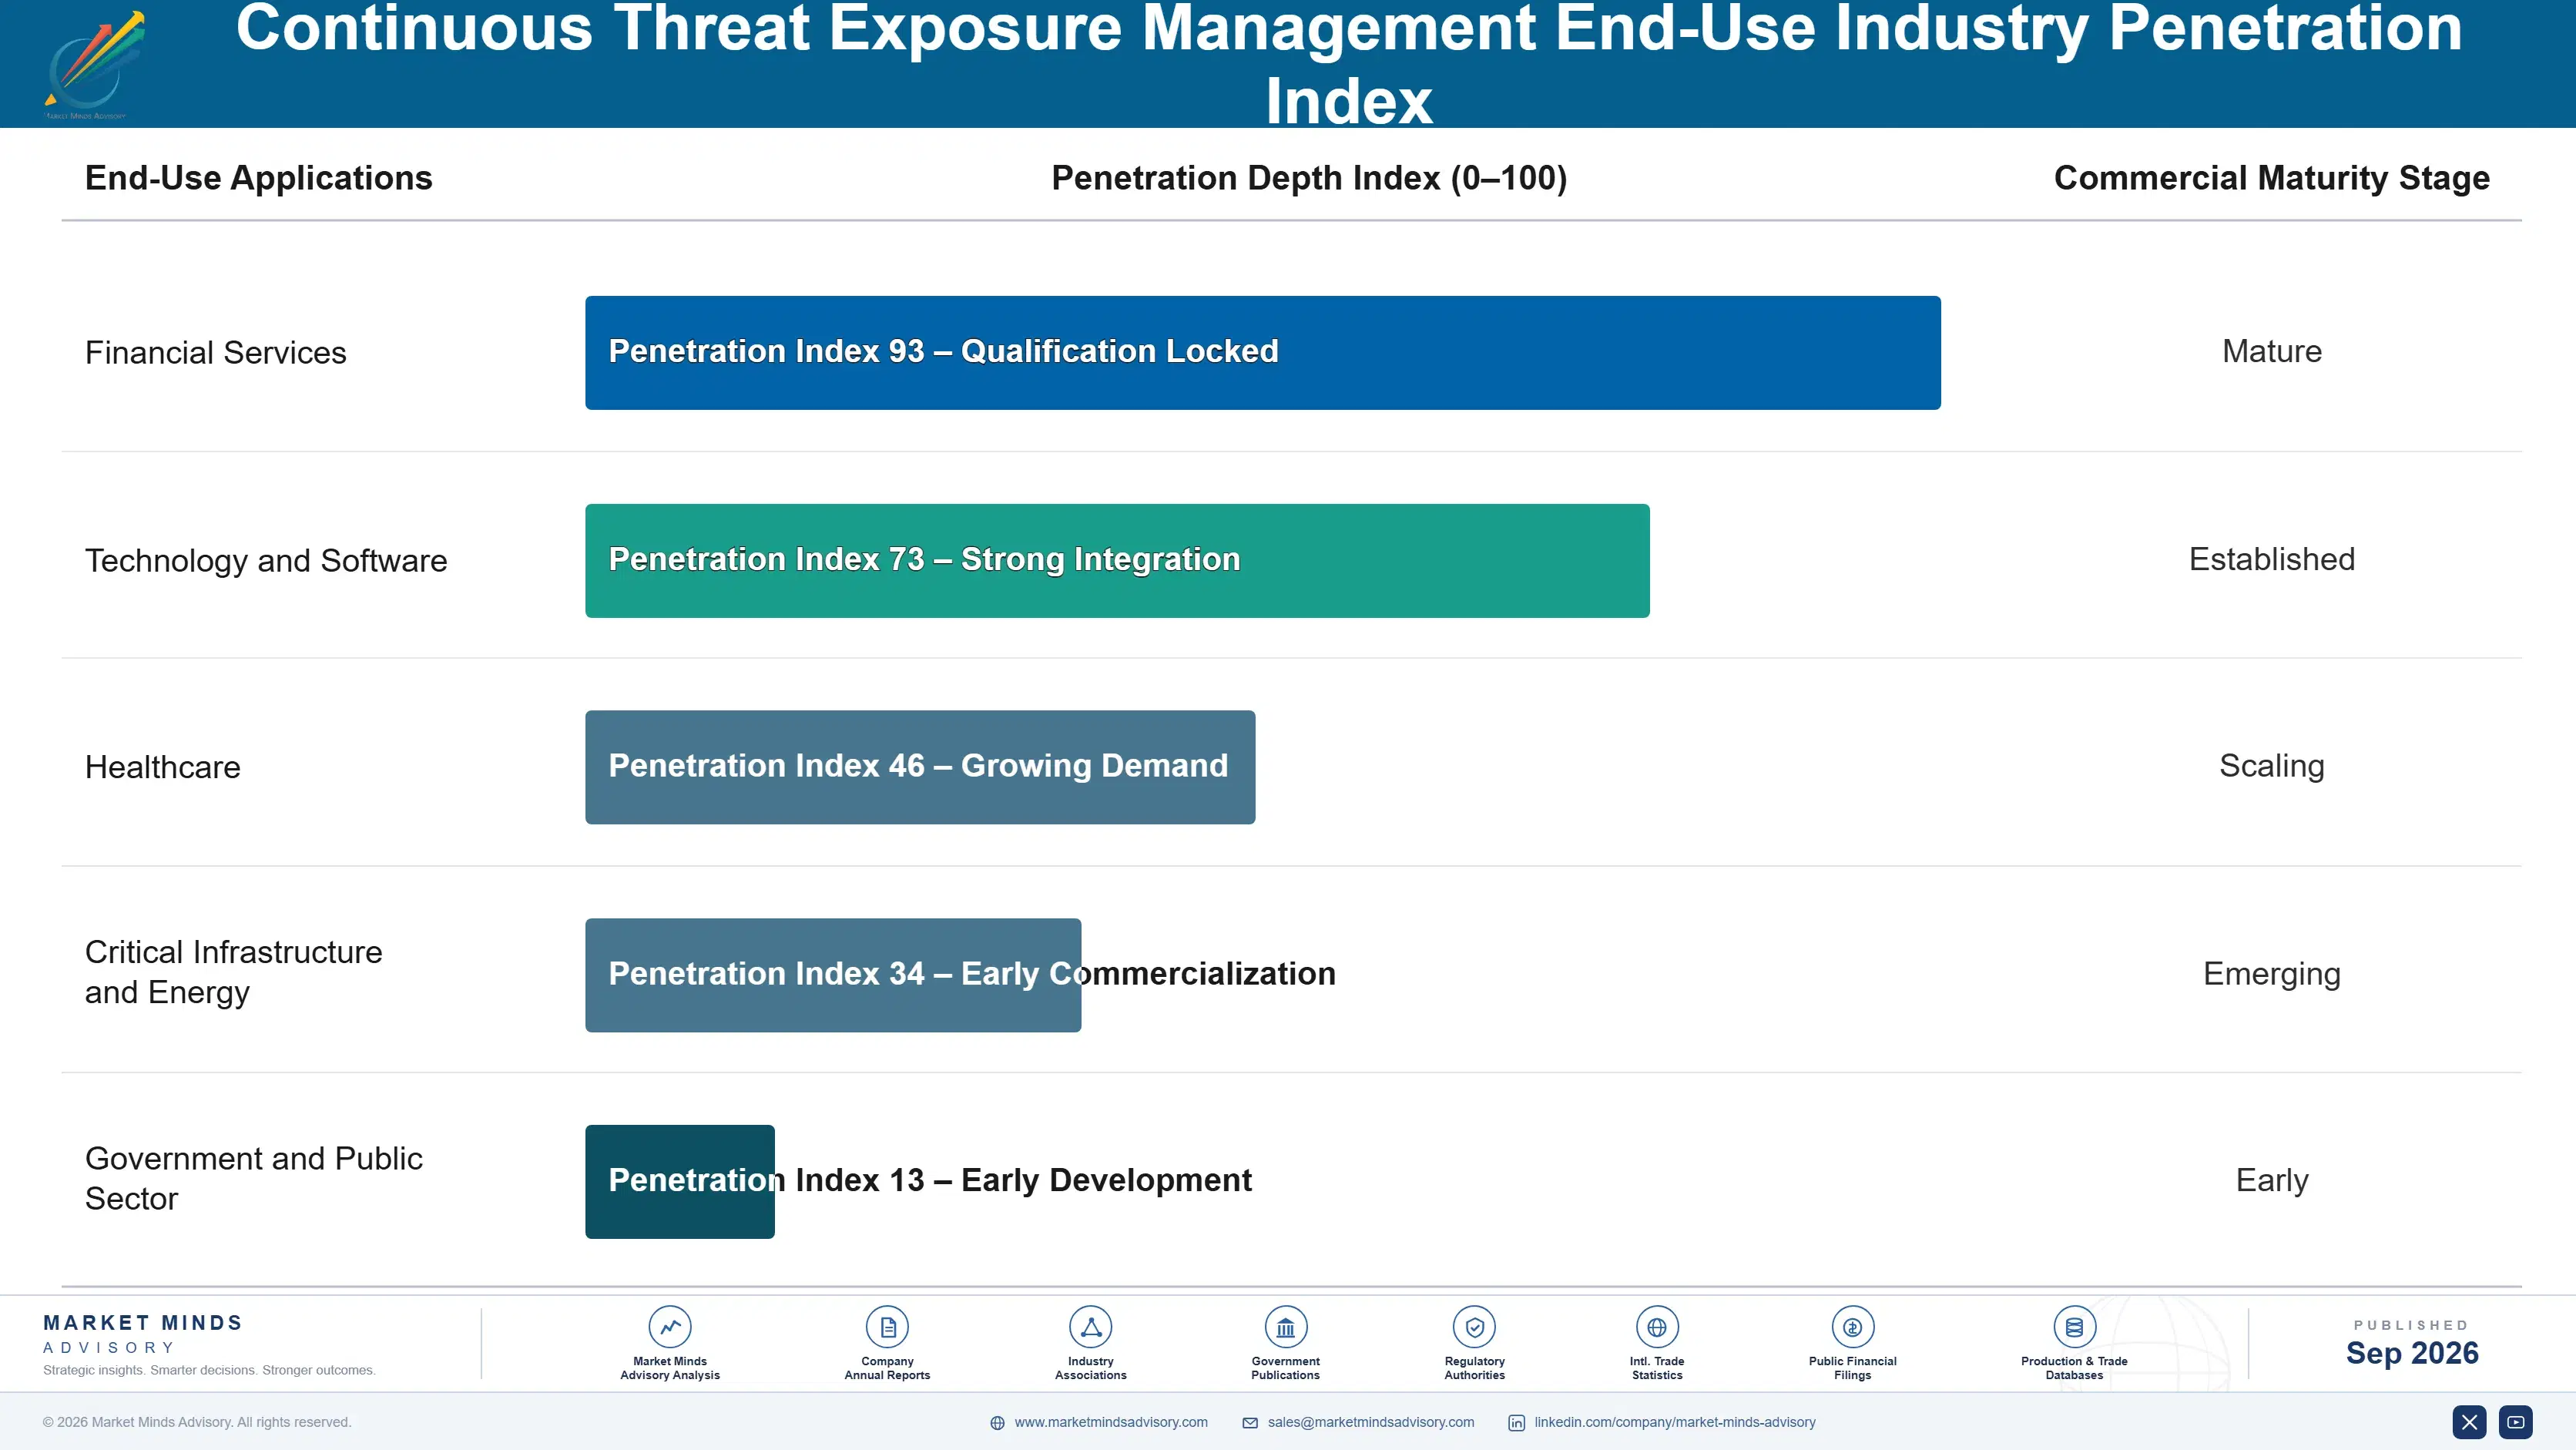
Adoption depth varies sharply by end-use vertical. Financial services and critical infrastructure operators adopt continuous validation quickly since regulatory exposure and cyber insurance requirements directly affect compliance risk, while general commercial enterprises integrate more slowly due to cost sensitivity that can stretch adoption timelines past several years. Government agencies sit at a different pace entirely, since adoption depends heavily on procurement cycles and mandate timelines rather than pure commercial demand.

Buyer profiles are shifting generationally as newer security leaders, trained on data-driven risk quantification rather than pure compliance checklists, replace an older generation focused primarily on meeting minimum scanning requirements. Younger security leaders expect exposure data to integrate directly with broader security operations platforms from day one, treating a standalone scanning tool as an outdated concept. This turnover is accelerating adoption of integrated, continuously validated security programs faster than pricing alone would predict.
continuous-threat-exposure-management-market-end-use-penetration-index-1788418989709

Where MMA Sees the Real Bets

These are among the four positions where our research anticipates prominent divergence between winners and laggards over the coming forecast period. Each is grounded in the demand model, the regulatory perimeter, and the announced capacity pipeline.
01 / ATTACK SIMULATION PRIORITY

Build genuine attack path simulation before differentiation narrows

Vendors offering only static vulnerability lists are already losing meaningful contracts to rivals whose platforms validate genuine exploitability through real attack simulation. This gap widens every quarter a vendor delays investment, since enterprise buyers increasingly treat validated exploitability as a baseline procurement requirement rather than a premium feature reserved for the largest deals. MMA views simulation depth as the clearest predictor of which vendors defend premium pricing over the next several years, more so than raw scan coverage breadth alone.
02 / REMEDIATION SERVICE BUILD

Package managed remediation as a standard bundled offering

Enterprises very increasingly need genuinely completed remediation rather than yet another dashboard of open findings, and vendors with validated attack path data are best positioned to deliver this as a paid service. Vendors clearly without this capability are ceding real margin to rivals who can demonstrate measurable exposure reduction directly across live production deployments already running today. MMA firmly expects the remediation-service gap to widen further still as more enterprises gain experience comparing vendor outcomes rather than raw feature lists alone.
03 / INSURANCE CERTIFICATION POSITIONING

Build cyber insurance certification capability ahead of underwriter demand

Insurance underwriters are increasingly writing strict continuous validation requirements directly into policy terms, creating a genuinely quite large near-term revenue opportunity for whichever vendor commits early to providing this credible certification service well. Vendors that build genuinely auditor-grade assessment methodology now can charge a meaningful premium before the capability becomes commoditized across the broader market entirely. MMA very strongly and clearly advises treating this as a standing product priority rather than a reactive feature bolted on once underwriters already require it.
04 / TALENT GAP POSITIONING

Offer managed services to address the security talent shortage directly

The cybersecurity talent shortage limits how much real value enterprises can extract from validation platforms alone, creating a genuinely large opportunity for vendors who can supply the missing execution capacity directly and reliably. Vendors building managed service capability now are positioning well ahead of the broader industry shift toward outcome-based rather than purely tool-based security spending models. MMA very firmly regards this positioning as a meaningfully lower risk than waiting for the talent shortage to resolve entirely on its own.

Engagement Snapshot From the Field

A live engagement with an industry participant carrying material or product regulatory and market exposure ahead of a defining policy shift, showing how our research translates into a defensible multi-year portfolio strategy.
MARKET MINDS ADVISORY · CLIENT ENGAGEMENT SUMMARY
Continuous Threat Exposure Management Producer Strategic Portfolio Review and Transition Roadmap 2026·Investment Scenario on Continuous Threat Exposure Management Exposure Evaluation 2025-26
CLIENT PROFILE
The client is a regional financial institution managing cloud and on-premises infrastructure across roughly 15,000 tracked assets, facing a cyber insurance renewal that newly required demonstrated continuous exposure validation. Its existing security program relied on quarterly vulnerability scans with no attack path simulation or exploitability validation capability. The institution had never previously deployed any continuous attack path validation technology at scale.
STRATEGIC CHALLENGE
The institution faced a compressed insurance renewal deadline that would result in significantly higher premiums or coverage denial without demonstrated continuous validation capability. Leadership needed a deployable exposure management platform within one quarter, without disrupting ongoing security operations during implementation. Board risk committee approval required demonstrating a clear implementation timeline before the deadline.
MMA APPROACH
MMA conducted an infrastructure discovery assessment alongside interviews with the institution's security and risk management leadership, then benchmarked three exposure management vendors against deployment speed and insurance certification support. The engagement produced a phased deployment plan prioritizing the highest-risk infrastructure segments first, sequenced to demonstrate compliance before the renewal deadline.
KEY FINDINGS
  1. Roughly 8 percent of tracked assets showed exploitable attack paths that quarterly scanning had never previously flagged. across the entire tracked infrastructure overall.
  2. A cloud-native deployment approach could complete initial coverage within four weeks, faster than a full on-premises alternative. entirely across the whole network.
  3. Two of three vendors evaluated already offered certification documentation formats accepted by the institution's insurance underwriter. directly without requiring any format changes.
  4. Security staff required minimal additional training since the platform integrated directly with their existing ticketing workflow. smoothly and without any significant disruption.
CLIENT PROFILE
The client is a regional financial institution managing cloud and on-premises infrastructure across roughly 15,000 tracked assets, facing a cyber insurance renewal that newly required demonstrated continuous exposure validation. Its existing security program relied on quarterly vulnerability scans with no attack path simulation or exploitability validation capability. The institution had never previously deployed any continuous attack path validation technology at scale.
STRATEGIC CHALLENGE
The institution faced a compressed insurance renewal deadline that would result in significantly higher premiums or coverage denial without demonstrated continuous validation capability. Leadership needed a deployable exposure management platform within one quarter, without disrupting ongoing security operations during implementation. Board risk committee approval required demonstrating a clear implementation timeline before the deadline.
MMA APPROACH
MMA conducted an infrastructure discovery assessment alongside interviews with the institution's security and risk management leadership, then benchmarked three exposure management vendors against deployment speed and insurance certification support. The engagement produced a phased deployment plan prioritizing the highest-risk infrastructure segments first, sequenced to demonstrate compliance before the renewal deadline.
KEY FINDINGS
  1. Roughly 8 percent of tracked assets showed exploitable attack paths that quarterly scanning had never previously flagged. across the entire tracked infrastructure overall.
  2. A cloud-native deployment approach could complete initial coverage within four weeks, faster than a full on-premises alternative. entirely across the whole network.
  3. Two of three vendors evaluated already offered certification documentation formats accepted by the institution's insurance underwriter. directly without requiring any format changes.
  4. Security staff required minimal additional training since the platform integrated directly with their existing ticketing workflow. smoothly and without any significant disruption.
RECOMMENDED STRATEGY
Phase 1: Phase 1 (Weeks 1-4): deploy validation coverage across the highest-risk infrastructure segments identified in the assessment. immediately upon project kickoff. Phase 2: Phase 2 (Weeks 5-8): extend coverage to the remaining infrastructure and complete initial remediation of critical findings. thoroughly and systematically. Phase 3: Phase 3 (Weeks 9-10): compile certification documentation and submit it ahead of the insurance renewal deadline. promptly and quite formally.
OUTCOME
The institution completed priority infrastructure coverage within nine weeks, ahead of the ten-week target (client-reported, unverified by MMA). The institution secured insurance renewal at standard premium rates citing the new validation capability (client-reported, unverified by MMA). The institution has since expanded validation coverage to two additional business units (client-reported, unverified by MMA).

Frequently Asked Questions

Foundational context covering the market sizes, CAGR, scope, country, region and competition that inform every finding below. This section is provided to cover basics and most often pre-purchase conversations, answered from the MMA Primary Research Dataset.

What is the current size of the Continuous Threat Exposure Management Market?

The Continuous Threat Exposure Management Market reached 1.9 billion dollars in 2025, the report's base year for all forecast calculations. This figure covers attack path discovery, validation, and prioritization software globally.

How large will the Continuous Threat Exposure Management Market be by 2036?

The market is projected to reach 16.95 billion dollars by 2036, roughly 7.31 times its 2026 starting value. That growth reflects cyber insurance mandates and expanding cloud infrastructure exposure.

What is the CAGR for the Continuous Threat Exposure Management Market 2026 to 2036?

The market is forecast to grow at a 22.0 percent compound annual rate between 2026 and 2036. Bull and bear scenarios range from 23.3 percent to 20.7 percent respectively.

Which segment is growing fastest?

Automated attack path validation platforms lead growth at 28.0 percent CAGR, roughly 1.27 times the overall market rate. Board demand for quantified breach risk metrics is driving this expansion.

Who are the major companies in the Continuous Threat Exposure Management Market?

Tenable, Rapid7, Qualys, XM Cyber, and Cymulate lead the market on a platform revenue basis. Together these five vendors hold roughly 34 percent combined share.

Which country is growing fastest?

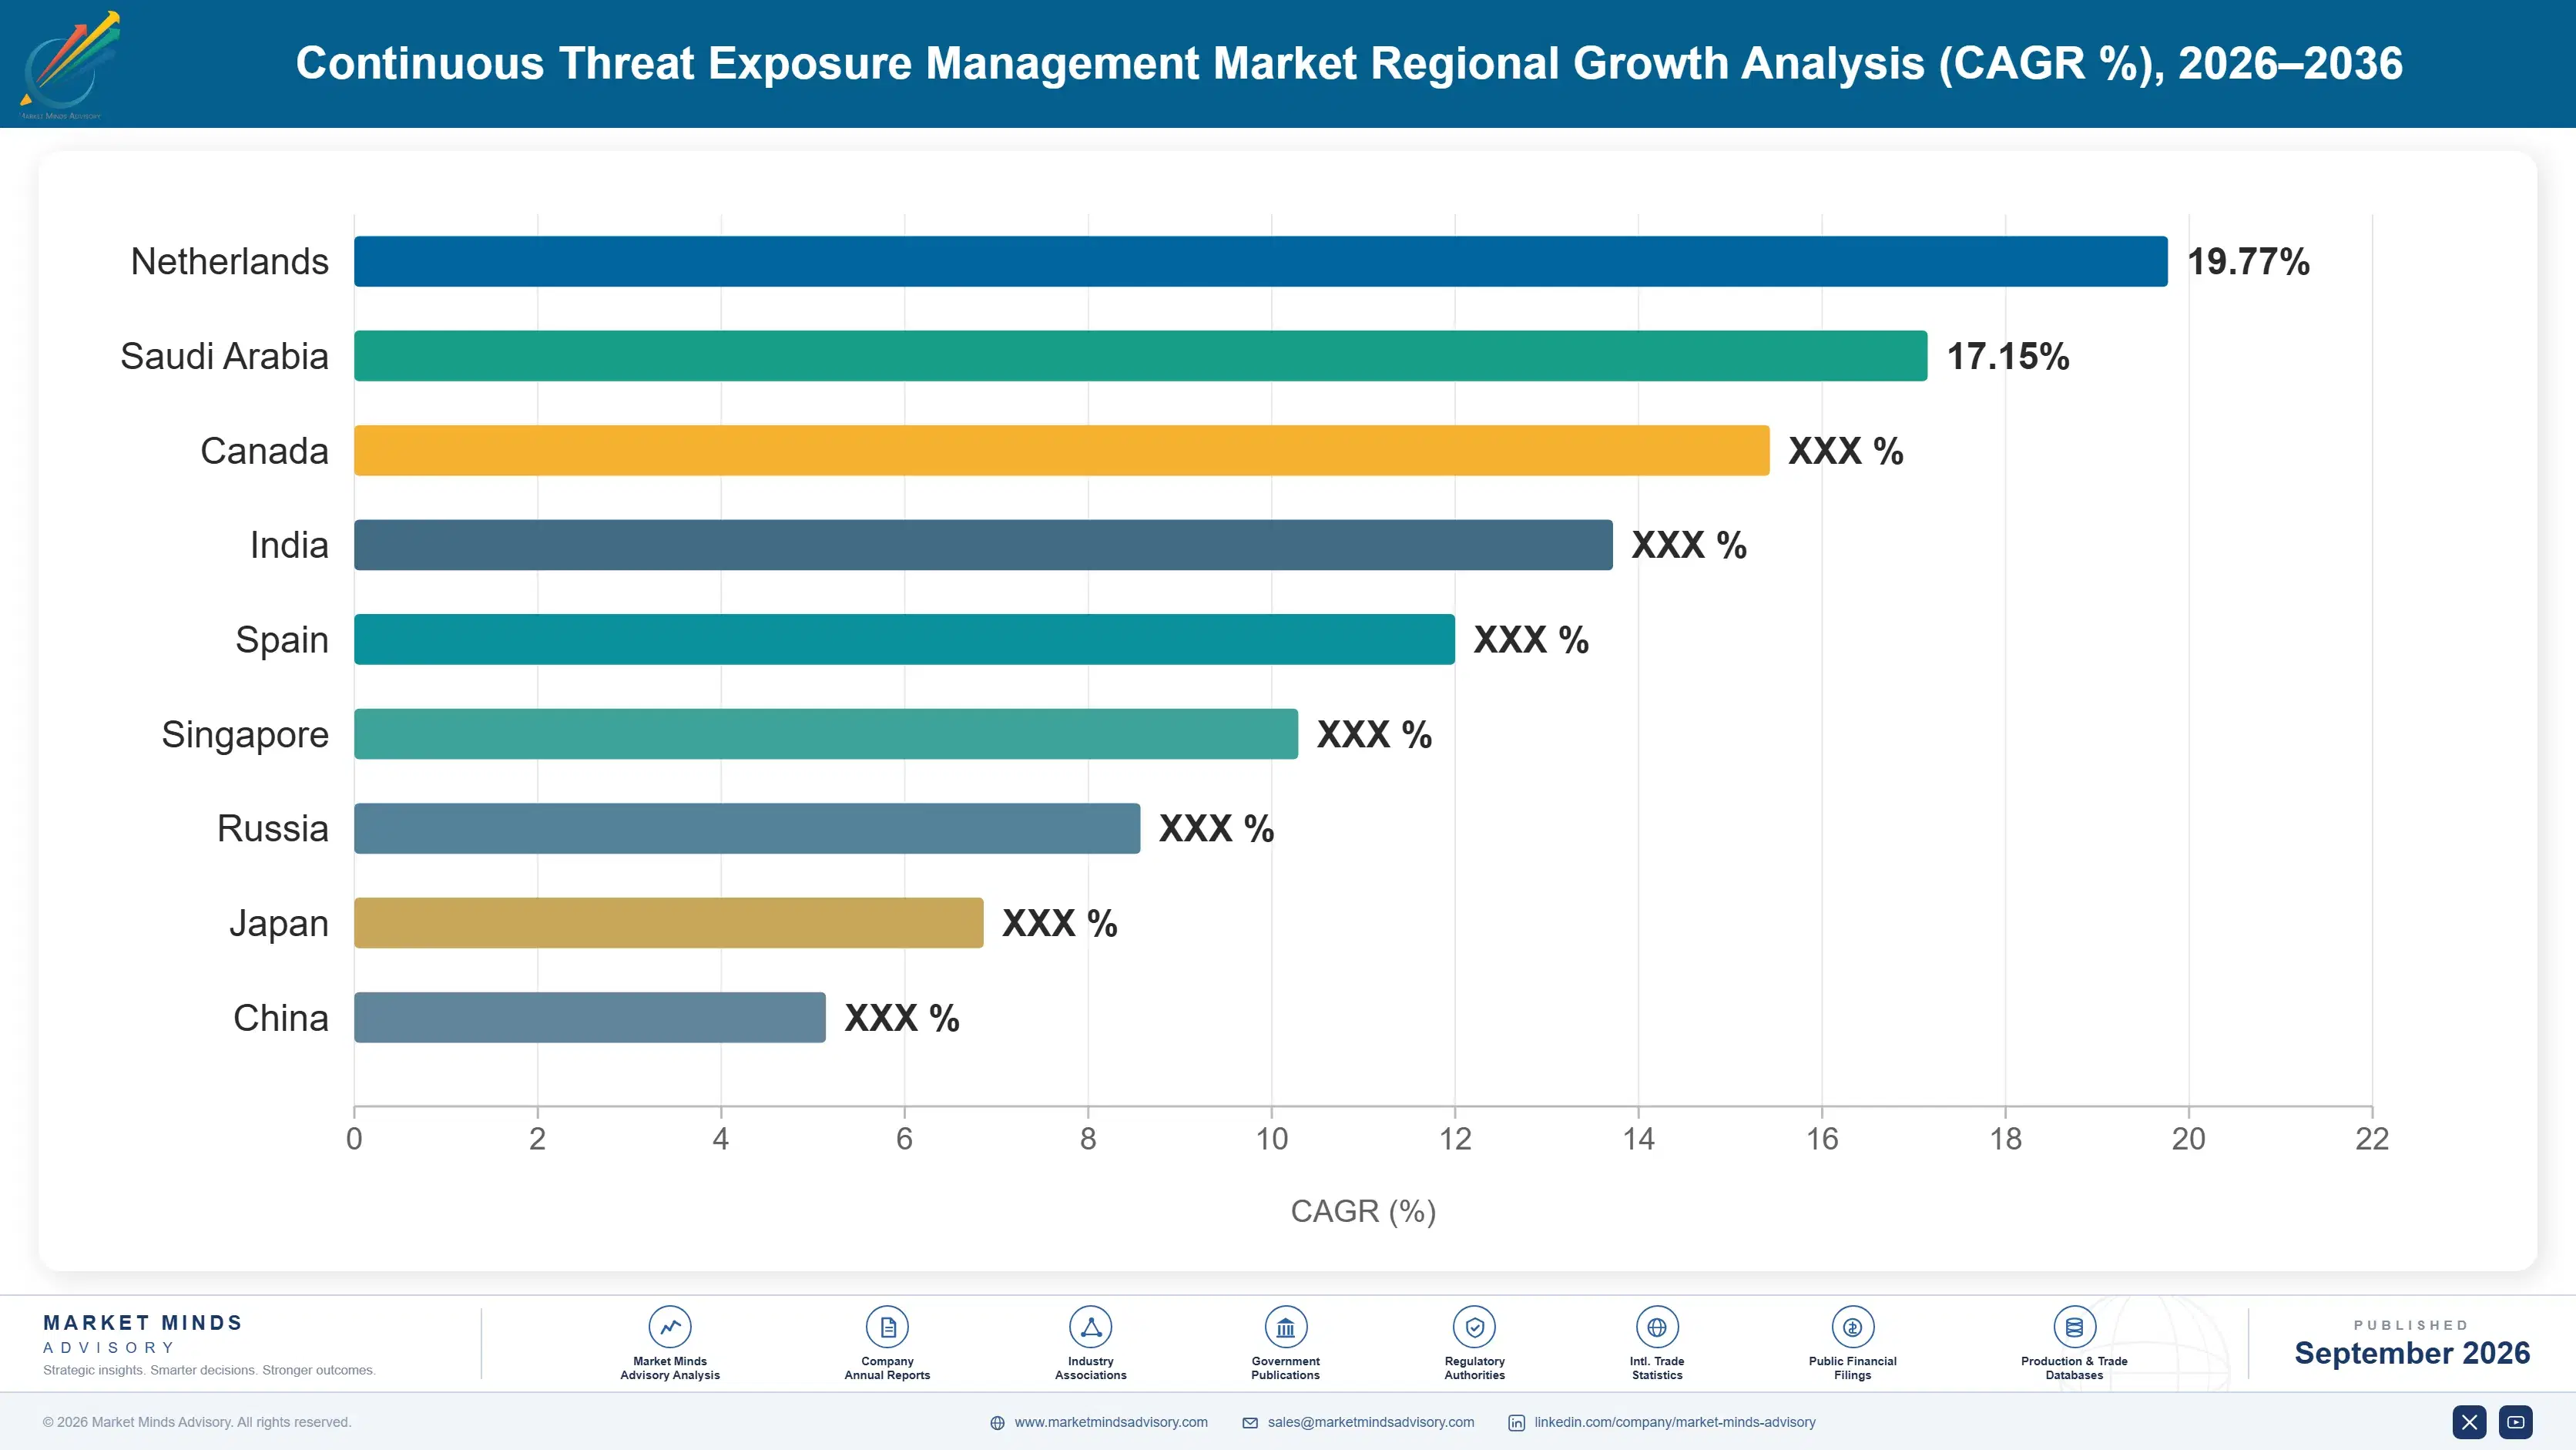
India leads country-level growth at 28.5 percent CAGR, driven by its rapidly scaling technology sector and expanding cloud infrastructure footprint. Domestic companies are accelerating platform adoption significantly.

Report Segmentation Architecture

The full report scope spans multiple orthogonal segmentation dimensions, with cross-tabulated demand data provided for each dimension pair. Coverage extends further to regional breakdowns, trend trajectories, and the competitive detail needed to support segment-level decision-making.

By Primary Market Dimension

  • Automated Attack Path Validation Platforms
  • Traditional Periodic Vulnerability Scanning
  • Managed Remediation Services
  • Cyber Insurance Certification Tools
  • Board-Level Risk Reporting

By End-Use Industry

  • Financial Services
  • Technology and Software
  • Healthcare
  • Critical Infrastructure and Energy
  • Government and Public Sector

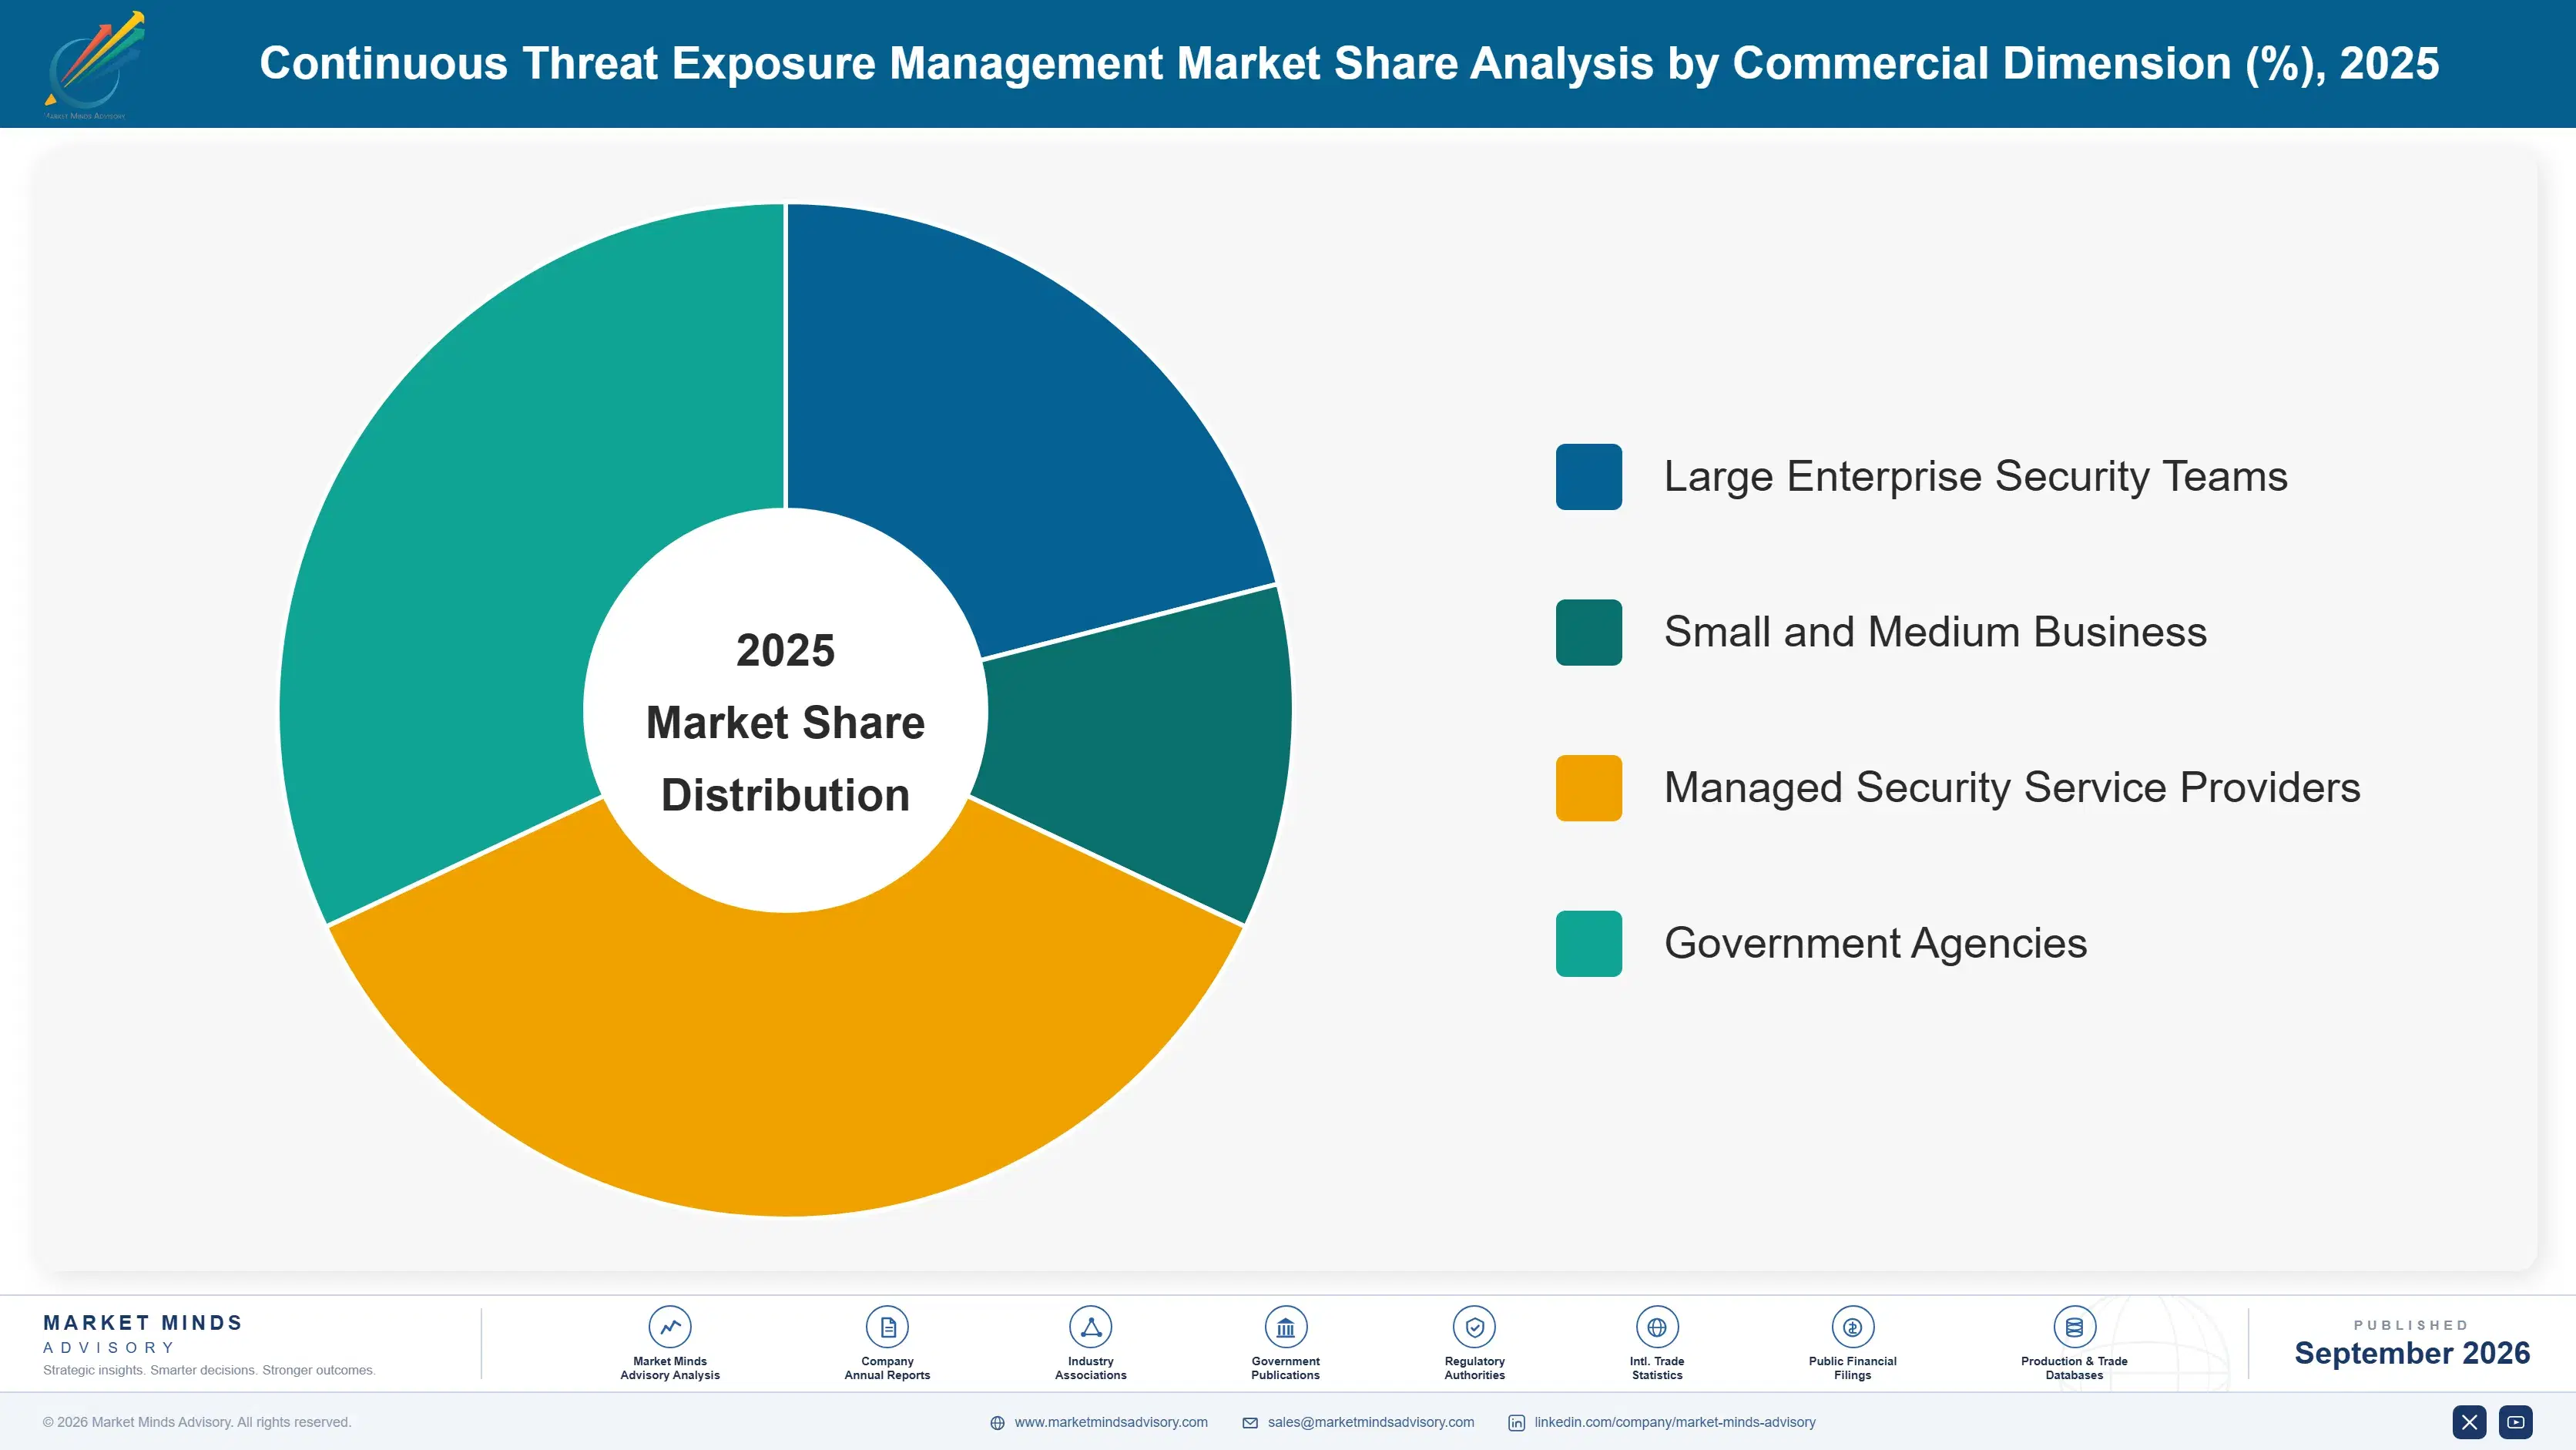
By Commercial Dimension

  • Large Enterprise Security Teams
  • Small and Medium Business
  • Managed Security Service Providers
  • Government Agencies

By Region

  • North America
  • Western Europe
  • East Asia
  • South Asia and Pacific
  • Latin America
  • Middle East and Africa
  • Eastern Europe

Scope, Methodology, and Coverage

Every figure in this report is reproducible from documented input assumptions. The scope below maps the historical period, the forecast horizon, the segmentation dimensions, and the countries covered, alongside the underlying primary and qualitative methodology.
Historical Period
2020 to 2025
Forecast Period
2026 to 2036
Base Year
2025 (USD billions; MMA Primary Research Dataset, September 2026)
Market Definition
This report covers software platforms that continuously discover, validate, and prioritize exploitable attack paths across an organization's digital infrastructure, measured on a global software revenue basis. It excludes traditional periodic vulnerability scanning tools without continuous validation capability and general security information and event management platforms not centered on exposure prioritization.
Quantitative Units
USD billions, global market size and forecast
Segmentation Dimensions
Product/technology type, end-use industry, commercial/customer dimension, region
Regions Covered
North America, Western Europe, East Asia, South Asia and Pacific, Latin America, Middle East and Africa, Eastern Europe
Countries Covered
United States, China, Germany, France, United Kingdom, Japan, South Korea, India, Canada, Brazil, Mexico, Indonesia, Vietnam, Thailand, Malaysia, United Arab Emirates, Saudi Arabia, South Africa, Nigeria, Turkey, Poland, Netherlands, Italy, Spain, Sweden, Switzerland, Argentina, Colombia, Australia, Singapore, and additional markets relevant to this sector
Key Companies Profiled
Tenable, Rapid7, Qualys, XM Cyber, Cymulate, CrowdStrike, Palo Alto Networks, Mandiant (Google), Pentera, Randori (IBM), SafeBreach, AttackIQ, NopSec, Vulcan Cyber, Balbix, Brinqa, Kenna Security (Cisco), Ivanti Neurons for RBVM, Skybox Security, FireCompass
Quantitative Methodology
Primary survey, n=3,800 respondents, Q4 2025, six countries; demand-side model with trade association cross-validation
Qualitative Methodology
47 expert interviews, Q4 2025; applied to validate demand model assumptions, identify emerging dynamics, and assess competitive positioning
Report Format
PDF and XLSX data workbook (Word format preview document)
Publisher
Market Minds Advisory
Report Code
MMA-2026-TEC-138
Published
September 2026
Contact
sales@marketmindsadvisory.com | www.marketmindsadvisory.com

Purchase the full Continuous Threat Exposure Management Market Report (2026 to 2036).

This report delivers a comprehensive analysis of the global Continuous Threat Exposure Management Market, covering market sizing, segmentation, and regional dynamics through 2036. It profiles the competitive landscape across twenty leading vendors, benchmarked on a consistent platform revenue basis. Regional analysis spans all seven major world regions, quantifying share and growth rate differences driven by regulatory, insurance, and technology adoption factors. The report also examines revenue diversification strategies, input cost exposure, and portfolio economics shaping vendor profitability. A dedicated case study illustrates practical implementation lessons for financial institutions pursuing validation deployments.
Ten-year market size and CAGR forecast through 2036
Five-segment MECE market breakdown with growth rates
Seven-region share and growth rate analysis
Twenty-company competitive benchmarking on platform revenue basis
Revenue diversification strategy analysis across four commercial levers
Anonymized client implementation case study with outcomes

Built For The People Who Decide

From boardroom strategy to bench-side execution, this report is read cover-to-cover by leaders shaping the next decade of their industry, turning demand scenarios, market dynamics and valuation benchmarks into decisions.
CXOs/ Presidents/ VPs/ Managers
M&A and Corporate Development
Strategy Teams and R&D Heads
Procurement and Product Directors
Regulatory and Compliance Leaders
Investor Relations and Equity Analysts