Market Minds Advisory
Containment and Handling Drilling Waste Management Market

Containment and Handling Drilling Waste Management Market: Containment and Handling Drilling Waste Management Market: The Truck Is The Cost

Hauling the cuttings costs more than containing them, which means the money in this business is made by not putting the waste on a truck at all in the first place.

Lead Analyst

Published

September 2026

Make Smarter Decisions with Customized Research Insights

Request a free sample report and evaluate market opportunities, growth trends, and competitive dynamics relevant to your business needs.

2025 MARKET VALUE$3.1BMarket Size 2025
2036 FORECAST VALUE$7.7BBase Case , 2026 to 2036
CAGR 2026 TO 20368.6 %Bull 9.8% / Bear 7.4%
INCREMENTAL OPPORTUNITY$4.3BNet 10- year value creation
EXPANSION MULTIPLE2.28x2036 value over 2026 base
Strategic Levers
M&A Pipeline
Regional Outlook
Country Rankings
Competitive Intelligence
Segmental Deep-dive
Call-Us : 91 93563 13602

Executive Snapshot and Market Trajectory.

Trucking is 54% of what drilling waste costs an operator, and the equipment that contains it is a fraction of that. So the commercially useful question is never which containment system performs best. It is how many cubic metres never reach a truck in the end.
Closed-loop containment systems grow at 12.9%, half again the market rate of 8.6%, because state groundwater rules across North America have made the earthen reserve pit illegal or impractical on most new wells, and 67% are now drilled without one. North America holds 33% of demand, above its usual band, on well count and on the strictest pit regulation anywhere. Offshore zero-discharge regimes run on entirely different economics, which almost nobody here models separately.
Concentration is low at 31% of wells serviced, because containment is regional service work performed by local crews with local disposal permits, and neither travels. The decisive capability is not equipment at all. It is holding disposal outlets close enough to the rig that the haul is short, and those permits take years to obtain. Whoever holds them effectively sets the price for everybody else drilling anywhere nearby.
Market Definition
The containment and handling drilling waste management market covers the equipment and services that capture, contain, transfer and store drill cuttings and spent drilling fluid at the wellsite, spanning cuttings boxes and skips, vacuum transfer and pneumatic conveyance systems, containment berms and rig matting liners, solids control and screening equipment, closed-loop containment systems, and slurry storage and holding tanks. Scope covers rental, service and outright equipment sale across onshore and offshore operations. Excluded are thermal and chemical treatment of recovered waste, landfill and injection disposal operations, drilling fluid supply, produced water handling, and site remediation services.
Base Year Value
$3.1B in 2025 (MMA Primary Research Dataset, August 2026)
Forecast Period
2026 to 2036, eleven discrete annual values
CAGR
8.6% base case. Bull 9.8%. Bear 7.4%.
Fastest Growth Segment
Closed-Loop Containment Systems: 12.9% CAGR
Fastest Growth Country
Australia: 10.8% CAGR
Fastest Growth Region
South Asia and Pacific: 10.8% CAGR
Largest Region
North America: 33% of 2025 global value
Market Leaders
SLB, Halliburton, Secure Energy Services, Baker Hughes and NOV. Source: MMA Analysis, July 2026.
Primary Survey
n=3,800 procurement and R&D decision-makers, Q4 2025, six countries
Methodology
Demand-side build-up, cross-validated against public data, 47 expert interviews

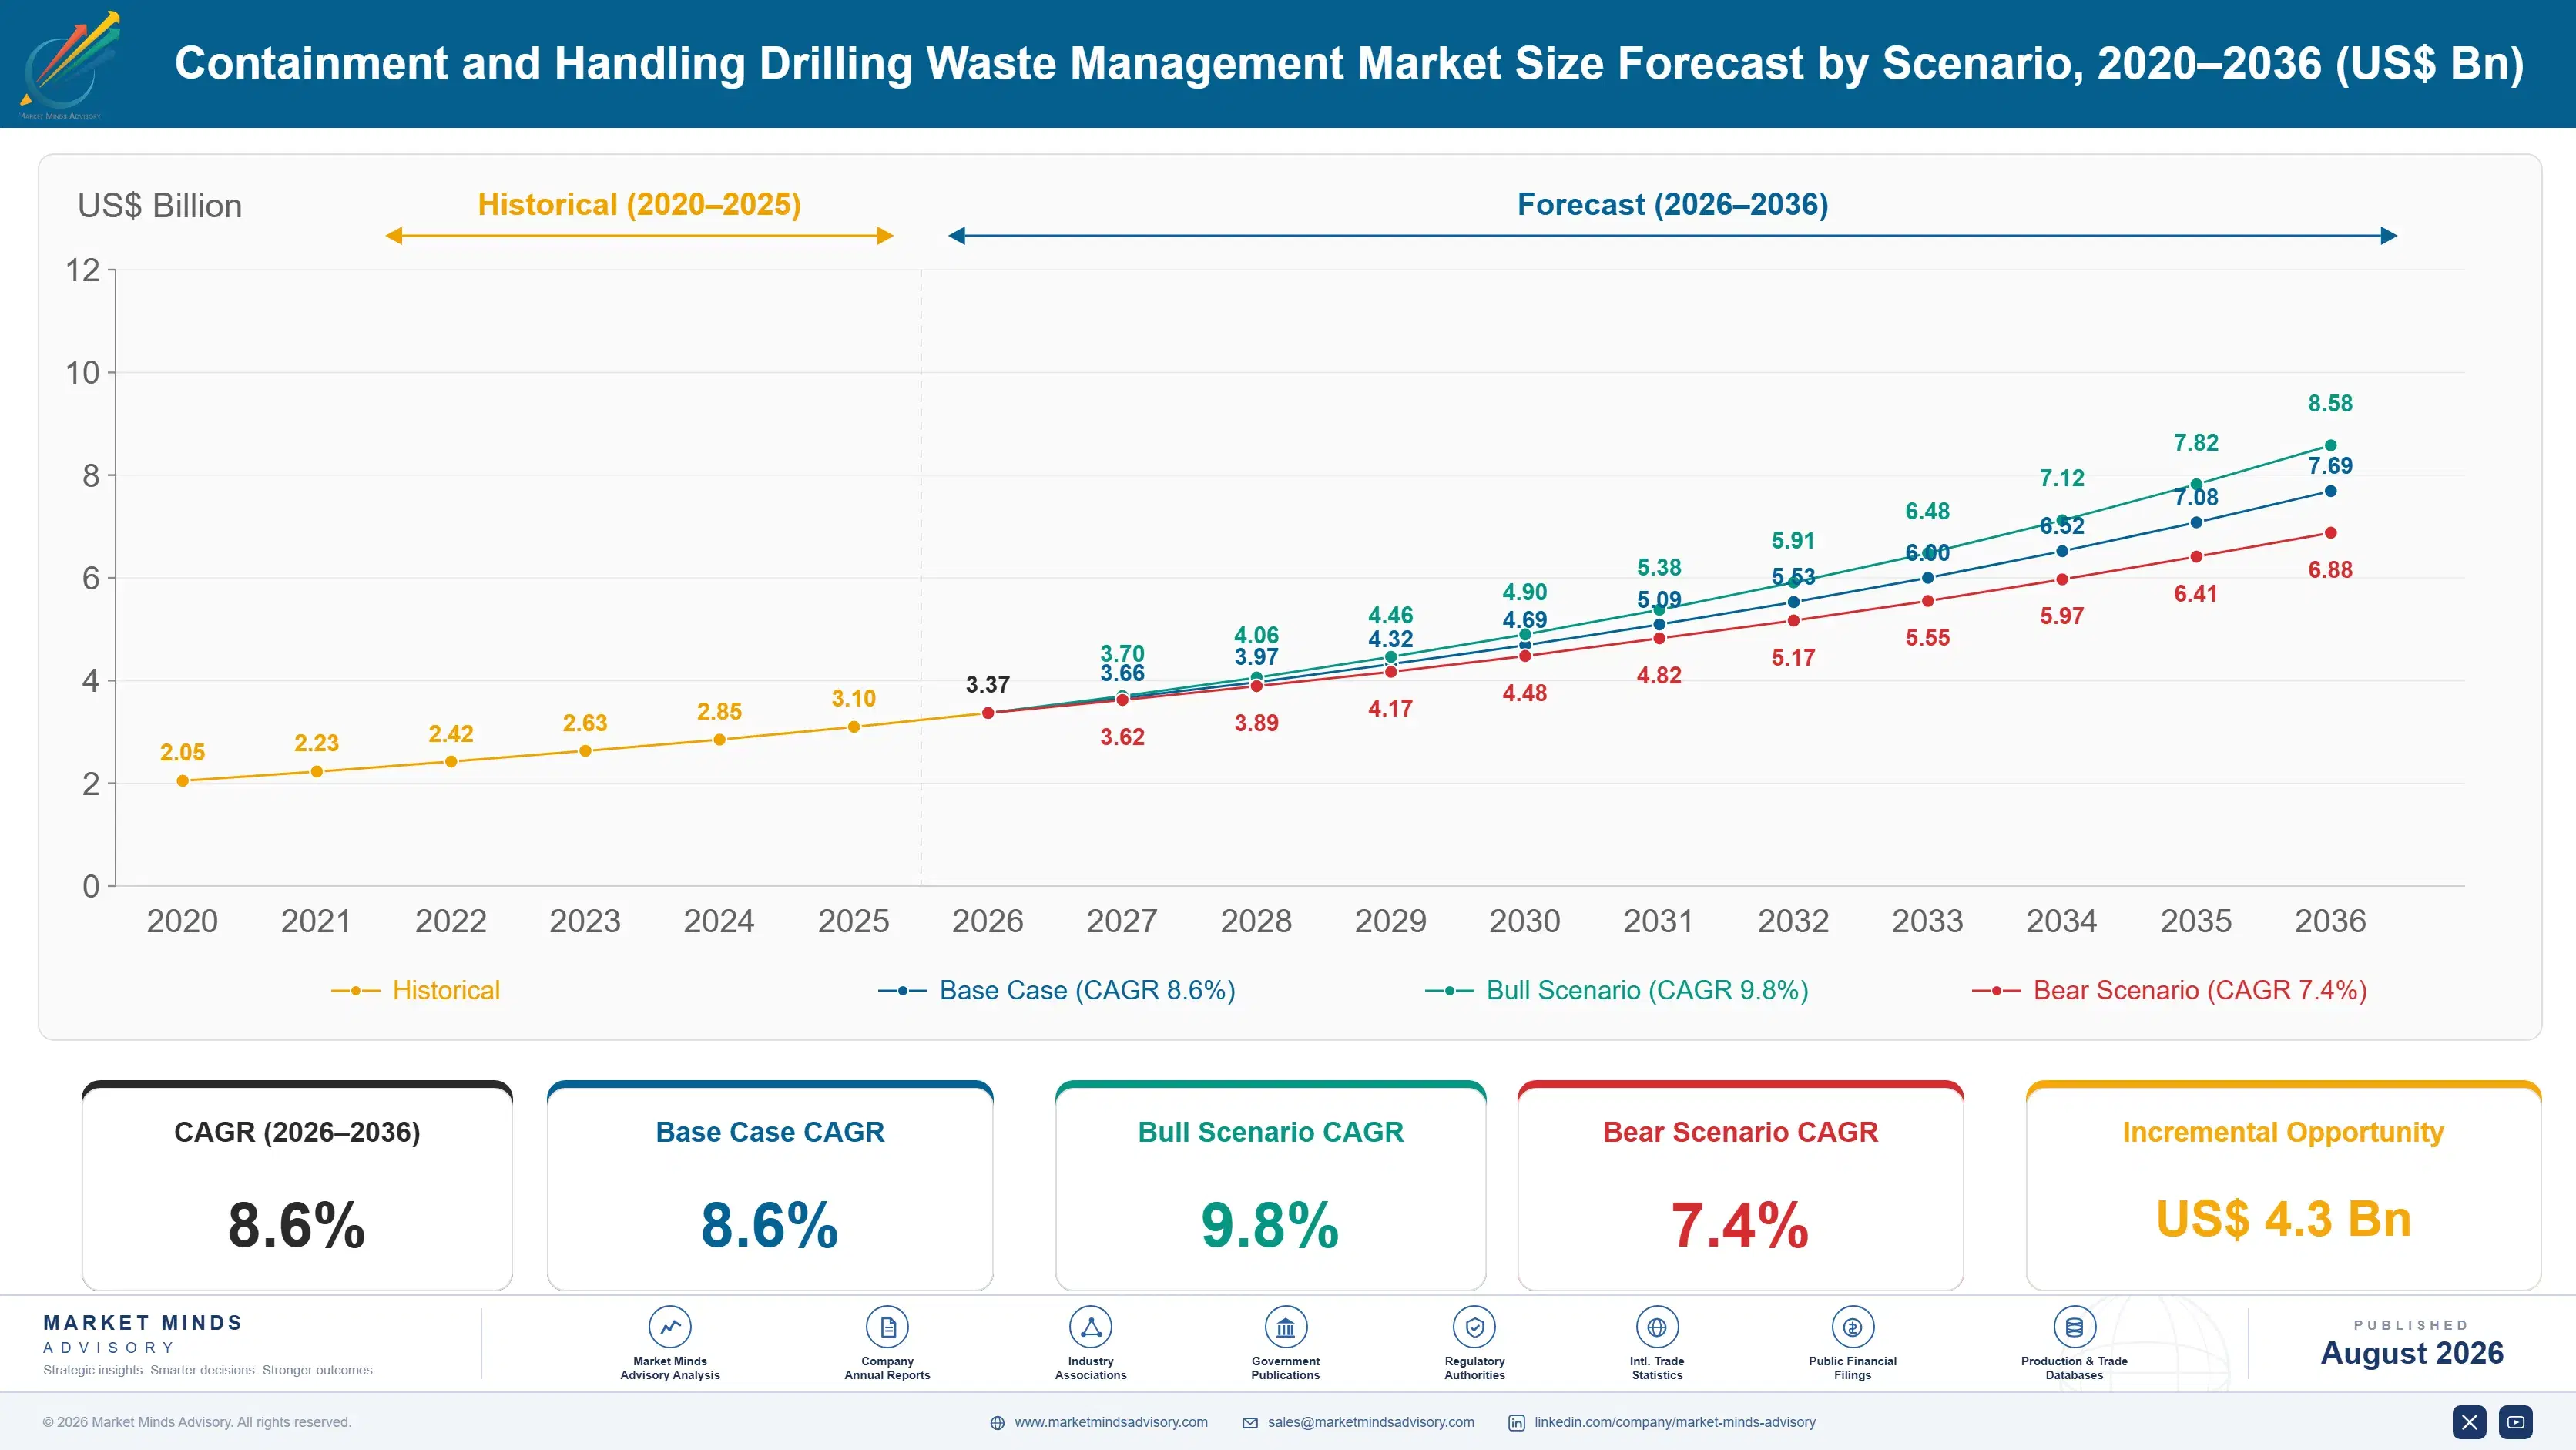
Containment and Handling Drilling Waste Management Market Forecast Scenarios

containment-and-handling-drilling-waste-management-size-forecast-scenario-1788193626790
Between 2020 and 2025 the sector compounded at 7.2% and the pattern followed rig count almost exactly, which is the whole problem with this business. The 2020 collapse emptied equipment yards within a quarter and the recovery refilled them at rates operators had never previously accepted. Service intensity per well rose steadily throughout as pit regulation tightened, which cushioned the fall but did not prevent it.
The 8.6% base case rests on three mechanisms. Groundwater protection rules across North American producing states keep removing the earthen reserve pit as an option, which converts a free disposal method into a purchased service on every affected well. Horizontal wells generate considerably more cuttings than the vertical wells the old methods were sized for. And offshore zero-discharge regimes keep expanding into new jurisdictions. None of the three requires drilling activity to increase.
The bull case at 9.8% turns on volume-reduction pricing becoming standard, which would reprice the whole service from an equipment day rate onto the far larger haulage saving. The bear case at 7.4% is rig count: this is a derived demand business and a sustained drilling downturn removes revenue within a single quarter, as everybody in it found out in 2020.

Cubic Metres That Never Move

The cost structure here is counterintuitive and most of the sector prices against the wrong half. Trucking consumes 54% of what an operator spends on drilling waste, because a horizontal well generates around 410 cubic metres of cuttings and every one travels by road to a permitted outlet. The containment equipment holding those cuttings costs a fraction of moving them. Yet nearly every contract is written on equipment day rates.
TOP FIVE CONCENTRATION31%Share of wells serviced held by five largest providers
HAULAGE COST SHARE54%Portion of total waste cost consumed by trucking
CUTTINGS VOLUME410 m3Median solids generated across a horizontal onshore well
VOLUME REDUCTION ACHIEVED38%Hauled volume avoided through dewatering and drying on site
CLOSED LOOP ADOPTION67%Portion of wells drilled without any earthen reserve pit
EQUIPMENT UTILISATION RATE71%Portion of fleet on a well earning a rate
Dewatering, cuttings drying and careful screening remove around 38% of hauled volume before anything leaves the pad, and that saving is worth several times the equipment rental it costs to achieve. A provider pricing on volume avoided rather than equipment supplied earns more and gives the operator a better outcome. Very few contracts are structured that way, and the operators who asked for it got it.
Regulation rather than technology drove the shift and the timeline is public. Groundwater rules across Colorado, Pennsylvania, New Mexico and the Canadian provinces restricted earthen reserve pits over fifteen years, and 67% of wells are now drilled without one. A free hole in the ground became a purchased containment service on every affected well, which is where most of this market came from.
"This industry sells tanks and berms and then watches the operator spend three times as much on trucks. The provider that walks in with a hauled-volume guarantee rather than an equipment quote is having a completely different conversation, and there are perhaps four of them doing it."
Director, Wellsite Environmental Services Practice · MMA Energy Practice · August 2026

Market Trends

Reserve pit bans converted free disposal into purchased service

Groundwater protection rules across Colorado, Pennsylvania, New Mexico and the Canadian provinces restricted or eliminated earthen reserve pits over roughly fifteen years, and 67% of wells are now drilled without one. That single regulatory shift turned a free hole beside the rig into a purchased containment and haulage service on every affected well, which is where most of this market's revenue actually originated. Closed-loop systems grow at 12.9% against a market rate of 8.6% as a direct consequence. The regulation is settled and the remaining jurisdictions without it are the growth map.
Market Impact: Avoids 38% of hauled volume
Horizontal wells generate far more solids per hole

A horizontal well produces around 410 cubic metres of cuttings against a fraction of that from the vertical wells the old containment methods were sized for, because the lateral section adds thousands of metres of hole to a single surface location. Longer laterals keep extending that figure. Containment equipment sized for a previous generation of wells is undersized on modern pads, which drives fleet replacement independent of any rig count movement. Providers still running legacy inventory find themselves double handling on every job, which costs more than the equipment ever saved.
Market Impact: Applies across 3 offshore regions

Market Opportunities and Growth Drivers

Haulage dominates cost and rewards volume reduction

Trucking consumes 54% of what an operator spends on drilling waste, since every cubic metre travels by road to a permitted outlet that may sit a considerable distance from the pad. Dewatering, cuttings drying and effective screening remove around 38% of that volume before anything leaves the location, at an equipment cost far below the haulage it avoids. A provider able to guarantee volume reduction is selling against the operator's largest cost line rather than its smallest. Almost nobody in this sector structures a contract that way, and the arithmetic is not difficult.
Market Impact: Fell within 1 quarter previously

Offshore zero-discharge rules keep reaching new jurisdictions

Zero-discharge requirements originating in Norway and the North Sea have extended to Brazilian, Caspian and increasingly West African operations, obliging operators to ship cuttings to shore rather than discharge them overboard. That converts a disposal question into a marine logistics problem where vessel deck space and skip handling on a moving platform set the constraint. Offshore containment earns far higher rates than onshore work and depends on entirely different capability. Providers treating both as one business consistently misprice the offshore side, usually downward. That mistake is worth several points of margin every year.
Market Impact: Takes 3 years to permit

Market Restraints and Challenges

Revenue tracks rig count with no lag at all

This is derived demand in its purest form: no well is drilled, no cuttings are generated, and no containment is rented, which meant revenue fell within a single quarter in 2020 and equipment yards filled while fixed costs continued. The root cause is that containment cannot be stockpiled, deferred or sold into any adjacent application, unlike almost every other oilfield product. Commercial impact is earnings volatility that makes the sector difficult to finance. Participants are responding with variable cost structures, rental rather than owned fleets, multi-basin diversification and term contracts covering minimum well counts.
Market Impact: Removes pits on 67% of wells

Disposal permits decide who can compete locally

A containment provider is only useful if the waste can go somewhere, and permitted disposal outlets take years to obtain and face community opposition that money does not resolve. The root cause is that nobody wants a drilling waste facility nearby regardless of how well it is engineered. Commercial impact is that a provider without a nearby outlet hauls further, costs more and loses on price in every basin where a competitor holds one. Mitigation runs through outlet partnerships, acquiring permitted sites, volume reduction to shorten effective haul distance and on-site treatment where regulation allows.
Market Impact: Generates 410 m3 per well
3 additional market trends, 4 additional growth drivers, and 2 additional restraints and challenges are covered in the full report. Contact sales@marketmindsadvisory.com to access the complete intelligence.

Segment CAGR and Growth Architecture

Segmentation follows equipment and service function, the dimension on which capital intensity, rental rate and regulatory exposure all move together. Boxes, berms and tanks carry the fleet volume at modest day rates. Closed-loop systems and vacuum transfer carry the growth, because both exist specifically to satisfy rules that removed the cheaper alternative. Regulation built this market.
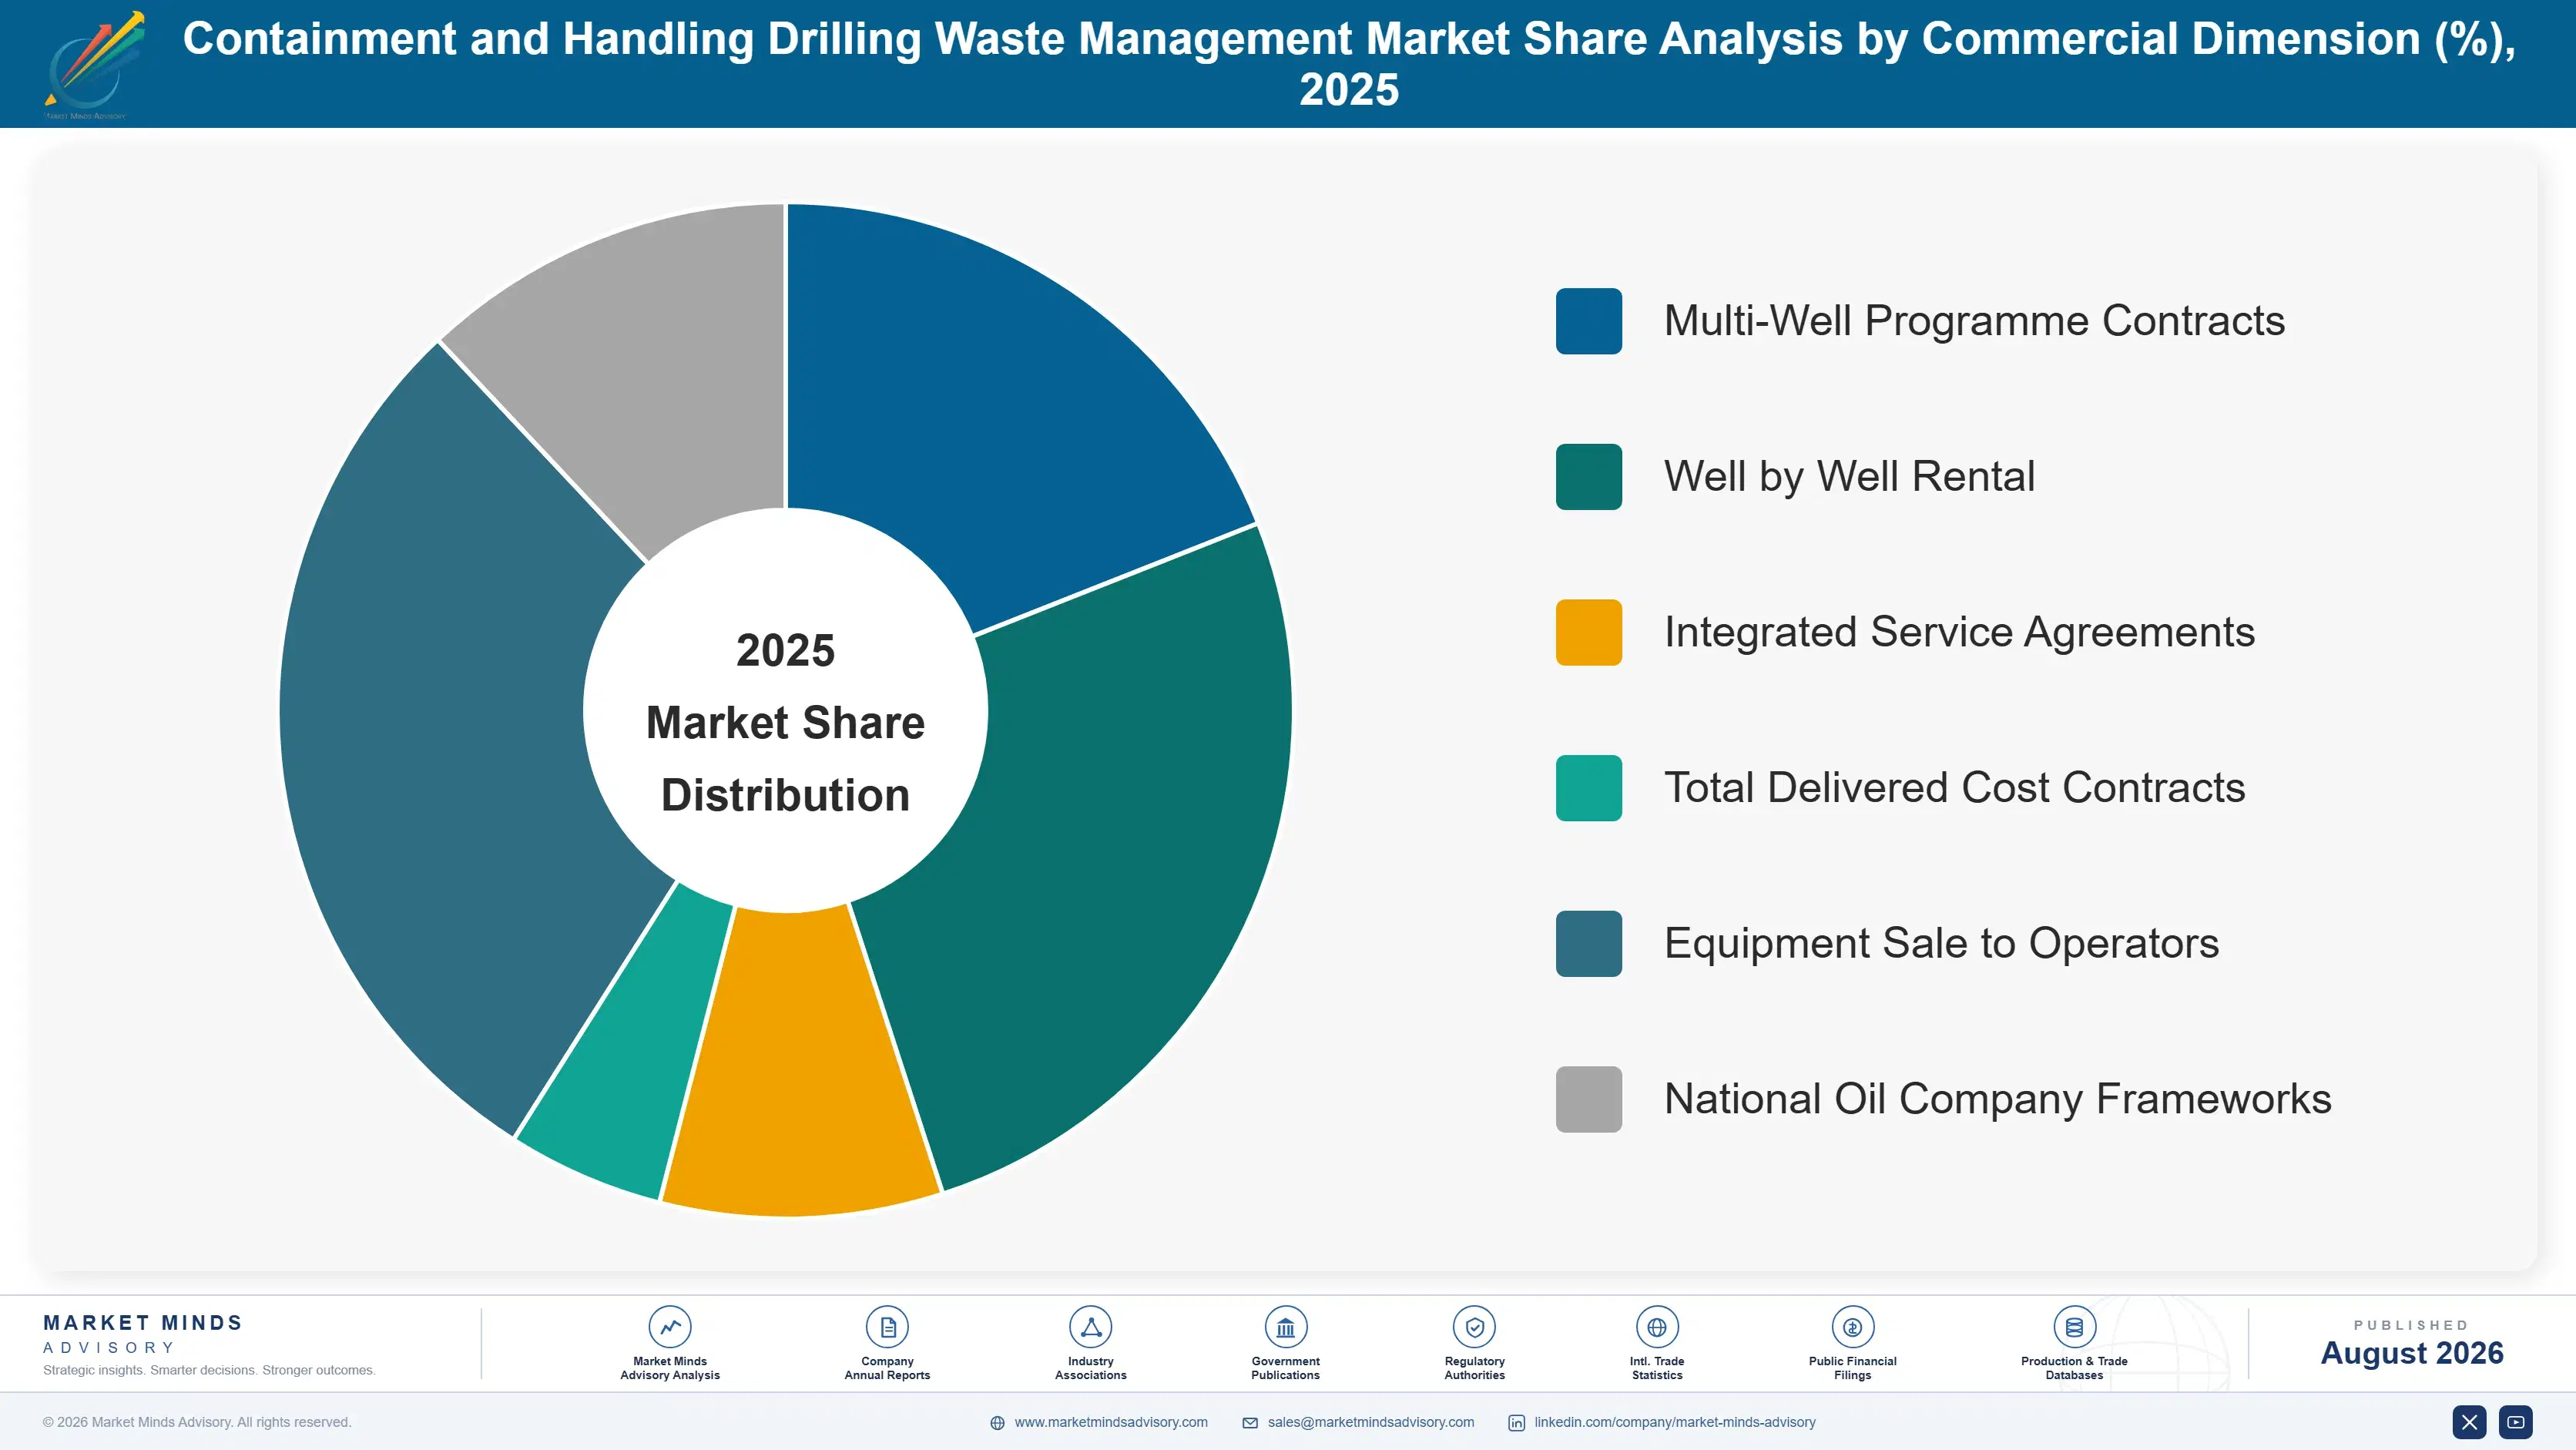
containment-and-handling-drilling-waste-management-market-share-analysis-1788193627377

Closed-Loop Containment Systems

Closed-loop containment systems grow at 12.9%, half again the market rate of 8.6%, and regulation rather than performance created the entire segment. Groundwater rules across North American producing states restricted or banned the earthen reserve pit, and 67% of wells are now drilled without one, which means every cubic metre of cuttings and spent fluid must be contained in tanks and transferred mechanically from the moment it reaches surface. That converted a free disposal method into a purchased service on every affected well. The systems themselves are tanks, augers, pumps and controls rather than anything exotic, and the value sits in the integration and the crew who run it continuously through a drilling programme.
CAGR 12.9%

Vacuum Transfer and Pneumatic Conveyance Systems

Vacuum transfer and pneumatic conveyance at 9.6% solve the handling problem that closed-loop drilling created, which is moving wet cuttings around a crowded pad without spillage or repeated double handling. Every additional handling step costs labour, creates a release risk and adds fluid that later has to be hauled, so removing steps has value well beyond the equipment rental. Offshore the case is stronger still, since pneumatic transfer moves cuttings into skips on a moving deck where mechanical handling is genuinely hazardous. Adoption lags the technical case badly, mostly because the saving appears on the haulage line while the cost appears on the equipment line, and different people own each.
CAGR 9.6%
Full segment breakdown across 6 segments available in the complete report.

Regional Architecture and Country Demand Map

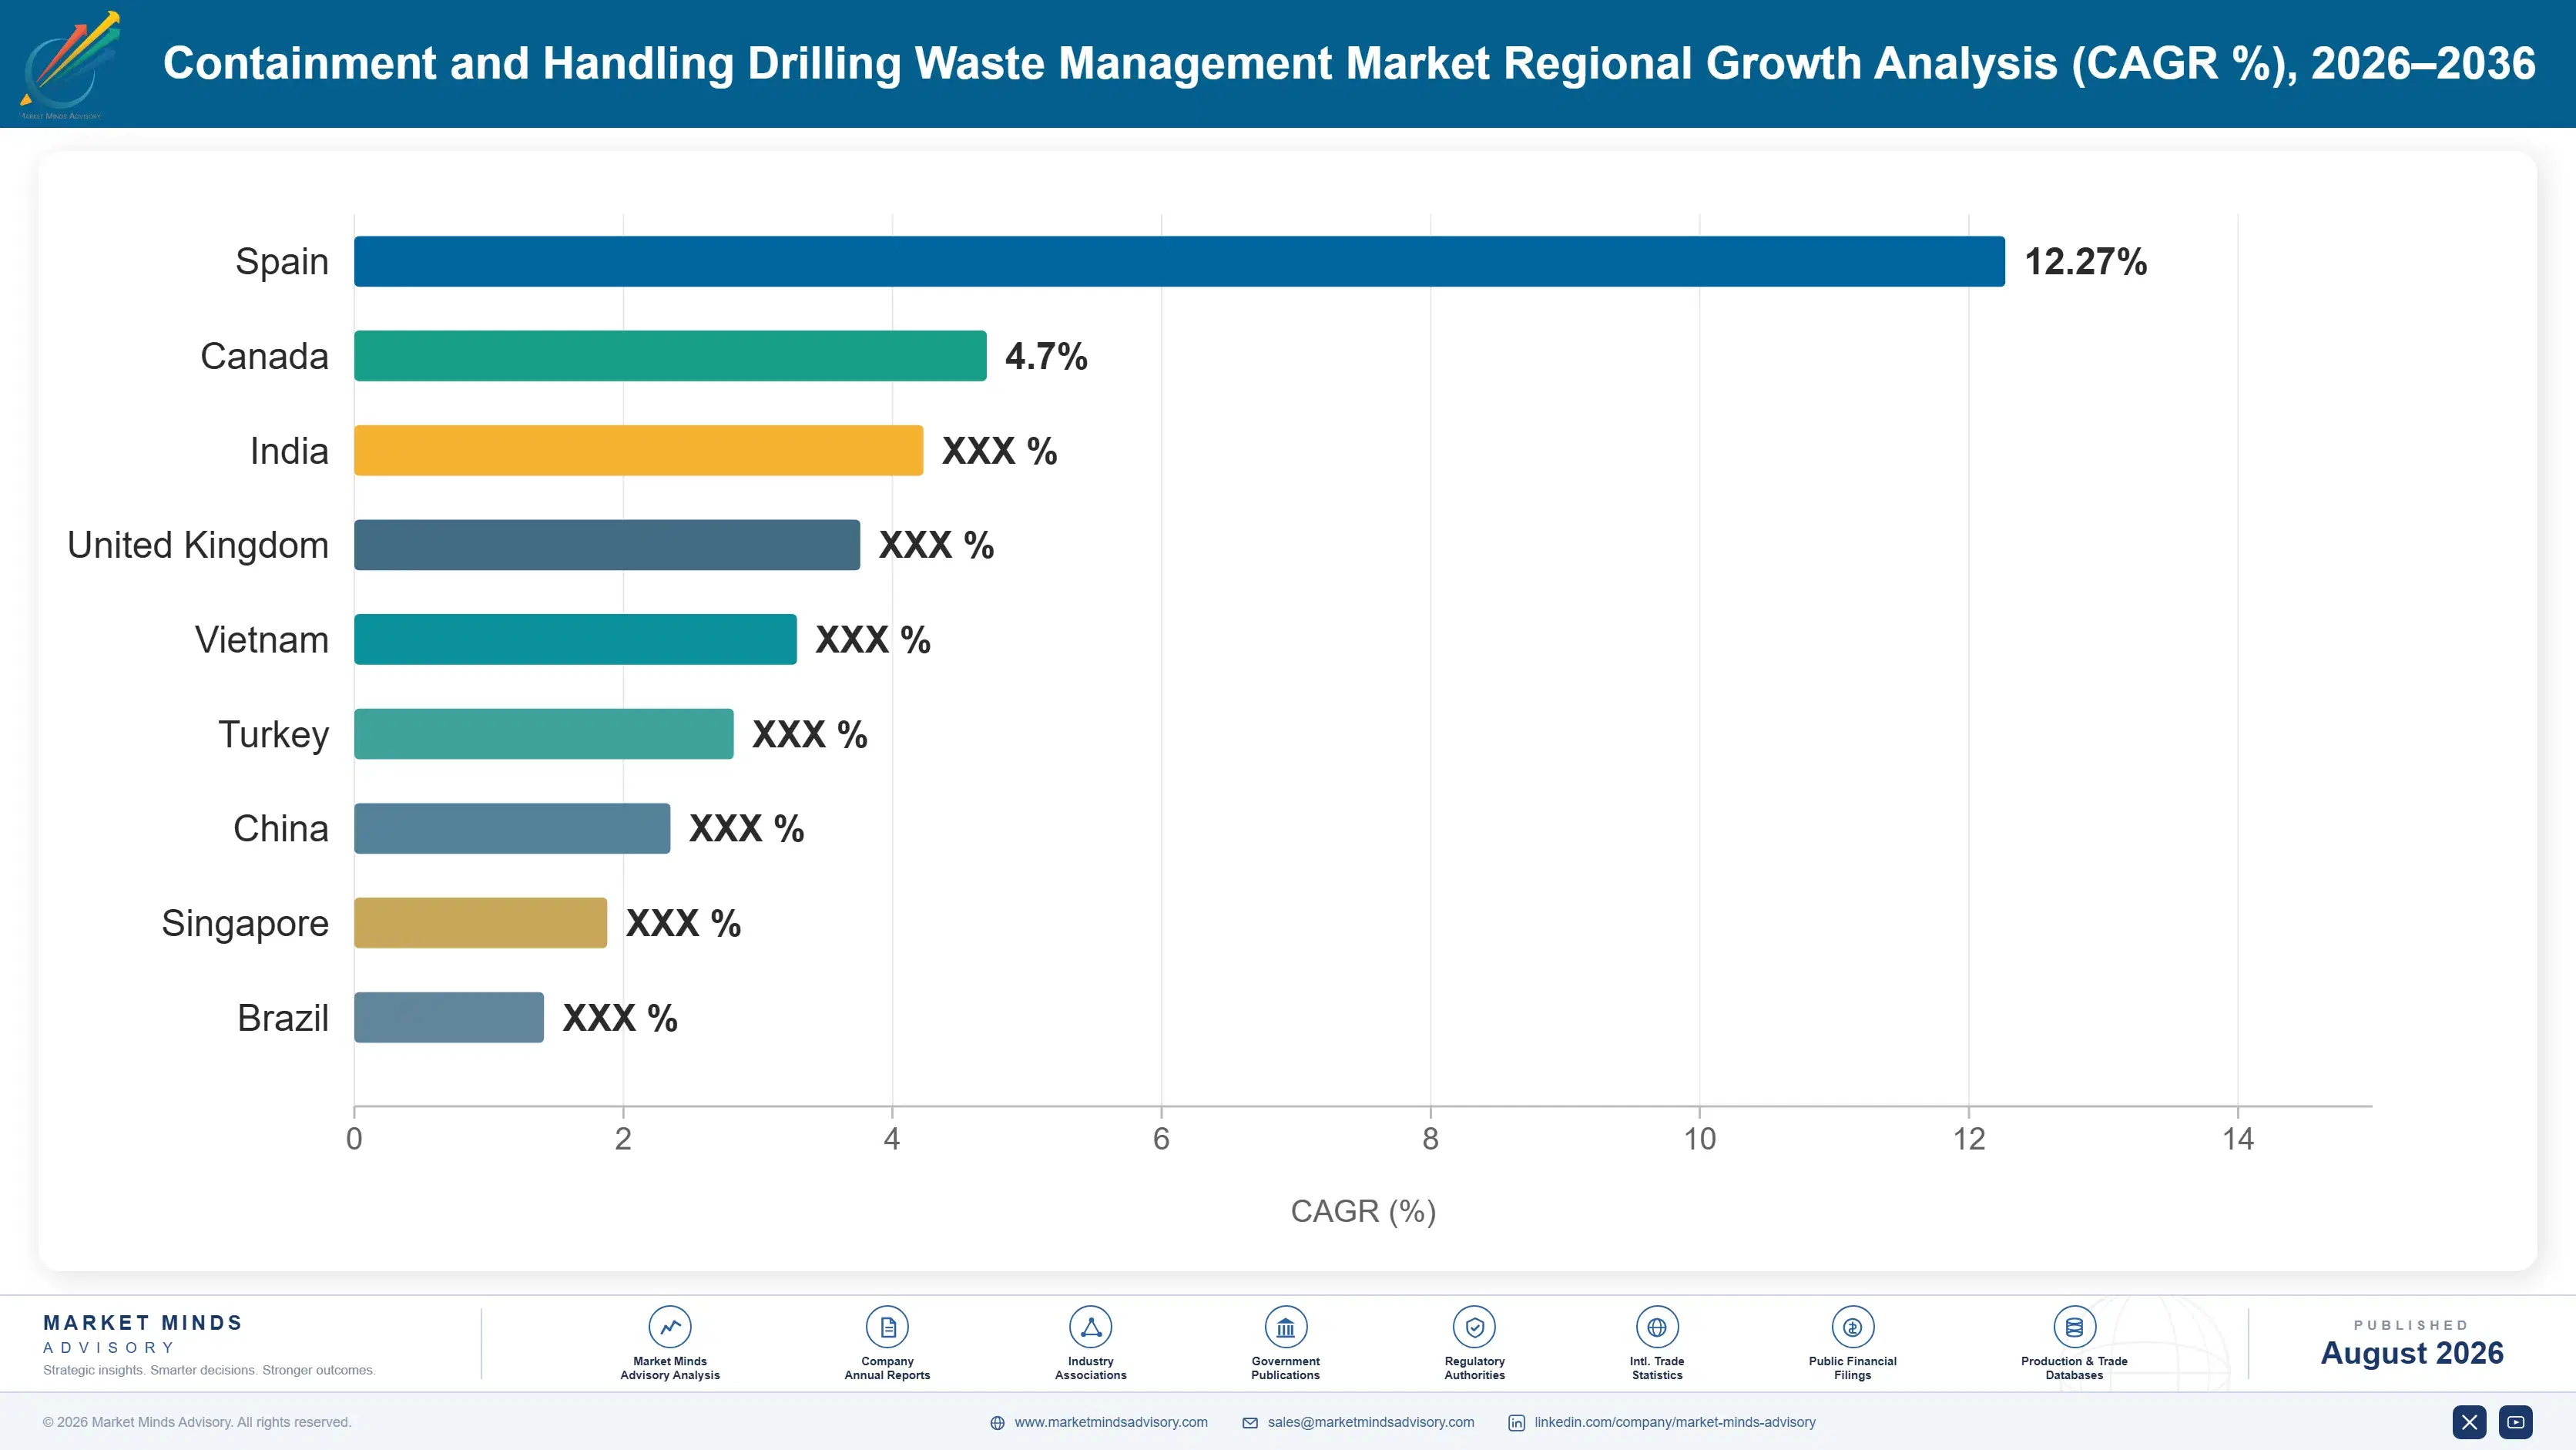
North America takes 33% on well count and the strictest pit regulation anywhere. Middle East and Africa reaches 19% on drilling volume rather than on rules. Australia grows fastest of any country covered. Four regional positions sit outside their usual bands, because drilling and rulemaking do not align.

North America

A 33% share above the usual band comes from two things arriving together rather than from either alone. The United States and Canada drill more wells than anywhere else and those wells are overwhelmingly horizontal, generating around 410 cubic metres of cuttings each. Separately, state and provincial groundwater rules across Colorado, Pennsylvania, New Mexico and Alberta removed the earthen reserve pit as an option, which converted free disposal into a purchased service on every affected well. Dense networks of permitted disposal outlets and regional service crews serve that demand. Nowhere else has both the drilling volume and the regulation, and the combination is what produces the position. Everything else here follows from that pairing.
Share: 33% | CAGR: 8.2% (2026 to 2036)

Middle East and Africa

The 19% share sits far above the usual band on drilling volume rather than on any regulatory pressure. Saudi, Emirati and Omani programmes drill continuously at scale, and North African and West African operations add offshore volume where zero-discharge rules increasingly apply. Regulation onshore is considerably lighter than in North America, so containment adoption follows operator standards and international joint venture requirements rather than local law. That makes the demand contractual rather than mandatory, which is a genuinely different sales problem. National oil company procurement favours long framework agreements, and providers holding those positions are unusually secure. Framework awards here run for years, and displacing an incumbent is close to impossible once one is in place.
Share: 19% | CAGR: 9.0% (2026 to 2036)
Regional intelligence for 5 additional markets available in the complete report: Western Europe, East Asia, South Asia and Pacific, Latin America, Eastern Europe. Contact sales@marketmindsadvisory.com.
containment-and-handling-drilling-waste-management-country-cagr-analysis-1788193627905

Four Moves On The Haulage Line

None of these four is about better containment equipment, because containment is tanks, berms and augers and everybody builds acceptable versions of all three. Each attacks the cost the operator actually notices, which is the trucks, or the permit position that decides who can compete at all. Both are commercial decisions rather than engineering ones.

Contract on volume avoided, not equipment supplied

Trucking consumes 54% of drilling waste cost and containment equipment a fraction of it, yet almost every contract in this sector is written on equipment day rates. Dewatering, drying and effective screening remove around 38% of hauled volume at a cost far below the haulage avoided. A provider guaranteeing volume reduction is selling against the operator's largest line rather than its smallest, and can price against a share of the saving rather than against a competitor's rental sheet. Operators asked for this structure before any provider offered it. Most providers still decline to bid that way.
Market Impact: Prices against 54% of the operator's total cost

Own or lock the disposal outlet nearby

A permitted disposal outlet takes around 3 years to obtain and faces community opposition that capital does not resolve, which makes an existing one the scarcest asset in any basin. A provider with a nearby outlet hauls a shorter distance, costs less and wins on price against a competitor with identical equipment. Acquiring or contracting exclusive access costs a fraction of a service fleet and is far more defensible. The providers who understood this bought outlets while everybody else was buying tanks and augers. The asset appreciates while equipment depreciates.
Market Impact: Secures a 3 year permitting head start locally

Separate the offshore business from onshore

Offshore containment under zero-discharge rules is a marine logistics operation constrained by vessel deck space and skip handling on a moving platform, and it earns rates several multiples of onshore work. Onshore is a trucking optimisation problem. Running both through one commercial organisation reliably underprices the offshore side, because the pricing instincts developed onshore travel badly. Separating the two, with distinct pricing and distinct crews, recovers margin that is being given away routinely. At least 3 providers have found this on inspection. The pricing instincts simply do not transfer between the two environments.
Market Impact: Recovers offshore margin across 3 growing regions now

Size the fleet for the longer laterals

A modern horizontal well generates around 410 cubic metres of cuttings against a fraction of that from the wells legacy containment was sized for, and laterals keep lengthening. Undersized equipment forces double handling on every job, which costs crew time, creates release risk and adds fluid that must later be hauled. Providers running legacy inventory are losing money on jobs they believe are profitable, because the handling cost sits in labour rather than in equipment. Replacing undersized fleet pays back faster than the rental rates suggest. The handling cost hides in the labour line, which is why nobody sees it.
Market Impact: Handles all 410 m3 without any double handling

Who Controls the Margin Pool

CR5 stands at 31% of wells serviced, which is the only comparable basis since revenue mixes rental, service and disposal in proportions nobody discloses. Concentration is low because this is regional service work: crews are local, disposal permits are local, and neither travels between basins. The gap between leaders and the field is a gap in disposal outlet position rather than in equipment capability.
Competition runs on outlet proximity, fleet suitability and contract structure. Outlet proximity decides haul distance and therefore price in every basin. Fleet suitability decides whether crews double handle on modern long-lateral wells. Contract structure decides whether the provider participates in the haulage saving or only sells rental. Equipment engineering decides remarkably little, since the designs are broadly common. Nobody has ever won a basin on equipment design.

Rankings will move on offshore work and on contract structure rather than on any equipment development. Zero-discharge regimes reaching new jurisdictions create high-rate positions that onshore-trained commercial teams routinely underprice. The pressure comes from regulation arriving in new places rather than from competitors, which rewards the providers who read rulemaking dockets rather than tender lists. That is an unusual research task for a service company.
containment-and-handling-drilling-waste-management-company-positioning-matrix-1788193628430

Competitive Moat and Risk Dimensions

SLB

Moat: Integrated position at the rig

Supplying drilling fluid alongside containment and solids control means the group sits inside the operator's programme before waste handling is tendered separately, and the fluid and cuttings decisions are technically linked in ways a standalone provider cannot influence. That integration wins work without competing for it. A containment specialist arrives after the decisions that matter have been taken.
SLB

Risk: Offshore pricing set onshore

A commercial organisation shaped by high-volume onshore work carries pricing instincts that translate badly to offshore zero-discharge operations, where deck space, vessel logistics and platform handling justify multiples of onshore rates. Scale creates the standardisation that causes the mispricing. Specialists focused solely on offshore consistently achieve rates the integrated groups do not ask for.
SECURE ENERGY SERVICES

Moat: Permitted disposal network density

Ownership of permitted disposal facilities across Western Canadian basins means every haul is shorter than a competitor's, which decides price in a business where trucking is over half the total cost. Those permits took years to obtain and face community opposition that capital cannot shorten. It is the most defensible position in this sector and cannot be replicated quickly.
SECURE ENERGY SERVICES

Risk: Concentrated in one drilling region

Disposal network density is basin-specific by nature, so the advantage does not travel and the business is exposed to activity in a single geography where a rig count decline arrives without warning. Diversifying means acquiring permits elsewhere at prices reflecting their scarcity. The asset that creates the moat is the same one that concentrates the risk.

Players Tracked

Prominent Players

SLB
Halliburton
Secure Energy Services
Baker Hughes
NOV

Other Key Players

TWMA
Derrick Equipment
Elgin Separation Solutions
GN Solids Control
Scomi Group
Nuverra Environmental Solutions
Clean Harbors
Weatherford International
KEMTRON Technologies
Ridgeline Canada
Total Separation Solutions
Augean
Milestone Environmental Services
Recover Energy Services
Aqua-Clear

Recent Developments

MARCH 2025

Further producing state restricted earthen reserve pit use

Another North American producing state tightened restrictions on earthen reserve pits for groundwater protection, requiring closed-loop containment on the majority of new wells drilled within its jurisdiction. Providers holding equipment fleets and disposal access in that state reported demand rising well ahead of any change in regional rig count.
Signal: A rulemaking docket predicted this demand far more accurately than any drilling forecast could have done.
JULY 2025

West African operations adopted zero-discharge cuttings handling

Operators across several West African offshore developments adopted zero-discharge cuttings handling, shipping solids to shore rather than discharging overboard, in line with practice established across the North Sea. The change requires skip handling and vessel logistics capability that few regional providers currently hold at all.
Signal: Zero-discharge practice keeps travelling into new basins several years before any local regulation actually requires it.
NOVEMBER 2025

Operator awarded contract on hauled volume reduction terms

A North American operator awarded a multi-well drilling waste contract priced on guaranteed hauled volume reduction rather than on equipment day rates, sharing the haulage saving with the provider. Only two of the providers invited were willing to bid on that basis at all when the tender was issued.
Signal: The operators are ready for this pricing model and most of the providers still are not.

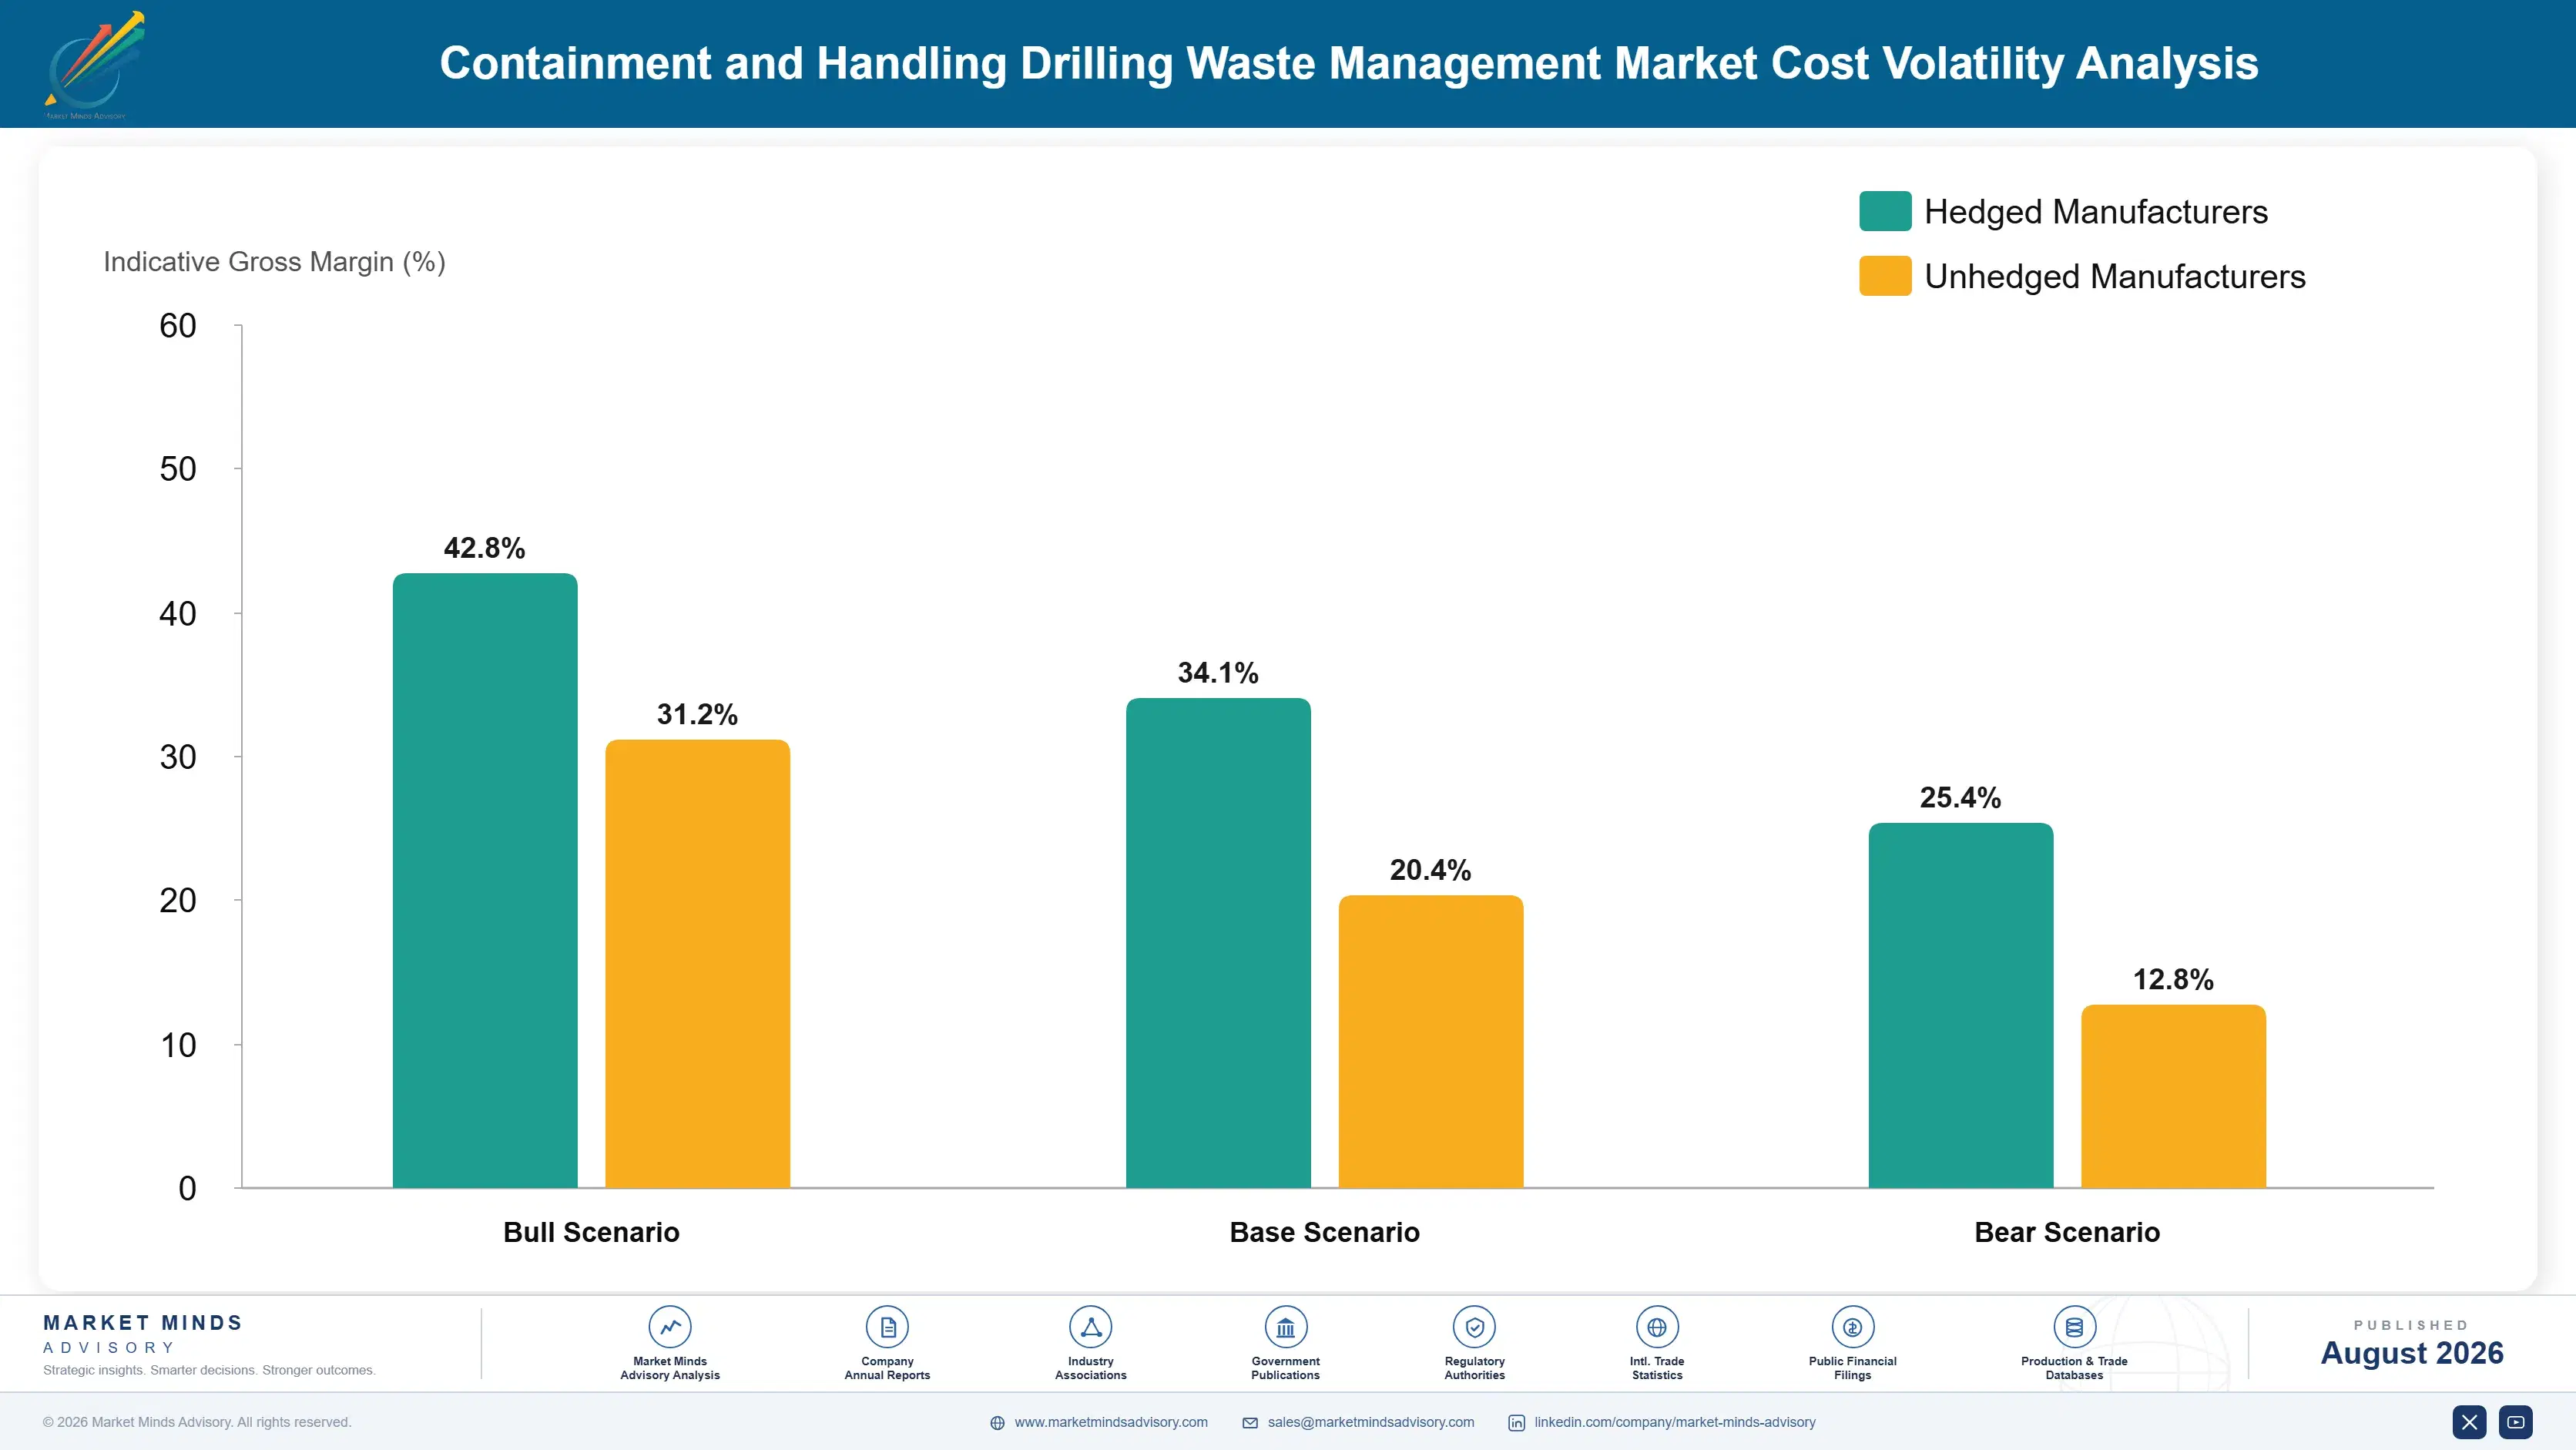
Diesel, Steel And Crew Wages

Diesel for haulage and on-site equipment accounts for roughly 29% of delivered service cost, field crew wages around 26%, and fabricated steel for tanks, boxes and skids a further 18% on a fleet replacement basis. Disposal gate fees make up most of what remains. Diesel moves fastest and hardest, on a market unconnected to drilling activity or to anything a provider controls.
Diesel pricing through 2022 demonstrated the exposure across the whole sector at once. Energy Information Administration price reporting tracked the movement, and providers holding fixed-price multi-well contracts absorbed the increase across every load hauled. Those with fuel escalation clauses passed it through without argument. The difference between the two groups was a single contract clause, and several smaller providers in the second group did not survive the year.

The disadvantage falls on haul distance rather than on fuel purchasing, which is where most participants look first. A provider with an outlet twenty kilometres from the pad burns a fraction of the diesel of one hauling eighty, on identical equipment. No purchasing arrangement closes that gap, and no operating improvement does either. Outlet position sets the cost base before any other decision is taken.
containment-and-handling-drilling-waste-management-cost-volatility-analysis-1788193628626

Write fuel escalation into every multi-well contract

Diesel is 29% of delivered cost and it reprices on a market with no connection to drilling activity, while multi-well contracts run months or years. An escalation clause costs a negotiation rather than money and removed the largest uncontrolled exposure for providers who used one. Several who did not are no longer trading in the sector.

Reduce hauled volume before optimising the haul

Dewatering, cuttings drying and effective screening remove around 38% of hauled volume at an equipment cost well below the trucking avoided, which beats any routing or fuel purchasing improvement. The saving compounds with haul distance, so it matters most exactly where the cost problem is worst. Most providers optimise logistics before they reduce volume, which is the wrong order entirely.

Acquire outlet access rather than more equipment

Haul distance sets the diesel cost before any other decision, and a permitted outlet near the pad is worth more than any fleet upgrade at the same price. Permits take around 3 years and face opposition capital cannot shorten, which is exactly why existing ones are valuable. Providers buying tanks while competitors bought outlets lost basins they could have held.

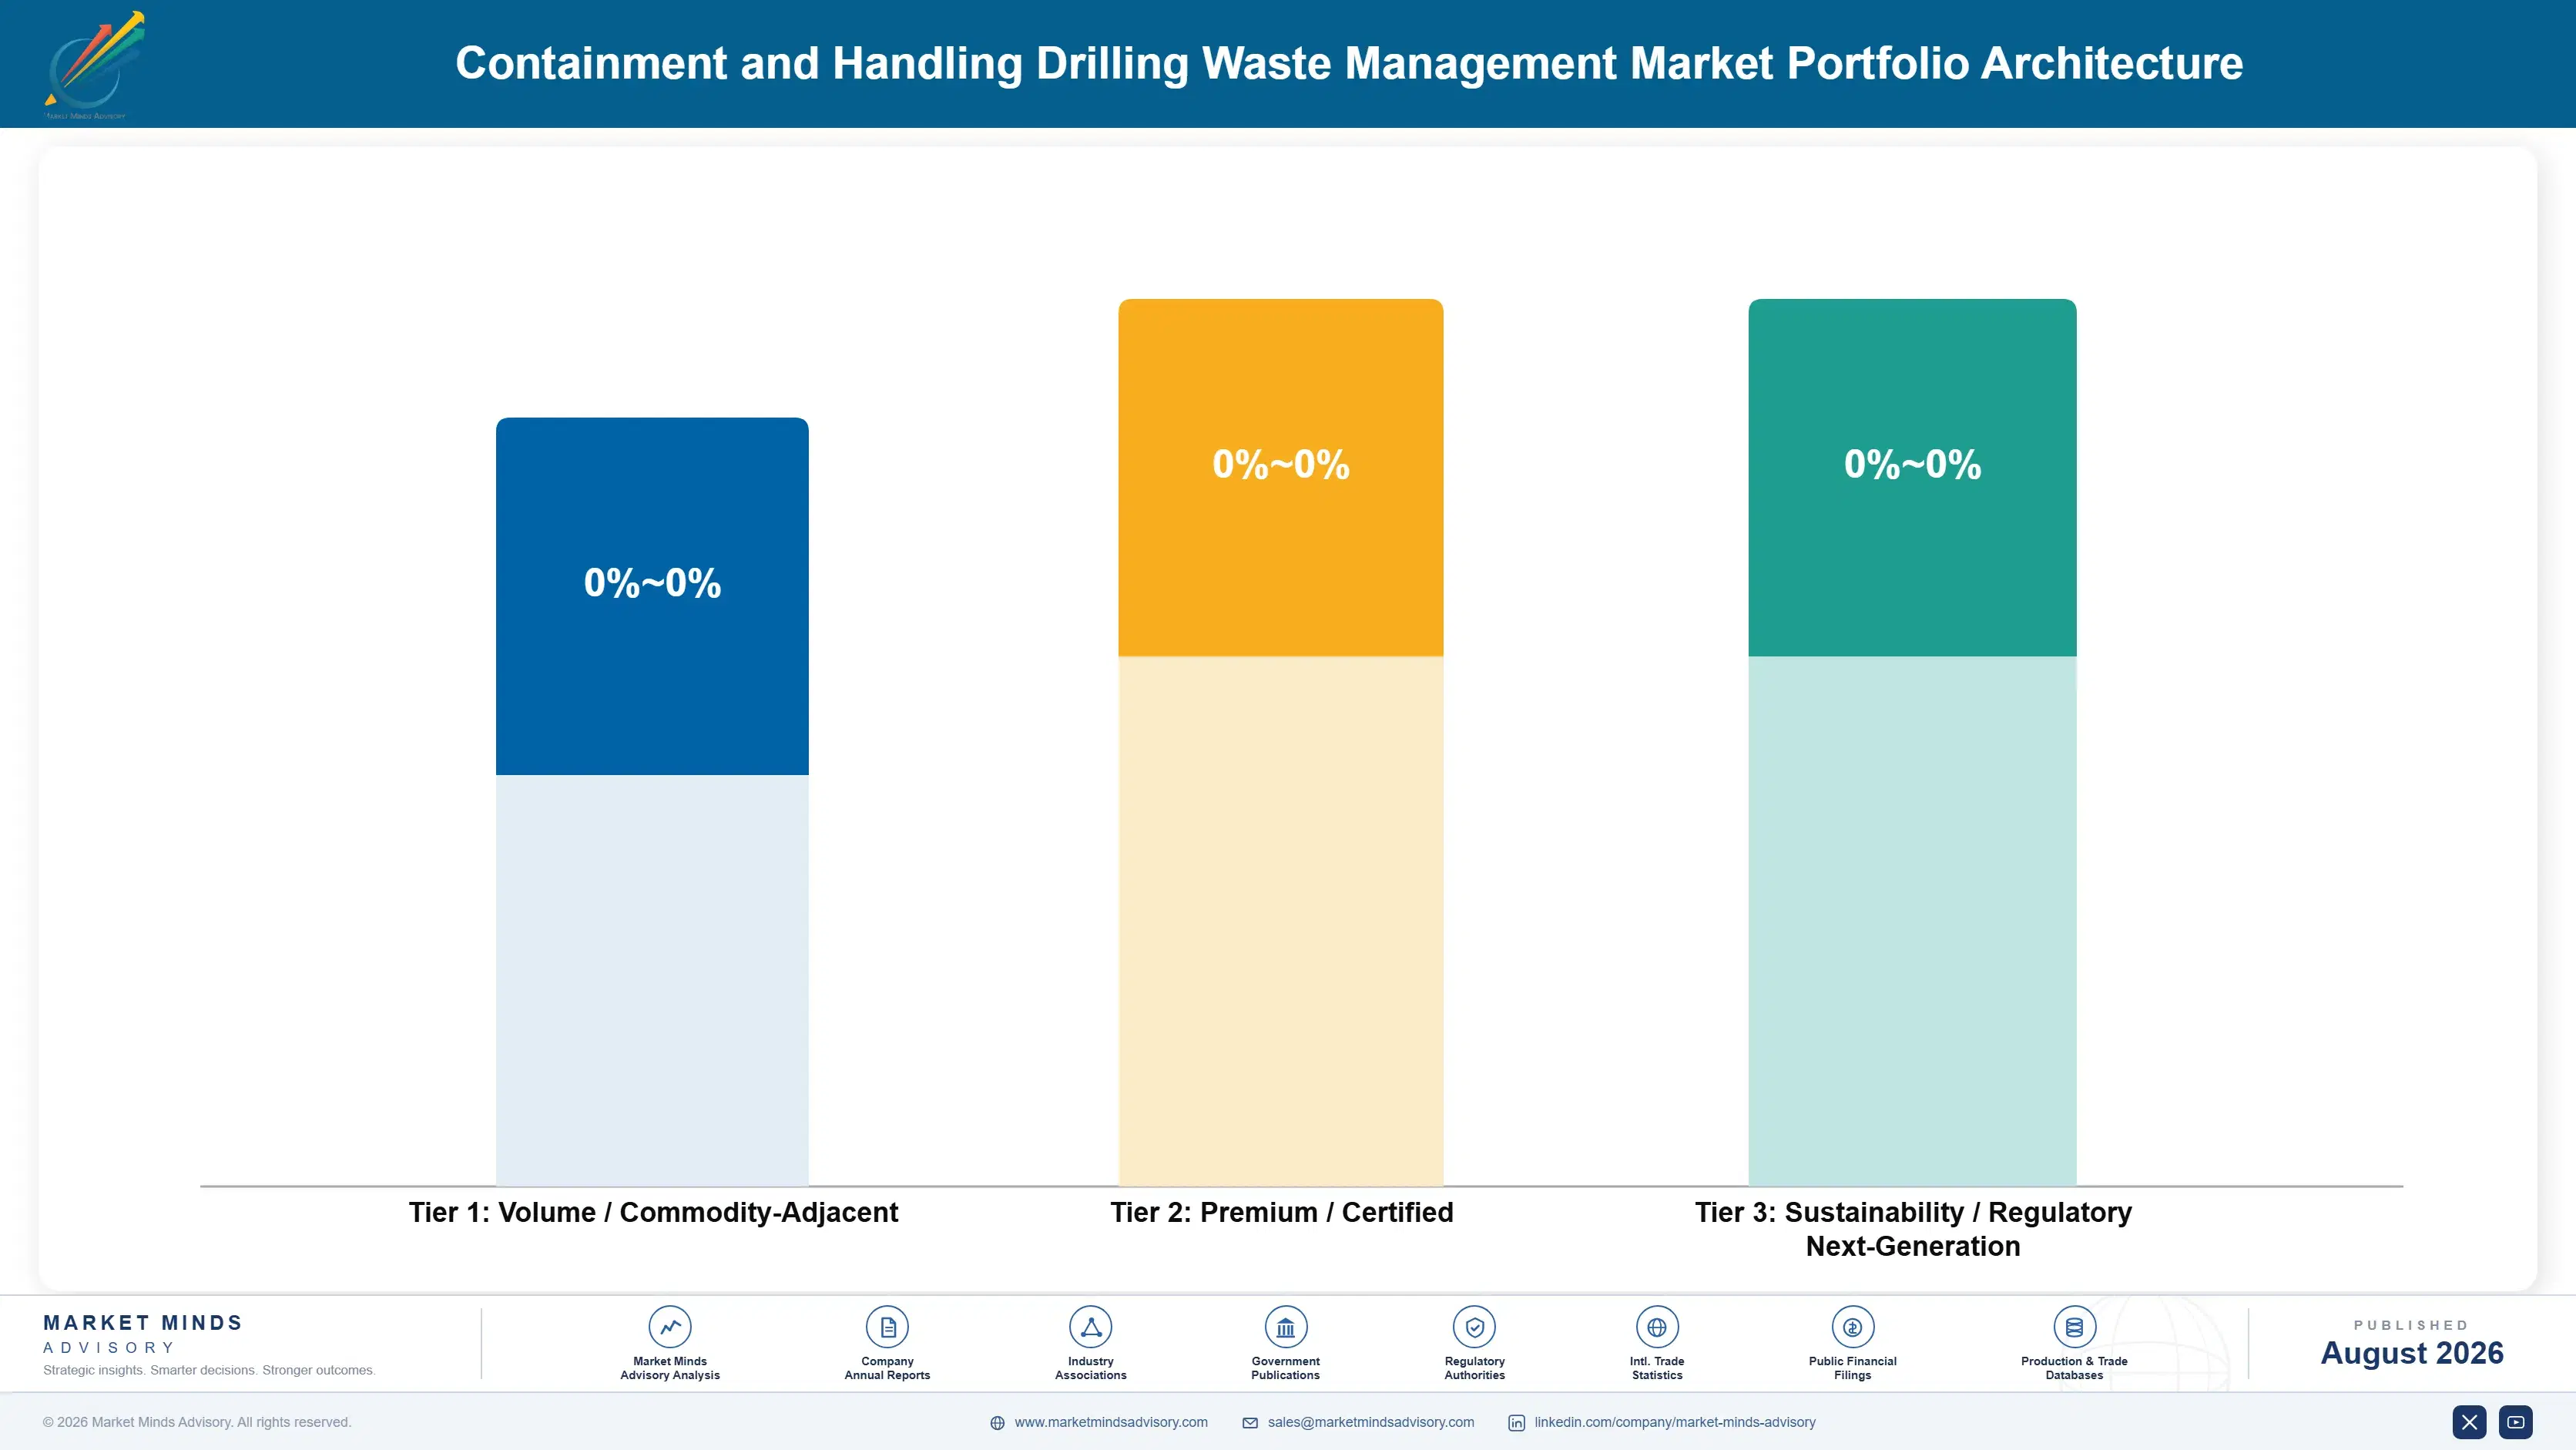
Portfolio Architecture for Margin Defence

Margin here follows haul distance rather than equipment quality, which is not how any provider describes itself. Identical fleets and identical crews produce entirely different returns depending on how far the outlet sits from the pad, because trucking is 54% of the cost and distance is the only variable in it. Providers costing by basin position rather than by equipment line run a different business from the rest.
Volume and premium pull against each other through crew utilisation rather than through pricing. Basic containment work on routine wells keeps crews employed and fleet utilisation at 71%, and that continuity is what makes the specialist offshore and closed-loop work stafffable at all. A provider chasing only high-rate work carries idle crews between jobs and loses more on that than the rate premium ever recovers.

High-value pools sit in offshore zero-discharge work, in permitted outlet ownership and in volume-reduction contracts almost nobody writes. The third is the most available: pricing against a share of the haulage saving rather than an equipment day rate reaches a far larger cost pool and aligns the provider with the operator. Operators asked for that structure before any provider proposed it.

Volume / Commodity-Adjacent

Cuttings boxes, containment berms, matting liners and holding tanks rented on standard day rates against competitive quotes. Equipment is common and differentiation is minimal. The 8 point spread reflects fleet utilisation and yard proximity rather than any product difference.
Gross Margin: 14 to 22%

Premium / Certified

Closed-loop systems, solids control and vacuum transfer supplied with dedicated crews on multi-well programmes requiring continuous operation. Crew capability rather than equipment supports the rate. The 8 point spread reflects whether disposal access is held or bought from a third party.
Gross Margin: 30 to 38%

Sustainability / Regulatory / Next-Generation

Offshore zero-discharge handling, volume-reduction contracts priced on haulage saving and owned permitted disposal access. Margins are high because permits are scarce and offshore capability is rare. The 18 point spread separates offshore service revenue from disposal gate income, which behave very differently.
Gross Margin: 40 to 58%
containment-and-handling-drilling-waste-management-portfolio-architecture-1788193629129

High-value Sub-segments and Strategic Watch-out

Closed-Loop Containment Systems

High value and high growth at 12.9%. Reserve pit bans made this mandatory on 67% of wells, which converted free disposal into a purchased service on every affected location. The 8 point spread reflects whether the provider supplies crews or only rents the equipment out.
Gross Margin: 34 to 42%

Vacuum Transfer and Pneumatic Conveyance

High value with strong growth at 9.6%. It removes handling steps that cost labour and add fluid to haul, and offshore it removes genuine hazard on a moving deck. The 8 point spread reflects whether the work is offshore or onshore, which are priced entirely differently.
Gross Margin: 32 to 40%

Cuttings Boxes and Skips

The volume core. It earns modestly and it keeps crews and yards busy between the specialist jobs, which is what makes staffing the premium work possible at all. The 8 point spread reflects utilisation, since an idle box sitting in a yard earns nothing whatsoever.
Gross Margin: 16 to 24%

Slurry Storage and Holding Tanks

The strategic watch-out. Volume reduction on site directly reduces what needs storing, so success in the growth segments erodes demand here in the same operation. The 22 point spread separates specialist high-pressure and sour service tankage from the general holding capacity that almost anybody can supply.
Gross Margin: 12 to 34%

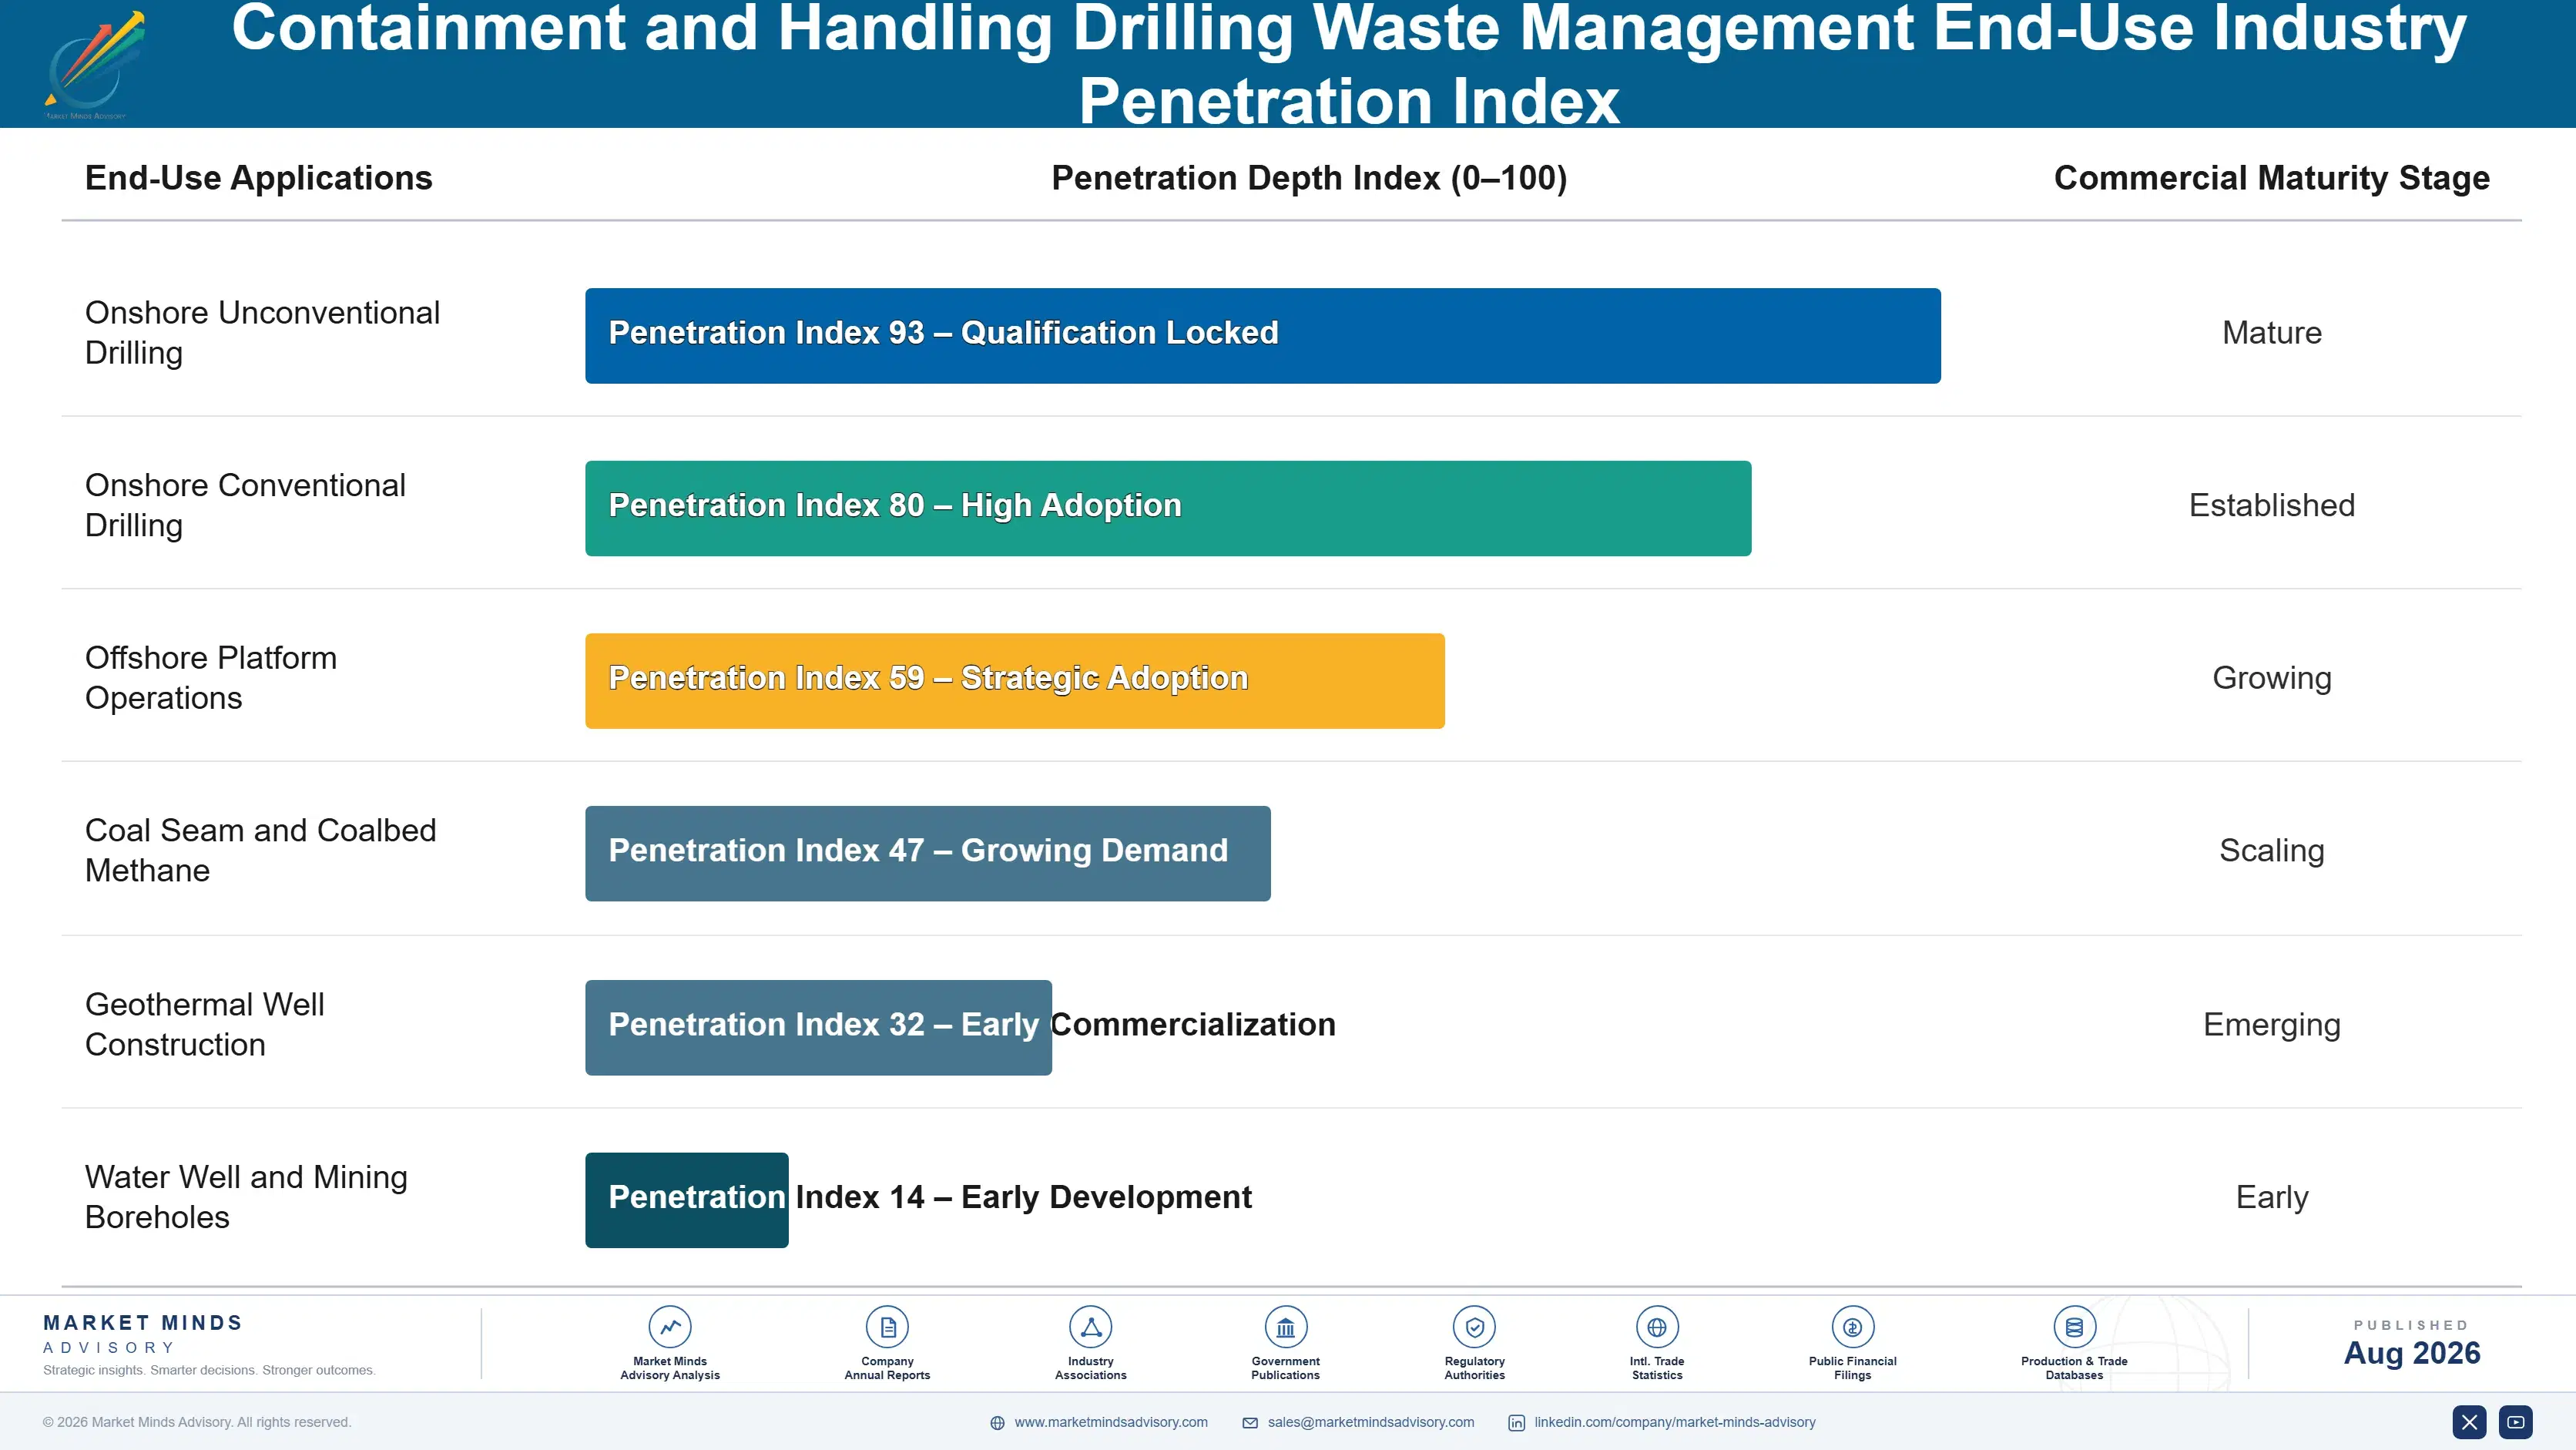
Wells Drilled, Nothing Else

The annuity here is a well count and nothing else, which makes it both simple and dangerous. A multi-well programme produces predictable containment demand for its duration, and the provider on the pad supplies every well in the sequence without rebidding, so a single award covers many months of revenue. When the programme ends the revenue ends completely, and there is no maintenance tail of any kind behind it.
Stickiness varies enormously by contract type rather than by relationship quality. A provider embedded on a multi-well pad with crews, tanks and a disposal arrangement is not displaced mid-programme, because changing over costs the operator rig time that dwarfs any rate saving. A provider quoting well by well is retendered constantly. The difference is entirely in how the contract was written at the start.

Buyer profiles have shifted from drilling superintendents toward environmental and supply chain functions, and pricing has not caught up. A superintendent asked whether the equipment would keep the pad clean and the rig moving. An environmental manager asks about release records, and a supply chain buyer asks about total delivered cost including haulage. The third question rewards volume reduction, and almost nobody answers it.
containment-and-handling-drilling-waste-management-end-use-penetration-index-1788193629621

Where The Cost Actually Sits

These are among the four positions where our research anticipates prominent divergence between winners and laggards over the coming forecast period. Each is grounded in the demand model, the regulatory perimeter, and the announced capacity pipeline.
01 / HAULAGE BASED CONTRACTING

Price against the trucks, not the tanks

Trucking consumes 54% of what an operator spends on drilling waste while containment equipment takes a fraction of it, yet nearly every contract in this sector is still written on equipment day rates against a competitor's rental sheet. Dewatering, drying and effective screening remove around 38% of hauled volume at a cost far below the haulage avoided, which is a saving the provider currently hands over free. Operators have already asked for this structure and most providers still decline to bid on it.
02 / DISPOSAL OUTLET OWNERSHIP

Buy the permit, not another fleet

A permitted disposal outlet takes around 3 years to obtain and faces community opposition that capital cannot resolve, which makes an existing one the single most defensible asset available anywhere in this business. A provider with a nearby outlet hauls shorter, costs less and wins on price against a competitor running identical equipment with identical crews. Acquiring or contracting exclusive access costs a fraction of a service fleet, and the providers who understood that bought outlets while everybody else bought tanks.
03 / OFFSHORE PRICING SEPARATION

Stop pricing marine work like a trucking job

Offshore containment under zero-discharge rules is a marine logistics operation constrained by vessel deck space and by skip handling on a moving platform, and it commands rates several multiples of comparable onshore work anywhere. Running both businesses through one commercial organisation reliably underprices the offshore side, because pricing instincts developed on high-volume onshore work travel extremely badly into that environment. Separating them with distinct pricing and distinct crews recovers margin that is currently being given away routinely on every single job.
04 / FLEET CAPACITY SIZING

Match the equipment to modern lateral lengths

A modern horizontal well generates around 410 cubic metres of cuttings against a small fraction of that from the wells most legacy containment fleets were originally sized for, and laterals continue to lengthen every year. Undersized equipment forces double handling on every single job, costing crew hours, creating release risk and adding fluid that must later be hauled at the sector's highest cost line. Providers running that inventory are quietly losing money on jobs their own internal reporting shows as comfortably profitable.

Engagement Snapshot From the Field

A live engagement with an industry participant carrying material or product regulatory and market exposure ahead of a defining policy shift, showing how our research translates into a defensible multi-year portfolio strategy.
MARKET MINDS ADVISORY · CLIENT ENGAGEMENT SUMMARY
Containment and Handling Drilling Waste Management Producer Strategic Portfolio Review and Transition Roadmap 2026·Investment Scenario on Containment and Handling Drilling Waste Management Exposure Evaluation 2025-26
CLIENT PROFILE
A North American drilling waste service provider operating containment and solids control fleets across three basins, with annual revenue in the low hundreds of millions of dollars and gross margins that had compressed for four consecutive years despite rising activity (client-reported, unverified by MMA). Management attributed the compression to competitive rate pressure from regional entrants.
STRATEGIC CHALLENGE
Rates had fallen in every competitive tender and management had responded by cutting equipment pricing further, which produced no share gain and considerable margin damage. They wanted to know whether the problem was cost position, fleet quality or pricing, and whether any defensible position existed in a business where competitors offered visibly similar equipment.
MMA APPROACH
MMA rebuilt total delivered waste cost per well for the client and for three competitors across every basin, separating equipment rental from crew, fuel, haul distance and disposal gate fees. Forty-seven expert interviews with operators, disposal facility operators, trucking contractors and competing providers established what buyers actually compared and what they were never shown at all.
KEY FINDINGS
  1. Equipment rental was 19% of the operator's total waste cost while haulage was 54%, and every tender the client entered compared only the 19%.
  2. In 2 of 3 basins a competitor held a disposal outlet closer to the main drilling areas, producing a delivered cost advantage the client could not price against.
  3. The client's dewatering equipment removed 38% of hauled volume and this saving was never quantified in any bid document the client had submitted.
  4. Operators interviewed said they would award on total delivered cost if a provider offered it, and no provider in these basins had ever proposed such terms.
CLIENT PROFILE
A North American drilling waste service provider operating containment and solids control fleets across three basins, with annual revenue in the low hundreds of millions of dollars and gross margins that had compressed for four consecutive years despite rising activity (client-reported, unverified by MMA). Management attributed the compression to competitive rate pressure from regional entrants.
STRATEGIC CHALLENGE
Rates had fallen in every competitive tender and management had responded by cutting equipment pricing further, which produced no share gain and considerable margin damage. They wanted to know whether the problem was cost position, fleet quality or pricing, and whether any defensible position existed in a business where competitors offered visibly similar equipment.
MMA APPROACH
MMA rebuilt total delivered waste cost per well for the client and for three competitors across every basin, separating equipment rental from crew, fuel, haul distance and disposal gate fees. Forty-seven expert interviews with operators, disposal facility operators, trucking contractors and competing providers established what buyers actually compared and what they were never shown at all.
KEY FINDINGS
  1. Equipment rental was 19% of the operator's total waste cost while haulage was 54%, and every tender the client entered compared only the 19%.
  2. In 2 of 3 basins a competitor held a disposal outlet closer to the main drilling areas, producing a delivered cost advantage the client could not price against.
  3. The client's dewatering equipment removed 38% of hauled volume and this saving was never quantified in any bid document the client had submitted.
  4. Operators interviewed said they would award on total delivered cost if a provider offered it, and no provider in these basins had ever proposed such terms.
RECOMMENDED STRATEGY
Phase 1: Phase one: rebid every tender on guaranteed total delivered cost including haulage, sharing the volume reduction saving rather than cutting equipment rates. Phase 2: Phase two: acquire or contract exclusive access to a permitted outlet in the basin where the competitor's position was costing most work. Phase 3: Phase three: stop reducing equipment day rates entirely, since the tender was never actually being decided on that particular number at all.
OUTCOME
Within four quarters the client had won two multi-well programmes on delivered cost terms at equipment rates above its previous levels, and margin recovered past where it stood three years earlier (client-reported, unverified by MMA). An outlet acquisition is in progress. Competitors have not yet changed how they bid.

Frequently Asked Questions

Foundational context covering the market sizes, CAGR, scope, country, region and competition that inform every finding below. This section is provided to cover basics and most often pre-purchase conversations, answered from the MMA Primary Research Dataset.

What is the current size of the Containment and Handling Drilling Waste Management Market?

The global containment and handling drilling waste management market was valued at USD 3.1 billion in 2025, covering wellsite capture, transfer and storage of drilling waste. The 2026 figure reaches USD 3.37 billion.

How large will the Containment and Handling Drilling Waste Management Market be by 2036?

MMA forecasts USD 7.69 billion by 2036, an increase of USD 4.32 billion over the 2026 base. That represents an expansion multiple of 2.28 times across the forecast period.

What is the CAGR for the Containment and Handling Drilling Waste Management Market 2026 to 2036?

The base case compound annual growth rate is 8.6%, with a bull case at 9.8% and a bear case at 7.4%. Historical growth between 2020 and 2025 ran at 7.2%.

Which segment is growing fastest?

Closed-loop containment systems grow at 12.9%, half again the market rate of 8.6%, because reserve pit bans made them mandatory on most new wells. Vacuum transfer follows at 9.6%.

Who are the major companies in the Containment and Handling Drilling Waste Management Market?

SLB, Halliburton, Secure Energy Services, Baker Hughes and NOV lead on wells serviced, with combined CR5 of 31%. Concentration is low because crews and disposal permits are both local.

Which country is growing fastest?

Australia grows fastest at 10.8%, where Queensland coal seam gas drilling density meets environmental conditions among the strictest anywhere. South Asia and Pacific leads regionally at 10.8%.

Report Segmentation Architecture

The full report scope spans multiple orthogonal segmentation dimensions, with cross-tabulated demand data provided for each dimension pair. Coverage extends further to regional breakdowns, trend trajectories, and the competitive detail needed to support segment-level decision-making.

By Equipment and Service Function

  • Cuttings Boxes and Skips
  • Vacuum Transfer and Pneumatic Conveyance Systems
  • Containment Berms and Rig Matting Liners
  • Solids Control and Screening Equipment
  • Closed-Loop Containment Systems
  • Slurry Storage and Holding Tanks

By End-Use Industry

  • Onshore Unconventional Drilling
  • Onshore Conventional Drilling
  • Offshore Platform Operations
  • Coal Seam and Coalbed Methane
  • Geothermal Well Construction
  • Water Well and Mining Boreholes

By Commercial Dimension

  • Multi-Well Programme Contracts
  • Well by Well Rental
  • Integrated Service Agreements
  • Total Delivered Cost Contracts
  • Equipment Sale to Operators
  • National Oil Company Frameworks

By Region

  • North America
  • Western Europe
  • East Asia
  • South Asia and Pacific
  • Latin America
  • Middle East and Africa
  • Eastern Europe

Scope, Methodology, and Coverage

Every figure in this report is reproducible from documented input assumptions. The scope below maps the historical period, the forecast horizon, the segmentation dimensions, and the countries covered, alongside the underlying primary and qualitative methodology.
Historical Period
2020 to 2025
Forecast Period
2026 to 2036
Base Year
2025 (USD billions; MMA Primary Research Dataset, August 2026)
Market Definition
The containment and handling drilling waste management market covers the equipment and services that capture, contain, transfer and store drill cuttings and spent drilling fluid at the wellsite, spanning cuttings boxes and skips, vacuum transfer and pneumatic conveyance systems, containment berms and rig matting liners, solids control and screening equipment, closed-loop containment systems, and slurry storage and holding tanks. Scope covers rental, service and outright equipment sale across onshore and offshore operations. Excluded are thermal and chemical treatment of recovered waste, landfill and injection disposal operations, drilling fluid supply, produced water handling, and site remediation services.
Quantitative Units
USD billion, 2025 base year, 2026 to 2036 forecast period
Segmentation Dimensions
Equipment and service function, drilling application, contract model, region
Regions Covered
North America, Western Europe, East Asia, South Asia and Pacific, Latin America, Middle East and Africa, Eastern Europe
Countries Covered
United States, Canada, United Kingdom, Norway, Netherlands, Romania, Kazakhstan, Poland, China, Malaysia, Indonesia, India, Australia, Brazil, Argentina, Saudi Arabia, United Arab Emirates, Nigeria
Key Companies Profiled
20 companies across integrated service groups, containment specialists and disposal operators
Quantitative Methodology
Primary survey, n=3,800 respondents, Q4 2025, six countries; demand-side model with trade association cross-validation
Qualitative Methodology
47 expert interviews, Q4 2025; applied to validate demand model assumptions, identify emerging dynamics, and assess competitive positioning
Report Format
PDF and XLSX data workbook (Word format preview document)
Publisher
Market Minds Advisory
Report Code
MMA-2026-ENE-361
Published
August 2026
Contact
sales@marketmindsadvisory.com | www.marketmindsadvisory.com

Purchase the full Containment and Handling Drilling Waste Management Market Report (2026 to 2036).

The full MMA report on the containment and handling drilling waste management market runs to detailed function and regional models across the 2026 to 2036 forecast period, with delivered cost benchmarks separating equipment, crew, fuel, haul distance and disposal gate fees. It profiles 20 companies on a consistent wells serviced basis, covering integrated service groups, containment specialists and disposal facility operators. Reserve pit regulation and zero-discharge requirements are mapped by jurisdiction against drilling activity. Regional chapters cover the seven MMA regions with country-level detail on the eighteen markets surveyed. Primary research draws on a quantitative survey of 3,800 respondents across six countries and 47 expert interviews conducted in Q4 2025.
Delivered cost benchmarks separating equipment, crew, fuel and haulage
Reserve pit and zero-discharge regulation mapped by surveyed jurisdiction
Cuttings volume modelling against lateral length and well design
Twenty company profiles on consistent wells serviced basis
Disposal outlet density and haul distance analysis by basin
Seven regional chapters with eighteen country detail tables

Built For The People Who Decide

From boardroom strategy to bench-side execution, this report is read cover-to-cover by leaders shaping the next decade of their industry, turning demand scenarios, market dynamics and valuation benchmarks into decisions.
CXOs/ Presidents/ VPs/ Managers
M&A and Corporate Development
Strategy Teams and R&D Heads
Procurement and Product Directors
Regulatory and Compliance Leaders
Investor Relations and Equity Analysts