Market Minds Advisory
Contactless Smart Card Market

Contactless Smart Card Market: Contactless Smart Card Market: Secure Credentials, Wallet Substitution and Substrate Change, 2026 to 2036

Around 48% of issued payment cards now sit inside a phone wallet as well, so the card increasingly enrols the device that replaces it. Where a law requires a card, none of that applies.

Lead Analyst

Published

September 2026

Make Smarter Decisions with Customized Research Insights

Request a free sample report and evaluate market opportunities, growth trends, and competitive dynamics relevant to your business needs.

2025 MARKET VALUE$12.6BMarket Size 2025
2036 FORECAST VALUE$20.3BBase Case , 2026 to 2036
CAGR 2026 TO 20364.4 %Bull 5.6% / Bear 3.2%
INCREMENTAL OPPORTUNITY$7.1BNet 10- year value creation
EXPANSION MULTIPLE1.54x2036 value over 2026 base
Strategic Levers
M&A Pipeline
Regional Outlook
Country Rankings
Competitive Intelligence
Segmental Deep-dive
Call-Us : 91 93563 13602

Executive Snapshot and Market Trajectory.

The card now performs an awkward double role. It is the credential a bank issues and, for 48% of payment cards, the thing a customer uses once to load a phone wallet and then leaves in a drawer. Issuers keep printing it anyway, for reasons unrelated to payments.
National identity documents and travel credentials grow at 6.6%, half again the market rate of 4.4%, because a statute requires a physical card and no wallet application satisfies that. Access credentials follow at 5.2%. Transit is the opposite case entirely, growing at 1.2% as open-loop bank card acceptance removes the reason for a dedicated ticket. East Asia holds 31% of card revenue, above the usual band.
Five manufacturers hold 62% of card revenue, which is unusually concentrated, and the chip inside represents 38% of what a finished card costs. Recycled and bio-sourced bodies now account for 27% of production, and they are one of the very few places in this category where a manufacturer can raise a price and be paid it. Manufacturers name a higher price there and issuers pay it. Certification for identity work drove that consolidation.
Market Definition
This market covers contactless and dual-interface smart cards as manufactured and personalised, including payment cards, national identity and travel documents, access control and employee credentials, transit and closed-loop ticketing cards, loyalty, gift and retail cards, and healthcare and social benefit cards. It excludes contact-only and magnetic stripe cards, subscriber identity modules and embedded equivalents, logistics tags, card readers and acceptance terminals, mobile wallet software, and the host systems behind any of these credentials.
Base Year Value
$12.6B in 2025 (MMA Primary Research Dataset, September 2026)
Forecast Period
2026 to 2036, eleven discrete annual values
CAGR
4.4% base case. Bull 5.6%. Bear 3.2%.
Fastest Growth Segment
National eID And Travel Documents: 6.6% CAGR
Fastest Growth Country
India: 8.4% CAGR
Fastest Growth Region
South Asia and Pacific: 6.5% CAGR
Largest Region
East Asia: 31% of 2025 global value
Market Leaders
Thales, IDEMIA, Giesecke+Devrient, CPI Card Group, and Goldpac lead the field. Source: MMA Primary Research Dataset, July 2026.
Primary Survey
n=3,800 procurement and R&D decision-makers, Q4 2025, six countries
Methodology
Demand-side build-up, cross-validated against public data, 47 expert interviews

Contactless Smart Card Market Forecast Scenarios

contactless-smart-card-market-size-forecast-scenario-1790011040867
Between 2020 and 2025 two forces pulled in opposite directions and roughly cancelled. Contactless acceptance expanded enormously during and after the pandemic, which lifted issuance across markets that had been slow to convert. Against that, phone wallets absorbed a growing share of actual transactions, and open-loop transit acceptance began removing closed-loop ticketing entirely. Historical growth of 3.4% is the residue of both movements.
The base case at 4.4% rests on three mechanisms. Government identity and travel document programmes require a physical credential by statute, which no wallet application replaces, and those programmes expand as more countries issue biometric documents. Access control migrates from older proximity technology to secure contactless credentials on security grounds. And recycled and bio-sourced card bodies raise unit prices in a category where price has fallen for two decades. None depends on payments.
The bull case at 5.6% depends on identity programmes in populous countries moving faster than currently scheduled, since a single national rollout moves regional volumes materially. The bear case at 3.2% is wallet substitution reaching issuance rather than only transactions: if banks stop shipping a card to customers who already hold a provisioned credential, payment volumes fall quickly and nothing replaces them.

The Credential And Its Replacement

Payment cards are being used less and issued about as much as before, which is a strange position for any product. Roughly 48% are provisioned into a phone wallet, after which the plastic mostly sits unused. Banks keep sending it because it is a fallback when a phone fails, an artefact customers still expect, and the most visible branded object a retail bank puts in a customer's hand.
TOP FIVE CONCENTRATION62%Share of card revenue held by the leading manufacturers
WALLET PROVISIONED SHARE48%Issued payment cards also loaded into a phone wallet
AVERAGE CARD PRICEUSD 1.24Delivered price averaged across all contactless card categories
RECYCLED SUBSTRATE SHARE27%Cards manufactured from recycled or bio-sourced body material
SECURE ELEMENT COST SHARE38%Chip cost measured against the finished card price
CARD REPLACEMENT CYCLE4.1 yearsTypical interval before an issued card is reissued
That leaves the category's growth somewhere other than payments. Identity and travel documents grow because a statute names a card and no application satisfies the requirement. Access credentials grow as older proximity technology is retired on security grounds. Transit does the reverse: every system that accepts bank cards at the gate has removed the reason for its own ticket, and closed-loop volumes fall accordingly.
Economically the card is a semiconductor product with printing attached. The secure element accounts for 38% of finished cost, and the 2021 shortage taught issuers that lesson unpleasantly. The one place prices move upward is substrate: recycled and bio-sourced bodies reach 27% of production and command a premium issuers will pay, largely because it appears in their own reporting.
"Ask a bank why it still posts a card to somebody who provisioned a wallet on day one and you get three answers, none of them about payments. It is a fallback, it is what customers expect, and it is the only physical object the brand still owns. That is a marketing argument holding up a manufacturing industry."
Practice Director, Secure Credentials and Payments Technology · MMA Technology Practice · September 2026

Market Trends

Statute Rather Than Convenience Sustains Card Demand

Identity documents, residence permits, driving credentials, and travel documents are specified in law as physical objects, and no wallet application changes that until legislation does. National identity and travel documents grow at 6.6%, the fastest here, and the buyer is a government procurement body rather than a bank. Those programmes run for years, specify security features in detail, and are almost entirely insensitive to unit price, which makes them the most attractive demand in the category by a distance. Qualification takes years of evaluation and audit, which keeps the field small and the returns durable.
Market Impact: Country grows at 8.4%

Open-Loop Acceptance Removes The Transit Ticket

Transit operators who accept ordinary bank cards at the gate no longer need to issue their own, and the closed-loop card that funded a large slice of this industry disappears with the upgrade. Transit and ticketing grows at just 1.2%, the slowest of any segment, while ridership rises. Concessionary and unbanked passengers still require a physical card, which sets a floor, but the general commuter volumes that made transit attractive are not coming back. Concessionary and unbanked passengers still require a physical credential, which sets a floor beneath the decline, but general commuter volumes are gone.
Market Impact: Covers 27% of production

Market Opportunities and Growth Drivers

Identity Programmes Issue At National Population Scale

A country issuing biometric identity documents to its adult population orders in volumes no commercial programme approaches, and those orders arrive with security specifications that only a handful of manufacturers can satisfy. Indian growth of 8.4% leads every country covered, supported by identity-linked payment issuance and national mobility credentials running concurrently. Contract terms typically run several years, which gives manufacturers volume visibility that the payment side of this business has never provided. Security specifications are written in detail and only a handful of manufacturers can satisfy them, which keeps the bidding field small.
Market Impact: Affects 48% of payment cards

Substrate Change Raises Prices For The First Time

Recycled and bio-sourced card bodies now account for 27% of production, and issuers pay a premium because the change appears directly in their own sustainability reporting rather than only in a specification. Average card prices reached USD 1.24 partly on that basis. It is the only movement in this category that has raised unit value in two decades, and manufacturers who invested early in qualified recycled material hold capacity competitors cannot replicate quickly. Qualifying recycled material and process takes long enough that capacity rather than issuer appetite currently limits how fast conversion proceeds.
Market Impact: Chip is 38% of cost

Market Restraints and Challenges

Wallet Provisioning Erodes The Reason To Reissue

Around 48% of payment cards are loaded into a phone wallet and then largely unused, and the root cause is that the card's transactional purpose transferred to a device the customer already carries. Commercially the risk is not usage but issuance: a bank that stops posting plastic to provisioned customers removes volume nothing replaces. Manufacturers respond by moving into identity and access work, by selling premium formats banks treat as marketing, and by supplying the provisioning process itself. Three arguments hold the issuance line: fallback, expectation, and branding. All three are softer than they look.
Market Impact: Segment grows at 6.6%

Secure Element Supply Sets The Real Constraint

The chip accounts for 38% of a finished card's cost and comes from a small number of semiconductor suppliers, and the root cause is that secure elements require certified fabrication that few facilities hold. Commercially this means card manufacturers cannot promise delivery independently of allocation decisions made elsewhere, as 2021 demonstrated. They respond with long-term supply agreements, qualified designs across multiple chip suppliers, and inventory positions that tie up considerable working capital. Requalification is expensive, and it costs considerably less than the issuer business lost when a delivery promise fails.
Market Impact: Segment grows at 1.2%
3 additional market trends, 4 additional growth drivers, and 2 additional restraints and challenges are covered in the full report. Contact sales@marketmindsadvisory.com to access the complete intelligence.

Segment CAGR and Growth Architecture

Segmentation follows credential application. Six categories cover the market: payment cards, national identity and travel documents, access control and employee credentials, transit and closed-loop ticketing cards, loyalty, gift and retail cards, and healthcare and social benefit cards. Personalisation and fulfilment are counted within the credential they serve rather than separately. Premium and metal formats sit within their credential application.
contactless-smart-card-market-market-share-analysis-1790011041454

National eID And Travel Documents

Identity and travel documents grow at 6.6%, half again the market rate of 4.4%, for a reason nothing in the payment market can match: a statute names a physical card, and no wallet application satisfies the requirement until legislation changes. The buyer is a government procurement body ordering at population scale, over contracts running several years, with security specifications only a handful of manufacturers can meet. Price sensitivity is minimal and volume visibility is excellent. It is the most attractive demand in this category and the hardest to enter, since qualification takes years. Programme timing follows political and budget cycles that no supplier influences at all. A deferred rollout removes expected volume for years at a time.
CAGR 6.6%

Access Control And Employee Credentials

Access credentials grow at 5.2% as organisations retire older proximity technology that security assessments no longer accept, and the replacement cycle is driven by risk review rather than by wear or expiry. Corporate, government, and critical infrastructure sites all face the same finding from their own auditors. The credential frequently combines physical access with logical authentication, which raises unit value well above payment card levels and attaches the manufacturer to an identity system rather than a print order. Displacement by phone credentials is real but slower than expected, because visitor and contractor populations still need a card. Audit findings rather than wear drive the replacement cycle here. Visitor and contractor populations sustain volume even where staff moved to phones.
CAGR 5.2%
Full segment breakdown across 6 segments available in the complete report.

Regional Architecture and Country Demand Map

Regional shares reflect issuance volume and manufacturing location together, since most cards are personalised close to the issuer. Three regions sit outside the standard bands, with the reason named in each paragraph and summarised for operator review below. Statutory demand and commercial demand behave nothing alike.

East Asia

At 31% this region sits above the standard band, and the justification is volume: China alone issues more cards annually than any other region, across bank payment, social security, transit, and residence credentials, and domestic manufacturers supply much of that demand and export beyond it. Japanese and Korean issuance skews toward higher specification credentials with correspondingly higher unit values. Growth of 5.4% exceeds the world rate. Wallet substitution is advanced in urban China, yet card issuance continues because so much of it is government mandated rather than commercial. Chinese manufacturers hold most of their domestic volume and compete internationally on price wherever security certification does not gate entry to a programme.
Share: 31% | CAGR: 5.4% (2026 to 2036)

Western Europe

Identity document programmes across the region issue biometric credentials on regular renewal cycles, which provides steady volume insulated from anything happening in payments. Several of the largest manufacturers are headquartered here and set security specifications used worldwide. Growth of 2.9% is the slowest of the seven regions, held down by mature payment issuance and by transit systems converting to open-loop acceptance faster than elsewhere. Recycled and bio-sourced substrate adoption is furthest advanced here, driven by issuer reporting obligations rather than by customer demand. Government identity work is the anchor here, and the security specifications written by regional authorities are adopted well beyond the countries that wrote them. Transit conversion to open-loop acceptance has run faster here than anywhere else covered.
Share: 22% | CAGR: 2.9% (2026 to 2036)
Regional intelligence for 5 additional markets available in the complete report: North America, South Asia and Pacific, Latin America, Middle East and Africa, Eastern Europe. Contact sales@marketmindsadvisory.com.
contactless-smart-card-market-country-cagr-analysis-1790011041977

Where Card Makers Still Earn

Four commercial moves separate manufacturers with a future from those defending payment card volumes that a phone already replaced in practice. Each moves the business toward demand created by statute, by security policy, or by an issuer's own reporting obligations rather than by consumer behaviour. Consumer preference is the one force none of them relies on at all.

Qualify Into Government Identity Programmes Early

Identity and travel documents grow at 6.6% with contracts running several years, population-scale volumes, and almost no price sensitivity, which is the opposite of every characteristic the payment business has. Qualification takes years of security evaluation and audit, and manufacturers holding it win 3.6 times more of these awards than those bidding without it. The barrier that makes entry hard is the same barrier that protects the position once established, which is why it is worth funding. Programme timing follows political and budget cycles nobody influences, which is the cost of the position.
Market Impact: Wins 3.6 times more awards in identity programmes

Sell Substrate Change Into Issuer Reporting

Recycled and bio-sourced bodies reach 27% of production and issuers pay a premium because the change appears directly in their own published reporting, not merely in a specification document. Manufacturers holding qualified recycled material capacity realise unit prices 18 to 26% above conventional equivalents on those lines. It is the only movement in this category that has raised prices in twenty years, and capacity qualification takes long enough that early investment still holds an advantage. Issuers cite the change in published reporting, which is why it survives procurement review. Procurement review rarely challenges it.
Market Impact: Realises unit prices 18 to 26% above conventional

Follow Access Credentials Into Identity Systems

Access credentials grow at 5.2% as security assessments retire older proximity technology, and the modern credential combines physical access with logical authentication, which raises unit value far above payment cards. Manufacturers supplying the credential alongside enrolment and lifecycle management attach to an identity system rather than a print order, and report account retention 2.8 times higher. Visitor and contractor populations sustain card volume even where employees have moved to phone credentials entirely. The credential frequently combines physical access with logical authentication, which raises unit value well above payment card levels.
Market Impact: Raises account retention 2.8 times above the base

Secure Chip Supply Across Multiple Qualified Sources

The secure element is 38% of finished card cost and comes from a small number of certified fabrication sources, so delivery promises depend on allocation decisions made elsewhere. Manufacturers qualifying card designs across several chip suppliers maintained delivery through the 2021 shortage while single-sourced competitors could not, and won issuer business that has largely stayed with them. Requalification costs are real and considerably smaller than the volume lost when supply fails. Issuers remember which suppliers kept delivering, and several of those relationships have not moved since. That memory is worth more than the requalification cost.
Market Impact: Chip covers 38% of the finished card cost

Who Controls the Margin Pool

Concentration is high and rising. Five manufacturers hold 62% of card revenue, measured consistently on that basis across all participants, and security qualification for identity work has been the main consolidating force, since it takes years and considerable audit expense to obtain. Chinese manufacturers hold most of their domestic volume and compete on price internationally in commercial segments.
Competition currently turns on three things: security certification depth for government identity programmes, qualified recycled substrate capacity that issuers can cite in their reporting, and chip supply arrangements broad enough to promise delivery honestly. Printing quality and personalisation throughput decide comparatively little now, though both were once differentiators. Personalisation proximity matters commercially rather than technically, because cards must be encoded and posted domestically, which keeps that revenue close to the issuer regardless of where manufacturing happens.

Pressure comes from two directions. Wallet provisioning keeps weakening the argument for issuing payment cards at all. Meanwhile Chinese manufacturers compete hard on price wherever certification does not gate entry. Rankings will shift toward manufacturers anchored in identity and access credentials, since both are created by statute or security policy rather than by consumer preference. Payment-only manufacturers hold the weakest position here.
contactless-smart-card-market-company-positioning-matrix-1790011042506

Competitive Moat and Risk Dimensions

THALES

Moat: Government Identity Qualification Depth

Security evaluations, audits, and national programme references accumulated over decades gate participation in identity work that competitors cannot enter without years of preparation. Those contracts run for years at population scale with minimal price sensitivity, which is the most attractive demand in the category and the least exposed to anything happening in payments.
THALES

Risk: Payment Volume Long Decline

A substantial payment card business faces wallet provisioning that has already reached 48% of issued cards and continues rising, and the risk is issuance rather than usage. Growing identity and access revenue fast enough to offset that decline means winning programmes that come to market on government timetables nobody controls.
IDEMIA

Moat: Biometric Enrolment And Lifecycle

Capability spanning enrolment, biometric capture, credential production, and lifecycle management lets the company supply an identity programme rather than a card order, which is a considerably larger and stickier position. Governments buying a working programme rather than a printed object rarely change supplier between renewal cycles once operations depend on it.
IDEMIA

Risk: Programme Timing And Concentration

Revenue tied to a limited number of large national programmes moves with political timetables, budget cycles, and elections that the company cannot influence, and a deferred rollout removes expected volume for years. Diversifying into commercial segments means competing where price rather than certification decides the award.

Players Tracked

Prominent Players

Thales
IDEMIA
Giesecke+Devrient
CPI Card Group
Goldpac

Other Key Players

Eastcompeace
Hengbao
Wuhan Tianyu
Watchdata
HID Global
Infineon Technologies
NXP Semiconductors
Samsung
Toppan
Dai Nippon Printing
Kona I
Valid
ABCorp
Perfect Plastic Printing
Austriacard

Recent Developments

MARCH 2026

Giesecke+Devrient Expands Qualified Recycled Substrate Production Capacity

Giesecke and Devrient completed an organic capacity expansion for qualified recycled and bio-sourced card bodies, funded internally with no partner involved, after issuer demand for material they could cite in published reporting outran available supply. Capacity rather than issuer appetite had been limiting conversion across the industry.
Signal: Substrate is the only line where issuers accept a price increase, and capacity qualification takes years.
OCTOBER 2025

CPI Card Group Acquires Personalisation And Fulfilment Services Business

CPI Card Group completed an acquisition of a card personalisation and fulfilment business, adding capacity close to issuers in markets where cards must be encoded and posted domestically rather than shipped finished across borders. Proximity to the issuer rather than manufacturing scale decides who captures this revenue.
Signal: Personalisation stays close to the issuer, so proximity rather than manufacturing scale decides that revenue. Acquisitions follow issuer geography.
JUNE 2025

Goldpac Signs Multi-Year Card Supply Agreement With National Bank

Goldpac entered a multi-year supply agreement covering contactless payment card production for a national bank, with volumes committed across the term and no acquisition, joint venture, or equity investment involved in the arrangement. Committed volume across the term gives both parties visibility that spot purchasing cannot provide.
Signal: Committed multi-year volume matters more than unit price where chip allocation constrains delivery promises. Allocation decides delivery here.

What A Card Costs To Produce

Three input groups dominate cost. The secure element chip and antenna inlay run 36% to 44% of cost of goods sold from a small number of certified semiconductor suppliers. Card body substrate takes 14% to 20%, with the range reflecting the premium recycled and bio-sourced material carries. Personalisation, encoding, and fulfilment add 22% to 30%, performed close to the issuer rather than at the point of manufacture.
Secure element supply tightened severely through 2021 and again more mildly across 2024, and several card manufacturers described allocation constraints directly in their annual reports for those years. SEMI equipment data showed certified capacity additions arriving well behind requirement, since secure fabrication cannot be brought online quickly. Manufacturers single-sourced on chips lost issuer business that has largely stayed with the competitors who could still deliver.

The competitive disadvantage mechanism runs through certification rather than manufacturing efficiency. A manufacturer without government security evaluation cannot bid identity work at any price, and obtaining it requires years of audit and evaluation expense funded before any revenue arrives. Exposure varies sharply by manufacturer type: certified participants compete in the most attractive demand, while uncertified ones are confined to commercial segments where price alone decides.
contactless-smart-card-market-cost-volatility-analysis-1790011042702

Qualify Card Designs Across Several Chip Suppliers

Secure elements come from a small certified supplier base and allocation follows committed volume rather than order date, so a single-sourced design leaves delivery promises hostage to decisions made elsewhere. Requalification across suppliers costs real money and considerably less than the issuer business lost when supply fails, as 2021 demonstrated across the whole industry.

Invest In Recycled Substrate Qualification Ahead Of Demand

Qualified recycled and bio-sourced material is the one input where issuers accept a higher price, because the change appears in their own published reporting. Qualification of material and process takes long enough that early investment still holds an advantage, and capacity currently constrains conversion more than issuer appetite does anywhere. Early investment still holds an advantage.

Locate Personalisation Capacity Close To Issuers

Encoding and fulfilment are performed near the issuer because cards must be posted domestically and data rarely crosses borders freely, so this cost cannot be moved to wherever manufacturing is cheapest. Proximity rather than scale decides who captures it, which is why acquisitions in this part of the business follow issuer geography closely. Scale cannot substitute for proximity.

Portfolio Architecture for Margin Defence

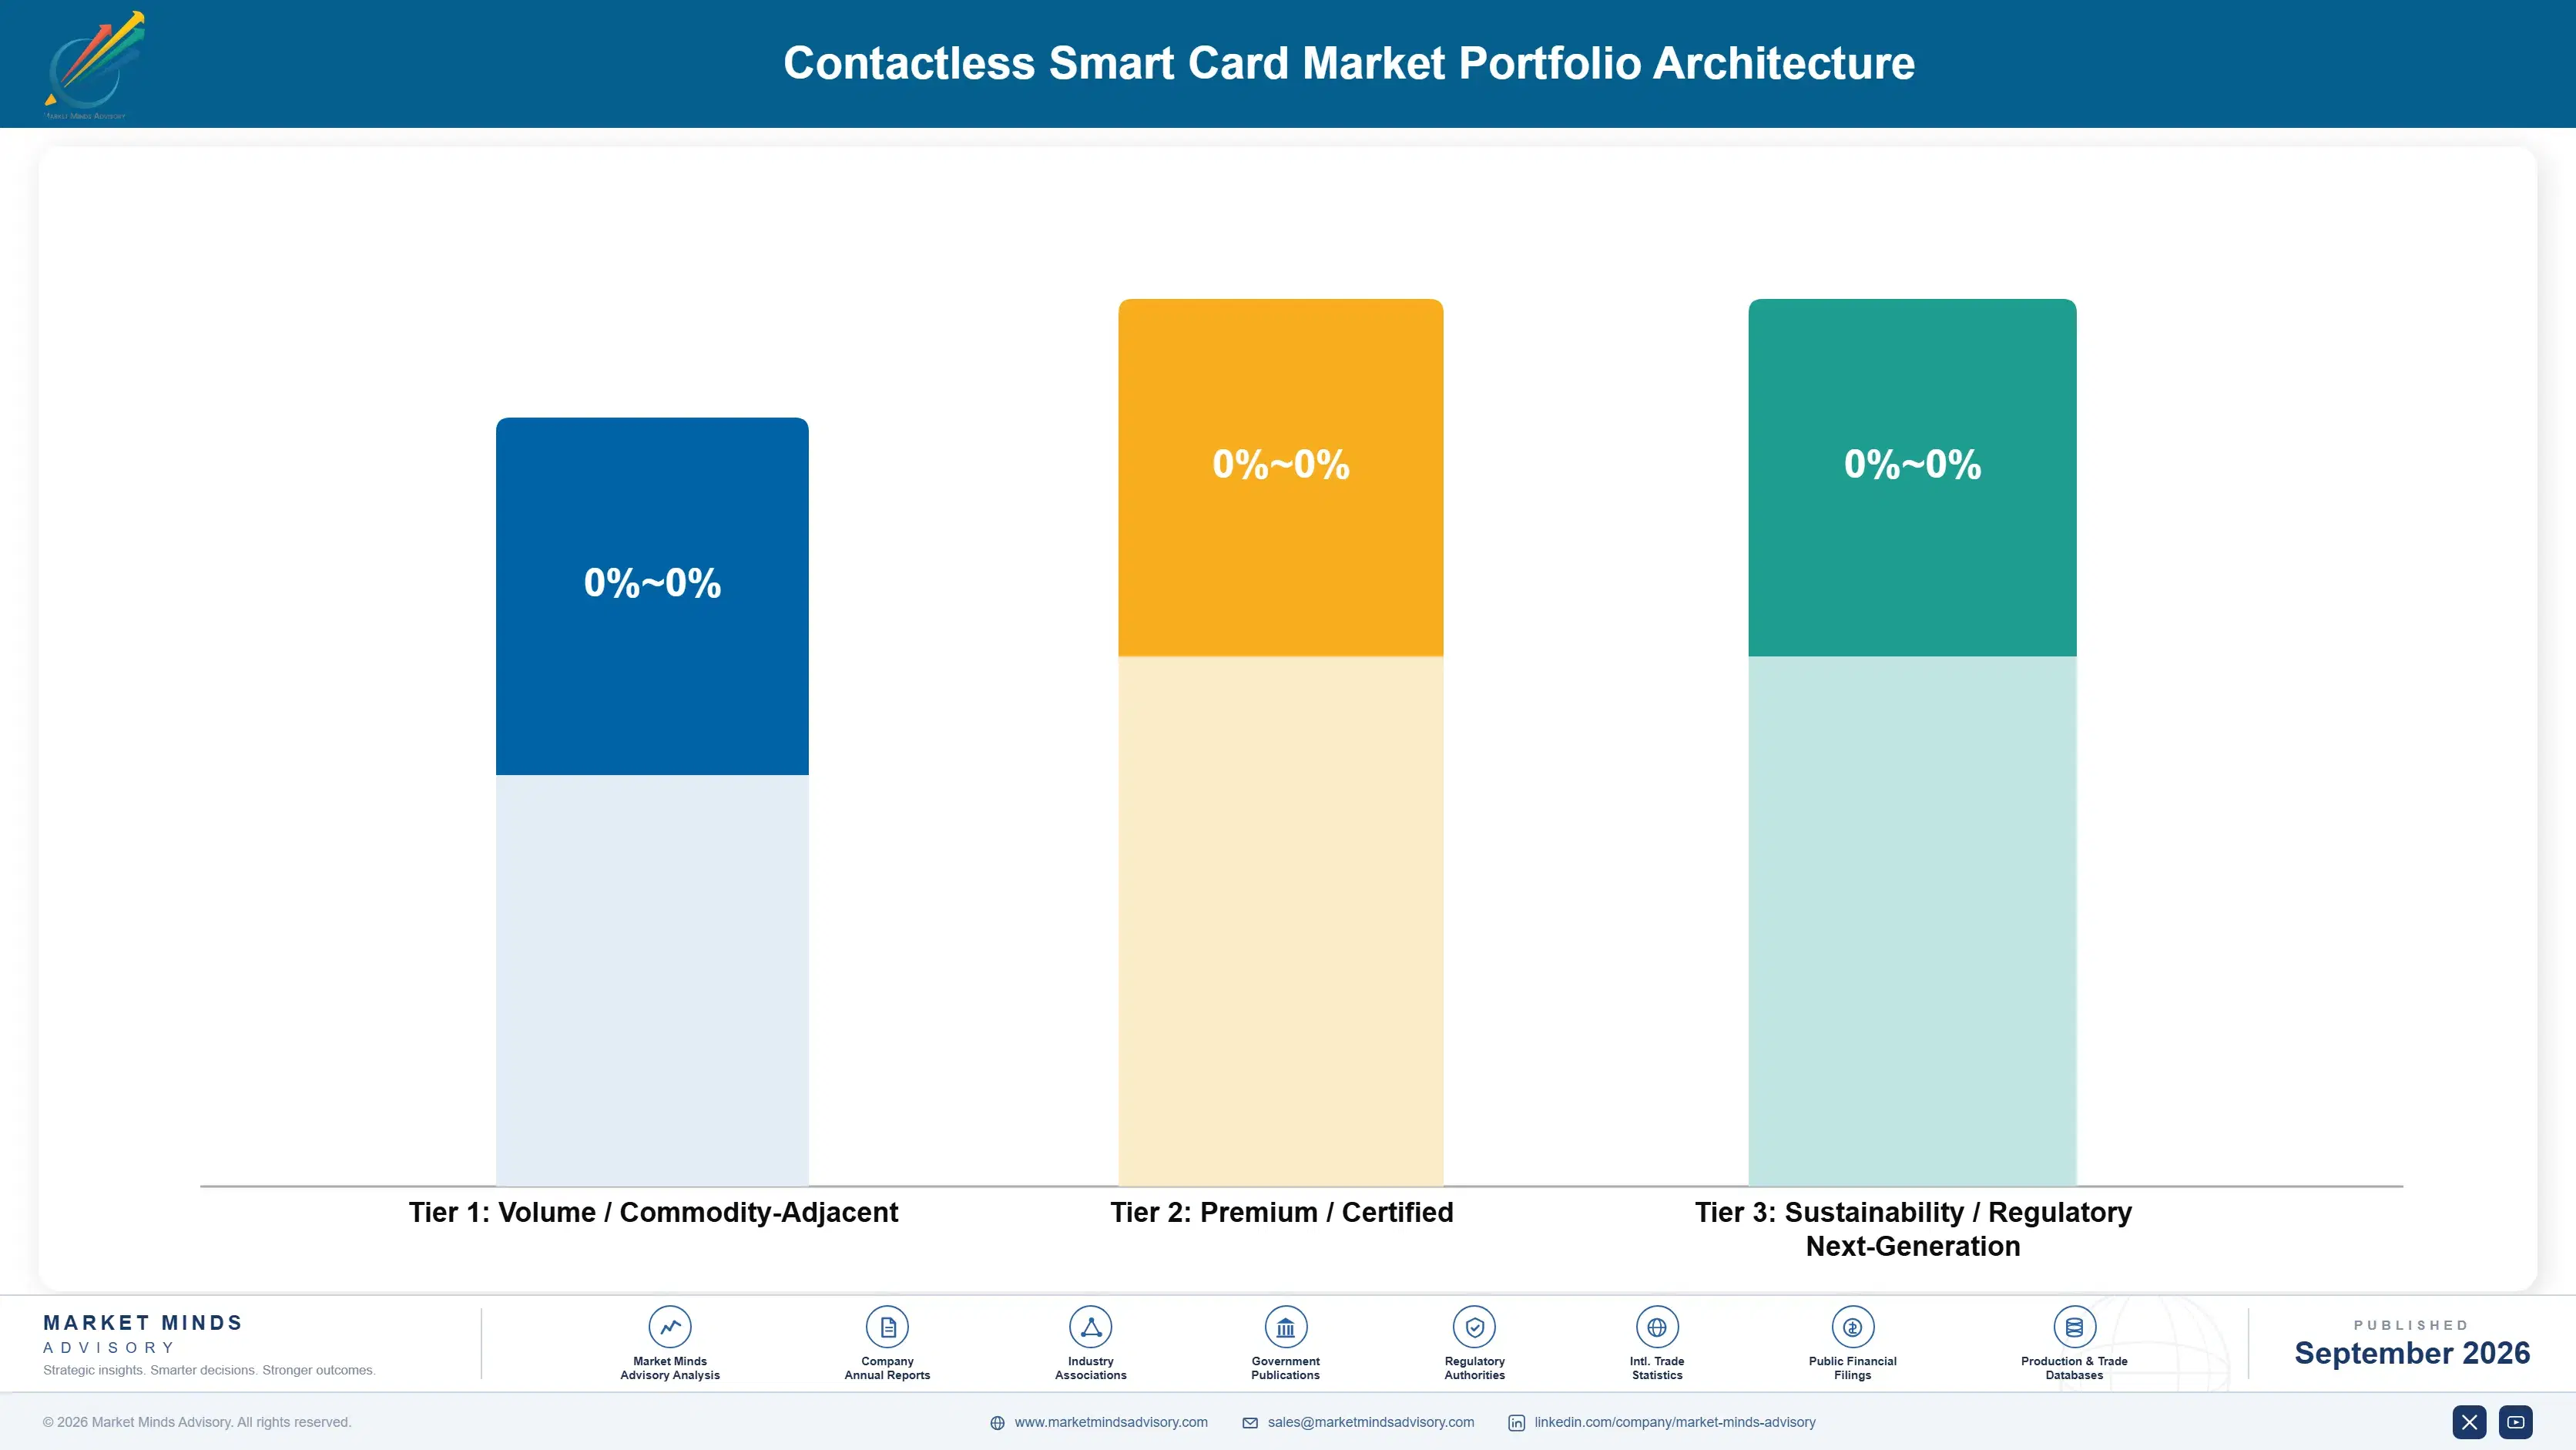
Margin follows what created the demand. Commercial payment cards are close to commodity, since wallet provisioning weakens the product and Chinese manufacturers compete on price wherever certification does not gate entry. Access credentials earn better because they attach to an identity system. Government identity documents earn most, because qualification limits the field and price sensitivity is minimal across programmes running several years. Certification rather than manufacturing capability decides this entire hierarchy.
The tension between volume and premium runs through who specifies the card. A bank procurement team buys millions of units at cents of difference and switches supplier readily. A government identity programme names security features, evaluation levels, and audit requirements, then stays with a qualified supplier through renewal cycles. The two require different companies, and few manufacturers genuinely serve both well.

High-value pools concentrate where the credential proves identity rather than authorising a payment: national documents, travel credentials, critical infrastructure access, and any programme where a security evaluation gates supply. None of those buyers is price led. Where the card carries a payment credential a phone already holds, price decides everything and volume is the only defence available. Volume is the only defence remaining there.

Volume / Commodity-Adjacent

Commercial payment, loyalty, and gift cards sold on delivered price, where wallet provisioning weakens the product and price competition is severe. The ten-point range reflects chip purchasing scale and personalisation proximity rather than any capability difference between manufacturers.
Gross Margin: 16% to 26%

Premium / Certified

Access credentials, healthcare and benefit cards, and premium formats where security requirements or brand specification limit the field. The twelve-point range separates manufacturers attached to identity and lifecycle systems from those supplying credentials as printed articles.
Gross Margin: 32% to 44%

Sustainability / Regulatory / Next-Generation

Government identity and travel documents plus qualified recycled substrate lines, where certification gates entry and issuers accept higher prices willingly. The fourteen-point range reflects security evaluation depth and whether a manufacturer supplies programmes or merely cards.
Gross Margin: 46% to 60%
contactless-smart-card-market-portfolio-architecture-1790011043210

High-value Sub-segments and Strategic Watch-out

Government Identity Documents

Highest value and fastest growth at 6.6%, created by statute rather than consumer behaviour, with multi-year contracts at population scale and minimal price sensitivity. The fourteen-point range reflects security evaluation depth and whether the supplier delivers a programme or a card. Programme timing follows political cycles nobody controls.
Gross Margin: 48% to 62%

Qualified Recycled Substrate Lines

The one line where prices rose, reaching 27% of production as issuers pay premiums for material they cite in published reporting. The twelve-point range reflects qualification maturity, since capacity rather than issuer appetite currently limits conversion across the industry. It is the only price rise in twenty years.
Gross Margin: 38% to 50%

Access And Employee Credentials

Volume core growing at 5.2% as security assessments retire older proximity technology across corporate and government sites. The ten-point range separates suppliers attached to enrolment and lifecycle systems from those delivering credentials as a print order alone. Audit findings rather than wear drive replacement here.
Gross Margin: 34% to 44%

Commercial Payment Card Supply

The strategic watch-out. Wallet provisioning already covers 48% of issued cards, banks may eventually stop posting plastic entirely, and price competition is severe wherever certification does not apply. The ten-point range reflects purchasing scale and nothing defensible. Three marketing arguments hold this volume up. None of them concerns payments.
Gross Margin: 14% to 24%

How Card Revenue Repeats

Cards reissue on roughly a 4.1 year cycle, which gives this business a predictable replacement rhythm that few hardware categories enjoy. Identity documents renew on longer statutory cycles, typically five to ten years, but at population scale and with dates known far in advance. The reissue cycle is the annuity here, and anything that lengthens or removes it, as wallet provisioning threatens to, matters more than any single order.
Attachment depth follows certification and system integration rather than commercial relationship. A government whose enrolment, personalisation, and lifecycle management run through one supplier does not change between renewals, because the operational risk outweighs any price advantage available. A bank buying printed payment cards has no attachment whatsoever and retenders on price, which describes most of the volume in this industry.

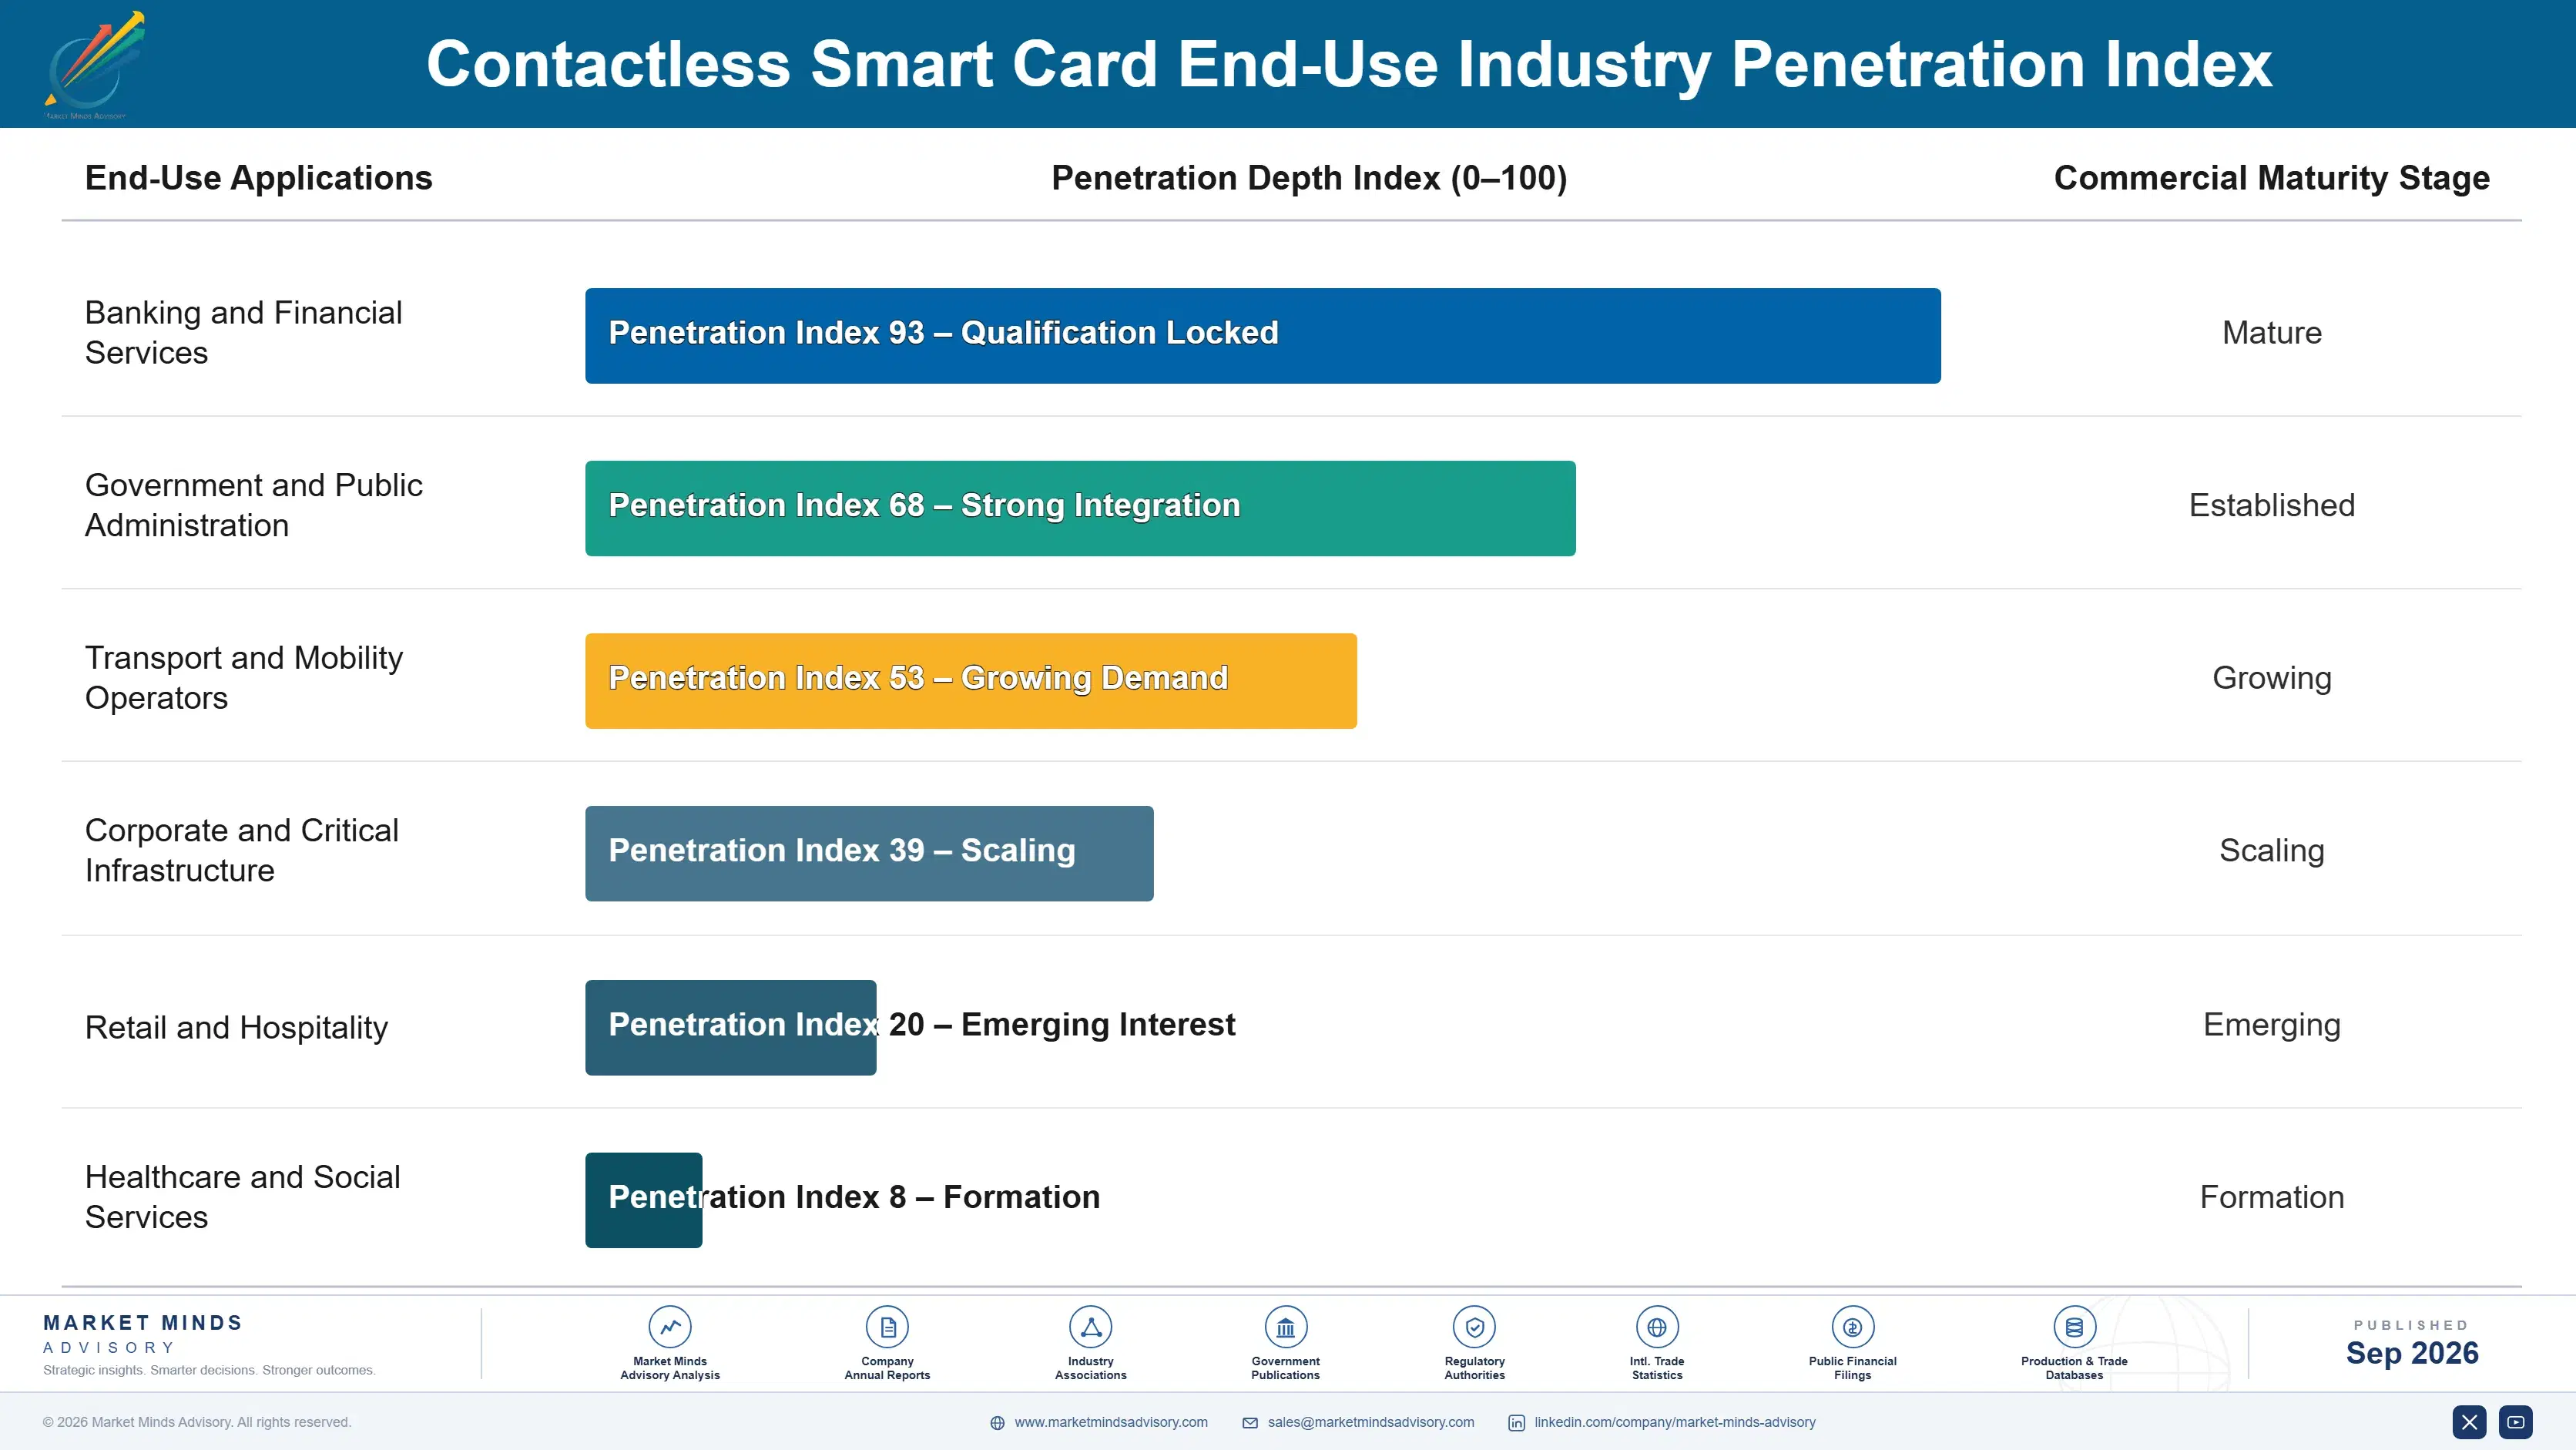
The buyer has shifted from bank procurement toward government programme offices and corporate security functions. Payment card purchasing was a printing decision made on unit cost, and it still is. Identity programmes are specified by officials naming evaluation levels, and access credentials by security teams responding to audit findings. Manufacturers selling print quality and throughput are addressing the buyer with the least money and the weakest loyalty.
contactless-smart-card-market-end-use-penetration-index-1790011043705

Where This Market Rewards

These are among the four positions where our research anticipates prominent divergence between winners and laggards over the coming forecast period. Each is grounded in the demand model, the regulatory perimeter, and the announced capacity pipeline.
01 / STATUTORY DEMAND FOCUS

Chase demand that a law actually creates

Identity and travel documents grow at 6.6% because legislation names a physical credential, and no wallet application satisfies that requirement until the law itself changes somewhere. Those contracts run several years at population scale with minimal price sensitivity, and manufacturers holding security qualification win 3.6 times more of them. The evaluation barrier that makes entry slow is the same barrier that protects the position afterwards, though programme timing follows political cycles nobody influences at all, so a deferred rollout can remove expected volume for years.
02 / SUBSTRATE PREMIUM CAPTURE

The only price rise in twenty years

Recycled and bio-sourced card bodies reached 27% of production because issuers pay a premium for material they can cite directly in their own published reporting rather than merely in a specification. Manufacturers with qualified capacity realise unit prices 18 to 26% above conventional equivalents on those lines. Qualification takes long enough that early investment still holds an advantage, and capacity rather than appetite limits conversion today, which is why early investors still hold an advantage, and issuer appetite is not what limits conversion today.
03 / CHIP SUPPLY REDUNDANCY

Delivery promises depend on somebody else

The secure element represents 38% of a finished card's cost and comes from a small number of certified fabrication sources whose allocation decisions no card manufacturer controls at all. Those qualified across several chip suppliers kept delivering through the 2021 shortage and won issuer business that has largely stayed with them since. Requalification costs real money and considerably less than the volume lost when supply fails, as the whole industry learned in a single year, and issuers remember exactly who kept delivering through it.
04 / ISSUANCE RISK RECOGNITION

Usage already fell, issuance is next

Around 48% of payment cards are provisioned into a phone wallet and then largely unused, yet banks keep posting plastic for fallback, expectation, and branding reasons rather than payment ones. The commercial exposure is issuance rather than usage, because a bank that stops sending cards to provisioned customers removes volume nothing replaces. Manufacturers treating payments as their core business are relying on three marketing arguments, none of which is a payment argument at all, and every one of them is softer than it appears.

Engagement Snapshot From the Field

A live engagement with an industry participant carrying material or product regulatory and market exposure ahead of a defining policy shift, showing how our research translates into a defensible multi-year portfolio strategy.
MARKET MINDS ADVISORY · CLIENT ENGAGEMENT SUMMARY
Contactless Smart Card Producer Strategic Portfolio Review and Transition Roadmap 2026·Investment Scenario on Contactless Smart Card Exposure Evaluation 2025-26
CLIENT PROFILE
A retail banking group operating across five countries with roughly 14 million active cardholders, issuing approximately 4.1 million contactless cards annually at a delivered cost near USD 6.2 million including personalisation and postage (client-reported, unverified by MMA). Wallet provisioning had reached 61% of newly issued cards across the group. No supplier alternative had been qualified against a different chip source.
STRATEGIC CHALLENGE
Finance had proposed stopping card issuance for customers who provisioned a wallet within thirty days, projecting substantial savings. Retail banking objected on customer experience grounds and marketing objected on brand grounds, and nobody had measured what happened to customers who genuinely had no card in hand. The argument had run for two quarters.
MMA APPROACH
MMA analysed transaction behaviour for provisioned cardholders over eighteen months, separating customers who used plastic occasionally from those who never did, and measured what occurred when a device was lost, replaced, or failed. Complaint records and card replacement requests were reconciled against the same population. Substrate conversion economics were assessed alongside the issuance question.
KEY FINDINGS
  1. Of provisioned cardholders, 34% still used the physical card at least monthly, concentrated in older customers and in cross-border travel where wallet acceptance was inconsistent.
  2. Device replacement generated 71,000 emergency card requests annually, at a per-unit fulfilment cost roughly 4.8 times the cost of routine issuance in bulk.
  3. Customers holding no physical card showed measurably lower usage of the group's other products, though the review could not establish whether that relationship was causal.
  4. Recycled substrate conversion, unrelated to the issuance question, would raise card cost 21% while satisfying a reporting commitment the group had already published.
CLIENT PROFILE
A retail banking group operating across five countries with roughly 14 million active cardholders, issuing approximately 4.1 million contactless cards annually at a delivered cost near USD 6.2 million including personalisation and postage (client-reported, unverified by MMA). Wallet provisioning had reached 61% of newly issued cards across the group. No supplier alternative had been qualified against a different chip source.
STRATEGIC CHALLENGE
Finance had proposed stopping card issuance for customers who provisioned a wallet within thirty days, projecting substantial savings. Retail banking objected on customer experience grounds and marketing objected on brand grounds, and nobody had measured what happened to customers who genuinely had no card in hand. The argument had run for two quarters.
MMA APPROACH
MMA analysed transaction behaviour for provisioned cardholders over eighteen months, separating customers who used plastic occasionally from those who never did, and measured what occurred when a device was lost, replaced, or failed. Complaint records and card replacement requests were reconciled against the same population. Substrate conversion economics were assessed alongside the issuance question.
KEY FINDINGS
  1. Of provisioned cardholders, 34% still used the physical card at least monthly, concentrated in older customers and in cross-border travel where wallet acceptance was inconsistent.
  2. Device replacement generated 71,000 emergency card requests annually, at a per-unit fulfilment cost roughly 4.8 times the cost of routine issuance in bulk.
  3. Customers holding no physical card showed measurably lower usage of the group's other products, though the review could not establish whether that relationship was causal.
  4. Recycled substrate conversion, unrelated to the issuance question, would raise card cost 21% while satisfying a reporting commitment the group had already published.
RECOMMENDED STRATEGY
Phase 1: Phase one: keep issuing cards by default and offer an opt-out at provisioning, rather than withdrawing plastic from customers who never chose that. Phase 2: Phase two: convert the entire issued range to qualified recycled substrate, funding the premium from the opt-out savings rather than from marketing budget. Phase 3: Phase three: qualify a second card supplier on a different chip source, since the current single supply route had already caused one delivery failure.
OUTCOME
Opt-out uptake reached 19% within two quarters, below finance projections and above marketing fears (client-reported, unverified by MMA). Recycled conversion completed across the range within a year. Emergency replacement requests fell 26% after the opt-out flow explained the fallback role clearly. A second supplier was qualified on an alternative chip source.

Frequently Asked Questions

Foundational context covering the market sizes, CAGR, scope, country, region and competition that inform every finding below. This section is provided to cover basics and most often pre-purchase conversations, answered from the MMA Primary Research Dataset.

What is the current size of the Contactless Smart Card Market?

The market was worth USD 12.6 billion in 2025 and reaches USD 13.2 billion in 2026. Value covers manufactured and personalised cards, excluding readers and host systems.

How large will the Contactless Smart Card Market be by 2036?

MMA forecasts USD 20.3 billion by 2036, an increase of USD 7.1 billion across the forecast period. That represents 1.54 times the 2026 base of USD 13.2 billion.

What is the CAGR for the Contactless Smart Card Market 2026 to 2036?

The base case compound annual growth rate is 4.4%, with a bull case at 5.6% and a bear case at 3.2%. Historical growth from 2020 to 2025 ran at 3.4%.

Which segment is growing fastest?

National identity and travel documents grow at 6.6%, half again the market rate of 4.4%. A statute names a physical card, which no wallet application can satisfy.

Who are the major companies in the Contactless Smart Card Market?

Thales, IDEMIA, Giesecke+Devrient, CPI Card Group, and Goldpac lead, together holding 62% of card revenue. Security qualification for identity work has driven most of that consolidation.

Which country is growing fastest?

India grows at 8.4%, supported by identity-linked payment issuance and national mobility credentials running concurrently at a population scale nothing else currently comes close to matching.

Report Segmentation Architecture

The full report scope spans multiple orthogonal segmentation dimensions, with cross-tabulated demand data provided for each dimension pair. Coverage extends further to regional breakdowns, trend trajectories, and the competitive detail needed to support segment-level decision-making.

By Credential Application

  • Payment Cards
  • National Identity and Travel Documents
  • Access Control and Employee Credentials
  • Transit and Closed-Loop Ticketing
  • Loyalty, Gift and Retail Cards
  • Healthcare and Social Benefit Cards

By End-Use Industry

  • Banking and Financial Services
  • Government and Public Administration
  • Transport and Mobility Operators
  • Corporate and Critical Infrastructure
  • Retail and Hospitality
  • Healthcare and Social Services

By Commercial Dimension

  • Government Programme Tender
  • Bank Procurement Contract
  • Systems Integrator Supply
  • Personalisation Bureau Service
  • Distributor and Reseller Channel
  • Qualified Recycled Substrate Line

By Region

  • East Asia
  • Western Europe
  • North America
  • South Asia and Pacific
  • Latin America
  • Middle East and Africa
  • Eastern Europe

Scope, Methodology, and Coverage

Every figure in this report is reproducible from documented input assumptions. The scope below maps the historical period, the forecast horizon, the segmentation dimensions, and the countries covered, alongside the underlying primary and qualitative methodology.
Historical Period
2020 to 2025
Forecast Period
2026 to 2036
Base Year
2025 (USD billions; MMA Primary Research Dataset, September 2026)
Market Definition
This market covers contactless and dual-interface smart cards as manufactured and personalised, including payment cards, national identity and travel documents, access control and employee credentials, transit and closed-loop ticketing cards, loyalty, gift and retail cards, and healthcare and social benefit cards. It excludes contact-only and magnetic stripe cards, subscriber identity modules, logistics tags, readers and acceptance terminals, mobile wallet software, and credential host systems.
Quantitative Units
USD billions, card manufacture and personalisation revenue
Segmentation Dimensions
Credential application, end-use industry, commercial dimension, region
Regions Covered
East Asia, Western Europe, North America, South Asia and Pacific, Latin America, Middle East and Africa, Eastern Europe
Countries Covered
China, Japan, South Korea, Taiwan, Germany, France, United Kingdom, Netherlands, Austria, Spain, Italy, Sweden, United States, Canada, Mexico, India, Indonesia, Vietnam, Thailand, Australia, Brazil, Mexico, Colombia, Chile, Saudi Arabia, United Arab Emirates, Nigeria, South Africa, Poland, Czechia
Key Companies Profiled
Thales, IDEMIA, Giesecke+Devrient, CPI Card Group, Goldpac, Eastcompeace, Hengbao, Wuhan Tianyu, Watchdata, HID Global, Infineon Technologies, NXP Semiconductors, Samsung, Toppan, Dai Nippon Printing, Kona I, Valid, ABCorp, Perfect Plastic Printing, Austriacard
Quantitative Methodology
Primary survey, n=3,800 respondents, Q4 2025, six countries; demand-side model with trade association cross-validation
Qualitative Methodology
47 expert interviews, Q4 2025; applied to validate demand model assumptions, identify emerging dynamics, and assess competitive positioning
Report Format
PDF and XLSX data workbook (Word format preview document)
Publisher
Market Minds Advisory
Report Code
MMA-2026-TEC-761
Published
September 2026
Contact
sales@marketmindsadvisory.com | www.marketmindsadvisory.com

Purchase the full Contactless Smart Card Market Report (2026 to 2036).

The full report sizes the contactless smart card market across six credential applications, seven regions, and thirty countries, with forecasts to 2036 under base, bull, and bear cases. It examines why wallet provisioning threatens issuance rather than usage, how statutory identity demand behaves differently from bank procurement, and what recycled substrate conversion has done to unit pricing. Competitive analysis covers twenty participants evaluated consistently on card revenue, with detailed treatment of security qualification and chip supply arrangements. Cost structure, margin architecture, and regional issuance drivers are analysed throughout. Primary research includes 3,800 survey responses and 47 expert interviews.
Six credential applications sized and forecast separately
Twenty participants evaluated on card and personalisation revenue
Regional issuance and manufacturing patterns across seven distinct geographies
Margin architecture by application and certification requirement
Wallet provisioning measured against issuance and reissue behaviour
Recycled substrate premium analysis across qualified production capacity

Built For The People Who Decide

From boardroom strategy to bench-side execution, this report is read cover-to-cover by leaders shaping the next decade of their industry, turning demand scenarios, market dynamics and valuation benchmarks into decisions.
CXOs/ Presidents/ VPs/ Managers
M&A and Corporate Development
Strategy Teams and R&D Heads
Procurement and Product Directors
Regulatory and Compliance Leaders
Investor Relations and Equity Analysts