Market Minds Advisory
Consumer Electronics Packaging Market

Consumer Electronics Packaging Market: Where The Box Follows The Assembly Line

Packaging is consumed where devices are assembled, not where they are bought. Every plant that moves from Guangdong to Bac Ninh or Sriperumbudur takes its converter demand along with it, permanently.

Lead Analyst

Bilal Shaikh

Published

September 2026

Make Smarter Decisions with Customized Research Insights

Request a free sample report and evaluate market opportunities, growth trends, and competitive dynamics relevant to your business needs.

2025 MARKET VALUE$27.4BMarket Size 2025
2036 FORECAST VALUE$49.9BBase Case , 2026 to 2036
CAGR 2026 TO 20365.6 %Bull 6.9% / Bear 4.4%
INCREMENTAL OPPORTUNITY$21.0BNet 10- year value creation
EXPANSION MULTIPLE1.72x2036 value over 2026 base
Strategic Levers
M&A Pipeline
Regional Outlook
Country Rankings
Competitive Intelligence
Segmental Deep-dive
Call-Us : 91 93563 13602

Executive Snapshot and Market Trajectory

Geography in this market is set by assembly rather than by sales. A carton is filled at the plant where the device itself is physically built and tested, so converter demand instead sits in Shenzhen, Bac Ninh, and Sriperumbudur regardless of where that phone is eventually sold, shipped, or used.
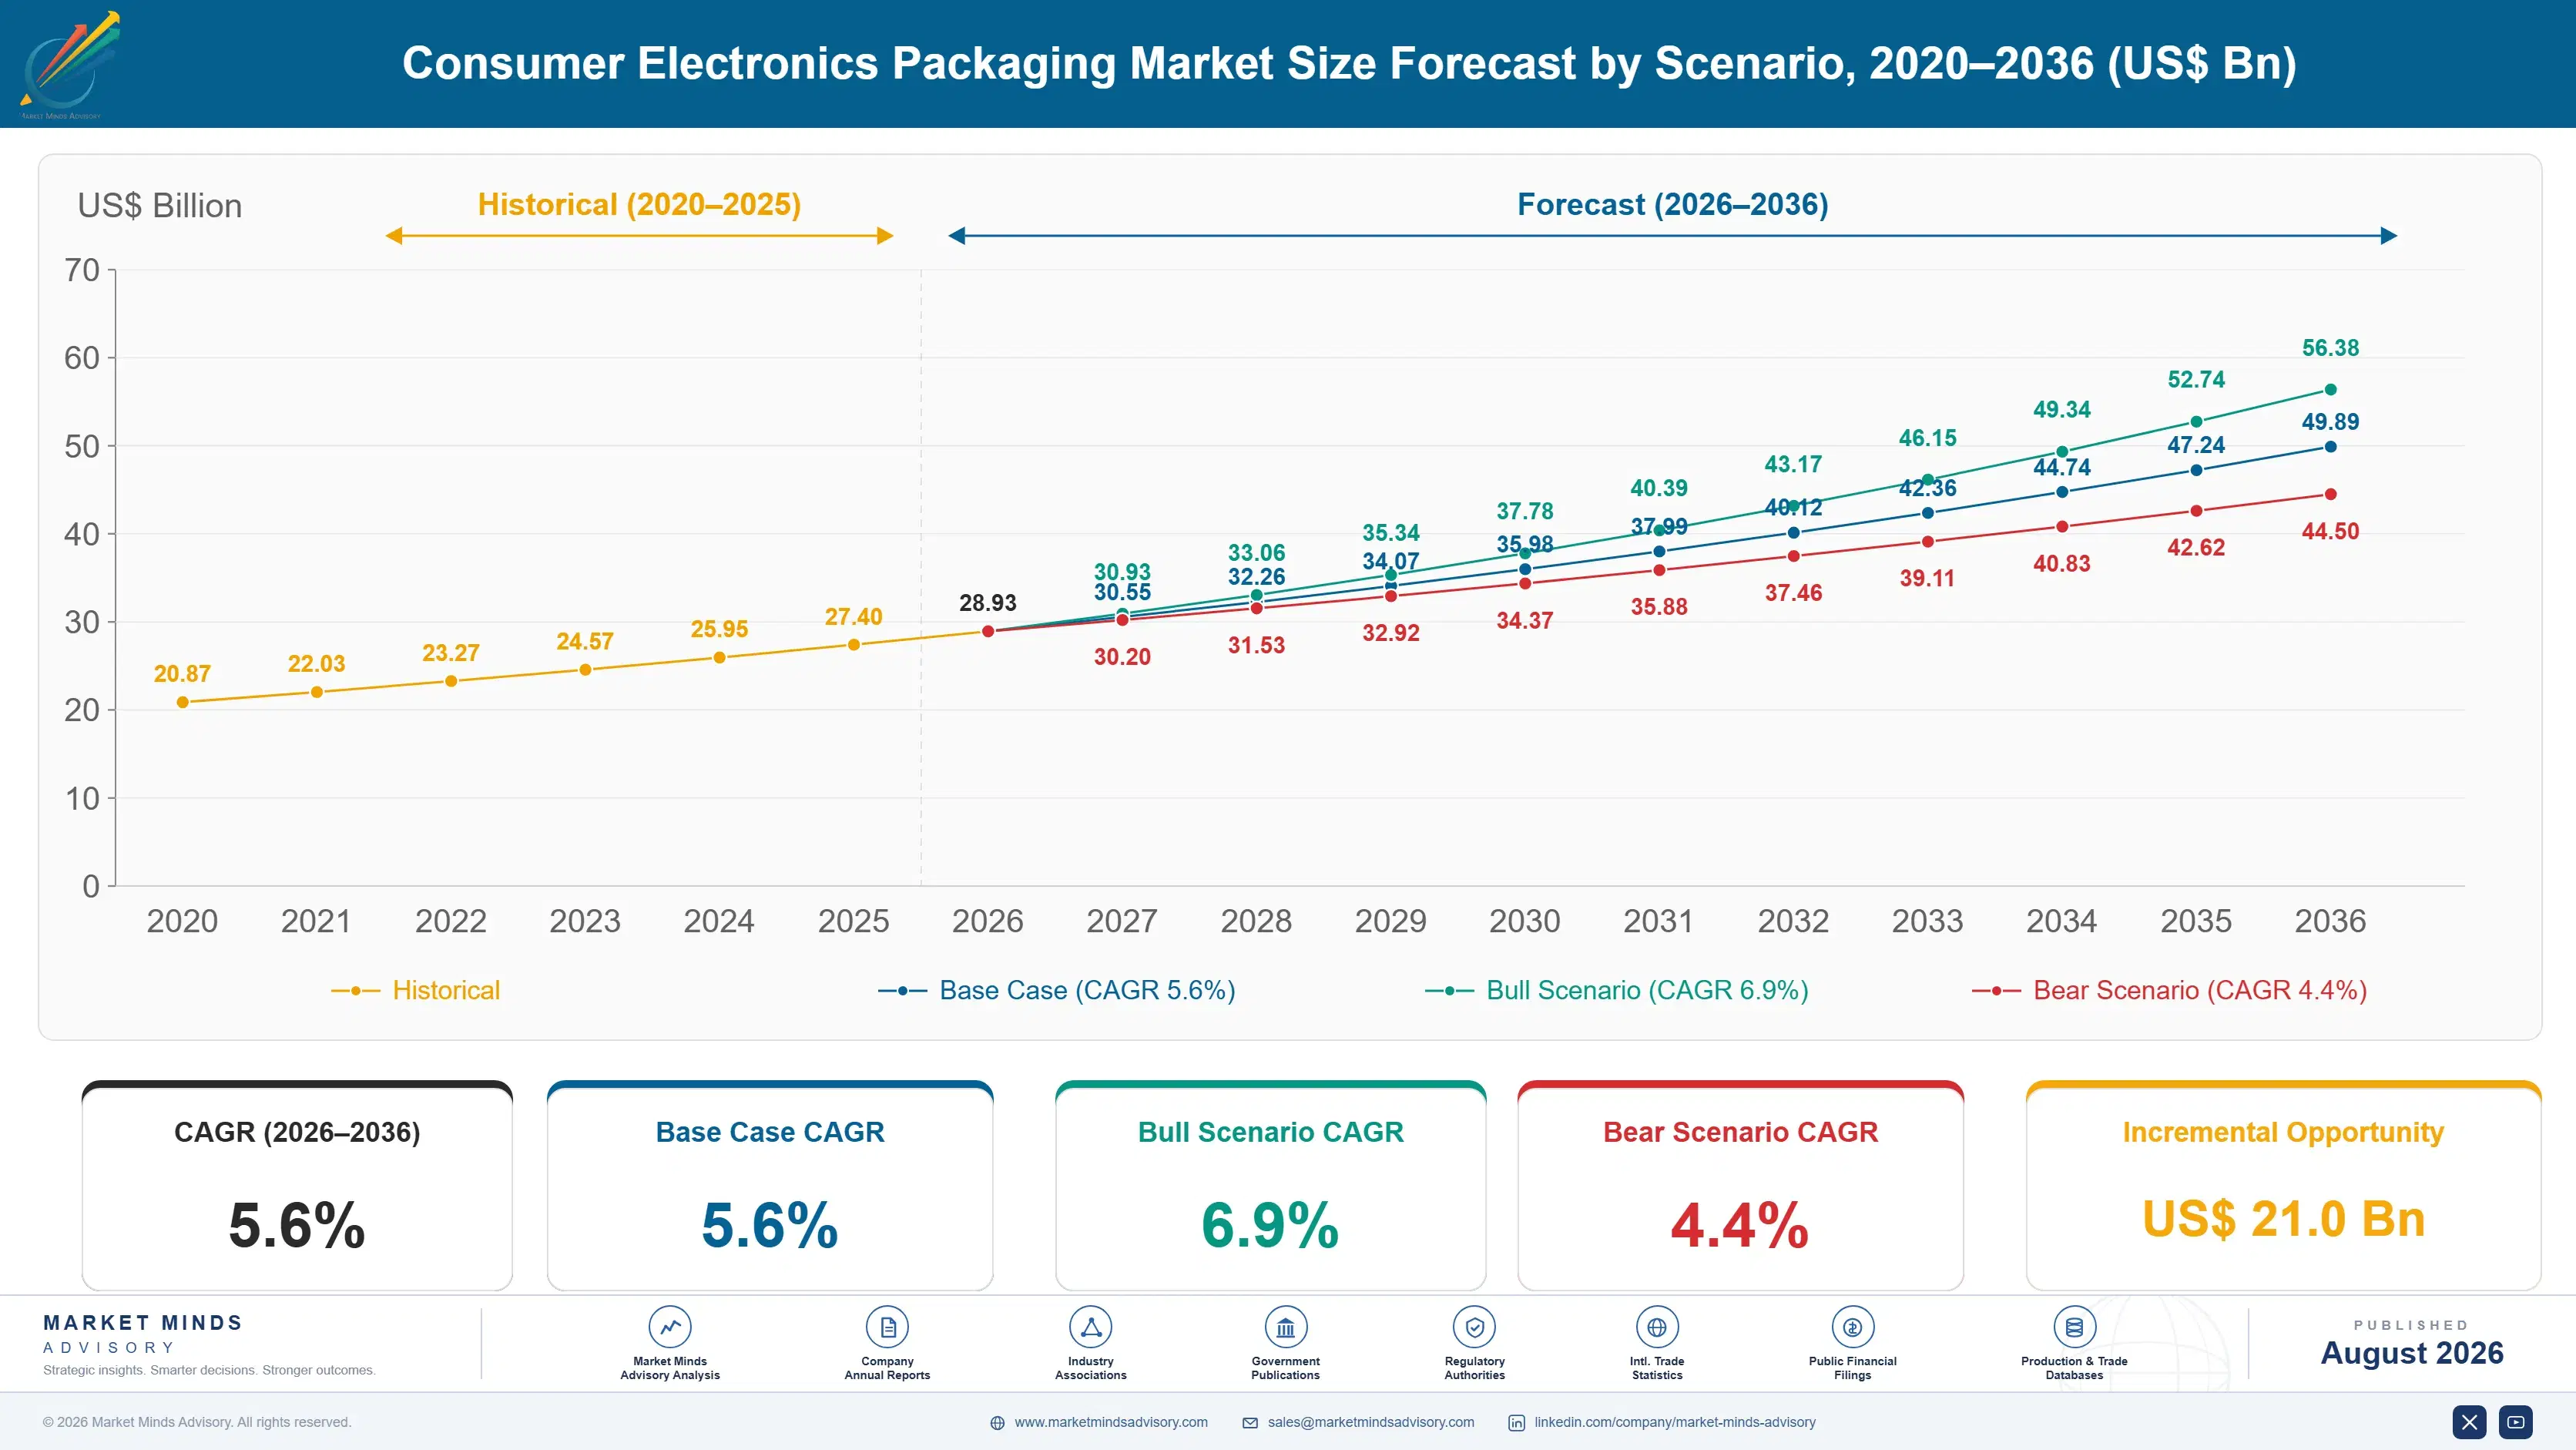
The market reaches USD 27.4 billion in 2025 and compounds at 5.6% to USD 49.89 billion by 2036. Molded fibre and pulp protective packaging grows fastest at 9.8%, exactly 1.75 times the market rate, as brands replace expanded polystyrene cushioning in flagship products. East Asia holds 40% of value, well above the band this framework applies, because Chinese assembly volume still dominates global device output.
Concentration is low at 24% across the top five, and the market splits between premium print converters serving flagship launches and commodity protective suppliers competing purely on freight-adjusted cost. Two commercial forces pull in directly opposite directions here. Unboxing turned packaging into a marketing asset worth paying real money for, while producer responsibility fees and carton volume reduction targets push relentlessly in the direction of using less of every material.
Market Definition
The consumer electronics packaging market covers primary and secondary packaging applied to finished consumer electronic devices at the point of assembly or distribution, spanning paperboard cartons and corrugated shippers, molded fibre and pulp cushioning, rigid thermoformed and injection moulded components, flexible films and bags, protective foams, and specialty metal or composite formats. Semiconductor and component-level packaging, retail display fixtures, reusable industrial transit containers, and packaging for appliances above portable scale are excluded.
Base Year Value
$27.4B in 2025 (MMA Primary Research Dataset, August 2026)
Forecast Period
2026 to 2036, eleven discrete annual values
CAGR
5.6% base case. Bull 6.9%. Bear 4.4%.
Fastest Growth Segment
Molded Fibre And Pulp Protective Packaging: 9.8% CAGR
Fastest Growth Country
Vietnam: 9.6% CAGR
Fastest Growth Region
South Asia and Pacific: 8.1% CAGR
Largest Region
East Asia: 40% of 2025 global value
Market Leaders
Shenzhen YUTO Packaging, Smurfit Westrock, Nefab, Huhtamaki, Sonoco. Source: MMA Primary Research Dataset, July 2026.
Primary Survey
n=3,800 procurement and R&D decision-makers, Q4 2025, six countries
Methodology
Demand-side build-up, cross-validated against public data, 47 expert interviews

Consumer Electronics Packaging Market Forecast Scenarios

consumer-electronics-packaging-market-size-forecast-scenario-1787297923881
The 2020 to 2025 period was defined by two shocks arriving in sequence. Device demand spiked through 2020 and 2021 as households equipped for remote work, then fell hard through 2022 and 2023 as replacement cycles lengthened and inventories corrected. Underneath both, assembly kept migrating out of coastal China. A 4.6% historical CAGR conceals a boom, a slump, and a permanent geographic shift.
Three mechanisms carry the 5.6% base case. Material substitution is the largest, since molded fibre replacing expanded polystyrene raises packaging cost per unit even where device volume is flat. Assembly relocation is the second, because a new plant in Vietnam or India requires local converter capacity built from nothing rather than transferred. And carton volume reduction is the third, cutting material per unit while increasing print and tooling value per carton.
The 6.9% bull case rests on regulated recycled content and plastic reduction rules extending beyond Europe into major Asian markets, which would force material substitution on a far larger installed volume than voluntary brand commitments reach. The 4.4% bear case is device replacement cycles stretching further, since a handset kept four years instead of three removes a carton from the market permanently.

The Box Is Built Where The Device Is

Converters in this market do not choose their geography. Packaging is applied at the assembly plant, it is bulky relative to its value, and shipping empty cartons across an ocean makes no commercial sense at all. Freight already absorbs around 11% of delivered cost within a single country. So when a brand moves final assembly from Guangdong to northern Vietnam, converter demand moves with it and does not come back.
TOP FIVE CONCENTRATION24%Fragmented across regional converters serving assembly plants directly
BOX VOLUME REDUCTION32%Cut in shipping carton volume across recent flagship launches
MOLDED FIBRE PREMIUM18%Cost premium over foam for equivalent protective performance
FREIGHT COST SHARE11%Portion of delivered packaging cost absorbed by transport
PAPER MATERIAL SHARE61%Fibre-based share of this packaging measured by weight
DROP TEST HEIGHT1.2 metresHeight a packaged handset must survive without any damage
Unboxing changed what a premium carton is worth. A flagship handset box carries print quality, magnetic closures, precise tolerances, and tactile finishes that would be absurd on any other consumer product, and brands pay for it because the first thirty seconds of ownership are a marketing surface. That premium tier behaves nothing like the corrugated shipper underneath it, which is bought on cost per thousand.
Pulling the other way is a genuine material squeeze. Extended producer responsibility fees price packaging by weight and by recyclability, carton volume reduction cuts freight cost across the whole distribution chain, and expanded polystyrene has become commercially awkward in several jurisdictions. Flagship carton volume has fallen by roughly a third over five years. Less material per unit, more engineering per gram.
"Everybody talks about sustainability driving material substitution. In practice the finance director signs off on molded fibre because the carton got smaller and the container now holds 40% more units, and the recycled content is a bonus."
Director, Packaging And Converted Products Practice · MMA Packaging Practice

Market Trends

Carton Volume Reduction Rewrites Protective Packaging Design

Removing the charger from a handset box was the visible change, but the commercial consequence was a carton roughly a third smaller that fits far more units into the same container. Freight savings run across the entire distribution chain and dwarf the material saving on the box itself. That has pushed protective design toward thin-wall molded fibre and precision-fitted paperboard rather than bulk cushioning. Tooling investment per format has risen sharply while material cost per unit falls, which changes converter economics considerably and rewards whoever funds the tools rather than whoever quotes the lowest price per unit.
Market Impact: Vietnam capacity grew 3 times
Extended Producer Responsibility Prices Packaging By Material

European producer responsibility schemes now set fees by weight and by recyclability grade rather than charging a flat rate, and several Asian jurisdictions are drafting comparable rules. A plastic cushioning insert can cost several times a fibre equivalent in fee terms even where the material price favours plastic. Brands calculate fees globally rather than market by market, so a European fee structure changes specification decisions for devices sold everywhere. That single mechanism has moved more material volume than every voluntary corporate sustainability commitment in the sector put together, and it keeps tightening.
Market Impact: Premium cartons carry 4 times value

Market Opportunities and Growth Drivers

Assembly Migration Builds Converter Demand From Nothing

Final assembly capacity has shifted steadily out of coastal China toward northern Vietnam, Indian production-linked incentive sites, and Mexican border plants, and each new facility needs local packaging supply because empty cartons cannot be shipped economically over any distance. Vietnamese converter capacity has expanded from a small base to serve several major assembly clusters. Indian sites under the government incentive scheme carry local content expectations that reach packaging as well. This creates genuinely new converting demand rather than transferring existing volume, because the plant left behind rarely finds replacement work at comparable margin.
Market Impact: Handset cycle stretched 12 months

Premium Unboxing Justifies Real Print And Tooling Spend

A flagship device carton now carries print quality, magnetic closures, precise fit tolerances, and finishes that no other consumer category would tolerate on cost grounds, because brands treat the first thirty seconds of ownership as marketing rather than as logistics. Premium cartons carry three to four times the converted value of a standard equivalent. That supports a distinct tier of converters with the print capability, tooling, and quality systems to hold flagship specifications reliably across very high volumes. Qualification with a major brand takes eighteen to twenty-four months and rarely reverses afterwards.
Market Impact: Freight absorbs 11% of cost

Market Restraints and Challenges

Device Replacement Cycles Keep Stretching Across Every Category

Handsets kept four years instead of three, laptops five instead of four, and tablets longer still each remove a carton from the market permanently, and the trend has held for a decade. The root cause is that incremental hardware improvement no longer justifies replacement for most buyers. Commercially this caps unit volume growth well below what device installed base figures suggest. Participants are mitigating through value per carton rather than volume, through refurbishment and trade-in packaging which is a genuinely new format, and through accessory packaging that turns over faster.
Market Impact: Container utilisation improved 40 percent

Freight Economics Prevent Converters From Serving Distant Plants

Empty packaging is bulky and cheap, so transporting it any real distance destroys the margin before it reaches the customer, and freight already absorbs around 11% of delivered cost within a single country. The root cause is simple density: a truck of flat corrugated carries very little value. Commercially this means a converter cannot follow a customer to a new country without building a plant there. Mitigation runs through licensed local partners, through flat-pack and knock-down designs that improve transport density, and through co-located converting lines built inside the assembly campuses themselves.
Market Impact: Fees vary 5 times by material
3 additional market trends, 2 additional growth drivers, and 4 additional restraints and challenges are covered in the full report. Contact sales@marketmindsadvisory.com to access the complete intelligence.

Segment CAGR and Growth Architecture

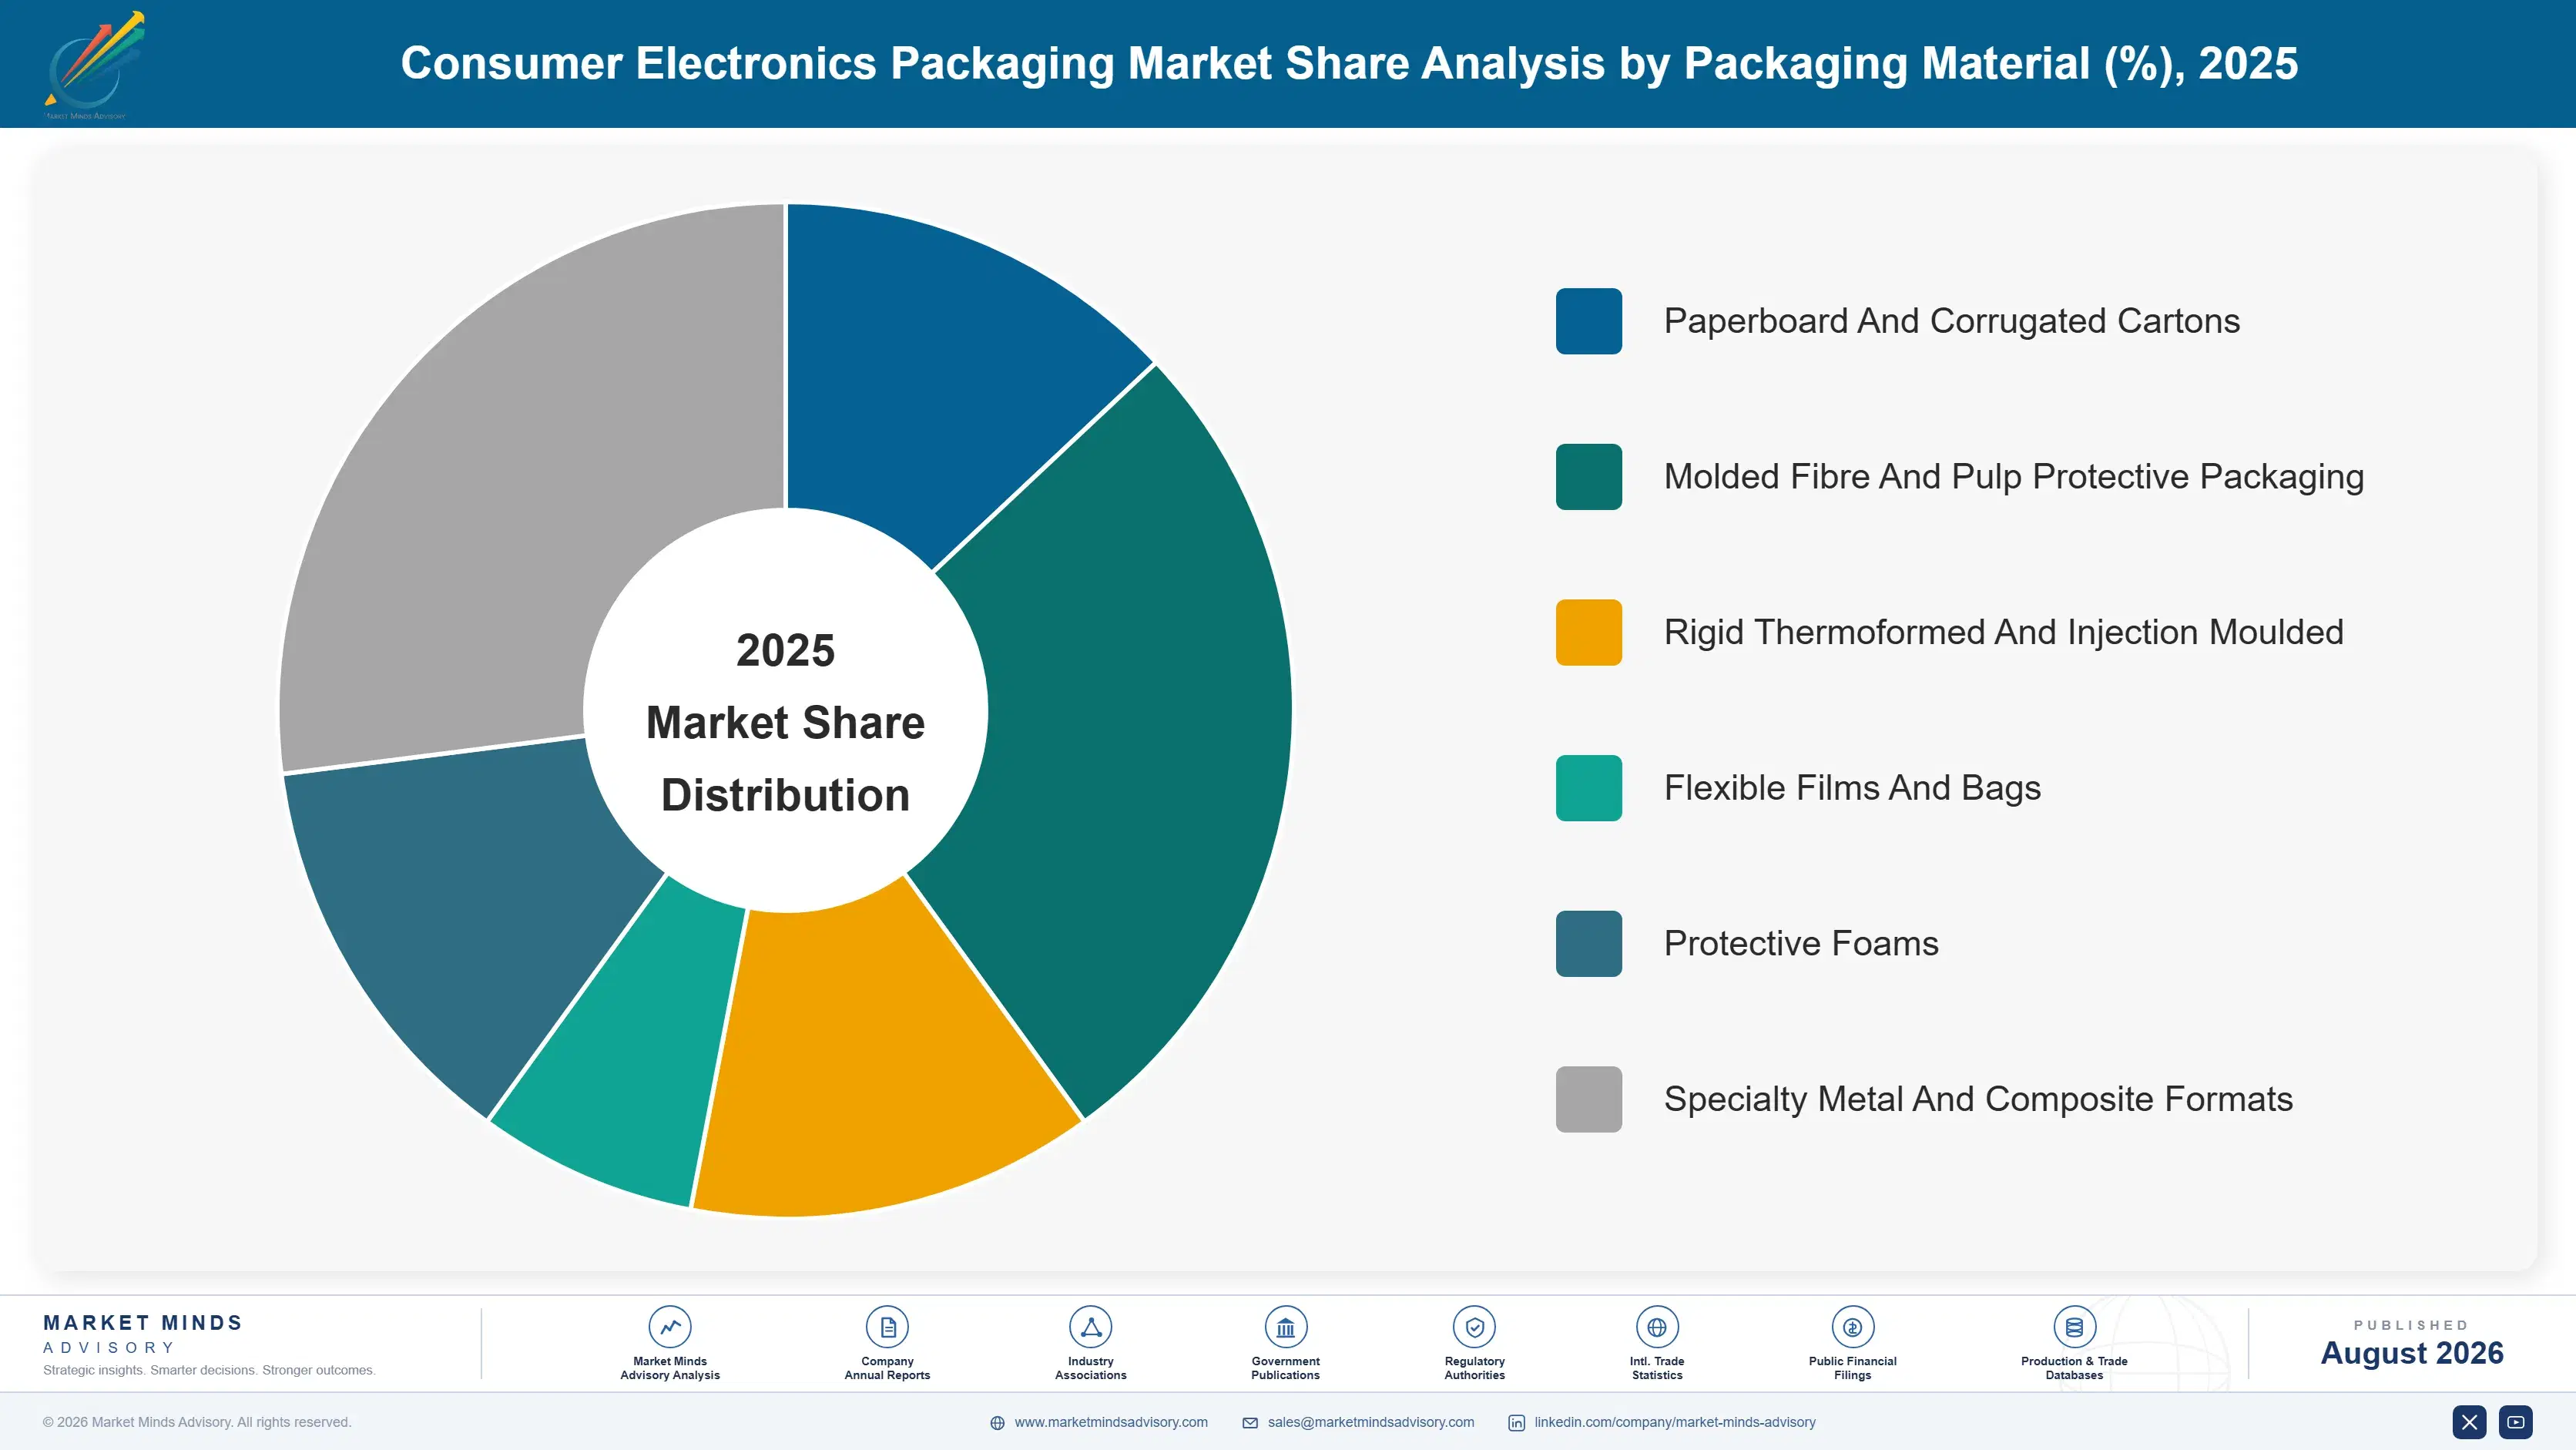
Segmentation follows the packaging material, because material determines the converting asset required, the producer responsibility fee a brand pays, the freight density achievable, and whether a supplier can serve a flagship launch at all. Pack format, device category, and supply position are handled in the framework and in commentary rather than being treated as segments here.
consumer-electronics-packaging-market-market-share-analysis-1787297924420

Molded Fibre And Pulp Protective Packaging

Molded fibre grows fastest at 9.8%, exactly 1.75 times the market rate, displacing expanded polystyrene and moulded plastic cushioning across flagship and increasingly mid-tier devices. Fee structures under producer responsibility schemes favour it heavily, and thin-wall forming has closed most of the protective performance gap that once justified foam. Cost still runs roughly 18% above the foam equivalent, which brands accept when the carton also shrinks and container utilisation improves. Tooling investment per format is substantial and it locks a converter into a device programme for its full commercial life. Capacity additions concentrate in Vietnam and southern China, close to the assembly clusters that consume the output within days of forming.
CAGR 9.8%

Paperboard And Corrugated Cartons

Paperboard and corrugated grow at 6.2%, covering both the premium printed retail carton and the plain shipper underneath it, which behave as entirely different businesses despite sharing a substrate. Premium flagship cartons carry three to four times the converted value of a standard equivalent, earned through print quality, magnetic closures, and fit tolerances measured in fractions of a millimetre. Commodity shippers are bought purely on cost per thousand against whatever local competition exists within trucking distance. Carton volume reduction cuts material per unit while raising engineering content, so revenue holds better than tonnage does. This remains the largest segment by a very wide margin, and it will stay that way throughout the forecast period.
CAGR 6.2%
Full segment breakdown across 6 segments available in the complete report.

Regional Architecture and Country Demand Map

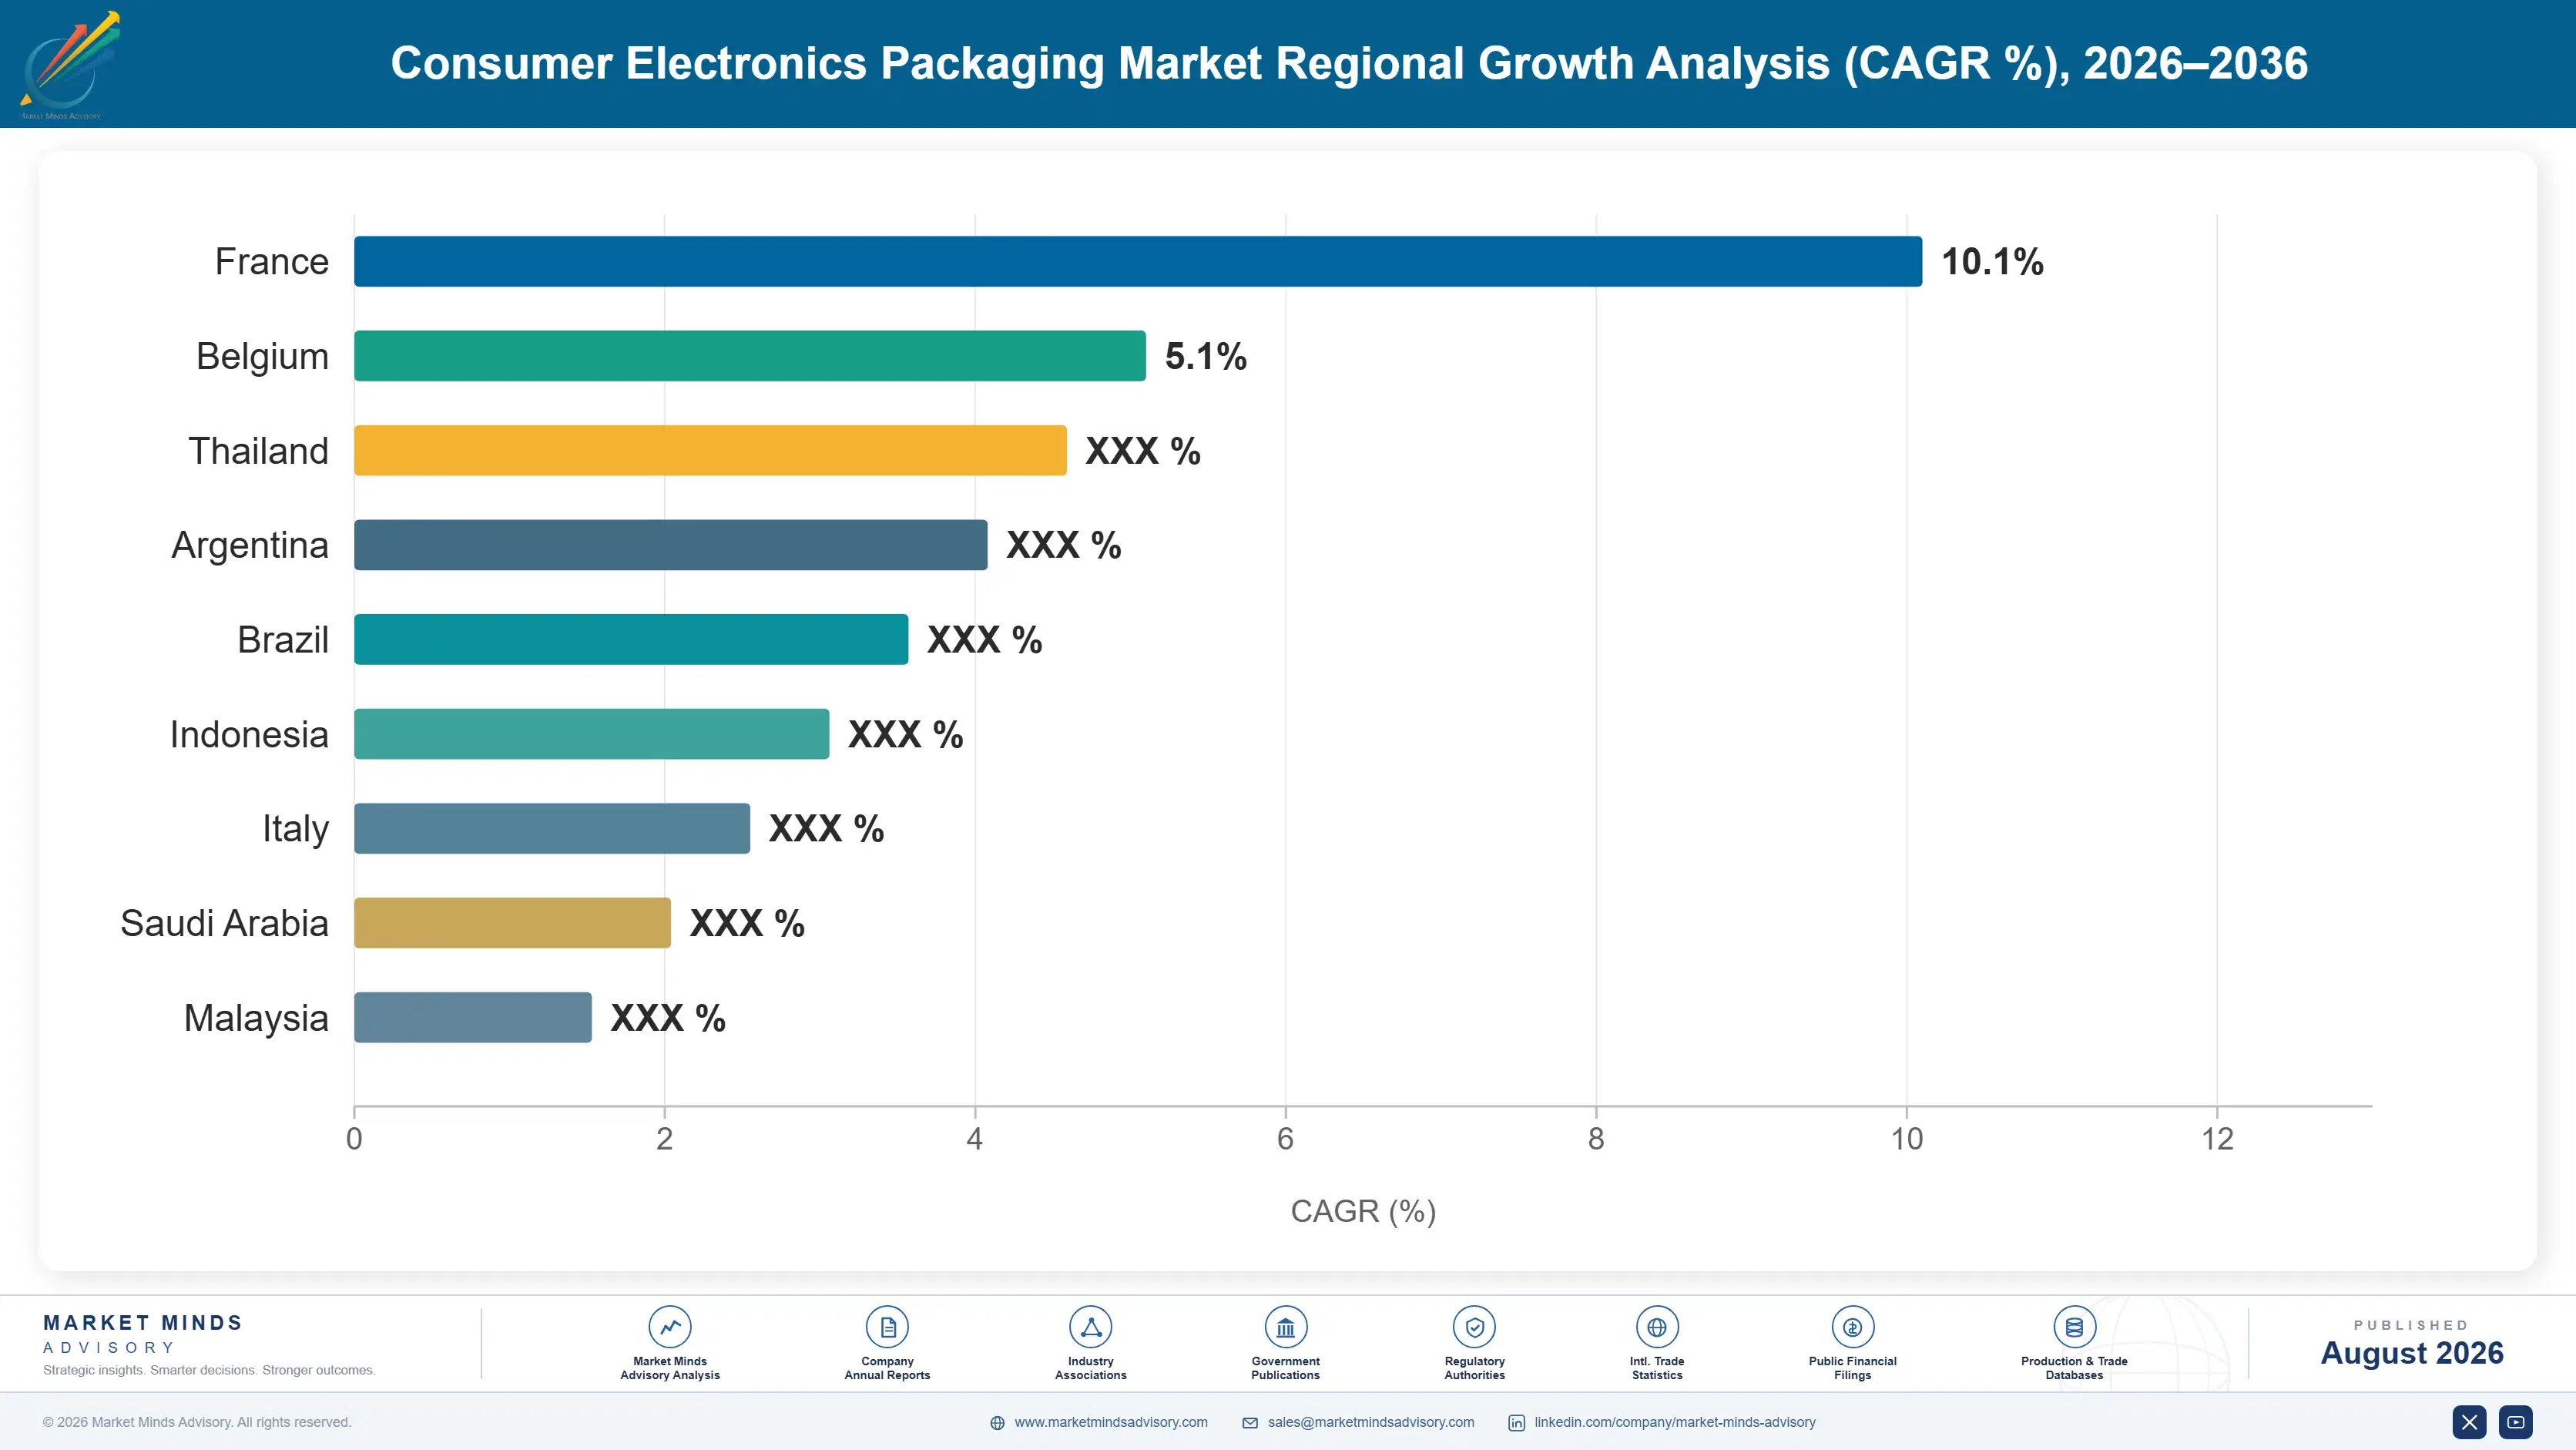
Four regions sit outside the bands this framework applies, and one fact explains all four. Packaging is consumed at the assembly plant rather than at the point of sale, so regional shares track where devices are physically built rather than where consumers eventually buy them.

East Asia

East Asia holds 40% of value against a 30% ceiling in this framework, and device assembly volume rather than consumption explains the entire breach. Guangdong, Jiangsu, and Chongqing between them still account for the majority of global handset, laptop, and wearable output, and every one of those units is packed locally. Shenzhen YUTO built a premium print business serving flagship programmes that no converter elsewhere has matched at comparable scale. Japanese and Korean converters serve domestic brand assembly and component export packaging. Domestic Chinese device brands now absorb a growing share of local premium converting work. Growth at 6.1% exceeds the global rate despite assembly steadily migrating toward lower cost locations.
Share: 40% | CAGR: 6.1% (2026 to 2036)

South Asia and Pacific

Assembly relocation makes South Asia and Pacific the fastest growing region in this forecast, and its 16% share sits well above the 12% ceiling this framework applies for the same reason. Northern Vietnamese clusters around Bac Ninh and Thai Nguyen pack a large and rising share of global handsets, and converter capacity there has expanded from almost nothing within a decade. Indian sites under the production-linked incentive scheme carry local content expectations reaching packaging as well as components. Thai and Malaysian converting serves display and audio assembly on a smaller scale. Growth at 8.1% is the highest of any region and it comes from genuinely new capacity rather than transferred volume.
Share: 16% | CAGR: 8.1% (2026 to 2036)
Regional intelligence for 5 additional markets available in the complete report: North America, Western Europe, Latin America, Middle East and Africa, Eastern Europe. Contact sales@marketmindsadvisory.com.
consumer-electronics-packaging-market-country-cagr-analysis-1787297924941

Earning More From Less Material

Every commercial force in this market cuts material per unit, so revenue has to come from somewhere other than tonnage. Tooling ownership, co-location inside assembly campuses, fee optimisation sold as a service, and the premium print tier each convert engineering content into price. Four levers follow from that, and none of them depends on unit volume growth at all.

Own The Tooling Across A Device Programme

Molded fibre and precision paperboard formats each require dedicated tooling costing USD 40,000 to USD 120,000 per format, and whoever funds it holds the programme for its full commercial life because requalifying a second source costs the brand more than it saves. Converters who capitalise tooling rather than billing it upfront trade working capital for three to five years of locked volume at negotiated rather than tendered pricing. Margin on tooled programmes runs eight to twelve points above open tender work, and the position survives mid-cycle redesigns that would otherwise trigger a retender.
Market Impact: Locks 3 to 5 years of programme volume

Co-Locate Converting Inside The Assembly Campus

Freight absorbs around 11% of delivered packaging cost even domestically, so a converting line inside or adjacent to the assembly campus removes that cost entirely and eliminates inbound carton inventory for the customer at the same time. Brands increasingly allocate campus space for exactly this. The converter gains a position that no competitor can bid against on price, since any outside supplier carries freight the incumbent does not. Payback on a co-located line typically runs under three years at flagship programme volumes, and the position is close to unbiddable once established.
Market Impact: Removes roughly 11% of the delivered freight cost

Sell Producer Responsibility Fee Optimisation As A Service

European fee schedules price packaging by weight and recyclability grade, and the spread between the best and worst material choice can reach 5 times on the same protective function. Most brands calculate those fees centrally while specifying packaging through procurement teams who never see the fee line at all. A converter that models total fee exposure across a device portfolio and redesigns against it captures specification influence years ahead of tender, and charges design fees of USD 50,000 to USD 150,000 per programme on top of the eventual supply award.
Market Impact: Fee spread reaches 5 times across material choices

Build Dedicated Premium Print Capability For Flagships

Flagship cartons carry three to four times the converted value of standard equivalents, earned through print quality, magnetic closures, and tolerances measured in fractions of a millimetre that most converters cannot hold at volume. The capital and quality systems required exclude nearly everybody, which is exactly why the tier holds its pricing while commodity corrugated does not. Qualification with a major brand takes eighteen to twenty-four months and very rarely reverses once complete. Perhaps 30 device programmes worldwide justify the investment, and very few converters operate credibly at that level.
Market Impact: Converted value runs roughly 4 times higher throughout

Who Controls the Margin Pool

Concentration is low at 24% across the top five, which reflects freight economics rather than any absence of scale players. A converter cannot serve a plant it cannot truck to profitably, so the market fragments into regional clusters around assembly geography. All participants here are compared on measured global revenue from consumer electronics packaging specifically, which separates dedicated converters from diversified paper groups.
Competition splits by tier rather than by geography. Shenzhen YUTO and a small number of others compete for flagship programmes on print capability, tolerance control, and tooling investment, with qualification cycles running eighteen to twenty-four months. Smurfit Westrock, International Paper, and the large integrated groups compete for corrugated shipper volume on cost per thousand and plant proximity. Nefab occupies a distinct position in engineered protective packaging for higher value equipment.

Pressure is building around assembly migration and material substitution together. Vietnamese and Indian converters are being built specifically for programmes leaving China. Molded fibre capacity is the contested asset, since tooling and forming expertise are scarcer than corrugated capacity ever was. Rankings shift most when a flagship programme relocates, because the incumbent converter usually cannot follow it across a border.
consumer-electronics-packaging-market-company-positioning-matrix-1787297925461

Competitive Moat and Risk Dimensions

SHENZHEN YUTO PACKAGING

Moat: Flagship Print And Tolerance Capability

YUTO holds qualification on premium print programmes for several of the largest device brands, built on print quality, magnetic closure assembly, and fit tolerances that very few converters can hold at flagship volumes. Qualification runs eighteen to twenty-four months and rarely reverses. The capital and quality systems required exclude almost every regional competitor entirely.
SHENZHEN YUTO PACKAGING

Risk: Concentration In Chinese Assembly

The company's plant base sits where Chinese assembly sits, and flagship programmes have been relocating steadily toward Vietnam and India for several years. Freight economics prevent serving those plants from existing sites, so following customers means building abroad against local converters who are already there. Customer concentration compounds the exposure considerably.
SMURFIT WESTROCK

Moat: Integrated Fibre And Plant Density

Backward integration into containerboard plus a corrugated plant network dense enough to serve most industrial geography gives the group cost positions that independent converters cannot match on commodity shipper volume. Fibre cost moves through the business rather than against it. Plant proximity settles most corrugated tenders before price is even discussed, which is the whole basis of the position.
SMURFIT WESTROCK

Risk: Limited Premium Tier Presence

Consumer electronics is a modest line inside a much larger packaging group, and the premium print tier where value is genuinely concentrated demands capability the group has not prioritised. Commodity shipper volume grows with device units, which are growing slowly. The parts of this market expanding fastest are the parts where the group competes least effectively.

Players Tracked

Prominent Players

Shenzhen YUTO Packaging
Smurfit Westrock
Nefab
Huhtamaki
Sonoco

Other Key Players

International Paper
Mondi
Sealed Air
Pregis
Ranpak
Storopack
Brodrene Hartmann
UFP Technologies
Rengo
Oji Holdings
Zhejiang Great Southeast Packaging
Tekni-Plex
Placon
Greif
Amcor

Recent Developments

APRIL 2025

Shenzhen YUTO Commissions Northern Vietnam Converting Plant

YUTO brought a new converting facility online in northern Vietnam serving assembly clusters around Bac Ninh, covering premium print and molded fibre forming. The plant was built organically rather than acquired, and the company said it followed customer programme relocation rather than anticipating any broader regional demand growth.
Signal: Converters must physically follow relocating programmes, because freight economics rule out serving them from anywhere remote
AUGUST 2025

Huhtamaki Expands Molded Fibre Capacity For Electronics Cushioning

Huhtamaki added thin-wall molded fibre forming capacity at two sites, targeting protective cushioning displacing expanded polystyrene in consumer electronics. The investment was internally funded with no partner involvement, and the company cited producer responsibility fee structures rather than brand sustainability commitments as the commercial driver behind it.
Signal: Fee economics rather than voluntary corporate pledges are what actually move material substitution volume in this market
NOVEMBER 2025

Major Brand Cuts Flagship Carton Volume Across Product Line

A leading handset brand reduced retail carton dimensions across its flagship line, improving shipping container utilisation substantially and cutting protective material per unit. Converters supplying the programme retooled at their own cost, having funded the original tooling, which preserved their position through the specification change entirely.
Signal: Tooling ownership quietly converts a disruptive redesign into a successful defence of the incumbent supply position

Fibre, Resin And The Truck

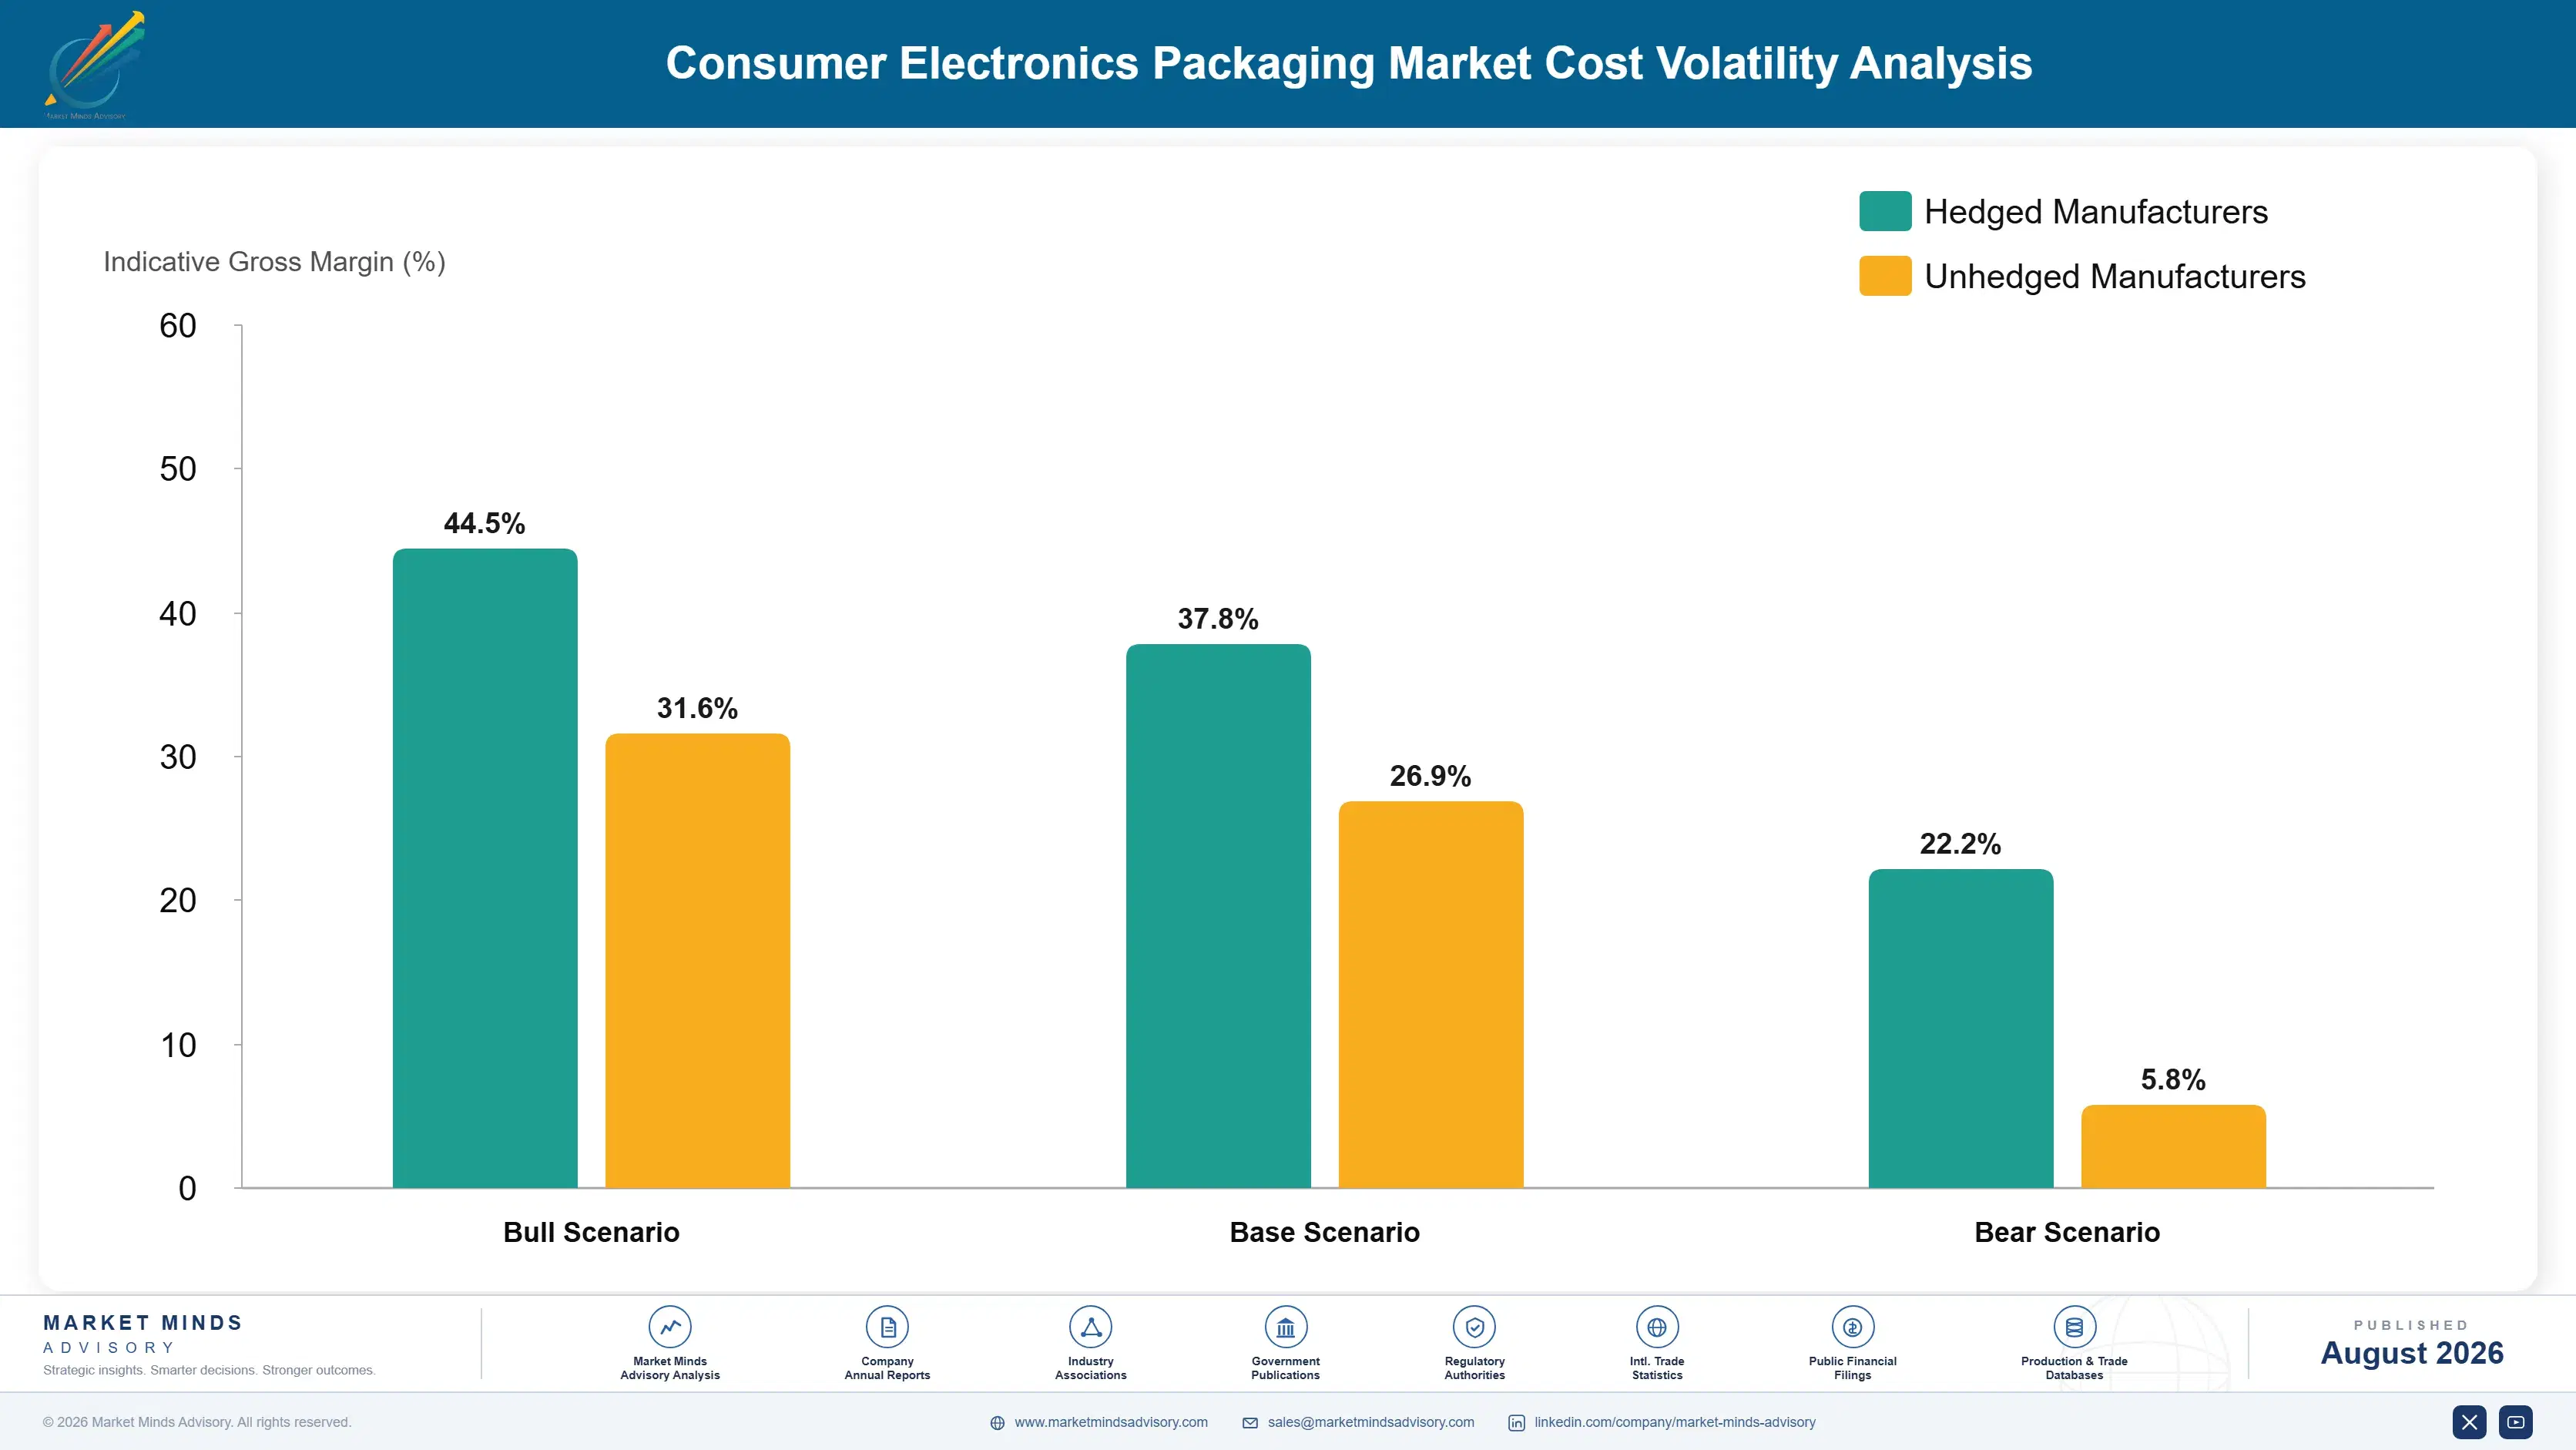
Containerboard and boxboard account for roughly 42% to 52% of converted cost on fibre-based formats, sourced from integrated mills across North America, Scandinavia, and increasingly China. Polymer resin for thermoformed inserts and protective foam adds 30% to 38% on plastic formats, tracking naphtha and therefore crude. Freight absorbs around 11% of delivered cost, and print inks, adhesives, and tooling amortisation carry the balance.
European containerboard pricing moved violently through 2022 as mill energy costs rose with the gas price shock the IEA documented across that year, and several producers took extended downtime rather than run at negative margin. Recovered paper and virgin kraft both repriced sharply. Converters holding fixed-price annual contracts with brand customers absorbed the entire move, and Smurfit Kappa's 2022 annual report described the pass-through lag explicitly in its commentary.

Exposure separates by integration rather than by scale. An integrated group producing its own containerboard sees fibre cost move through the business, offsetting converting margin compression with mill margin expansion. An independent converter buying board on the open market has no such offset and no pricing power against brand procurement. Chinese converters buying domestic recycled board sit on a different cost curve entirely.
consumer-electronics-packaging-market-cost-volatility-analysis-1787297925656

Index Board Cost In Annual Brand Supply Contracts

Fixed-price annual contracts transfer every point of board volatility to the converter, and brand procurement accepts indexation far more readily than most suppliers assume when the alternative is a padded fixed price. Tying the board component to a published containerboard benchmark converts an unmanageable exposure into a pass-through, and it removes the need to price risk into the base.

Design Formats That Run On Recycled Grades

Specifications written around virgin kraft carry both a price premium and a supply concentration risk that recycled grades avoid entirely. Qualifying a format on recycled containerboard takes drop testing and brand approval, but it widens the supplier base considerably and lowers producer responsibility fees at the same time. The performance gap on protective applications has narrowed substantially over recent years.

Amortise Tooling Across Multiple Device Programmes

Format-specific tooling at USD 40,000 to USD 120,000 per programme becomes a stranded cost whenever a device is discontinued early or redesigned mid-cycle. Designing tooling families with shared bases and programme-specific inserts spreads the capital across several devices, which cuts the amortisation carried by any single programme and shortens payback considerably whenever programme volumes disappoint against forecast.

Portfolio Architecture for Margin Defence

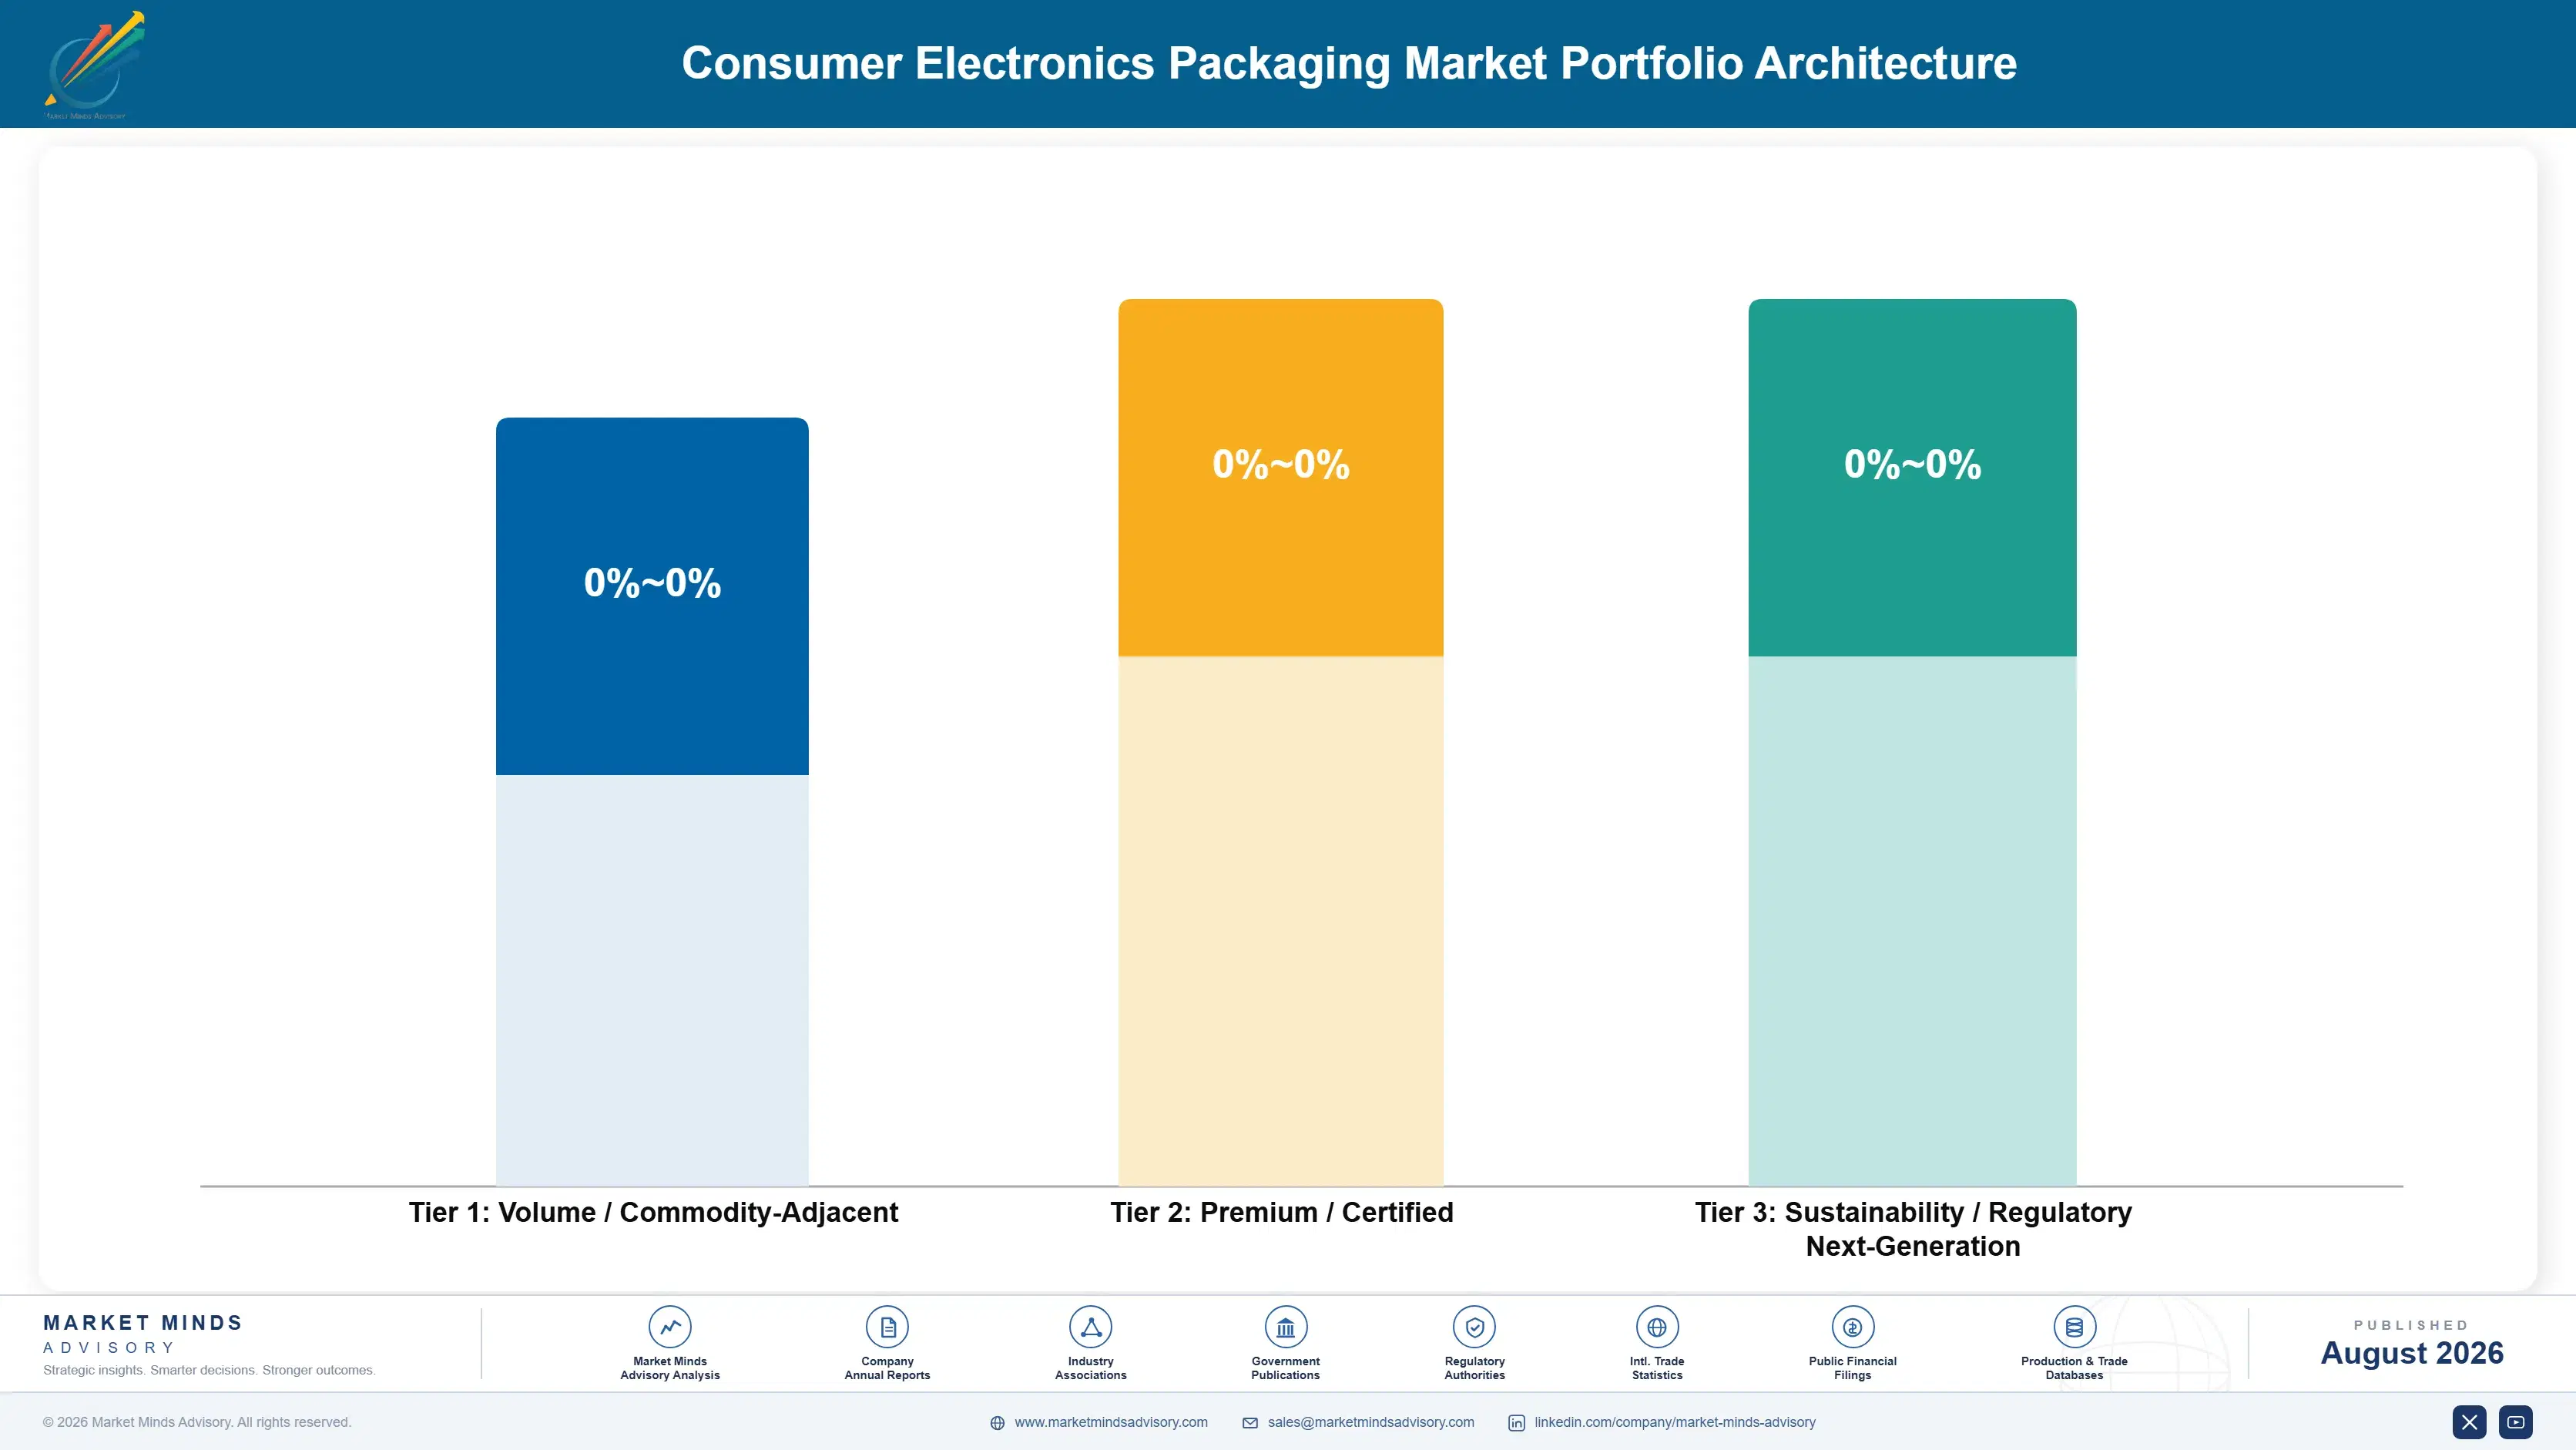
Margin architecture separates by whether the specification can be tendered. Commodity corrugated shippers and plain protective foam earn 11% to 19%, bought on cost per thousand against every converter within trucking distance. Tooled molded fibre and premium printed retail cartons earn 26% to 38%, because tooling ownership and qualification cycles remove the annual tender entirely and pricing becomes negotiated rather than bid.
The tension is that volume growth sits in the commodity tier while margin sits in the premium one, and the premium tier is capped by how many flagship programmes exist worldwide. There are perhaps thirty device programmes globally that justify true premium print work. Every converter wants those, few can qualify, and the ones that do are exposed to a handful of brands whose assembly geography keeps moving.

High-value pools concentrate in tooled formats, co-located converting positions, and producer responsibility design work sold ahead of tender. All three attach the converter to a programme rather than to a purchase order. Molded fibre carries the widest margin range in the market, because tooled flagship work and open-tender commodity trays share a material and share nothing else.

Volume / Commodity-Adjacent

Plain corrugated shippers, standard protective foam, and unprinted secondary packaging bought on cost per thousand against local competition. The eight-point range reflects the gap between integrated producers running their own board and independent converters buying it on the open market.
Gross Margin: 11% to 19%

Premium / Certified

Tooled molded fibre, premium printed retail cartons, and engineered protective formats where qualification and tooling ownership remove the annual tender. The twelve-point range separates negotiated tooled programmes from premium work still exposed to periodic competitive review by brand procurement.
Gross Margin: 26% to 38%

Sustainability / Regulatory / Next-Generation

Fee-optimised redesign programmes, recycled and fibre-based substitution formats, and refurbishment and trade-in packaging. The twenty-eight point range reflects genuine divergence: substitution trays compete on cost while design services sold ahead of specification carry consulting economics.
Gross Margin: 18% to 46%
consumer-electronics-packaging-market-portfolio-architecture-1787297926152

High-value Sub-segments and Strategic Watch-out

Tooled Molded Fibre Programmes

Highest growth and strongest margin in the market, combining material substitution demand with tooling ownership that locks volume for three to five years. Forming expertise and tooling capital are both scarce, which is why capacity additions have not compressed pricing the way corrugated expansion always does.
Gross Margin: 32% to 42%

Co-Located Converting Positions

High value with moderate growth, removing roughly a tenth of delivered cost that no outside bidder can match. Brands increasingly allocate campus space for it. Once established the position is close to unbiddable, though it ties the converter entirely to the continued operation of that single site.
Gross Margin: 30% to 40%

Commodity Corrugated Shippers

The volume core of this market, growing with device units and therefore slowly, bought purely on cost per thousand and plant proximity. Integrated producers hold a permanent advantage here that independents cannot close. Carton volume reduction now cuts tonnage faster than device unit growth adds it back.
Gross Margin: 11% to 19%

Expanded Polystyrene Cushioning

Strategic watch-out. Producer responsibility fees penalise it heavily, several jurisdictions restrict it outright, and molded fibre has closed most of the protective performance gap. Remaining volume sits in price-driven applications and lower tier devices, and that volume is being specified out steadily, programme by programme.
Gross Margin: 9% to 17%

How Programmes Become Annuities

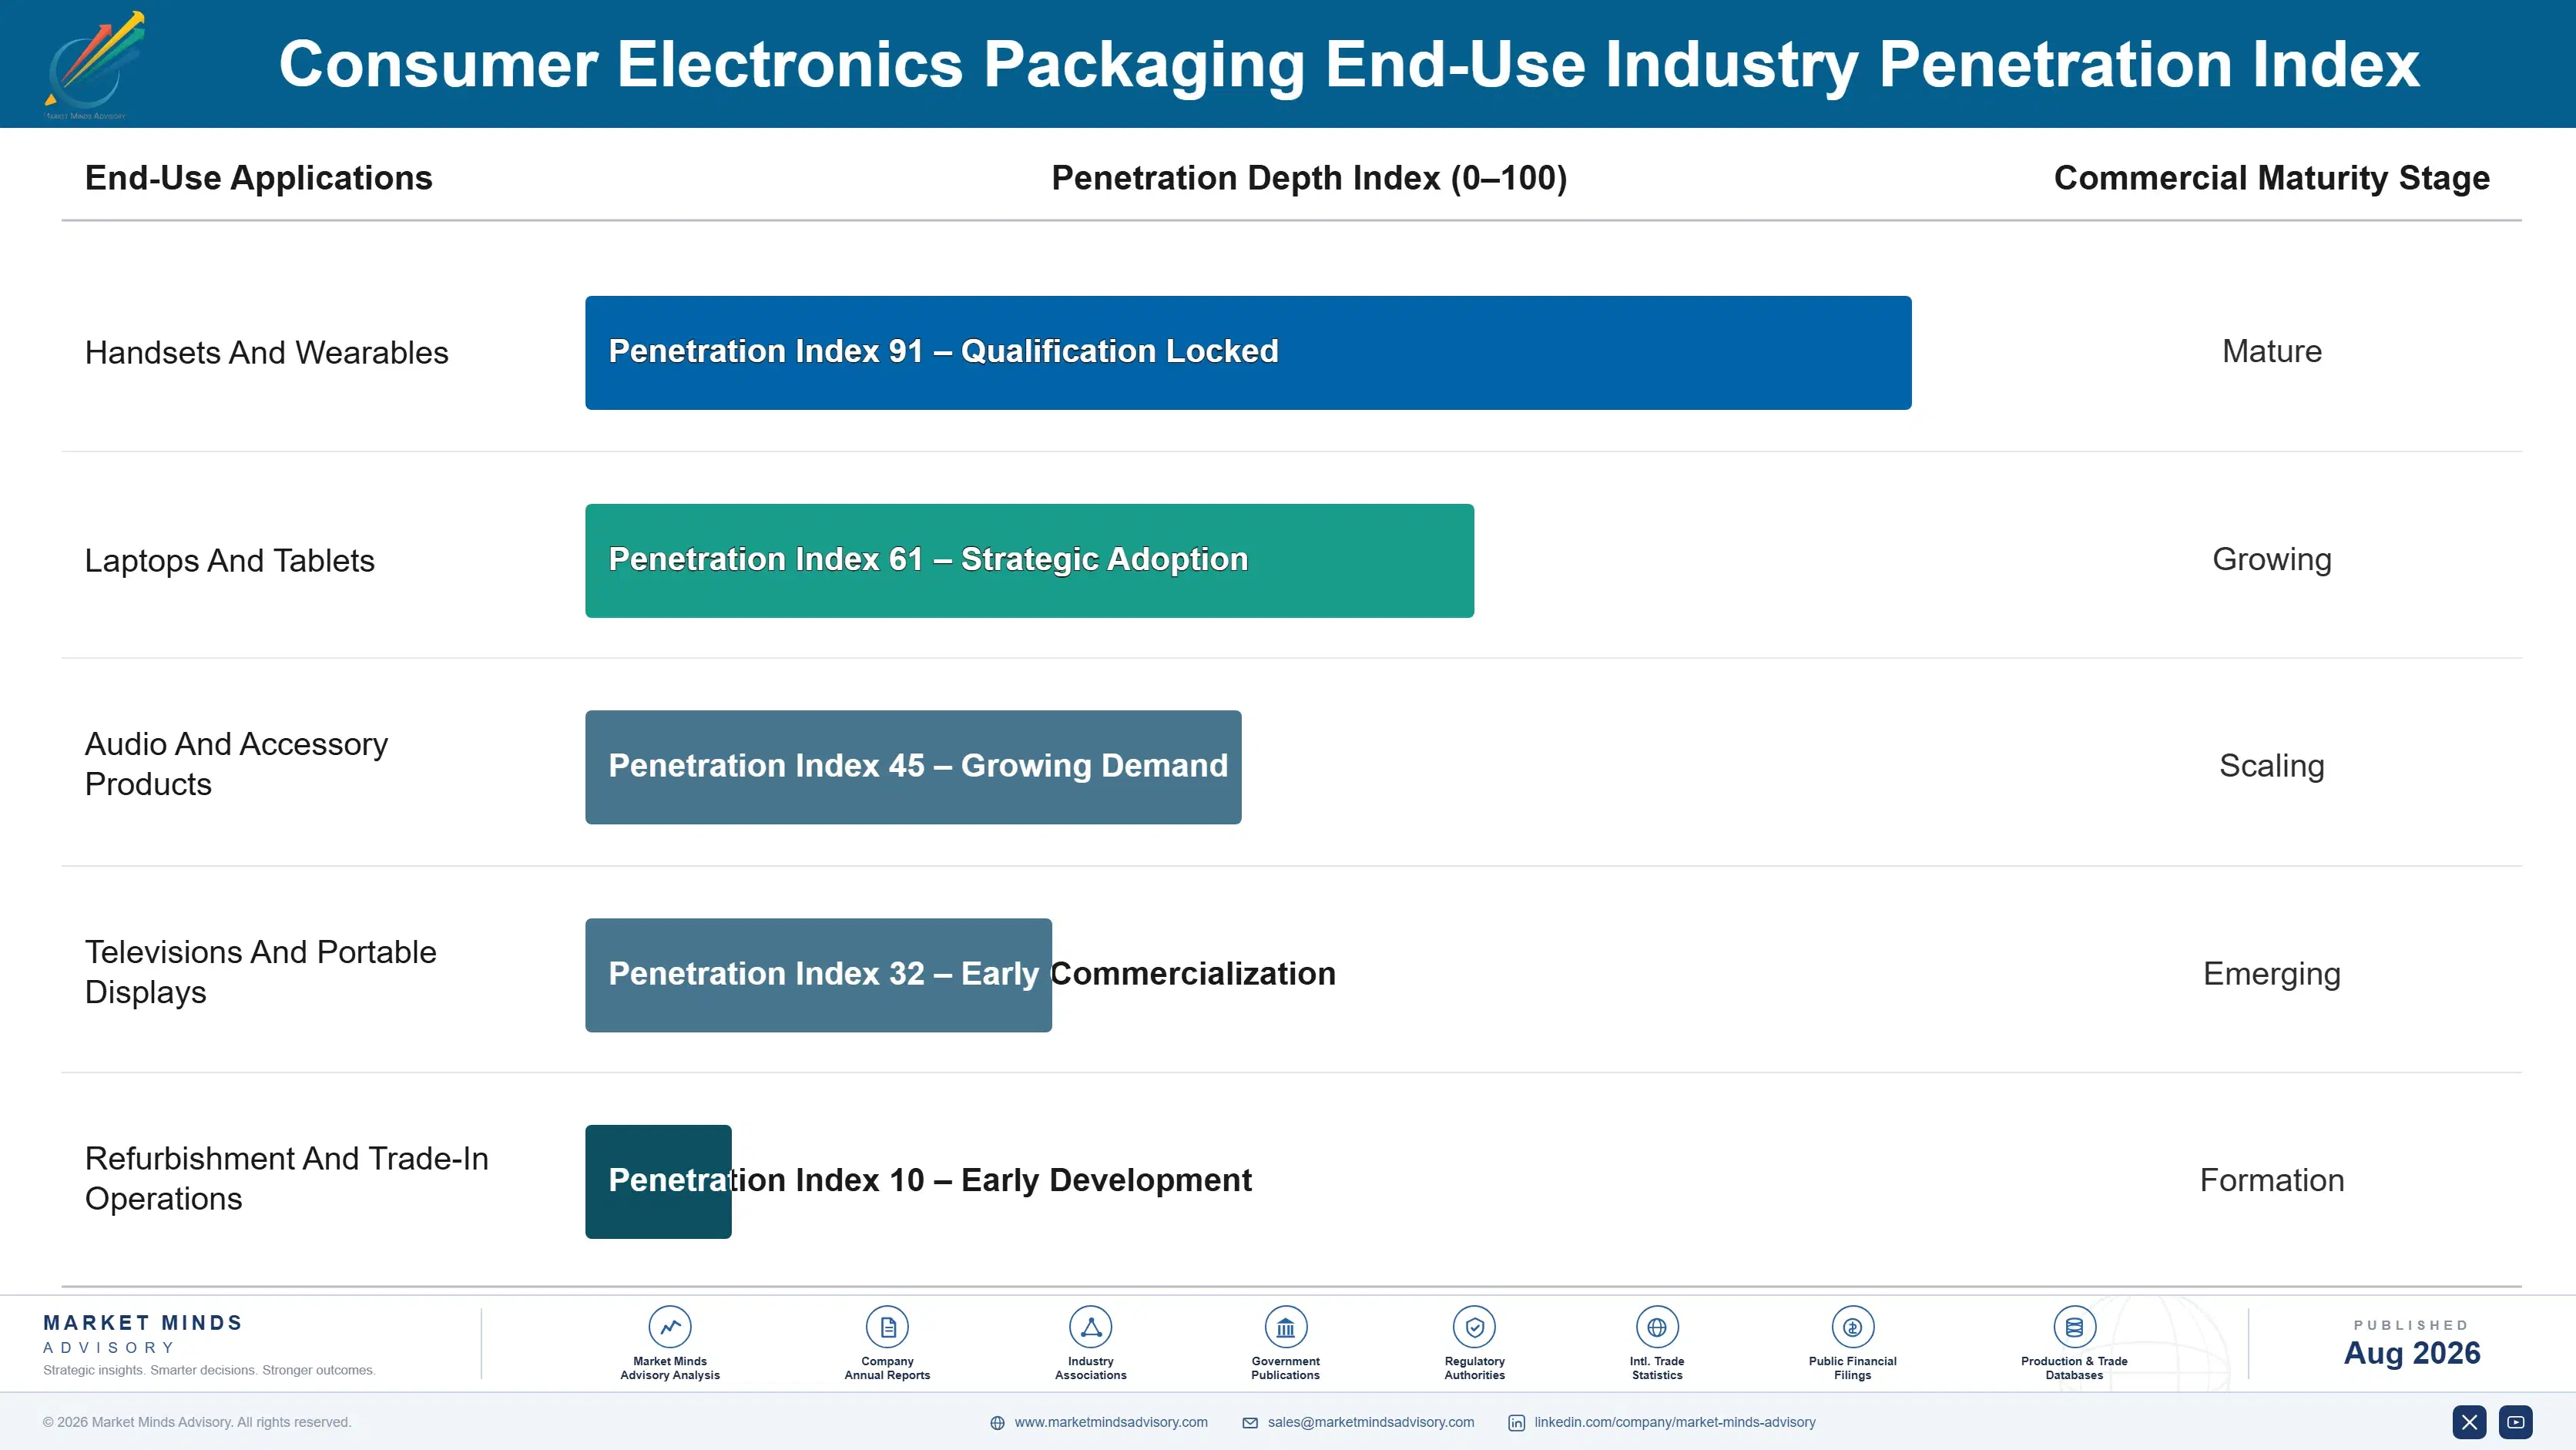
The annuity in this market is the device programme, not the customer. A tooled format qualified into a handset or laptop programme supplies it for three to five years without further competitive review, because requalifying a second source costs the brand more than any saving it would produce. That is why converters fund tooling themselves rather than billing it. The purchase order recurs monthly, but the decision was made once.
Depth varies sharply by device category. Flagship handsets and premium laptops are the stickiest, since tolerance requirements and qualification cycles exclude most competitors. Wearables and audio accessories turn over faster with shorter programme lives and lighter qualification. Televisions and larger portable devices sit closest to commodity, bought on protective performance and cost alone. Refurbishment and trade-in packaging is a genuinely new format with no incumbent position anywhere.

Buyer profiles have changed considerably. Packaging decisions moved from procurement teams buying cartons to cross-functional groups combining industrial design, logistics, and producer responsibility compliance, and they specify years before any tender. Design engineers now arrive with fee models. Both shifts favour converters who can engage at design stage over those who compete on price when the specification is already fixed.
consumer-electronics-packaging-market-end-use-penetration-index-1787297926641

Where We Come Out

These are among the four positions where our research anticipates prominent divergence between winners and laggards over the coming forecast period. Each is grounded in the demand model, the regulatory perimeter, and the announced capacity pipeline.
01 / ASSEMBLY PROXIMITY DISCIPLINE

Follow the plants or lose the programmes entirely

Freight absorbs around a tenth of delivered cost even inside a single country, which means no converter can serve an assembly plant across a border at any price a brand will accept. Programmes are relocating steadily from coastal China toward northern Vietnam and Indian incentive sites, and the incumbent converter almost never follows them. Building capacity ahead of relocation is expensive and uncomfortable to justify to a board, and it is the only thing that actually preserves a customer relationship in this business.
02 / TOOLING CAPITAL STRATEGY

Fund the tooling and own the programme outright

Format tooling costs USD 40,000 to USD 120,000 and whoever pays for it holds the device programme for its full commercial life, because requalifying an alternative source costs the brand more than it could possibly save. Converters who bill tooling upfront protect working capital and hand away the position that would have earned eight to twelve margin points above open tender pricing. This is the single clearest capital allocation decision available anywhere in the business, and a surprising number of converters still get it backwards.
03 / FEE DESIGN ENGAGEMENT

Reach the specification before procurement reaches the tender

Producer responsibility fees vary by up to five times across material choices delivering identical protective function, and brands calculate those fees centrally while specifying packaging through teams that never see the fee line. A converter modelling total portfolio fee exposure and redesigning against it influences the specification years ahead of any tender being issued. That turns into a consulting engagement ending in a sole-source award, which is a considerably better business than bidding against every converter within trucking distance of the plant.
04 / PREMIUM TIER QUALIFICATION

Thirty programmes worldwide justify the capability, so qualify early

Flagship cartons carry three to four times the converted value of standard equivalents and the qualification cycle runs eighteen to twenty-four months, which excludes anybody deciding to enter after a programme is announced. Perhaps thirty device programmes globally justify genuine premium print investment, and the converters holding them rarely lose them. Entering this tier requires capital committed well before there is any contract to point at, which is precisely why so few converters ever try and why the ones already inside keep their positions.

Engagement Snapshot From the Field

A live engagement with an industry participant carrying material or product regulatory and market exposure ahead of a defining policy shift, showing how our research translates into a defensible multi-year portfolio strategy.
MARKET MINDS ADVISORY · CLIENT ENGAGEMENT SUMMARY
Consumer Electronics Packaging Producer Strategic Portfolio Review and Transition Roadmap 2026·Investment Scenario on Consumer Electronics Packaging Exposure Evaluation 2025-26
CLIENT PROFILE
An independent consumer electronics packaging converter operating four plants across southern China, with roughly USD 210 million in annual revenue (client-reported, unverified by MMA) split between premium printed cartons and commodity corrugated shippers. Around 60% of revenue came from three brand customers, all of whom had publicly announced assembly relocation plans, and the business held no capacity outside China at all.
STRATEGIC CHALLENGE
Two of the three anchor customers had confirmed handset programme moves to northern Vietnam within eighteen months, and freight economics made serving those plants from existing sites commercially impossible. The board had to decide whether to build in Vietnam at considerable cost, partner locally on thin margins, or accept the revenue loss and redeploy toward domestic Chinese brands instead.
MMA APPROACH
MMA modelled delivered cost from existing plants against Vietnamese local converting at three volume scenarios, interviewed packaging and industrial design leads at eleven brand customers on relocation timing and supplier expectations, and assessed Vietnamese converter capability by tier. Tooling ownership across the client's programme portfolio was mapped to establish which positions would actually transfer with the programme.
KEY FINDINGS
  1. Delivered cost from existing Chinese plants to northern Vietnam ran 34% above local converting, which no negotiated concession or volume commitment could realistically close.
  2. The client owned tooling on nine of its fourteen premium programmes, and brand customers confirmed those tools would move with the programme rather than being retendered locally.
  3. Vietnamese converters could hold commodity corrugated specifications reliably, but only two of those assessed demonstrated flagship print and tolerance capability at required volumes.
  4. Domestic Chinese brand programmes offered replacement volume at premium tier margins running roughly eleven points below the relocating international programmes being lost.
CLIENT PROFILE
An independent consumer electronics packaging converter operating four plants across southern China, with roughly USD 210 million in annual revenue (client-reported, unverified by MMA) split between premium printed cartons and commodity corrugated shippers. Around 60% of revenue came from three brand customers, all of whom had publicly announced assembly relocation plans, and the business held no capacity outside China at all.
STRATEGIC CHALLENGE
Two of the three anchor customers had confirmed handset programme moves to northern Vietnam within eighteen months, and freight economics made serving those plants from existing sites commercially impossible. The board had to decide whether to build in Vietnam at considerable cost, partner locally on thin margins, or accept the revenue loss and redeploy toward domestic Chinese brands instead.
MMA APPROACH
MMA modelled delivered cost from existing plants against Vietnamese local converting at three volume scenarios, interviewed packaging and industrial design leads at eleven brand customers on relocation timing and supplier expectations, and assessed Vietnamese converter capability by tier. Tooling ownership across the client's programme portfolio was mapped to establish which positions would actually transfer with the programme.
KEY FINDINGS
  1. Delivered cost from existing Chinese plants to northern Vietnam ran 34% above local converting, which no negotiated concession or volume commitment could realistically close.
  2. The client owned tooling on nine of its fourteen premium programmes, and brand customers confirmed those tools would move with the programme rather than being retendered locally.
  3. Vietnamese converters could hold commodity corrugated specifications reliably, but only two of those assessed demonstrated flagship print and tolerance capability at required volumes.
  4. Domestic Chinese brand programmes offered replacement volume at premium tier margins running roughly eleven points below the relocating international programmes being lost.
RECOMMENDED STRATEGY
Phase 1: Phase one: build a single Vietnamese premium print and molded fibre plant sized to the two confirmed relocating programmes, not to speculative regional demand. Phase 2: Phase two: transfer owned tooling with each programme as it moves, and negotiate extended supply terms in exchange for absorbing the relocation cost. Phase 3: Phase three: redeploy freed Chinese capacity toward domestic brand premium work rather than competing on commodity corrugated against integrated producers.
OUTCOME
The client commissioned a Vietnamese plant within fourteen months and retained both relocating programmes with extended supply terms. Group revenue grew 9% over the following year against a 6% decline in Chinese plant volume, and premium tier share of revenue rose from 48% to 61% (client-reported, unverified by MMA).

Frequently Asked Questions

Foundational context covering the market sizes, CAGR, scope, country, region and competition that inform every finding below. This section is provided to cover basics and most often pre-purchase conversations, answered from the MMA Primary Research Dataset.

What is the current size of the Consumer Electronics Packaging Market?

The global consumer electronics packaging market reached USD 27.4 billion in 2025, covering primary and secondary packaging applied to finished devices at assembly or distribution. That spans paperboard, molded fibre, rigid plastics, films, and protective foams.

How large will the Consumer Electronics Packaging Market be by 2036?

MMA forecasts USD 49.89 billion by 2036, up from USD 28.93 billion in 2026, an increase of USD 20.96 billion. That represents an expansion multiple of 1.72 times across the forecast period.

What is the CAGR for the Consumer Electronics Packaging Market 2026 to 2036?

The base case CAGR is 5.6%, with a bull case of 6.9% and a bear case of 4.4%. Historical growth between 2020 and 2025 ran at 4.6%, concealing a pandemic boom followed by a sharp inventory correction.

Which segment is growing fastest?

Molded fibre and pulp protective packaging grows fastest at 9.8%, exactly 1.75 times the market rate, displacing expanded polystyrene cushioning. Paperboard and corrugated cartons follow at 6.2% and remain the largest segment.

Who are the major companies in the Consumer Electronics Packaging Market?

Shenzhen YUTO Packaging, Smurfit Westrock, Nefab, Huhtamaki, and Sonoco lead, together holding 24% of the market. Freight economics keep the market fragmented into regional clusters around assembly geography.

Which country is growing fastest?

Vietnam grows fastest at 9.6%, driven by handset assembly relocation into northern clusters around Bac Ninh and Thai Nguyen. Converter capacity there has expanded from almost nothing within a single decade.

Report Segmentation Architecture

The full report scope spans multiple orthogonal segmentation dimensions, with cross-tabulated demand data provided for each dimension pair. Coverage extends further to regional breakdowns, trend trajectories, and the competitive detail needed to support segment-level decision-making.

By Packaging Material

  • Paperboard And Corrugated Cartons
  • Molded Fibre And Pulp Protective Packaging
  • Rigid Thermoformed And Injection Moulded
  • Flexible Films And Bags
  • Protective Foams
  • Specialty Metal And Composite Formats

By End-Use Industry

  • Handsets And Wearables
  • Laptops And Tablets
  • Audio And Accessory Products
  • Televisions And Portable Displays
  • Refurbishment And Trade-In Operations

By Commercial Dimension

  • Tooled Programme Supply
  • Open Tender Commodity Supply
  • Co-Located Converting Positions
  • Design And Fee Optimisation Services
  • Distribution Repackaging Contracts

By Region

  • East Asia
  • South Asia and Pacific
  • North America
  • Western Europe
  • Latin America
  • Middle East and Africa
  • Eastern Europe

Scope, Methodology, and Coverage

Every figure in this report is reproducible from documented input assumptions. The scope below maps the historical period, the forecast horizon, the segmentation dimensions, and the countries covered, alongside the underlying primary and qualitative methodology.
Historical Period
2020 to 2025
Forecast Period
2026 to 2036
Base Year
2025 (USD billions; MMA Primary Research Dataset, August 2026)
Market Definition
The consumer electronics packaging market covers primary and secondary packaging applied to finished consumer electronic devices at the point of assembly or distribution. Scope spans paperboard cartons and corrugated shippers, molded fibre and pulp cushioning, rigid thermoformed and injection moulded components, flexible films and bags, protective foams, and specialty metal or composite formats, together with associated tooling and design services. Semiconductor and component-level packaging, retail display fixtures, reusable industrial transit containers, and packaging for appliances above portable scale are excluded.
Quantitative Units
USD billions at converter revenue level; tonnage by material; cartons produced annually.
Segmentation Dimensions
By packaging material; by end-use industry; by commercial dimension; by region.
Regions Covered
East Asia, South Asia and Pacific, North America, Western Europe, Latin America, Middle East and Africa, Eastern Europe
Countries Covered
United States, Canada, Mexico, Germany, United Kingdom, France, Netherlands, Poland, Hungary, Czech Republic, China, Japan, South Korea, Vietnam, India, Thailand, Brazil, Argentina, United Arab Emirates, South Africa.
Key Companies Profiled
Shenzhen YUTO Packaging, Smurfit Westrock, Nefab, Huhtamaki, Sonoco, International Paper, Mondi, Sealed Air, Pregis, Ranpak, Storopack, Brodrene Hartmann, UFP Technologies, Rengo, Oji Holdings, Zhejiang Great Southeast Packaging, Tekni-Plex, Placon, Greif, Amcor.
Quantitative Methodology
Primary survey, n=3,800 respondents, Q4 2025, six countries; demand-side model with trade association cross-validation
Qualitative Methodology
47 expert interviews, Q4 2025; applied to validate demand model assumptions, identify emerging dynamics, and assess competitive positioning
Report Format
PDF and XLSX data workbook (Word format preview document)
Publisher
Market Minds Advisory
Report Code
MMA-2026-PAC-764
Published
August 2026
Contact
sales@marketmindsadvisory.com | www.marketmindsadvisory.com

Purchase the full Consumer Electronics Packaging Market Report (2026 to 2036).

The full MMA report on consumer electronics packaging covers material, regional, and competitive analysis in detail, with separate treatment of the freight and assembly geography that governs where converting capacity can profitably sit. It includes tooling ownership economics across device programmes, producer responsibility fee modelling by material and jurisdiction, co-located converting payback analysis, and assembly relocation tracking by cluster. Regional chapters cover twenty countries with converter capability assessed by tier. Competitive profiling spans twenty companies compared on a single consistent revenue basis throughout the analysis.
Twenty country regional demand mechanism chapters
Tooling ownership economics by device programme
Producer responsibility fee modelling by material
Assembly relocation tracking by manufacturing cluster
Twenty company competitive profiles compared consistently
Co-located converting payback analysis models included

Built For The People Who Decide

From boardroom strategy to bench-side execution, this report is read cover-to-cover by leaders shaping the next decade of their industry, turning demand scenarios, market dynamics and valuation benchmarks into decisions.
CXOs/ Presidents/ VPs/ Managers
M&A and Corporate Development
Strategy Teams and R&D Heads
Procurement and Product Directors
Regulatory and Compliance Leaders
Investor Relations and Equity Analysts