Market Minds Advisory
Consumer Electronic Accessories Market

Consumer Electronic Accessories Market: Consumer Electronic Accessories Market. USB-C Standardisation and Wearable Proliferation Reshape a Fragmented Category

Regulatory USB-C standardisation is forcing charging accessory makers to redesign entire product lines within a single compliance window, even as smartwatch and earbud proliferation opens genuinely new accessory categories that barely existed five years ago.

Lead Analyst

Published

September 2026

Make Smarter Decisions with Customized Research Insights

Request a free sample report and evaluate market opportunities, growth trends, and competitive dynamics relevant to your business needs.

2025 MARKET VALUE$85.0BMarket Size 2025
2036 FORECAST VALUE$169.9BBase Case , 2026 to 2036
CAGR 2026 TO 20366.5 %Bull 7.8% / Bear 5.2%
INCREMENTAL OPPORTUNITY$79.4BNet 10- year value creation
EXPANSION MULTIPLE1.88x2036 value over 2026 base
Strategic Levers
M&A Pipeline
Regional Outlook
Country Rankings
Competitive Intelligence
Segmental Deep-dive
Call-Us : 91 93563 13602

Executive Snapshot and Market Trajectory.

Regulatory mandates forcing USB-C standardisation across the European Union and several other major markets are compressing years of planned charging accessory redesign into a single compliance window, and that forced transition is reshaping manufacturer product roadmaps across the category this year. with limited precedent for such a rapid category-wide transition.
Demand is concentrated among protective case and charging accessory categories tied directly to smartphone ownership, while charging accessories are growing fastest as fast-charging standards and USB-C mandates drive replacement cycles across cables, adapters, and power banks simultaneously. East Asia holds the deepest manufacturing and consumption base, reflecting both concentrated contract manufacturing capacity and the world's largest smartphone user population.. broadly across most major consumer retail channels.
Competitive structure remains highly fragmented across hundreds of brands competing on price, design, and retail distribution reach, with no single manufacturer holding commanding share despite several well-known global brands. Retail channel shifts toward direct-to-consumer e-commerce and rapid product design cycles are reshaping competitive dynamics faster than traditional retail-focused accessory brands anticipated eighteen months ago specifically. Several device manufacturers are also expanding first-party accessory lines to capture more of this category directly. broadly.
Market Definition
This market covers third-party and original equipment manufacturer accessories for smartphones, tablets, laptops, and wearable devices, including protective cases, charging cables and adapters, power banks, screen protection products, and wearable bands. It excludes the primary electronic devices themselves, enterprise networking accessories, and automotive electronics accessories not designed for personal consumer device use.
Base Year Value
$85.0B in 2025 (MMA Primary Research Dataset, September 2026)
Forecast Period
2026 to 2036, eleven discrete annual values
CAGR
6.5% base case. Bull 7.8%. Bear 5.2%.
Fastest Growth Segment
Charging Accessories: 9.5% CAGR
Fastest Growth Country
India: 10.2% CAGR
Fastest Growth Region
South Asia and Pacific: 8.8% CAGR
Largest Region
East Asia: 30% of 2025 global value
Market Leaders
Anker Innovations Limited, Belkin International Inc., Zagg Inc., Logitech International S.A., Ugreen Group Limited. Source: MMA Analysis based on company annual reports and investor filings.
Primary Survey
n=3,800 procurement and R&D decision-makers, Q4 2025, six countries
Methodology
Demand-side build-up, cross-validated against public data, 47 expert interviews

Consumer Electronic Accessories Market Forecast Scenarios

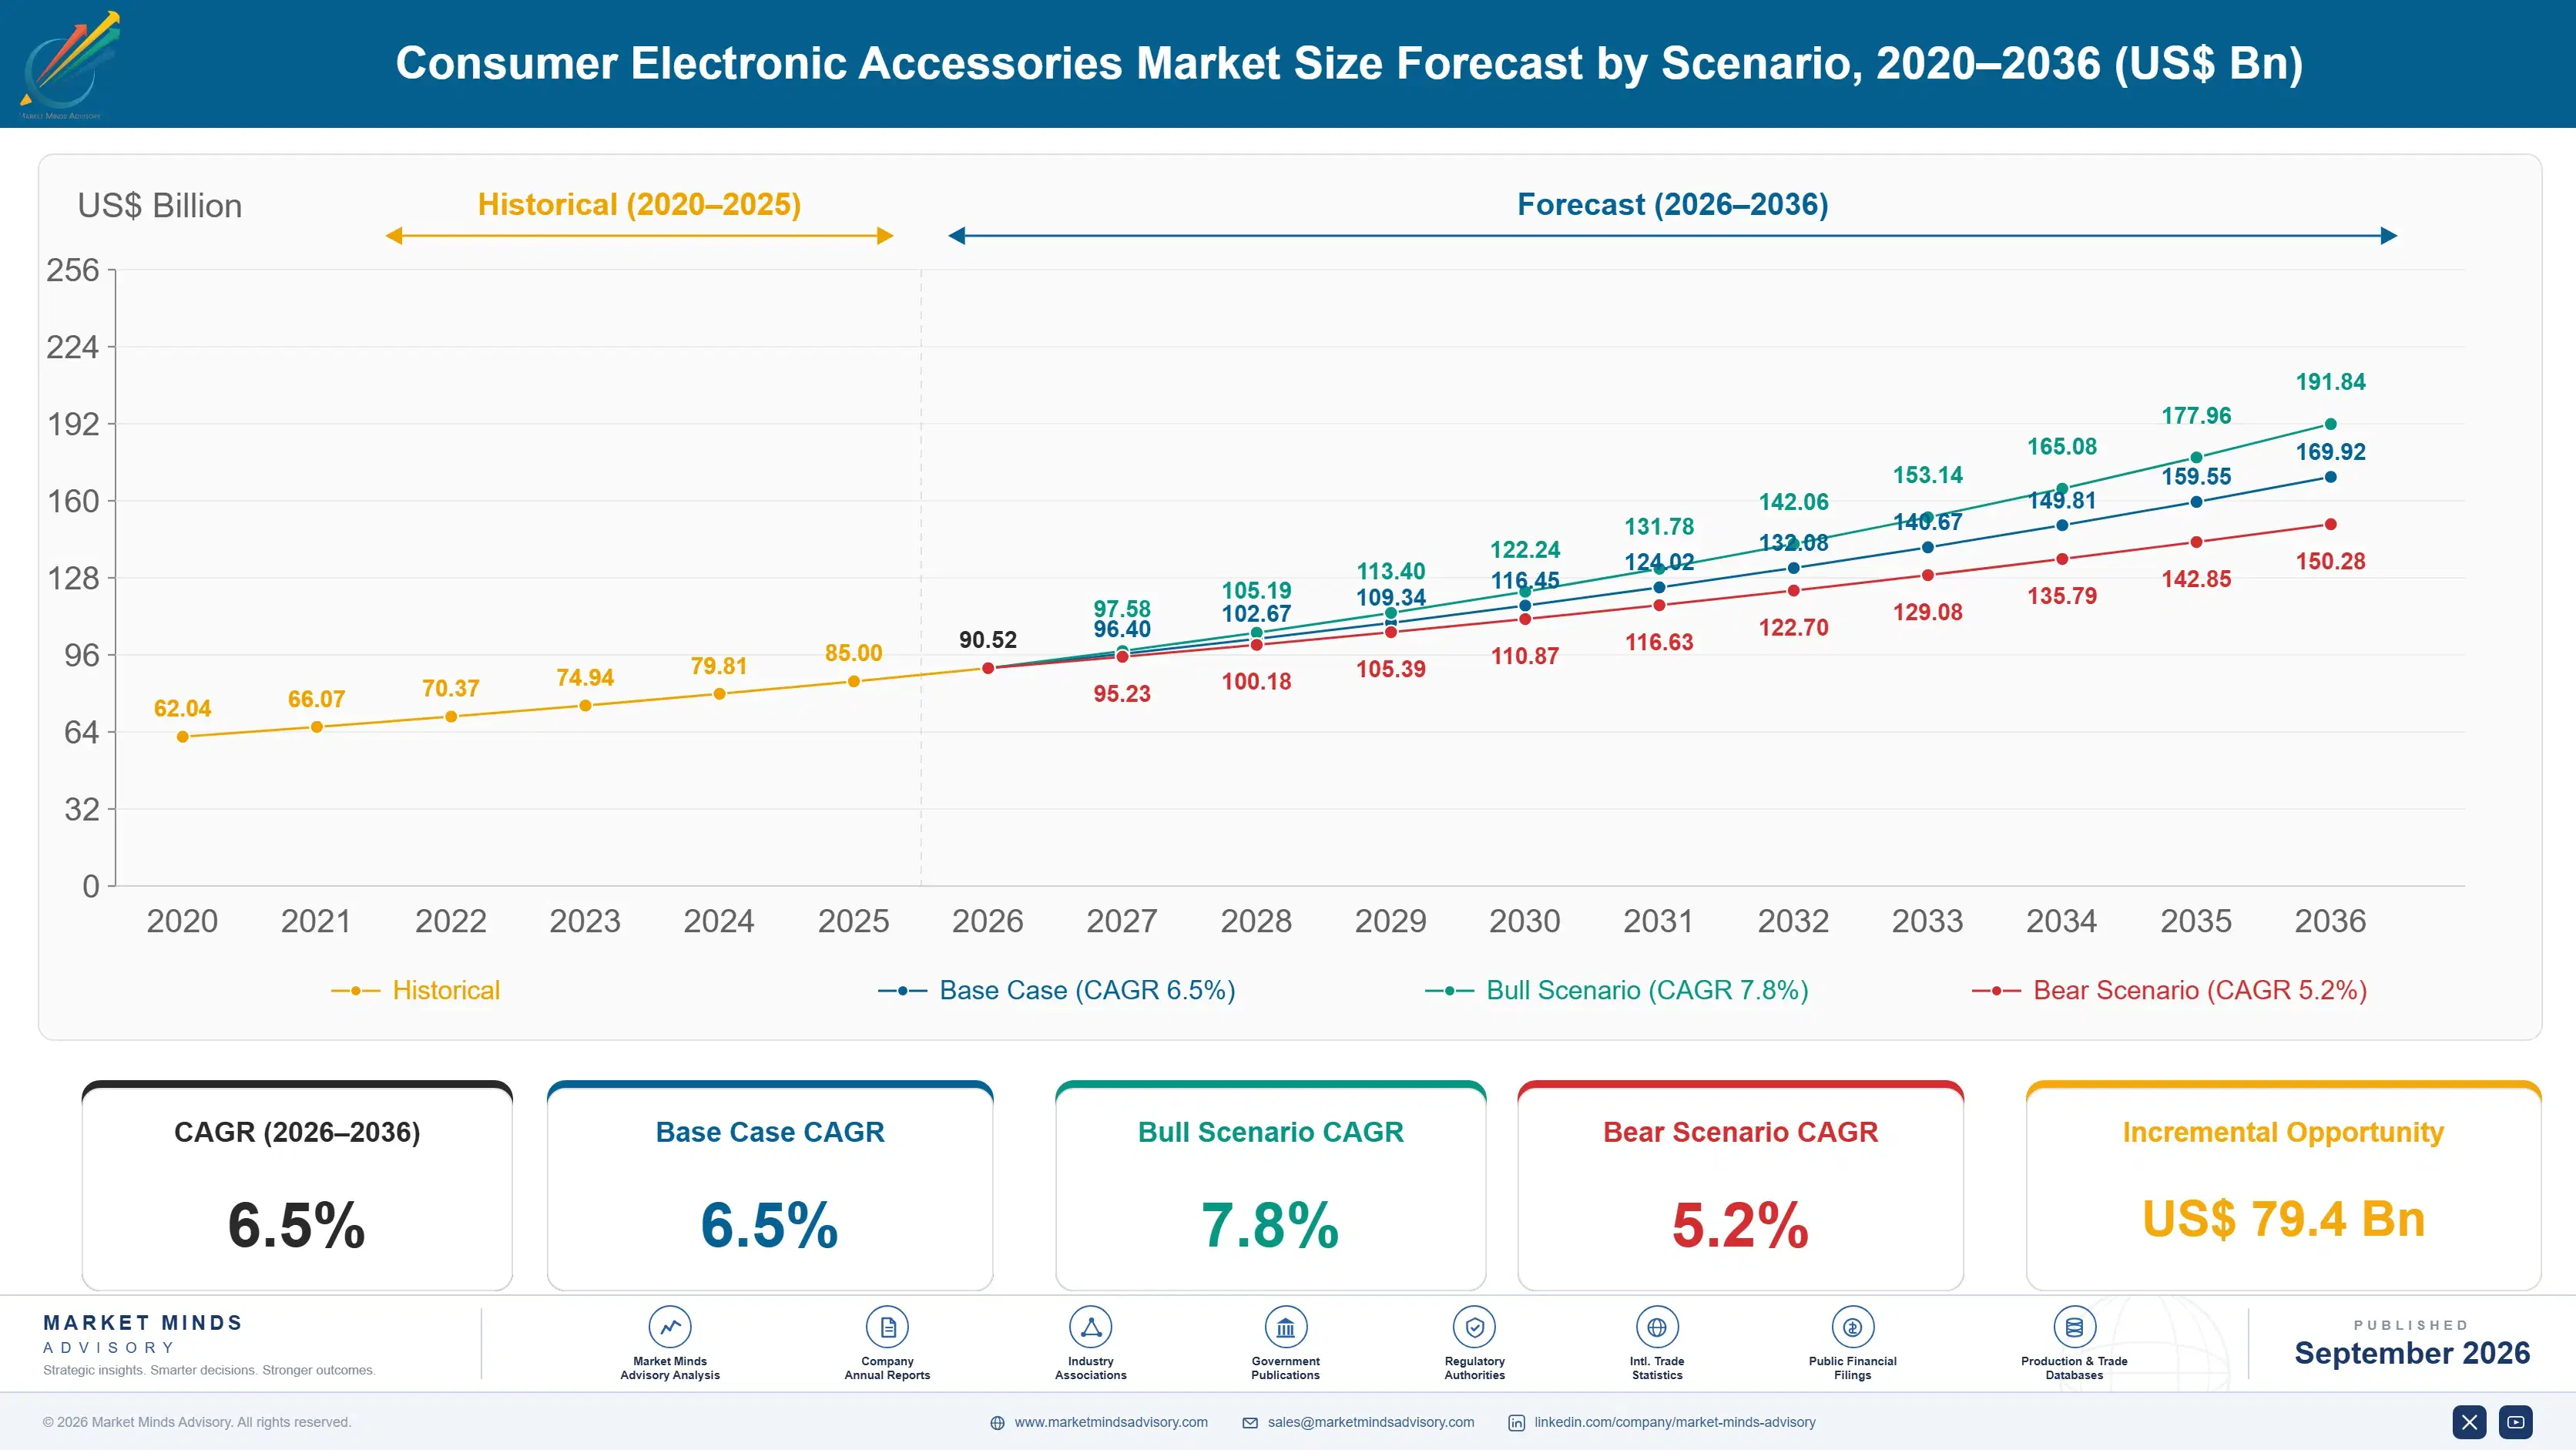
consumer-electronic-accessories-market-size-forecast-scenario-1788421402442
Between 2020 and 2025 the category grew steadily alongside rising smartphone and wearable device penetration globally, with charging accessory demand accelerating meaningfully from 2023 onward as fast-charging standards proliferated across mid-range device tiers previously limited to slower charging speeds. Pandemic-era e-commerce growth permanently shifted a meaningful share of category sales toward direct online channels. Historical annual growth averaged roughly 5.8 percent across this period, MMA estimates.
The base case assumes continued solid growth driven by three mechanisms: mandatory USB-C standardisation forcing replacement of legacy charging accessories across a large existing installed base, continued smartwatch and wireless earbud adoption creating genuinely new accessory categories with limited prior market history, and rising average selling prices as premium materials and fast-charging capability command higher prices than basic legacy accessories. These three mechanisms compound fastest in markets combining high smartphone penetration with rapid wearable device adoption simultaneously.
A bull scenario turns on wearable device adoption accelerating faster than currently expected, pulling forward demand for wearable-specific accessory categories industry-wide. The bear risk is continued commoditisation and price compression across basic accessory categories as private-label and marketplace-only brands undercut established brands on price, compressing category-wide average selling prices faster than premium segment growth can offset.

A Fragmented Category Reshaped by Standardisation and Wearables

Two forces are converging on this category at once: mandatory USB-C standardisation forcing a wholesale redesign of charging accessory product lines within a defined compliance window, and continued wearable device proliferation creating entirely new accessory categories that barely existed in meaningful volume five years ago. Together these are pulling manufacturer research and development budgets toward faster product refresh cycles than the category has historically required.
MARKET CONCENTRATIONCR5 28%Reflects an extremely fragmented, brand-diverse competitive category overall
AVERAGE SELLING PRICEUSD 14 per accessory unitBlended across cases, cables, chargers, and wearable bands
TOP PRODUCING COUNTRY SHAREChina 34%Reflects heavily concentrated contract manufacturing and assembly capacity
E-COMMERCE CHANNEL SHARE58% of category unit salesPortion of accessory sales completed through online retail channels
USB-C COMPLIANCE TRANSITION RATE64% of new charging SKUsShare of new charging products now shipping USB-C only
AVERAGE PRODUCT REPLACEMENT CYCLE18 months per accessoryTypical interval before consumers replace a given accessory
Commercially, the market behaves like a genuinely fragmented consumer goods category rather than a concentrated technology market, with hundreds of brands competing across price tiers from budget marketplace listings to premium branded retail products. Direct-to-consumer e-commerce has meaningfully lowered the barrier to entry for new brands, intensifying price competition even as a smaller number of established brands maintain premium positioning through design and retail partnership relationships.
Over the next decade, expect continued category fragmentation at the budget end even as premium brands consolidate share through design differentiation, retail exclusivity partnerships, and expansion into adjacent wearable accessory categories. Manufacturers that build genuine design and brand identity will command durable pricing power even as basic commodity accessories continue seeing persistent price compression across most online marketplace channels.
"Nobody has a moat selling a phone case. The moat is in becoming the brand people trust enough to buy the case before they've even unboxed the phone."
Director, Consumer Electronics and Retail Technology Practice · MMA Technology Practice · September 2026

Market Trends

USB-C Regulatory Mandates Force Charging Accessory Redesign

Regulatory mandates requiring USB-C charging ports across smartphones and select other devices sold in the European Union and several other major markets are forcing charging accessory manufacturers to redesign cable, adapter, and power bank product lines within a defined compliance transition window. MMA's Q4 2025 primary research found USB-C-only products representing sixty four percent of new charging accessory stock keeping units introduced during 2025, up from roughly thirty one percent two years earlier. This shift is creating a genuine replacement cycle opportunity as consumers with older, incompatible accessories need new USB-C compatible products.
Market Impact: Drives 61% of new accessory purchases
Wearable Device Proliferation Creates New Accessory Categories

Rising adoption of smartwatches, wireless earbuds, and fitness trackers is creating genuinely new accessory categories, replacement bands, charging cases, and protective covers specific to wearable form factors, that carry limited prior market history compared to established smartphone accessory categories. MMA's expert interview programme found wearable-specific accessory categories growing considerably faster than smartphone accessory categories overall, with several established brands actively expanding product lines to cover wearable devices for the first time. This shift is broadening the category's addressable market meaningfully beyond its historical smartphone-centric core, creating genuinely new revenue pools for brands that move quickly into these newer product categories.
Market Impact: Lifts fast-charging adapter prices 24%

Market Opportunities and Growth Drivers

Rising Smartphone and Wearable Device Penetration Sustains Volume

Continued smartphone and wearable device penetration growth, particularly in emerging markets still reaching mainstream smartphone ownership levels, sustains the underlying device installed base this category depends upon for accessory attachment sales regardless of specific technology transition timing. Surveyed retailers linked sixty one percent of new accessory purchases directly to a recent device purchase or upgrade, according to MMA's Q4 2025 primary research. This direct linkage between device sales cycles and accessory demand means markets with the fastest-growing device penetration also generate the fastest-growing accessory demand, reinforcing regional growth patterns already visible in device sales data.
Market Impact: Cuts commodity margins 5 points

Fast-Charging Standard Proliferation Drives Premium Adapter Demand

Proliferation of fast-charging standards across mid-range and budget device tiers previously limited to slower charging speeds is driving consumer demand for compatible fast-charging adapters and cables, since older, slower-charging accessories cannot deliver a device's full fast-charging capability even when physically compatible. Surveyed consumers reported willingness to pay meaningfully more for accessories certified to support their specific device's maximum charging speed, according to MMA's Q4 2025 expert interview programme covering consumer electronics buyers. This willingness to pay a premium for verified fast-charging compatibility is lifting average selling prices across the charging accessory segment specifically.
Market Impact: Extends development cycles 4 weeks

Market Restraints and Challenges

Marketplace Price Competition Compresses Brand Margins

Established accessory brands face intense price competition from marketplace-only and private-label sellers offering functionally similar products at meaningfully lower prices, compressing gross margins across most commodity accessory categories. The root cause is that manufacturing barriers to entry for basic accessories remain low, letting new sellers enter categories quickly without the design, brand, or retail relationship investment established brands have made. The commercial impact shows up as declining average selling prices in the most commoditised categories, even as unit volume continues growing steadily. Several established brands are shifting product mix toward premium, design-differentiated categories less exposed to marketplace price competition.
Market Impact: Lifts USB-C-only SKU share 33 points

Rapid Product Design Cycles Strain Smaller Manufacturer Resources

The category's increasingly rapid product design refresh cycle, driven by frequent new device launches and evolving material and colour trends, is straining smaller manufacturers' design and tooling resources relative to larger competitors with dedicated design teams. The root cause is that consumer expectations for current-generation device compatibility and on-trend design have compressed acceptable development timelines considerably compared to the category's historical pace. The commercial impact falls hardest on smaller manufacturers unable to match larger competitors' design speed, risking unsold inventory tied to prior device generations. Several smaller manufacturers are focusing on universal, device-agnostic accessories less exposed to rapid redesign cycles.
Market Impact: Adds 9.5% segment CAGR versus category
3 additional market trends, 4 additional growth drivers, and 3 additional restraints and challenges are covered in the full report. Contact sales@marketmindsadvisory.com to access the complete intelligence.

Segment CAGR and Growth Architecture

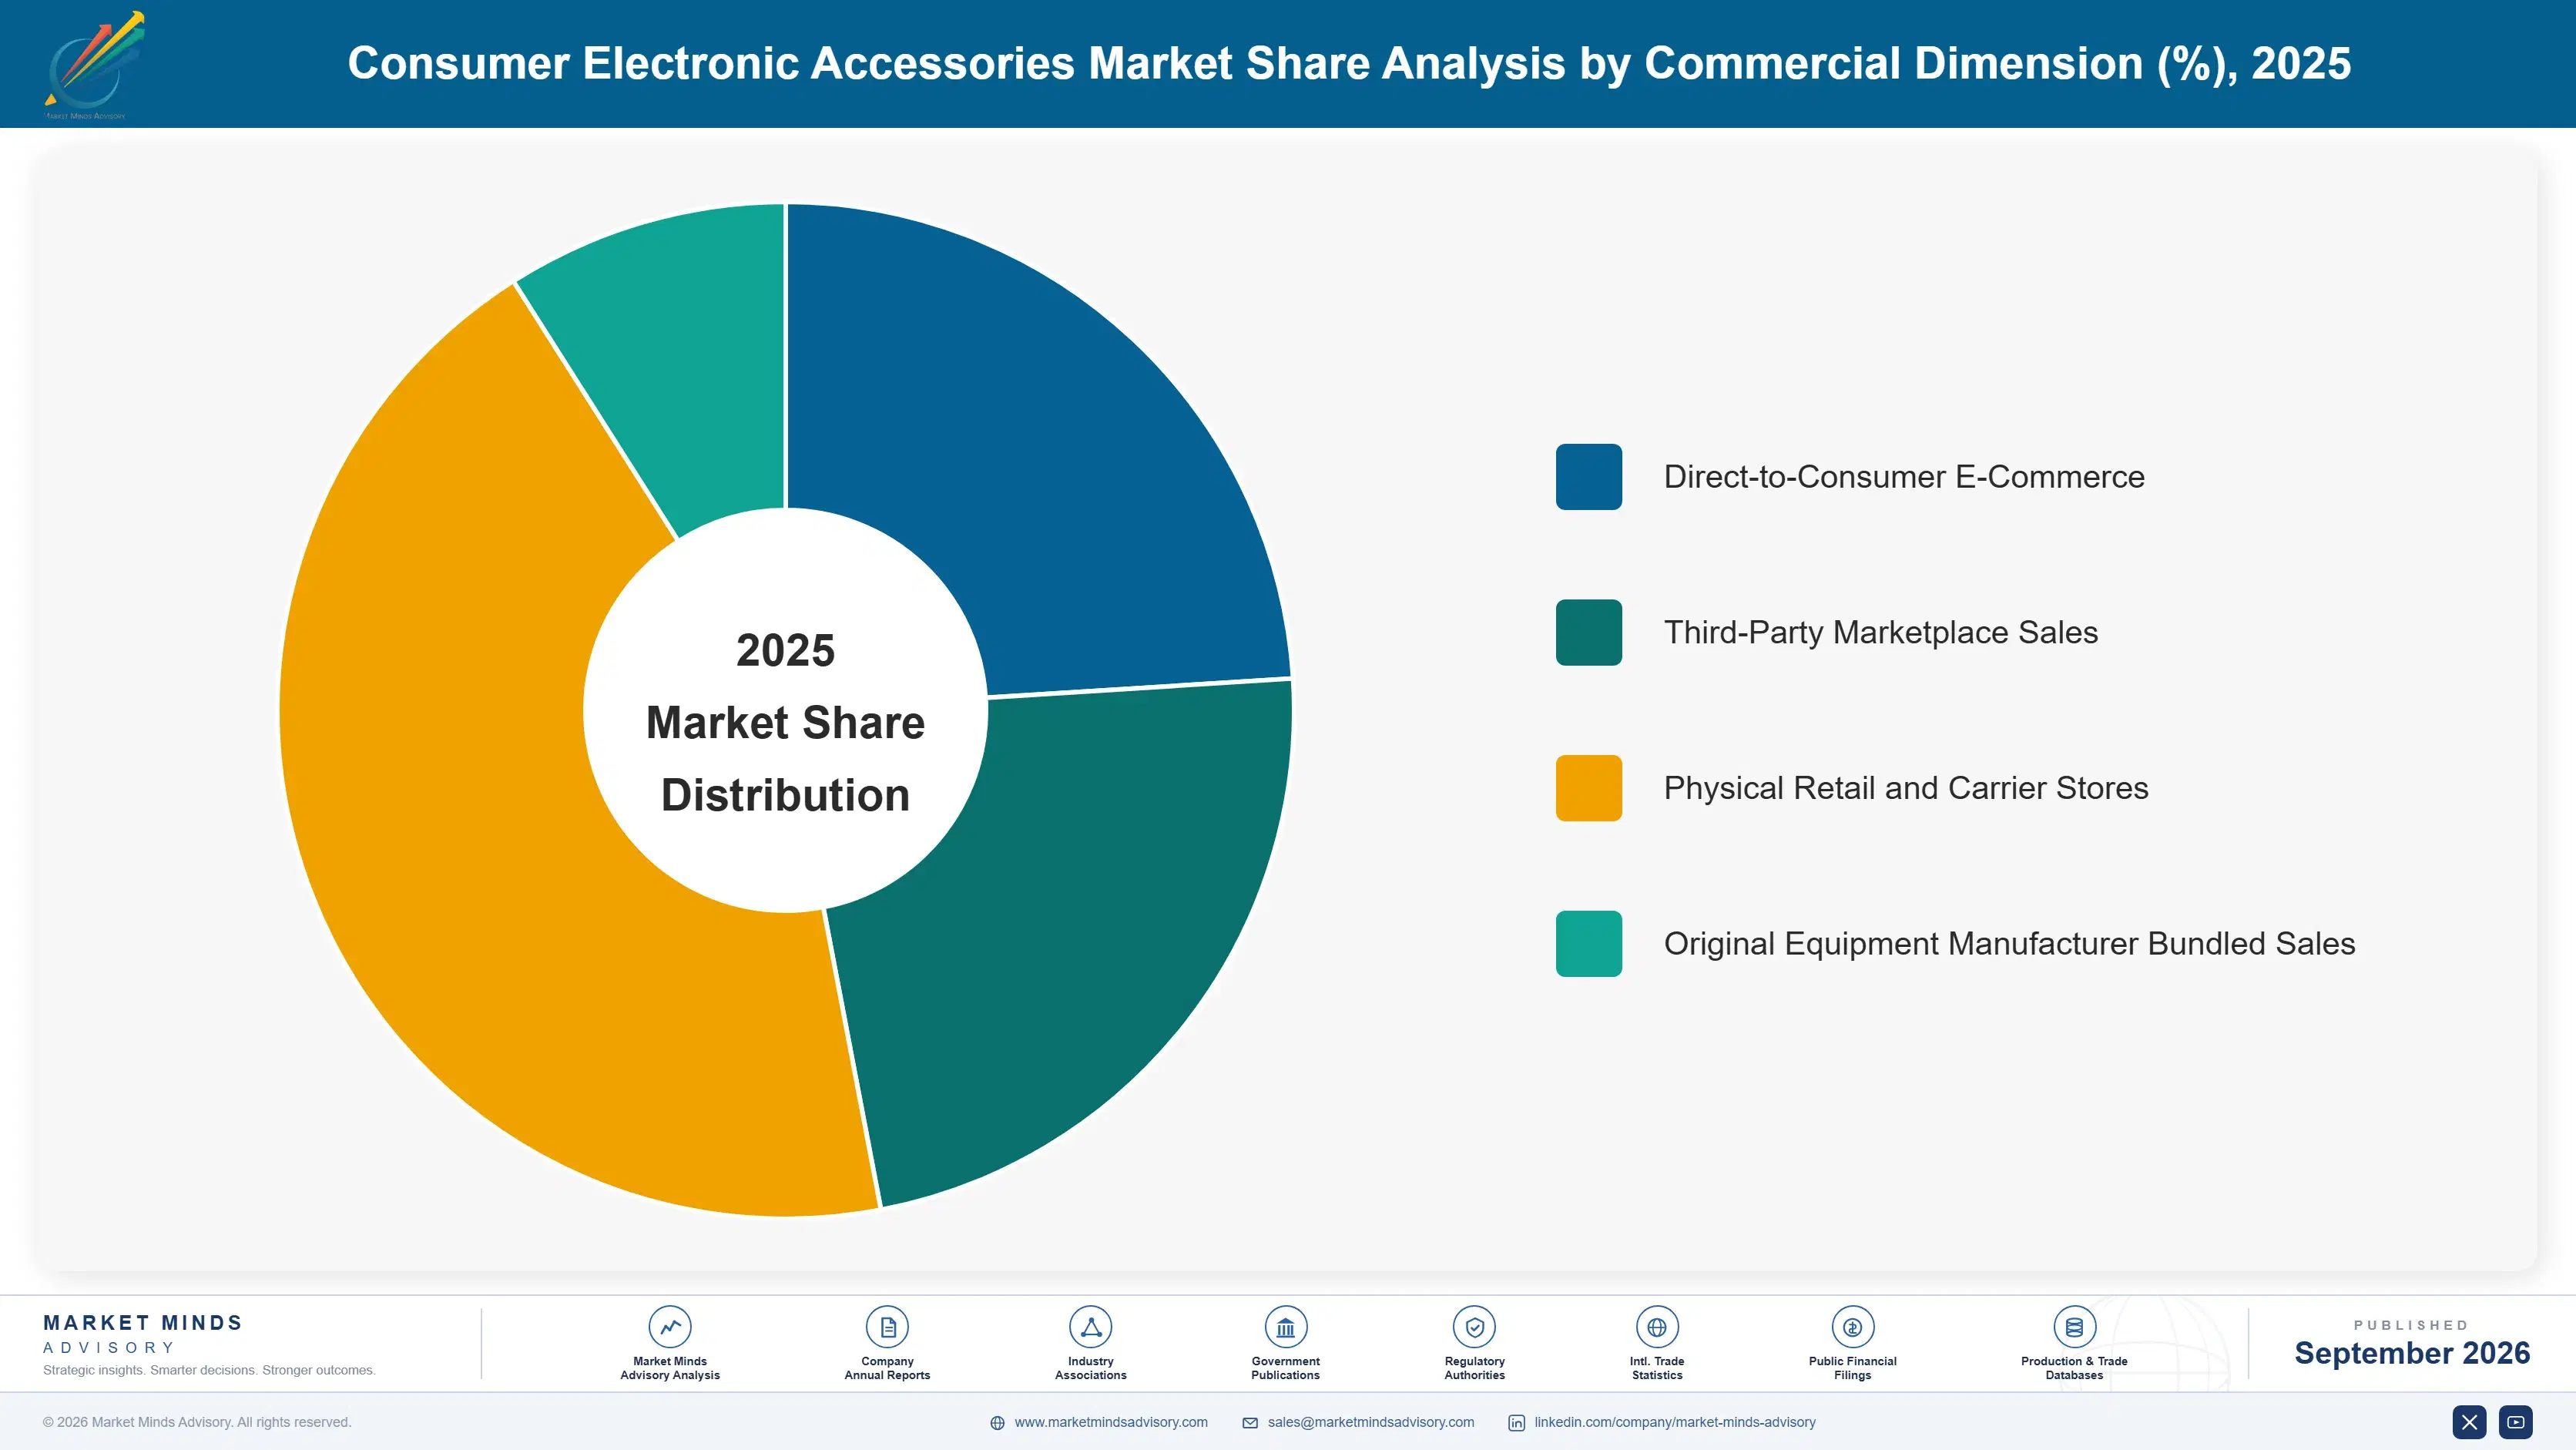
Segmentation follows accessory product type, since that dimension best explains both manufacturing process and buyer purchasing behaviour, spanning protective cases through charging accessories to newer wearable-specific bands and cases. This single classification logic keeps upstream product type separate from downstream end-use device category and commercial channel, preserving mutually exclusive, collectively exhaustive segment boundaries throughout the analysis.
consumer-electronic-accessories-market-market-share-analysis-1788421403004

Charging Accessories

This segment covers charging cables, wall adapters, wireless charging pads, and portable power banks used to charge smartphones, tablets, and wearable devices, spanning both basic commodity products and premium fast-charging certified accessories carrying meaningfully higher prices. Adoption spans nearly the entire device-owning population, making this one of the category's largest segments by unit volume, while growth is additionally boosted by the ongoing USB-C standardisation transition forcing widespread replacement of legacy charging accessories across the installed base. Growth is outpacing every other segment in this report because the combination of mandatory standardisation-driven replacement demand and rising fast-charging adoption creates a uniquely favourable growth environment not present in other categories facing more typical, gradual replacement cycles.
CAGR 9.5%

Wearable Bands and Straps

This segment covers replacement bands, straps, and cases specifically designed for smartwatches and fitness trackers, a category with limited prior market history that has grown rapidly alongside wearable device adoption over the past several years. Demand is rising as wearable device owners increasingly treat band and strap variety as a genuine personalisation and fashion choice rather than a purely functional purchase, supporting multiple band purchases per device owned rather than a single replacement purchase. Growth trails the charging accessories segment only because the wearable device installed base, while growing quickly, remains considerably smaller than the overall smartphone installed base driving charging accessory demand across the broader category. Manufacturers here increasingly design bands as fashion items sold in curated collections.
CAGR 8.2%
Full segment breakdown across 6 segments available in the complete report.

Regional Architecture and Country Demand Map

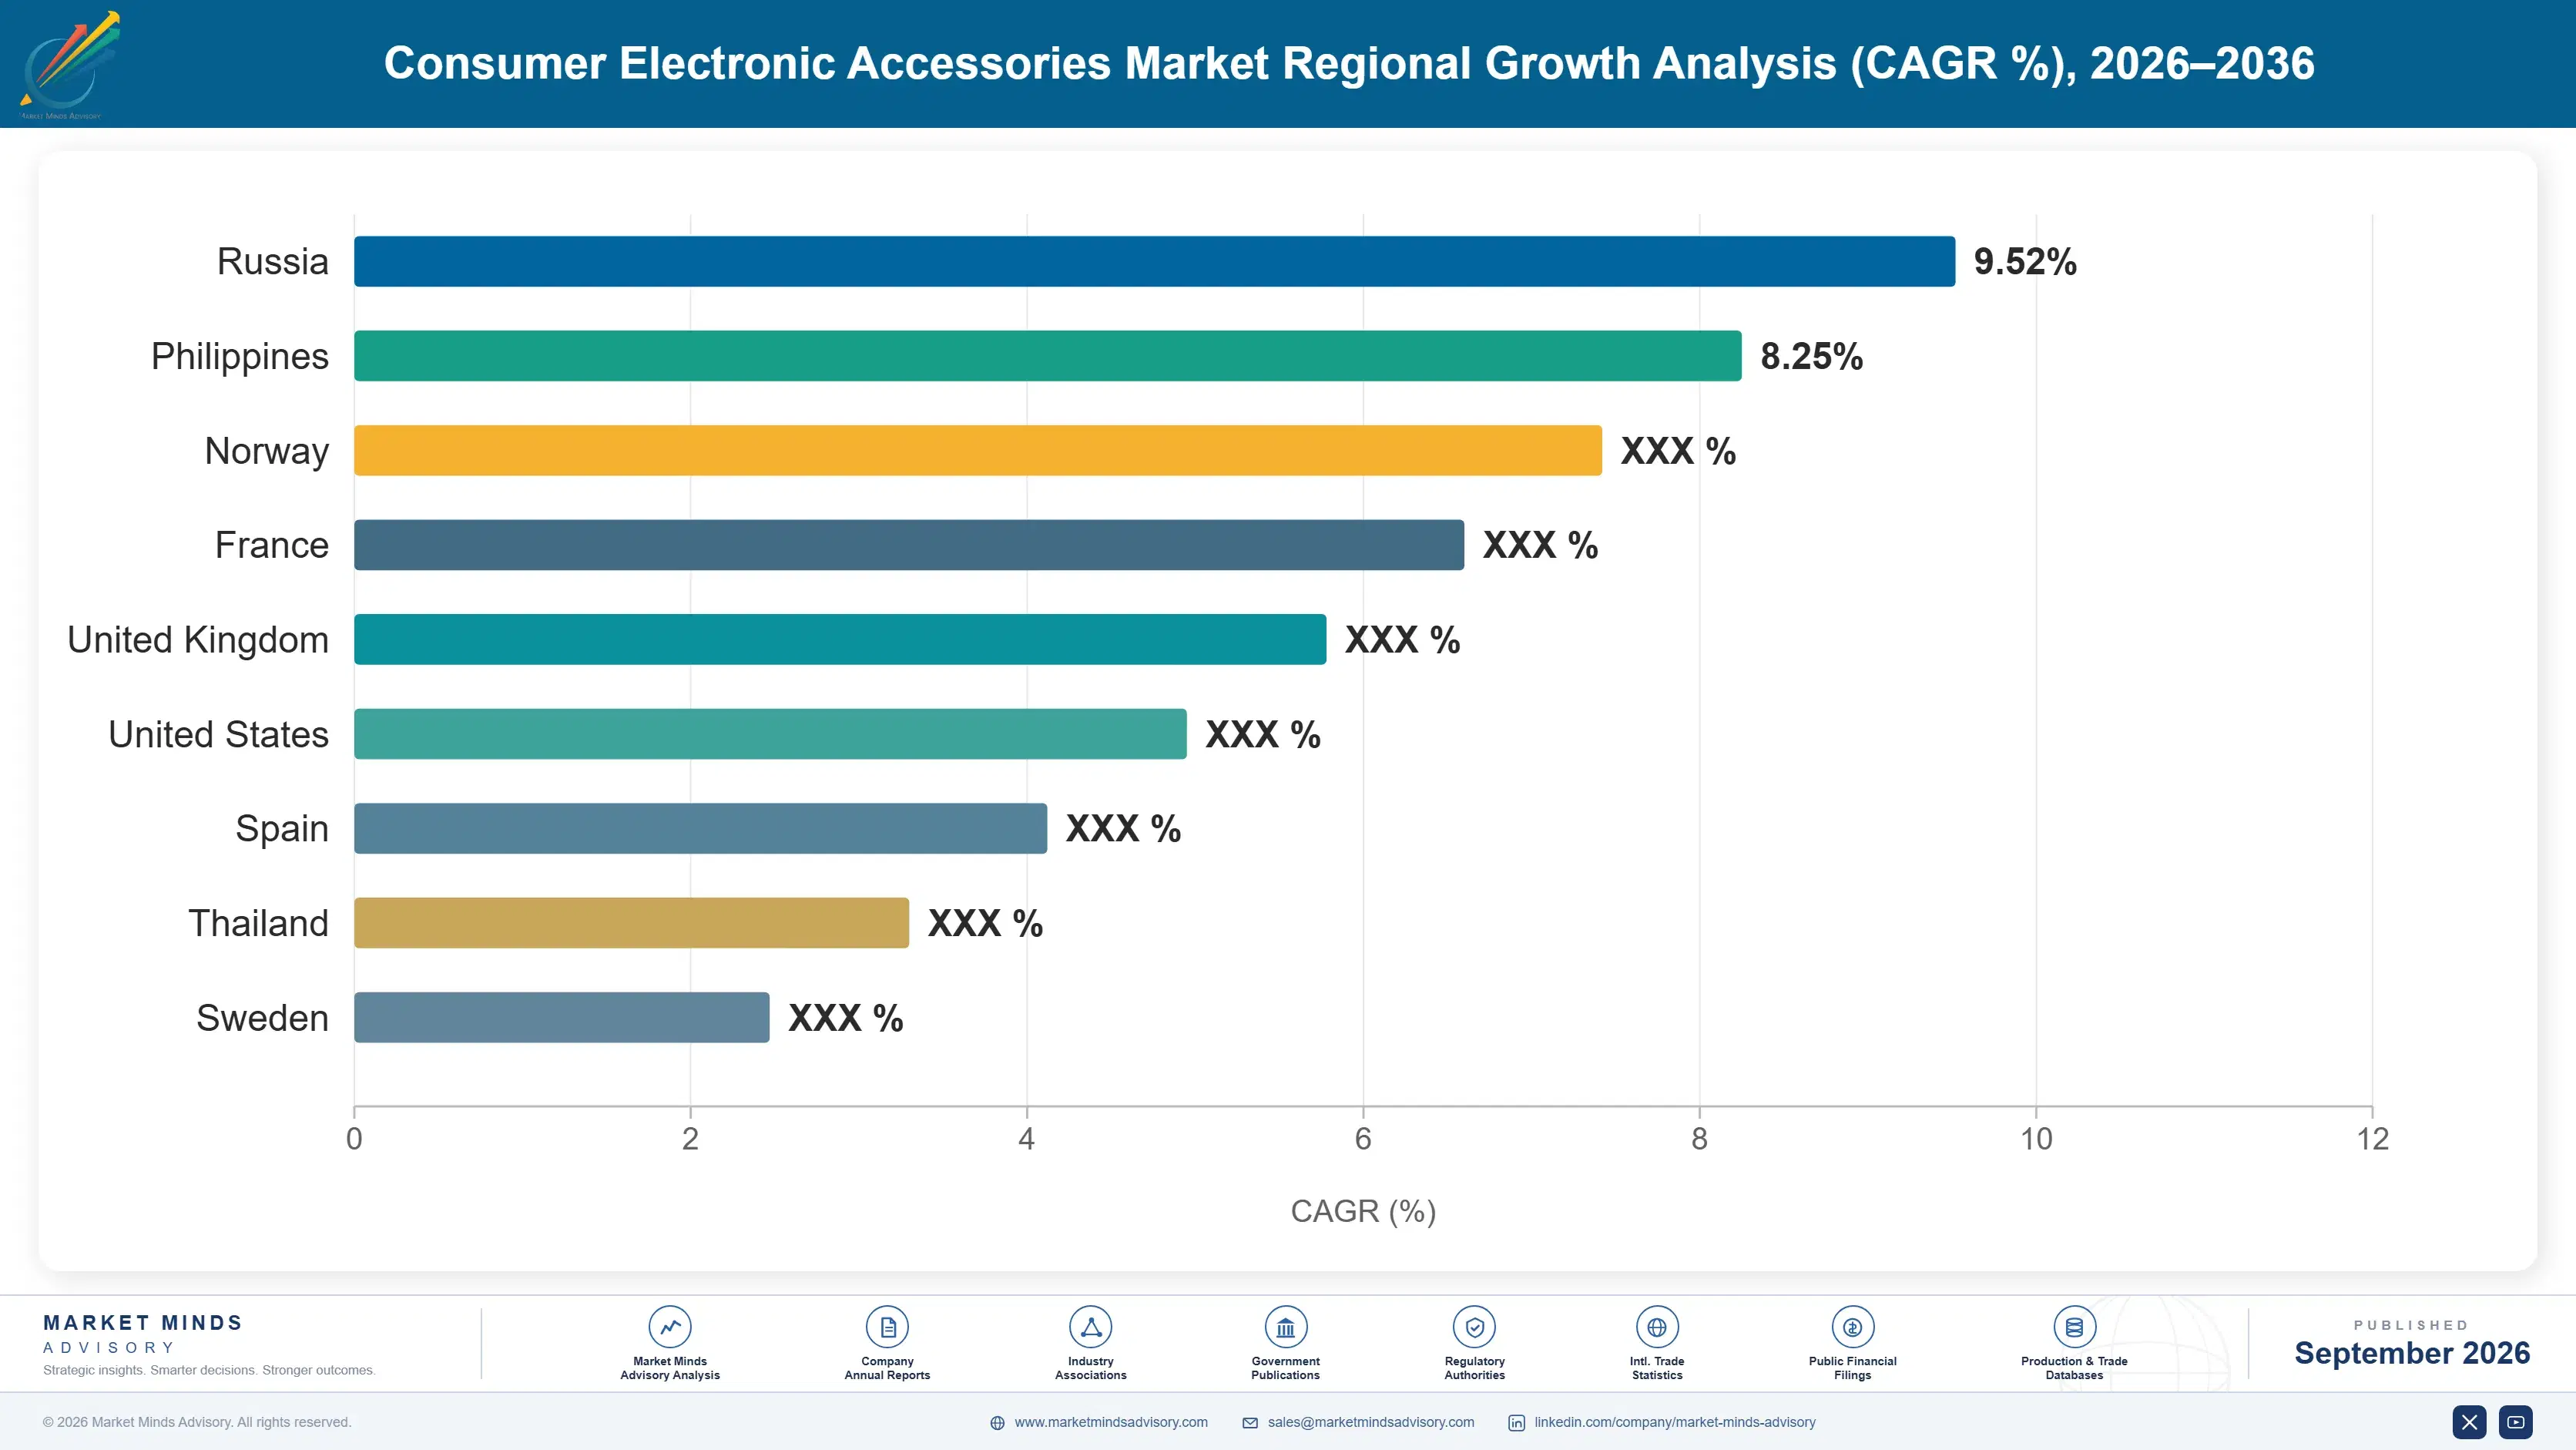
East Asia anchors nearly a third of global revenue, reflecting concentrated contract manufacturing capacity and the world's largest smartphone user population, while South Asia and Pacific delivers the fastest regional expansion through rising device penetration. Latin America and Eastern Europe remain the two smallest regional contributors tracked in this report.

North America

United States consumers drive the overwhelming majority of regional demand, supported by high smartphone and wearable device penetration and a mature e-commerce infrastructure that supports rapid product discovery and purchase across thousands of competing brands. Canadian consumer spending patterns closely mirror the United States, with similar brand preferences and retail channel distribution. Growth here runs close to the global base rate since the region's device penetration, while extensive, is already largely saturated, limiting new accessory demand growth to replacement cycles and wearable category expansion specifically rather than new device-driven attachment sales this year. Enterprise-adjacent bulk purchasing for corporate device programmes remains a stable secondary demand source. this year specifically across most major metropolitan markets.
Share: 24% | CAGR: 7.3% (2026 to 2036)

Western Europe

German and French consumers drive the bulk of regional demand, with the region's early and complete USB-C mandate compliance creating a concentrated replacement cycle for charging accessories that occurred somewhat earlier than in less regulated markets. United Kingdom consumers show strong wearable device adoption, supporting strong demand for wearable-specific accessory categories. Growth trails the global rate somewhat because European smartphone penetration is already largely saturated, and the region's USB-C transition-driven demand surge has already substantially played out relative to markets still completing that transition. Nordic countries show similarly strong wearable adoption patterns across smaller national markets. across the wider region overall this year, with Nordic markets showing similarly strong adoption patterns.
Share: 18% | CAGR: 5.1% (2026 to 2036)
Regional intelligence for 5 additional markets available in the complete report: East Asia, South Asia and Pacific, Latin America, Middle East and Africa, Eastern Europe. Contact sales@marketmindsadvisory.com.
consumer-electronic-accessories-market-country-cagr-analysis-1788421403510

Where Accessory Brands Can Still Expand Margin

Four commercial levers separate brands compounding margin as the category fragments further from those competing purely on marketplace price, spanning fast-charging certification premiums, wearable category expansion, retail exclusivity partnerships, and direct-to-consumer brand building. Execution difficulty varies across these four paths, and brands without existing certification infrastructure or retail relationships will find some levers considerably harder to pursue quickly.

Achieving Fast-Charging Certification for Premium Pricing

Brands that achieved recognised fast-charging certification for their cable and adapter products are capturing meaningfully higher average selling prices than uncertified competitors, since consumers increasingly seek verified compatibility assurance before paying for a premium charging accessory rather than risking incompatibility with an uncertified alternative. Certified brands reported average selling prices roughly 38 percent above uncertified competitors, based on disclosed pricing reviewed across the fifteen largest charging accessory brands tracked. The approach requires investment in certification testing and ongoing compliance maintenance that smaller manufacturers sometimes deprioritise in favour of faster, uncertified product launches.
Market Impact: Lifts average selling price by roughly 38 percent

Expanding Into Wearable-Specific Accessory Categories Early

Brands that expanded into wearable-specific accessory categories, bands, straps, and charging cases, ahead of competitors are capturing a disproportionate share of this newer, faster-growing revenue pool before broader competitive entry intensifies. This lever compounds because early wearable category entrants build brand recognition specifically for wearable accessories that later entrants must overcome through additional marketing investment. Brands with established wearable category presence reported revenue growth roughly 42 percent higher in this specific category than competitors entering the space later. Brands without early wearable category presence face a meaningfully harder path to matching this advantage quickly given the credentialing effect involved.
Market Impact: Lifts wearable revenue by roughly 42 percentage points

Securing Retail Exclusivity Partnerships With Major Carriers

Brands that secured retail exclusivity partnerships with major mobile carriers and device retailers are winning meaningfully higher volume at more stable pricing than brands relying solely on open marketplace distribution, since exclusive retail placement reduces direct price comparison pressure from competing brands within the same retail environment. This lever requires established retail relationships and consistent supply reliability that smaller, less established brands often cannot yet offer at the scale major retailers require. Brands with exclusivity partnerships reported gross margins roughly 11 percentage points above marketplace-only competitors. across nearly every major retail partnership evaluated recently.
Market Impact: Lifts gross margin by roughly 11 percentage points

Building Direct-to-Consumer Brand Loyalty Through Owned Channels

Brands that invested in direct-to-consumer e-commerce channels and owned brand marketing are capturing better margins and more predictable repeat purchase behaviour than brands relying entirely on third-party marketplace listings, since direct customer relationships let brands avoid marketplace platform fees and build genuine customer loyalty data. This lever requires sustained marketing investment that smaller manufacturers sometimes cannot sustain without meaningful revenue already established. Brands with mature direct-to-consumer channels reported repeat purchase rates roughly 27 percentage points higher than marketplace-only competitors. across nearly every brand pursuing sustained direct-to-consumer investment. particularly among brands with limited existing marketing budgets.
Market Impact: Lifts repeat purchase rate by roughly 27 percentage points

Who Controls the Margin Pool

CR5 sits at twenty eight percent, evaluated on disclosed accessory segment revenue across the top brands, reflecting an extremely fragmented category where hundreds of brands compete without any single manufacturer holding commanding overall share. The gap between the largest brands and smaller competitors is considerable in recognition but narrow in unit volume.
Current competitive activity centers on three fronts: achieving fast-charging certification to command premium pricing over uncertified alternatives, expanding into wearable-specific accessory categories ahead of broader competitive entry, and securing retail exclusivity partnerships to reduce direct marketplace price comparison pressure. Price competition remains intense at the commodity end of the category while design and certification differentiation matter increasingly at the premium end.

Emerging pressure is building from two directions. Chinese domestic direct-to-consumer brands are scaling rapidly through social commerce and marketplace platforms, threatening established Western brands first in price-sensitive commodity categories before potentially moving into premium segments. At the premium end, device manufacturers themselves are expanding their own first-party accessory lines, a dynamic that could meaningfully compress third-party accessory brands' addressable market for device-specific premium accessories over the next several years. Established brands without a first-party accessory response risk losing the most profitable device-specific premium segment entirely over time.
consumer-electronic-accessories-market-company-positioning-matrix-1788421404030

Competitive Moat and Risk Dimensions

ANKER INNOVATIONS LIMITED

Moat: Broad Charging Technology Portfolio Depth

Anker's deep charging technology engineering capability and broad product portfolio spanning cables, adapters, and power banks give it a credibility advantage among consumers specifically seeking verified fast-charging compatibility, a reputation smaller or newer charging brands cannot easily replicate without years of comparable engineering investment. over many years.
ANKER INNOVATIONS LIMITED

Risk: Marketplace Counterfeit Product Exposure

Anker faces persistent exposure to counterfeit and knockoff products sold on major marketplace platforms trading on its brand recognition, and consumers occasionally purchasing counterfeit products expecting genuine Anker quality can damage brand reputation despite the company's own product quality remaining unaffected. This exposure is difficult to fully eliminate given the scale of major marketplace platforms.
BELKIN INTERNATIONAL INC.

Moat: Established Retail Distribution Relationships

Belkin's long-standing relationships with major electronics retailers and mobile carriers give it retail shelf space and exclusivity opportunities that newer, less established brands struggle to secure, particularly for premium retail placement in physical stores where marketplace-style price comparison is less immediate. across physical retail specifically.
BELKIN INTERNATIONAL INC.

Risk: E-Commerce Channel Transition Pressure

Belkin's traditional strength in physical retail distribution leaves it comparatively less optimised for direct-to-consumer e-commerce competition, and building comparable digital marketing and direct sales capability is proving slower than dedicated digital-first competitors already established in online channels. This transition gap could persist unless Belkin invests further in digital-first marketing talent.

Players Tracked

Prominent Players

Anker Innovations Limited
Belkin International Inc.
Zagg Inc.
Logitech International S.A.
Ugreen Group Limited

Other Key Players

Otter Products LLC
Spigen Inc.
UAG (Urban Armor Gear) LLC
Native Union Limited
Shenzhen Ruite Electronic Technology Co Ltd
Case-Mate LLC
PopSockets LLC
Sozo Global Ltd
Aukey Technology Co Ltd
Sunvalley Group Inc.
Incipio LLC
Speck Products
Griffin Technology LLC
Moshi Inc.
Evana Technology Co Ltd

Recent Developments

FEBRUARY 2026

Anker Launches Wearable-Specific Charging Accessory Line

Anker launched a dedicated wearable-specific charging accessory line covering multiple smartwatch and earbud brands, extending its core charging technology portfolio into the fastest-growing segment of the wearable accessory category ahead of broader competitive entry from other charging brands. Early customer feedback has been positive across initial launch markets.
Signal: Confirms established charging brands racing to capture wearable accessory category growth. ahead of similar launches from smaller competitors.
OCTOBER 2025

Zagg Acquires Wearable Band Startup StrapWorks

Zagg completed the acquisition of wearable band startup StrapWorks, adding design and manufacturing capability for smartwatch bands and straps intended to strengthen its position in the wearable accessory category alongside its existing screen protection and case product lines. Financial terms of the acquisition were not disclosed publicly.
Signal: Indicates wearable category acquisition activity accelerating among established accessory brands. as brands race to build comparable wearable design capability.
JUNE 2025

Belkin Signs Multi-Year Retail Exclusivity Agreement With Major Carrier

Belkin signed a multi-year retail exclusivity agreement with a major mobile carrier covering charging and protective accessory placement across the carrier's retail store network, securing prominent shelf space ahead of competing brands in physical retail locations nationwide. Financial terms of the agreement were not disclosed by either party.
Signal: Signals retail exclusivity partnerships remaining a key competitive lever despite e-commerce growth. across other carrier retail networks nationally.

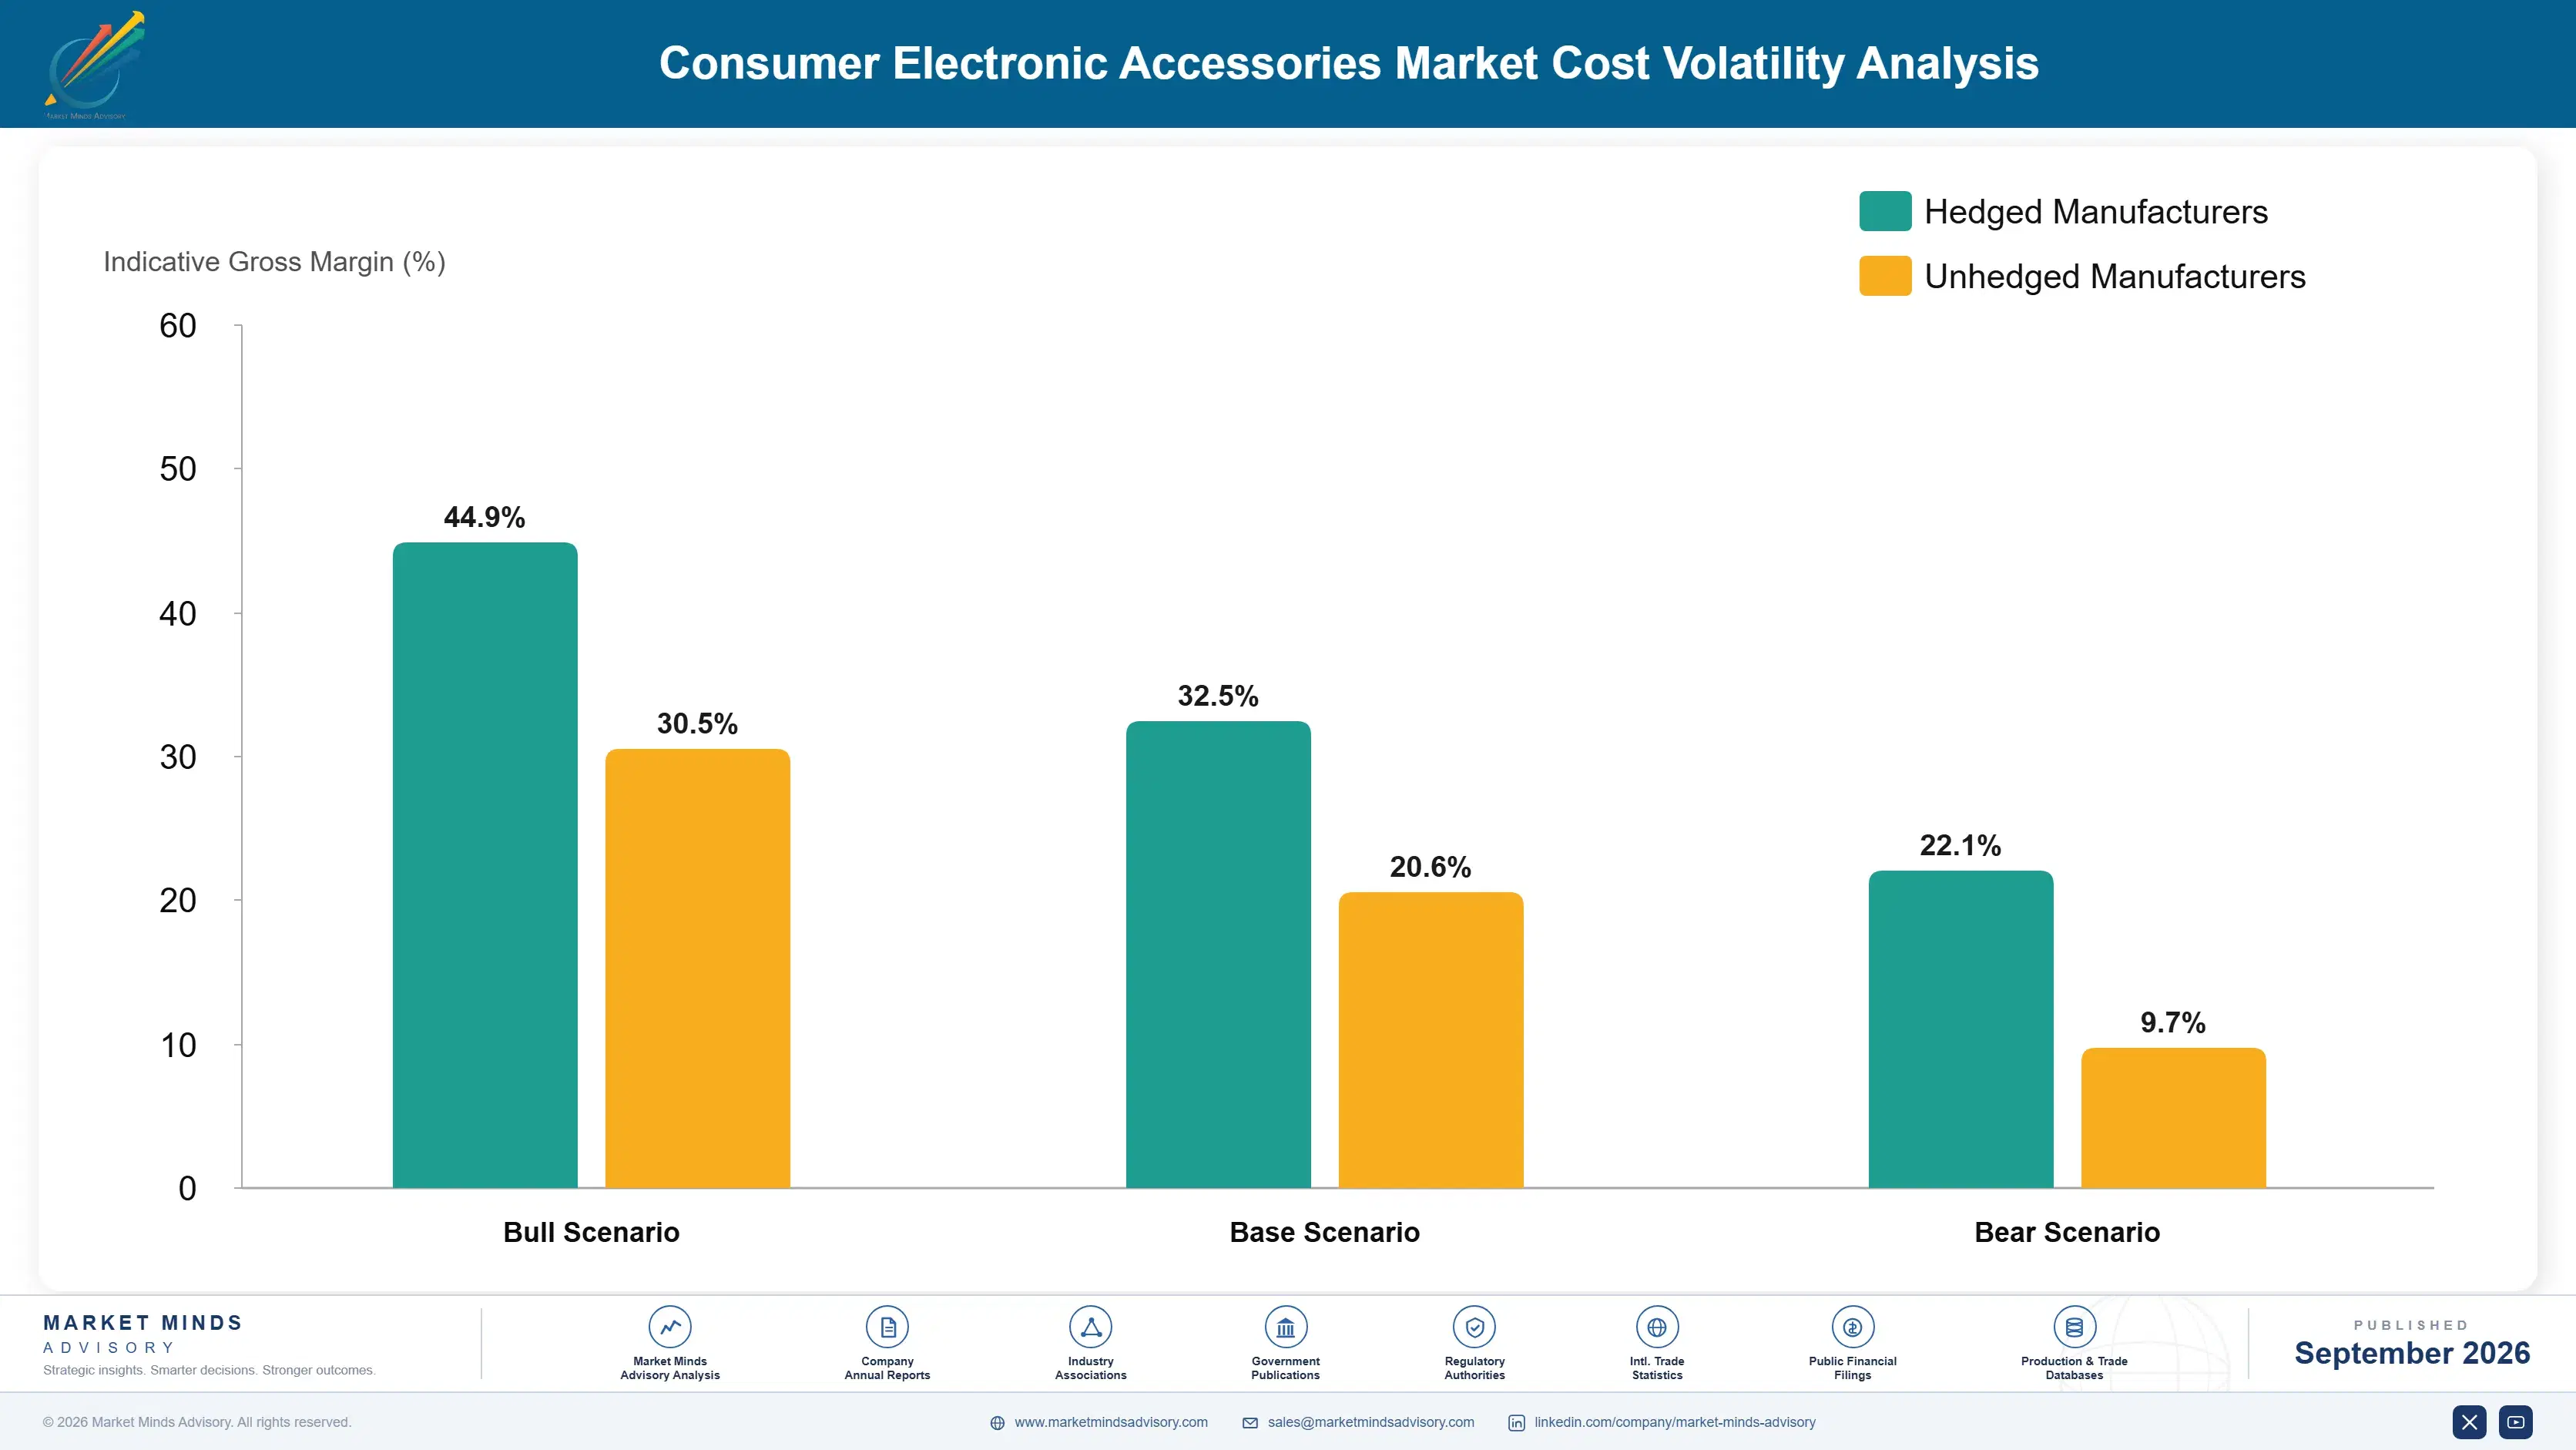
Plastics and Contract Manufacturing Cost Exposure

Plastic resins and electronic components together represent a substantial cost input for accessory manufacturers, running an estimated 40 to 48 percent of cost of goods sold for standard products, sourced primarily from petrochemical feedstock and contract manufacturing capacity concentrated in China and other East Asian manufacturing hubs. Packaging materials add a smaller but meaningful cost share, particularly for premium products emphasising retail presentation.
Contract manufacturing capacity and shipping cost volatility became a significant commercial issue during 2025 as global shipping rates fluctuated meaningfully across major trade lanes, a pattern consistent with global logistics trends tracked across multiple manufacturer annual reports and public disclosures reviewed for this report. Brands without diversified manufacturing relationships across multiple contract manufacturers faced greater exposure to single-factory disruption than those with established multi-supplier relationships.

The competitive disadvantage falls hardest on smaller brands without the purchasing scale to negotiate favourable contract manufacturing pricing or secure priority production capacity during periods of constrained supply. Exposure varies by product category too, since premium accessories using higher-cost materials face proportionally different cost structure exposure than basic commodity accessories relying heavily on standard plastic resin components.
consumer-electronic-accessories-market-cost-volatility-analysis-1788421404226

Diversifying Contract Manufacturing Across Multiple Factories

Larger brands are qualifying contract manufacturing relationships across multiple factories and geographies rather than depending on a single production source, reducing exposure to any single factory's capacity constraints while adding meaningful qualification cost and lead time in the near term. This approach requires ongoing quality oversight across each additional manufacturing relationship, adding coordination overhead that smaller brands sometimes underestimate initially.

Negotiating Long-Term Volume-Based Manufacturing Agreements

Several brands are negotiating multi-year volume-based contract manufacturing agreements directly with production partners to secure priority capacity and stable pricing ahead of demand fluctuations, trading flexibility for cost and supply predictability. over time as demand patterns stabilise. This approach requires accurately forecasting demand well in advance, a discipline some smaller brands still lack. across most product categories.

Shifting Some Production Toward Nearshore Manufacturing Options

Brands serving North American and European markets are shifting some production toward nearshore manufacturing options in Mexico and Eastern Europe respectively, reducing shipping time and cost exposure for markets furthest from concentrated Asian manufacturing capacity. This approach trades slightly higher unit cost for meaningfully faster delivery, a tradeoff increasingly popular among brands prioritising speed to market.

Portfolio Architecture for Margin Defence

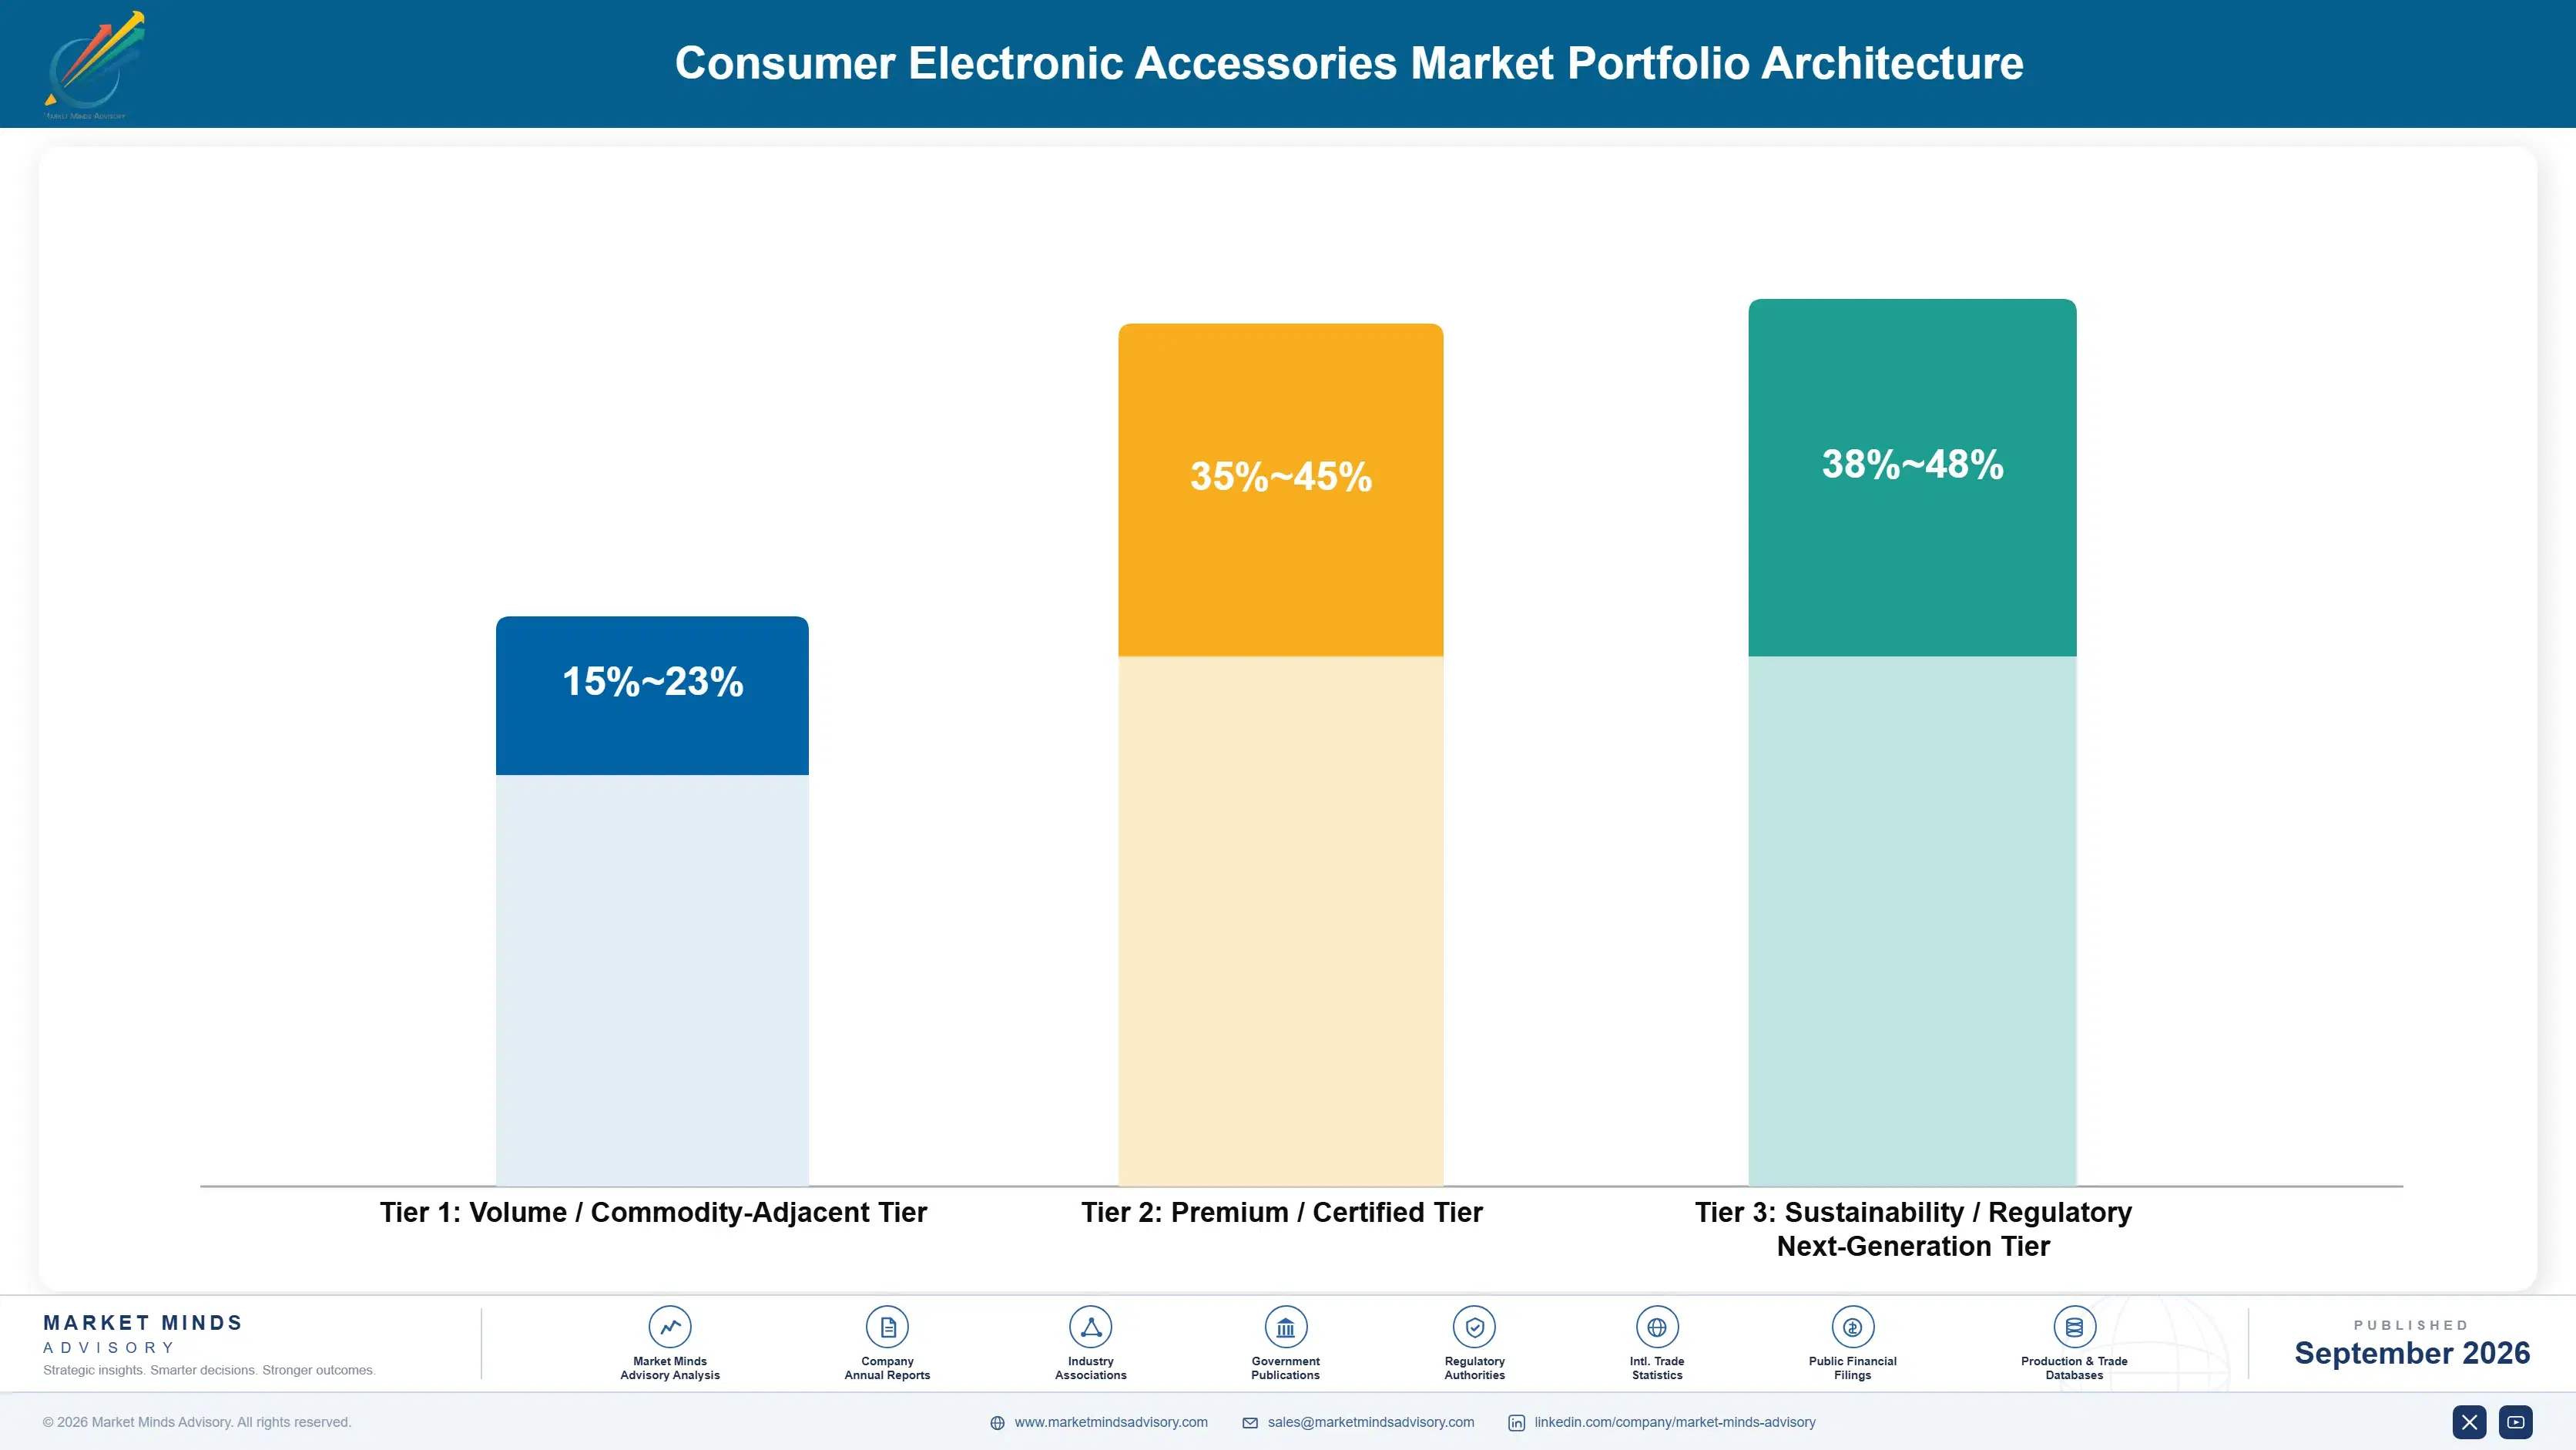
Portfolio economics split into three tiers. Volume tier basic commodity accessories carry thin margins under intense marketplace price competition, particularly for cases, cables, and screen protectors sold primarily on price. Premium certified accessories carrying fast-charging certification or design differentiation carry meaningfully higher margins tied to verified performance and brand positioning. The sustainability and next-generation tier, built around wearable-specific accessories, currently carries strong margins given the category's newer, less commoditised competitive landscape.
The volume versus premium tension shows up clearly in brand marketing allocation. Investment devoted to defending commodity category volume against marketplace price competition competes directly against investment needed for premium design differentiation and wearable category expansion, and brands that under-invest in either risk losing ground to a competitor optimised specifically for that segment.

High-value margin pools concentrate in fast-charging certified charging accessories and in the emerging wearable accessory tier, where design differentiation and category novelty still command premium pricing before broader commoditisation eventually sets in. The volume commodity tier remains essential for overall category unit volume but contributes a shrinking share of blended gross margin across the category today. Brands ignoring this shift risk margin erosion as commoditisation eventually reaches even newer categories.

Volume / Commodity-Adjacent Tier

Basic cases, cables, and screen protectors sold primarily on price across highly competitive marketplace channels. Brands here compete mainly on price and marketplace visibility rather than deep design differentiation. most decisively.
Gross Margin: 15-23%

Premium / Certified Tier

Fast-charging certified and design-differentiated accessories carrying margins tied to verified performance and brand positioning. These products justify premium pricing through verified performance certification and distinctive design positioning. consistently across most retail channels.
Gross Margin: 35-45%

Sustainability / Regulatory / Next-Generation Tier

Wearable-specific accessories commanding strong current margins given the category's newer, less commoditised landscape. Margins here should gradually compress as more brands enter and the category matures further. notably across most markets.
Gross Margin: 38-48%
consumer-electronic-accessories-market-portfolio-architecture-1788421404720

High-value Sub-segments and Strategic Watch-out

Wearable-Specific Bands and Charging Cases

The fastest-growing category by revenue in this report, combining strong current margins with accelerating wearable device adoption across multiple product categories simultaneously this decade. Brands positioned early in this segment are capturing outsized attention as wearable device adoption broadens across demographics. broadly across most demographic segments tracked.
Gross Margin: 38-48%

Fast-Charging Certified Cables and Adapters

Premium products commanding meaningfully higher prices than uncertified alternatives, offering strong margins as fast-charging standards proliferate across mid-range device tiers broadly. These products also provide brands valuable differentiation from uncertified competitors relying purely on marketplace price positioning. broadly across the wider category and price tiers.
Gross Margin: 35-45%

Standard Protective Cases and Covers

The largest existing revenue base by unit volume, facing intense marketplace price competition but funding most brands' ongoing design and category expansion investment. Brands here rely on manufacturing scale and marketplace visibility rather than design differentiation to defend volume. broadly across most price points and retail channels.
Gross Margin: 15-23%

Legacy Non-USB-C Charging Accessories

A shrinking strategic watch-out segment as regulatory mandates and device transitions continue displacing legacy charging port standards across most major markets. Brands still reliant on this segment risk losing relevance as USB-C mandates continue displacing legacy charging standards broadly. broadly across most developed and emerging markets alike.
Gross Margin: 10-18%

Device Attachment and Replacement Economics

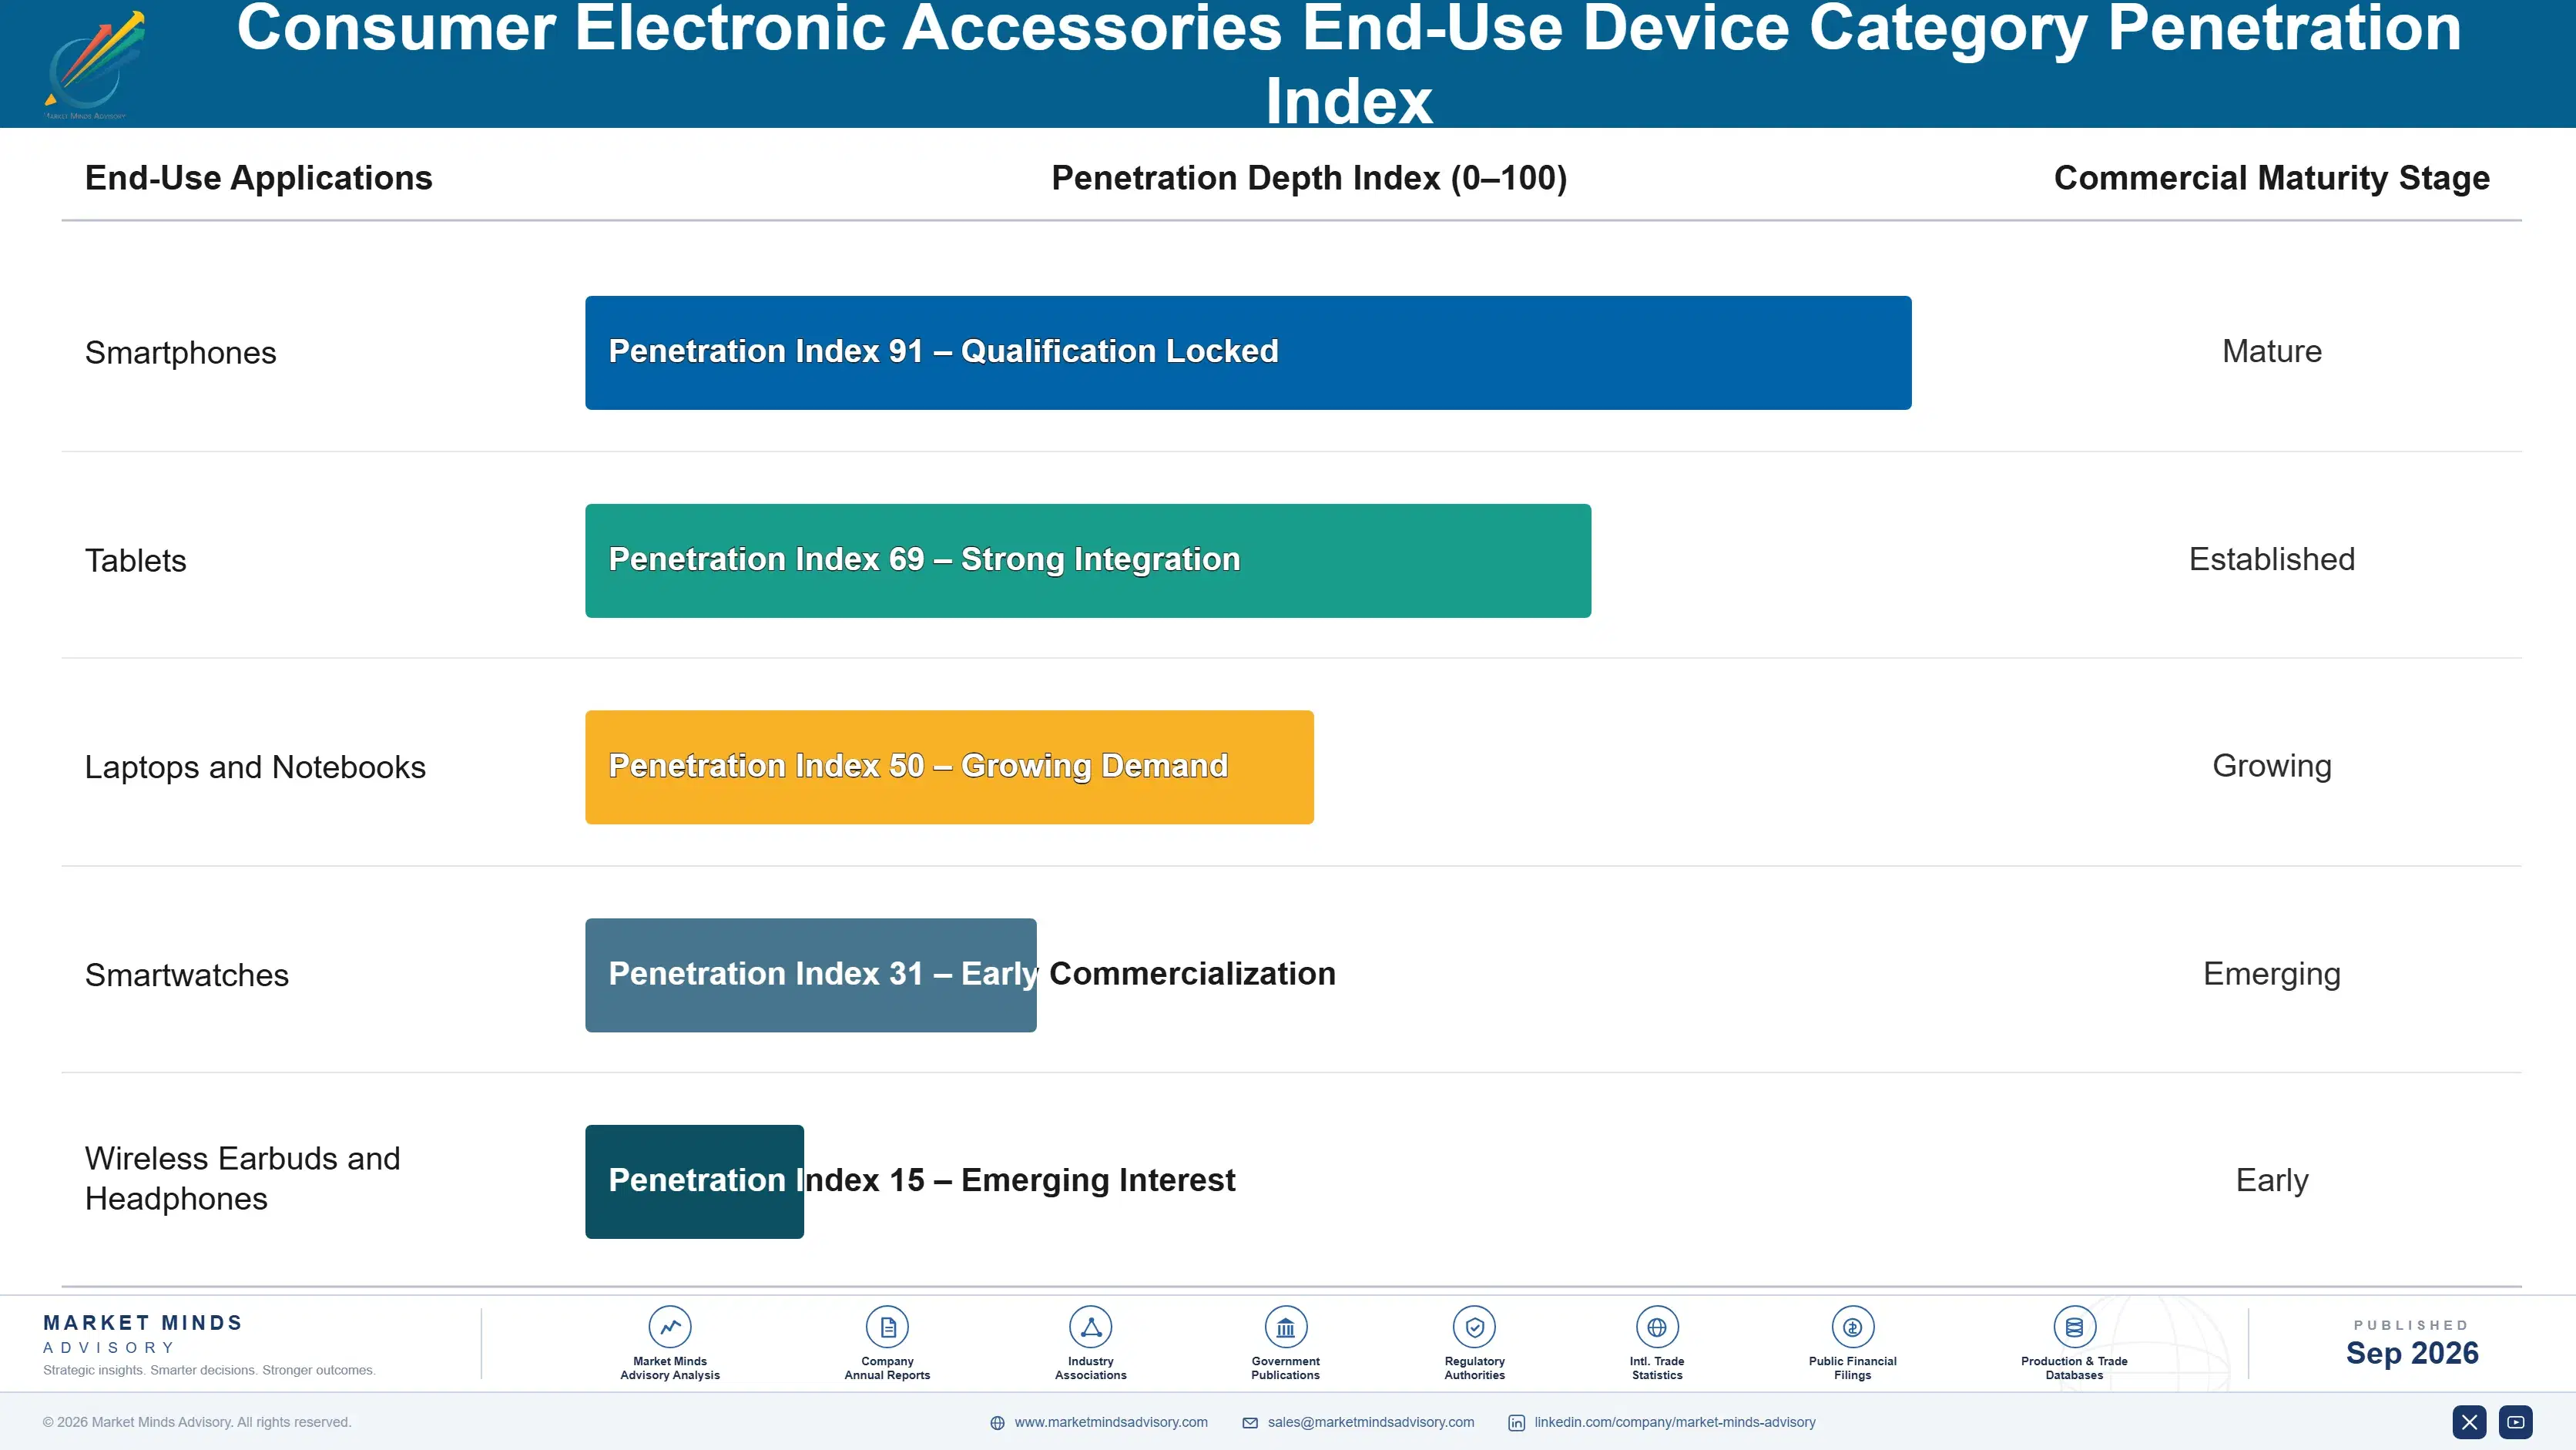
Revenue behaves like a recurring attachment sale tied directly to device ownership rather than a true annuity, since most consumers purchase accessories at or shortly after device purchase and then again only upon accessory wear, device upgrade, or new accessory category adoption, making device sales cycles the primary predictor of underlying category demand rather than any specific accessory brand's own retention efforts.
Adoption depth varies sharply by product category. Protective case attachment rates run extremely high given near-universal consumer desire to protect an expensive device, creating durable, near-universal demand tied directly to device sales, while wearable-specific accessory attachment rates remain considerably lower and more discretionary, tied more closely to personalisation and fashion motivations than pure device protection necessity.

Buyer profiles are shifting generationally too. Older consumers who came up buying a single durable case per device still favour infrequent, functional accessory purchases, while younger consumers increasingly treat accessories as a fashion category, purchasing multiple cases and bands per device to match outfits or moods, a difference in purchasing behaviour that is already shaping which brands win younger demographic segments versus more traditional, functionally-focused older buyers.
consumer-electronic-accessories-market-end-use-penetration-index-1788421405211

Where the Category Consolidates Next

These are among the four positions where our research anticipates prominent divergence between winners and laggards over the coming forecast period. Each is grounded in the demand model, the regulatory perimeter, and the announced capacity pipeline.
01 / CERTIFICATION INVESTMENT PRIORITY

Fast-charging certification is becoming essential for premium positioning

Fast-charging certification is emerging as a genuine basis for premium pricing as consumers increasingly seek verified compatibility assurance before paying more for a charging accessory. Brands without certification investment risk being relegated to uncertified, price-competitive commodity positioning regardless of actual product quality. Brands should treat certification as a near-term priority rather than a longer-term consideration given how quickly the window is narrowing, especially as more established competitors complete their own certification programmes across the category this year across most major consumer markets.
02 / WEARABLE CATEGORY EXPANSION

Early wearable accessory entry is compounding into durable brand advantage

Brands that expanded into wearable-specific accessory categories early are capturing a disproportionate share of this newer, faster-growing revenue pool before broader competitive entry intensifies further across the category. This dynamic rewards brands willing to invest in a genuinely new product category well ahead of confirmed demand certainty. Waiting for wearable category proof risks ceding the most valuable early positioning entirely to already-committed competitors that moved decisively while the opportunity still looked genuinely uncertain to more cautious rivals waiting on the sidelines.
03 / RETAIL CHANNEL STRATEGY

Exclusivity partnerships remain valuable even as e-commerce grows

Retail exclusivity partnerships with major carriers and device retailers continue delivering meaningfully more stable pricing and volume than open marketplace distribution alone, even as overall category sales continue shifting toward e-commerce channels broadly. Brands should pursue both channels simultaneously rather than treating retail exclusivity and direct-to-consumer e-commerce as competing strategic priorities. Brands should also invest in owned data infrastructure regardless of channel mix to capture the loyalty benefits of direct customer relationships even while exclusivity partnerships continue delivering meaningful volume elsewhere.
04 / COMMODITY SEGMENT EXPOSURE

Brands without differentiation face steady margin erosion ahead

Brands remaining concentrated in commodity accessory categories without meaningful design, certification, or brand differentiation face continued margin erosion as marketplace price competition intensifies further across most basic product categories tracked in this report. Brands should actively diversify toward premium, certified, or wearable-specific categories rather than defending commodity market share alone. Brands should begin this diversification now rather than waiting until commodity margins compress further, since the categories most likely to absorb displaced volume are becoming more competitive every year across nearly every geography tracked.

Engagement Snapshot From the Field

A live engagement with an industry participant carrying material or product regulatory and market exposure ahead of a defining policy shift, showing how our research translates into a defensible multi-year portfolio strategy.
MARKET MINDS ADVISORY · CLIENT ENGAGEMENT SUMMARY
Consumer Electronic Accessories Producer Strategic Portfolio Review and Transition Roadmap 2026·Investment Scenario on Consumer Electronic Accessories Exposure Evaluation 2025-26
CLIENT PROFILE
The client is a mid-size consumer electronics accessory brand generating approximately one hundred forty million dollars in annual revenue (client-reported, unverified by MMA), historically concentrated in smartphone protective cases sold primarily through third-party marketplace channels, facing declining margins as marketplace price competition intensified considerably over the prior two years. and employing roughly two hundred people across design, marketing, and supply chain functions.
STRATEGIC CHALLENGE
Leadership needed to determine how to diversify beyond its core commodity case business without abandoning the marketplace revenue base that still generated the majority of current company revenue, while facing limited capital available for a broad simultaneous expansion across multiple new product categories. while also managing internal design team bandwidth constraints that limited how many categories could be pursued simultaneously.
MMA APPROACH
MMA benchmarked the client's existing design and manufacturing capability against requirements for wearable accessory categories and fast-charging certified products, identifying which adjacent category offered the fastest realistic path to meaningful revenue given the client's existing supplier relationships and design team capability specifically. The engagement also modelled expected margin outcomes for each candidate category based on comparable brand disclosures reviewed in the market.
KEY FINDINGS
  1. The client's existing case design expertise translated more directly into wearable band design than into charging accessory engineering, favouring wearable category entry over fast-charging certification pursuit.
  2. Marketplace customer data revealed a meaningful share of existing case customers also owned smartwatches, suggesting a natural cross-sell opportunity within the client's existing customer base.
  3. A focused wearable band launch targeting the client's two best-selling case product lines' matching device families reduced launch complexity considerably compared to a broader simultaneous multi-device launch.
  4. Early wearable band sales showed meaningfully higher gross margins than the client's existing case business, validating the category diversification decision within the first several months.
CLIENT PROFILE
The client is a mid-size consumer electronics accessory brand generating approximately one hundred forty million dollars in annual revenue (client-reported, unverified by MMA), historically concentrated in smartphone protective cases sold primarily through third-party marketplace channels, facing declining margins as marketplace price competition intensified considerably over the prior two years. and employing roughly two hundred people across design, marketing, and supply chain functions.
STRATEGIC CHALLENGE
Leadership needed to determine how to diversify beyond its core commodity case business without abandoning the marketplace revenue base that still generated the majority of current company revenue, while facing limited capital available for a broad simultaneous expansion across multiple new product categories. while also managing internal design team bandwidth constraints that limited how many categories could be pursued simultaneously.
MMA APPROACH
MMA benchmarked the client's existing design and manufacturing capability against requirements for wearable accessory categories and fast-charging certified products, identifying which adjacent category offered the fastest realistic path to meaningful revenue given the client's existing supplier relationships and design team capability specifically. The engagement also modelled expected margin outcomes for each candidate category based on comparable brand disclosures reviewed in the market.
KEY FINDINGS
  1. The client's existing case design expertise translated more directly into wearable band design than into charging accessory engineering, favouring wearable category entry over fast-charging certification pursuit.
  2. Marketplace customer data revealed a meaningful share of existing case customers also owned smartwatches, suggesting a natural cross-sell opportunity within the client's existing customer base.
  3. A focused wearable band launch targeting the client's two best-selling case product lines' matching device families reduced launch complexity considerably compared to a broader simultaneous multi-device launch.
  4. Early wearable band sales showed meaningfully higher gross margins than the client's existing case business, validating the category diversification decision within the first several months.
RECOMMENDED STRATEGY
Phase 1: Phase 1 (Months 1 to 2): Benchmark design and manufacturing capability against wearable band category requirements and shortlist target devices. Phase 2: Phase 2 (Months 3 to 6): Launch an initial wearable band line targeting the client's best-selling case customer base directly. Phase 3: Phase 3 (Months 7 to 12): Expand wearable band coverage across additional device families based on initial launch performance data.
OUTCOME
Twelve months after the initial wearable band launch, the client reported the new category contributing approximately eighteen percent of total company revenue with meaningfully higher gross margins than its legacy case business (client-reported, unverified by MMA). Leadership also reported improved overall company gross margin as the wearable category's revenue share continued expanding.

Frequently Asked Questions

Foundational context covering the market sizes, CAGR, scope, country, region and competition that inform every finding below. This section is provided to cover basics and most often pre-purchase conversations, answered from the MMA Primary Research Dataset.

What is the current size of the Consumer Electronic Accessories Market?

The Consumer Electronic Accessories Market reached an estimated USD 85.0 billion in global revenue in 2025, according to MMA Analysis based on primary research and company disclosures. This base year figure anchors the forecast period beginning in 2026.

How large will the Consumer Electronic Accessories Market be by 2036?

MMA projects the market will reach approximately USD 169.9 billion by 2036 under the base case scenario. That represents roughly a 1.88 times expansion from the 2026 starting value of USD 90.5 billion.

What is the CAGR for the Consumer Electronic Accessories Market 2026 to 2036?

The base case compound annual growth rate is 6.5% across the 2026 to 2036 forecast window. Bull and bear scenarios range from 5.2% to 7.8% depending on wearable adoption pace and marketplace price competition intensity.

Which segment is growing fastest?

Charging Accessories lead all segments at a 9.5% CAGR, roughly 1.46 times the overall market rate. This segment benefits from mandatory USB-C standardisation driving widespread replacement demand across the existing installed base.

Who are the major companies in the Consumer Electronic Accessories Market?

Leading brands include Anker Innovations Limited, Belkin International Inc., Zagg Inc., Logitech International S.A., and Ugreen Group Limited. Together these five hold an estimated 28% combined share on a disclosed segment revenue basis.

Which country is growing fastest?

India leads national growth at an estimated 10.2% CAGR, driven by its rapidly expanding smartphone-owning population. Vietnam and Indonesia follow within the same South Asia and Pacific region.

Report Segmentation Architecture

The full report scope spans multiple orthogonal segmentation dimensions, with cross-tabulated demand data provided for each dimension pair. Coverage extends further to regional breakdowns, trend trajectories, and the competitive detail needed to support segment-level decision-making.

By Accessory Product Type

  • Protective Cases and Covers
  • Charging Accessories
  • Audio Accessories
  • Wearable Bands and Straps
  • Screen Protection Products
  • Mounting and Stand Accessories

By End-Use Device Category

  • Smartphones
  • Tablets
  • Laptops and Notebooks
  • Smartwatches
  • Wireless Earbuds and Headphones

By Commercial Dimension

  • Direct-to-Consumer E-Commerce
  • Third-Party Marketplace Sales
  • Physical Retail and Carrier Stores
  • Original Equipment Manufacturer Bundled Sales

By Region

  • North America
  • Western Europe
  • East Asia
  • South Asia and Pacific
  • Latin America
  • Middle East and Africa
  • Eastern Europe

Scope, Methodology, and Coverage

Every figure in this report is reproducible from documented input assumptions. The scope below maps the historical period, the forecast horizon, the segmentation dimensions, and the countries covered, alongside the underlying primary and qualitative methodology.
Historical Period
2020 to 2025
Forecast Period
2026 to 2036
Base Year
2025 (USD billions; MMA Primary Research Dataset, September 2026)
Market Definition
This report covers third-party and original equipment manufacturer accessories for smartphones, tablets, laptops, and wearable devices, including protective cases, charging cables and adapters, power banks, screen protection products, and wearable bands. It excludes the primary electronic devices themselves, enterprise networking accessories, and automotive electronics accessories not designed for personal consumer device use.
Quantitative Units
USD billions (current prices); unit shipment volumes; average selling price per unit
Segmentation Dimensions
By Accessory Product Type; By End-Use Device Category; By Commercial Dimension; By Region
Regions Covered
North America, Western Europe, East Asia, South Asia and Pacific, Latin America, Middle East and Africa, Eastern Europe
Countries Covered
USA, China, Germany, France, UK, Japan, South Korea, India, Australia, Canada, Brazil, Mexico, Indonesia, Vietnam, Thailand, Malaysia, UAE, Saudi Arabia, South Africa, Nigeria, Turkey, Poland, Netherlands, Italy, Spain, Sweden, Switzerland, Argentina, Colombia, Singapore, and additional markets relevant to this sector
Key Companies Profiled
Anker Innovations Limited; Belkin International Inc.; Zagg Inc.; Logitech International S.A.; Ugreen Group Limited; Otter Products LLC; Spigen Inc.; UAG (Urban Armor Gear) LLC; Native Union Limited; Shenzhen Ruite Electronic Technology Co Ltd; Case-Mate LLC; PopSockets LLC; Sozo Global Ltd; Aukey Technology Co Ltd; Sunvalley Group Inc.; Incipio LLC; Speck Products; Griffin Technology LLC; Moshi Inc.; Evana Technology Co Ltd
Quantitative Methodology
Primary survey, n=3,800 respondents, Q4 2025, six countries; demand-side model with trade association cross-validation
Qualitative Methodology
47 expert interviews, Q4 2025; applied to validate demand model assumptions, identify emerging dynamics, and assess competitive positioning
Report Format
PDF and XLSX data workbook (Word format preview document)
Publisher
Market Minds Advisory
Report Code
MMA-2026-TEC-762
Published
September 2026
Contact
sales@marketmindsadvisory.com | www.marketmindsadvisory.com

Purchase the full Consumer Electronic Accessories Market Report (2026 to 2036).

The full report delivers complete segmentation data across all six accessory product type segments, all seven regional markets, and detailed competitive profiles for all twenty companies named in this summary. It includes the underlying primary survey dataset of three thousand eight hundred respondents and forty seven expert interviews conducted during the fourth quarter of 2025. Buyers also receive downloadable data tables covering historical 2020 to 2025 figures alongside the full 2026 to 2036 annual forecast. A dedicated appendix addresses USB-C regulatory compliance timelines across three major jurisdictions.
Full Seven-Region Regional Data Tables and Charts
All Twenty Company Competitive Profiles and Rankings
Ten-Year Annual Forecast Model With Scenarios
Primary Survey Raw Data Access and Tables
USB-C Regulatory Compliance Timeline Appendix and Scenarios
Quarterly Update Subscription Option for Buyers

Built For The People Who Decide

From boardroom strategy to bench-side execution, this report is read cover-to-cover by leaders shaping the next decade of their industry, turning demand scenarios, market dynamics and valuation benchmarks into decisions.
CXOs/ Presidents/ VPs/ Managers
M&A and Corporate Development
Strategy Teams and R&D Heads
Procurement and Product Directors
Regulatory and Compliance Leaders
Investor Relations and Equity Analysts