Market Minds Advisory
Consumer Appliances Market

Consumer Appliances Market: Consumer Appliances Market: Control Board Economics, Repairability Regulation and Connectivity Nobody Uses

Mechanical parts outlast the electronics that control them, a replacement board costs more than half the appliance, and regulation is starting to publish that arithmetic on the shelf. Six owners in seven never connect it.

Lead Analyst

Published

September 2026

Make Smarter Decisions with Customized Research Insights

Request a free sample report and evaluate market opportunities, growth trends, and competitive dynamics relevant to your business needs.

2025 MARKET VALUE$560.0BMarket Size 2025
2036 FORECAST VALUE$880.5BBase Case , 2026 to 2036
CAGR 2026 TO 20364.2 %Bull 5.4% / Bear 3.0%
INCREMENTAL OPPORTUNITY$297.0BNet 10- year value creation
EXPANSION MULTIPLE1.51x2036 value over 2026 base
Strategic Levers
M&A Pipeline
Regional Outlook
Country Rankings
Competitive Intelligence
Segmental Deep-dive
Call-Us : 91 93563 13602

Executive Snapshot and Market Trajectory.

Appliances no longer fail mechanically. Motors, compressors and drums outlast the electronic control boards that run them, and a replacement board costs more than half what the appliance is worth, which turns a repairable machine into a discarded one. Housing transactions drive the category more than any product change does.
Small kitchen appliances grow at 6.3%, half again the market rate of 4.2%, on short replacement cycles, low tickets and purchase decisions made without a plumber. Floor care and home comfort follow at 5.4%. Cooking appliances grow slowest at 3.6%, tied to kitchen renovation cycles that nothing in the product can accelerate. Major appliance purchase clusters around moves, renovations and failures rather than desire.
Connectivity has not delivered what the industry expected of it. Roughly 14% of connected appliances are ever linked to a home network, so the usage data and service revenue that justified the feature largely did not arrive, while the component cost and the security update obligation both did. Spare parts obligations meanwhile force a service capability into existence that carries margins far above appliance manufacture, and most still report it as a compliance cost.
Market Definition
This market covers appliances sold for household use, spanning refrigeration, laundry, cooking, dishwashing, small kitchen appliances, and floor care and home comfort products. Sizing is at manufacturer revenue across all distribution channels. Commercial and professional catering equipment, heating and air conditioning systems installed as building services, consumer electronics and personal care devices, and extended warranty or service contracts sold separately are excluded.
Base Year Value
$560.0B in 2025 (MMA Primary Research Dataset, September 2026)
Forecast Period
2026 to 2036, eleven discrete annual values
CAGR
4.2% base case. Bull 5.4%. Bear 3.0%.
Fastest Growth Segment
Small Kitchen Appliances: 6.3% CAGR
Fastest Growth Country
India: 7.1% CAGR
Fastest Growth Region
South Asia and Pacific: 6.2% CAGR
Largest Region
East Asia: 34% of 2025 global value
Market Leaders
Midea Group, Haier Smart Home, Whirlpool Corporation, BSH Hausgerate, Electrolux. Source: MMA Primary Research Dataset, July 2026.
Primary Survey
n=3,800 procurement and R&D decision-makers, Q4 2025, six countries
Methodology
Demand-side build-up, cross-validated against public data, 47 expert interviews

Consumer Appliances Market Forecast Scenarios

consumer-appliances-market-size-forecast-scenario-1790023381144
Growth of 3.1% between 2020 and 2025 was pulled forward and then repaid. Home spending through 2020 and 2021 produced a replacement surge across every developed market that emptied inventories and extended lead times, then 2023 and 2024 fell hard as housing transactions slowed. Asian volume grew steadily throughout and increasingly carried the global number.
Three mechanisms carry the base case. Small appliances grow at 6.3% on replacement cycles measured in a few years rather than a decade, with purchase requiring no installation decision. Indian and Southeast Asian household formation adds genuinely new units rather than replacements, with India at 7.1%. European repairability and spare parts obligations extend machine life while creating parts and service revenue that most manufacturers have never organised around properly. None of the three depends on housing transactions recovering.
The bull case is service revenue. Spare parts and repair carry margins far above appliance manufacture, and regulation is forcing the capability into existence anyway. The bear case is housing activity. Appliance purchase clusters around moves, renovations and failures rather than around desire, which makes the category as transaction-dependent as any building product and leaves it exposed to a sustained slowdown.

What Actually Ends An Appliance

The mechanical parts of a modern appliance are better than they have ever been and the machine still ends early. Compressors, motors and drums routinely outlast the electronic control board managing them, and a replacement board priced near 54% of the appliance's remaining value converts a repair decision into a replacement one. That arithmetic, not build quality, is what decides how long a machine lasts. Build quality has very little to do with it.
TOP FIVE CONCENTRATION31%Combined manufacturer revenue share held by the five largest participants
CONTROL BOARD COST SHARE54%Board cost against appliance value at repair time
AVERAGE SELLING PRICEUSD 412Weighted global manufacturer price across major and small appliances
CONNECTED UNITS ACTIVATED14%Connected appliances ever linked to a home network
PERCEIVED PRODUCT LIFESPAN8.1 yearsYears owners now expect an appliance to last
REPAIRABILITY INDEX COVERAGE1National markets publishing a mandatory repairability score today
Regulation has begun putting that on the shelf rather than leaving it in a service manual. One national market now publishes a mandatory repairability score alongside price, and European spare parts obligations require availability for years after a model leaves production. Manufacturers treating those as compliance costs are missing that the same requirements create a parts and service business with margins far above manufacturing.
Connectivity is the feature the industry believed in and consumers did not. Around 14% of connected appliances are ever linked to a home network, which means the usage data and recurring service revenue that justified the component cost largely never arrived. The security update obligation attached to a connected device, however, did arrive and persists for years.
"The industry spent a decade making appliances that mechanically last longer and electronically last less, then put Wi-Fi in them that six owners in seven never switch on. Regulation is about to print the first half of that on the price ticket."
Director, Home Appliances and Durables Practice · MMA Consumer and Industrial Goods Practice · September 2026

Market Trends

Repairability Scoring Moves Durability Onto The Price Ticket

One national market already requires a published repairability score on appliance listings and is extending it toward a durability index, while European spare parts obligations mandate availability for years after production ends. That converts a quality attribute buyers previously could not see into a number sitting beside the price. Manufacturers scoring well use it in marketing; those scoring poorly have quietly redesigned fastening and disassembly to improve it. The same requirements also create a parts and service revenue line that carries margins far above appliance manufacture itself. Buyers can now read a durability number.
Market Impact: India grows 2.9 points faster
Small Appliances Grow Where No Installation Decision Exists

A major appliance purchase involves a plumber, an electrician or a delivery slot and frequently a kitchen, which ties it to renovation and moving cycles. A small kitchen appliance involves a countertop and a socket. That difference is why small appliances grow at 6.3% against 4.2% for the category, with replacement cycles measured in a few years rather than a decade and purchases made on impulse rather than on necessity. The category also absorbs genuine product innovation faster, because the risk of trying something new is a fraction of the cost.
Market Impact: Parts required for 10 years

Market Opportunities and Growth Drivers

Indian Household Formation Adds Units Not Replacements

Indian urban and small-town household formation continues adding first-time appliance buyers at a rate no developed market approaches, and refrigeration, laundry and small kitchen categories are all penetrating from bases well below Western levels. India grows at 7.1%, the fastest national market covered here. Domestic manufacture by Godrej, Voltas and the Korean and Chinese groups operating locally serves it at price points imported product cannot reach. Growth here is additive rather than a redistribution of existing demand. Refrigeration and laundry penetration both sit far below Western levels, so the addressable base is measured in households.
Market Impact: Boards cost 54% of value

Spare Parts Obligations Create Service Revenue By Regulation

European requirements oblige manufacturers to supply spare parts for years after a model leaves production and to design for reasonable disassembly, which forces a parts and service capability into existence whether or not a business wanted one. Parts carry gross margins far above appliance manufacture, and a service visit generates a customer contact that a manufacturer otherwise never has. Participants organising around that report service revenue rising faster than unit revenue, on a capability regulation required them to build anyway. Most manufacturers still report it against a compliance target rather than a revenue one.
Market Impact: Only 14% ever connect

Market Restraints and Challenges

Control Board Cost Ends Otherwise Sound Machines

A replacement electronic control board typically costs around 54% of what the appliance is worth at the point of failure, which makes the repair decision economically obvious and environmentally absurd. The root cause is that boards are model-specific, produced in short runs and priced as low-volume spares rather than as components. Commercially this shortens replacement cycles in a way manufacturers benefit from and increasingly cannot defend publicly. Participants moving toward modular and common boards across platforms cut both the spare price and the inventory obligation simultaneously. The environmental argument against it is becoming difficult to answer.
Market Impact: Exactly 1 market publishes scores

Connectivity Cost Landed Without The Promised Revenue

Roughly 14% of connected appliances are ever linked to a home network, so the usage data, predictive service and recurring revenue that justified the feature did not materialise at any meaningful scale. The root cause is that no compelling reason to connect a washing machine was ever offered to an owner. The component cost and a multi-year security update obligation both arrived regardless. Participants are responding by removing connectivity from mid-tier ranges and concentrating it where a genuine service actually attaches. Nobody offered an owner a reason to connect a washing machine.
Market Impact: Grows 2.1 points above category
4 additional market trends, 3 additional growth drivers, and 2 additional restraints and challenges are covered in the full report. Contact sales@marketmindsadvisory.com to access the complete intelligence.

Segment CAGR and Growth Architecture

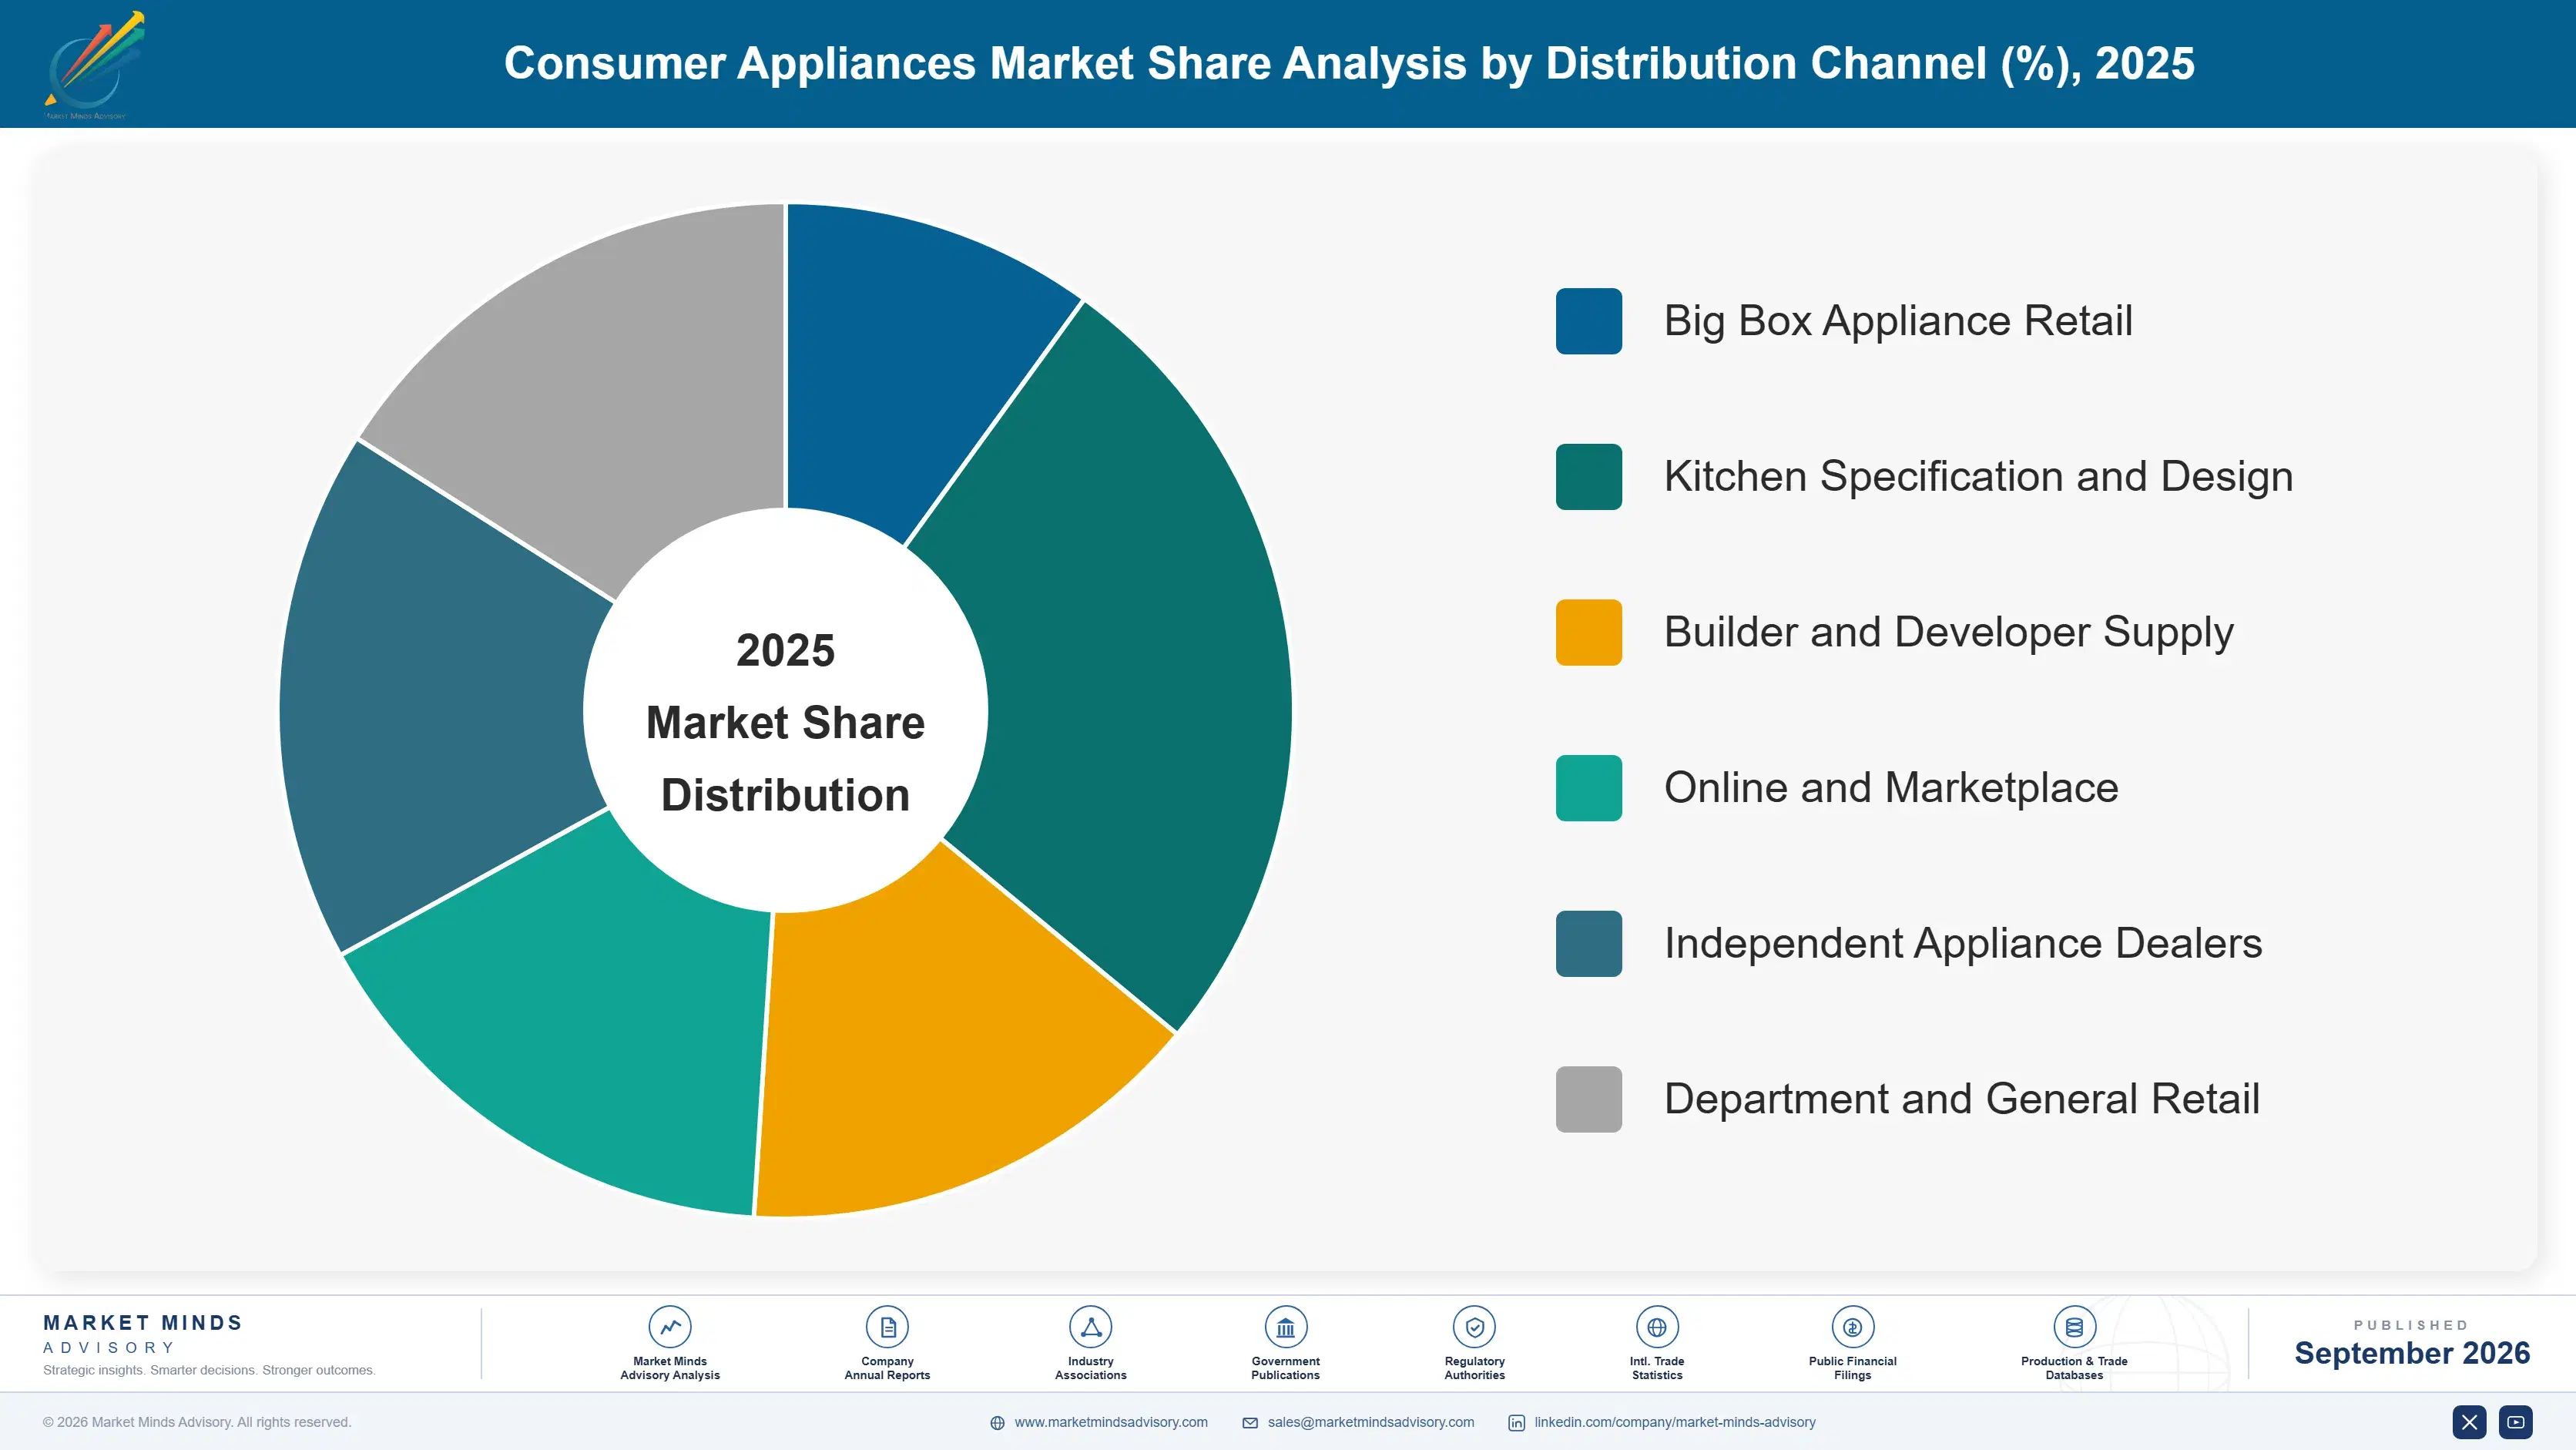
Segmentation follows appliance category, the dimension on which replacement cycle, installation requirement, channel and margin all divide together. Six categories are assessed at manufacturer revenue. Commercial catering equipment, installed heating and air conditioning systems, consumer electronics and separately sold service contracts sit outside the defined scope. Major and small appliances are sized together throughout this report.
consumer-appliances-market-market-share-analysis-1790023381733

Small Kitchen Appliances

Small kitchen appliances grow at 6.3%, half again the market rate of 4.2%, and the absence of an installation decision explains most of it. Buying a refrigerator involves a delivery slot, a doorway measurement and frequently a kitchen renovation; buying a countertop appliance involves a socket. That removes the transaction dependence that ties major appliances to housing activity and replaces it with an impulse purchase at a fraction of the ticket. Replacement cycles run in a few years rather than a decade, and genuine product innovation moves through the category far faster because the risk of trying something unfamiliar is small enough that buyers simply do. Brand attachment is correspondingly weak across the whole category.
CAGR 6.3%

Floor Care And Home Comfort Appliances

Floor care and home comfort products grow at 5.4% and they share the small appliance advantage of needing no installation while carrying higher tickets and more genuine technical content. Robotic floor care in particular has absorbed real engineering investment, and air treatment products have moved from a seasonal purchase to a year-round one in markets where air quality is a daily concern rather than an occasional one. Both categories attract new entrants readily, since the barrier is design and software rather than the steel pressing and refrigeration engineering that major appliances demand, which is why competitive positions here shift far more quickly. Air treatment has become a year-round purchase where air quality is a daily concern.
CAGR 5.4%
Full segment breakdown across 6 segments available in the complete report.

Regional Architecture and Country Demand Map

Regional shares measure manufacturer revenue where appliances are sold rather than where they are built. East Asia sits above its standard band and Middle East and Africa below, on household scale and manufacturing concentration respectively. Housing activity drives more of this table than income does.

East Asia

At 34% this sits above the standard band, and China is simultaneously the largest appliance market in the world and the place most of the world's appliances are made. Midea, Haier, Gree and Hisense have converted export manufacturing scale into domestic brand positions and then into international ones, which no other region has managed at comparable speed. Japanese demand is mature, premium and weighted toward compact formats suited to smaller homes. Korean manufacturers hold premium positions globally while their domestic market behaves like a mature Western one. Growth of 5.1% reflects replacement alongside continued urban household formation. No other region has converted manufacturing scale into global brand position at comparable speed.
Share: 34% | CAGR: 5.1% (2026 to 2036)

North America

The 24% position sits inside the standard band and average selling prices here are the highest of any region by a clear margin. Purchase timing tracks housing transactions closely, which made 2023 and 2024 difficult across every participant regardless of product or brand. Whirlpool holds the largest domestic position, with Korean manufacturers having taken substantial premium share over two decades. Repairability regulation has advanced far less here than in Europe, so the control board economics that shorten appliance life remain entirely invisible at the point of sale. Growth of 3.4% reflects a saturated replacement market. Control board economics remain invisible at the point of sale, since no repairability disclosure applies.
Share: 24% | CAGR: 3.4% (2026 to 2036)
Regional intelligence for 5 additional markets available in the complete report: Western Europe, South Asia and Pacific, Latin America, Eastern Europe, Middle East and Africa. Contact sales@marketmindsadvisory.com.
consumer-appliances-market-country-cagr-analysis-1790023382257

Four Moves Worth Making Now

These four follow from one observation: regulation is forcing this industry to build a parts and service capability, and the participants treating that as a cost are missing a business with better margins than the appliances themselves. Each has been executed by at least one participant already. Three of the four are organisational or engineering decisions.

Standardise Control Boards Across Product Platforms

A replacement board costs around 54% of the appliance value at failure because boards are model-specific, produced in short runs and priced as low-volume spares. Common board architectures across a platform cut the spare price, shrink the inventory obligation that spare parts regulation imposes and shorten service visit times together. Participants who have standardised report spare board cost falling by roughly 38% while parts availability compliance becomes far cheaper to maintain. The engineering work is a platform decision rather than a product-by-product redesign. Doing it across several fielded generations costs far more.
Market Impact: Cuts spare board cost by roughly 38% overall

Run Parts And Service As A Business Not A Cost

Spare parts obligations require availability for years after production ends, and most manufacturers manage that as a compliance burden inside operations. Parts carry gross margins far above appliance manufacture and a service visit produces a customer contact the business otherwise never gets. Participants operating parts and service with its own targets report it contributing revenue growth faster than unit sales, on a capability regulation obliged them to build anyway. The change is organisational rather than technical or capital intensive. Parts run at gross margins around 49% against 17% on manufacture.
Market Impact: Delivers 49% margin against 17% on appliance manufacturing

Remove Connectivity From Mid Tier Ranges

Around 14% of connected appliances are ever linked to a network, so the component cost and the multi-year security update obligation land on ranges where no service revenue follows. Concentrating connectivity in premium products where a genuine service attaches, and removing it below that, releases bill of materials cost and reduces the software maintenance estate substantially. Participants who have done it report mid-tier contribution improving by around 3 points with no measurable effect on sell-through at any price point. The software maintenance estate shrinks alongside the component cost, which matters over a multi-year obligation.
Market Impact: Adds roughly 3 points of mid tier contribution

Design For The Repairability Score Before It Spreads

One national market publishes a mandatory repairability score beside the price and is extending it toward durability, while European disassembly requirements push the same direction. Designing fastening, part access and documentation to score well costs engineering attention rather than materials, and the score is visible to buyers in a way build quality never was. Participants scoring in the top band report share gains of roughly 4 points in that market against comparable products, before the requirement reaches anywhere else. Fastening and board access account for most shortfalls against top-scoring competitors.
Market Impact: Delivers roughly 4 points of market share gain

Who Controls the Margin Pool

Concentration is moderate at 31% held by the top five, measured consistently on manufacturer revenue across major and small appliances rather than on units, which would overweight small appliances enormously. The leader to challenger gap is wide in major appliance engineering and service reach, and narrow in small appliances, where contract manufacturers serve anyone with a design.
Competition runs on three dimensions currently. Manufacturing scale decides cost in major appliances, where steel pressing, compressor sourcing and assembly volumes determine who can price. Retail and builder relationships decide access, since a large share of major appliances is specified into homes before any consumer sees them. Design and software decide small appliances and floor care, where new entrants appear regularly and incumbent scale confers far less advantage.

Pressure is building around service capability and regulatory scoring, and both are where positions will move. Manufacturers without a parts and service organisation face obligations they must meet and cannot monetise. Those scoring poorly on published repairability face a comparison sitting beside their price in one market already and probably more to come, on an attribute they have historically had no reason to optimise for at all.
consumer-appliances-market-company-positioning-matrix-1790023382781

Competitive Moat and Risk Dimensions

MIDEA GROUP

Moat: Manufacturing Scale And Breadth

Vertical integration across compressors, motors and components combined with volumes that no competitor matches gives the company a cost position in major appliances that is genuinely difficult to contest. Breadth from small kitchen products through to major appliances also spreads development cost across a far wider revenue base than specialists manage.
MIDEA GROUP

Risk: Brand Position In Western Markets

Cost leadership converts into share most easily at price points where brand matters least, and Western premium tiers remain held by European and Korean names with reputations built over decades. Acquiring or building that permission is slow, and repairability scoring may reward engineering reputation in ways that favour incumbents further.
HAIER SMART HOME

Moat: Acquired Brand Portfolio Globally

Ownership of established Western brands alongside its domestic position gives the company genuine premium permission in markets where Chinese manufacturing alone would not secure it, and those brands come with service networks and retail relationships that would take decades to construct from nothing. Premium permission is very difficult to manufacture from nothing.
HAIER SMART HOME

Risk: Integration Across Distinct Platforms

Operating several acquired engineering platforms alongside domestic ones multiplies the spare parts obligation that European regulation imposes, since each platform carries its own board and component inventory for years. Consolidating those platforms conflicts with the brand distinctiveness the acquisitions were made to obtain. Each platform ties capital into boards that may never sell.

Players Tracked

Prominent Players

Midea Group
Haier Smart Home
Whirlpool Corporation
BSH Hausgerate
Electrolux

Other Key Players

LG Electronics
Samsung Electronics
Panasonic
Arcelik
Gree Electric Appliances
Hisense
Groupe SEB
De'Longhi
Sharp Corporation
Dyson
SharkNinja
Miele
Smeg
Voltas
Godrej Appliances

Recent Developments

APRIL 2024

Whirlpool combines European appliance business with Arcelik

The company contributed its European major domestic appliance operations into a new entity in which Arcelik holds the majority stake. This was a joint venture formation rather than an outright sale, and both parties retain interests in the combined business. North American operations were unaffected by the transaction.
Signal: European appliance manufacturing is consolidating around participants with lower cost bases. Cost base rather than brand decided the outcome.
FEBRUARY 2025

Midea expands overseas manufacturing capacity outside China

The company added appliance manufacturing capacity at facilities outside China to serve export demand with shorter supply routes and reduced trade exposure. This was organic capital investment funded internally, involving no joint venture or acquisition of any existing operation. Chinese domestic capacity continues operating unchanged alongside it.
Signal: Manufacturing is being placed nearer demand as trade exposure becomes a design constraint. Trade exposure is now a design constraint.
JUNE 2025

SharkNinja expands manufacturing capacity in Southeast Asia

The company added production capacity across several Southeast Asian facilities for small appliance and floor care categories, reducing concentration in single-country manufacture. This was organic investment funded internally with no acquisition or joint venture partner involved anywhere. Existing supplier arrangements were retained through the expansion.
Signal: Small appliance manufacturing is diversifying faster than major appliance capacity can move. Lighter categories relocate faster than heavy ones.

What An Appliance Costs

Steel and metals account for roughly 26% of major appliance build cost, covering pressed cabinets, drums and load-bearing components. Compressors, motors and pumps add about 19%, sourced from a mixture of captive and specialist suppliers. Electronic control boards take around 11% at build and vastly more as a spare, while plastics, insulation, refrigerant and glass account for most of the remainder before freight on a product that ships badly.
The 2021 and 2022 period pressured three lines simultaneously in a way this industry had not experienced. Semiconductor allocation moved toward automotive and consumer electronics customers while steel prices rose sharply and container rates multiplied several times over, on a product that absorbs freight badly. Whirlpool and Electrolux annual reports for those years both identify component availability, raw material inflation and logistics cost as requiring repeated price action.

Exposure varies by category and by manufacturing footprint. Major appliance producers carry steel, compressor and freight exposure that small appliance manufacturers largely avoid. Participants manufacturing near their demand markets avoid a freight layer that importers pay on every unit. Spare parts obligations add an exposure nobody models, since model-specific boards tie capital into inventory that may never sell.
consumer-appliances-market-cost-volatility-analysis-1790023382977

Standardise components across platforms before parts obligations bite

Spare parts availability requirements oblige manufacturers to hold model-specific components for years after production, and every distinct platform multiplies that inventory. Common boards, motors and fasteners across platforms cut both the obligation and the spare price. The engineering effort is a platform decision, and it becomes far more expensive once several generations are already in the field.

Place major appliance manufacturing near demand markets

Appliances are bulky, low-density products where freight is a meaningful share of landed cost and lead times determine retail availability. Manufacturing near the demand market removes both exposures and shortens the response to a demand swing. Capital intensity is the obstacle rather than any technical difficulty, since appliance assembly is well understood everywhere. Assembly is well understood everywhere.

Qualify a second semiconductor source for control electronics

Appliance control boards depend on microcontrollers from a narrow supplier base that prioritises automotive and consumer electronics during allocation. Requalification requires firmware work and compliance retesting rather than a purchase order. Doing it ahead of shortage costs a development cycle; doing it afterwards costs production, which is exactly what happened across the industry in 2021.

Portfolio Architecture for Margin Defence

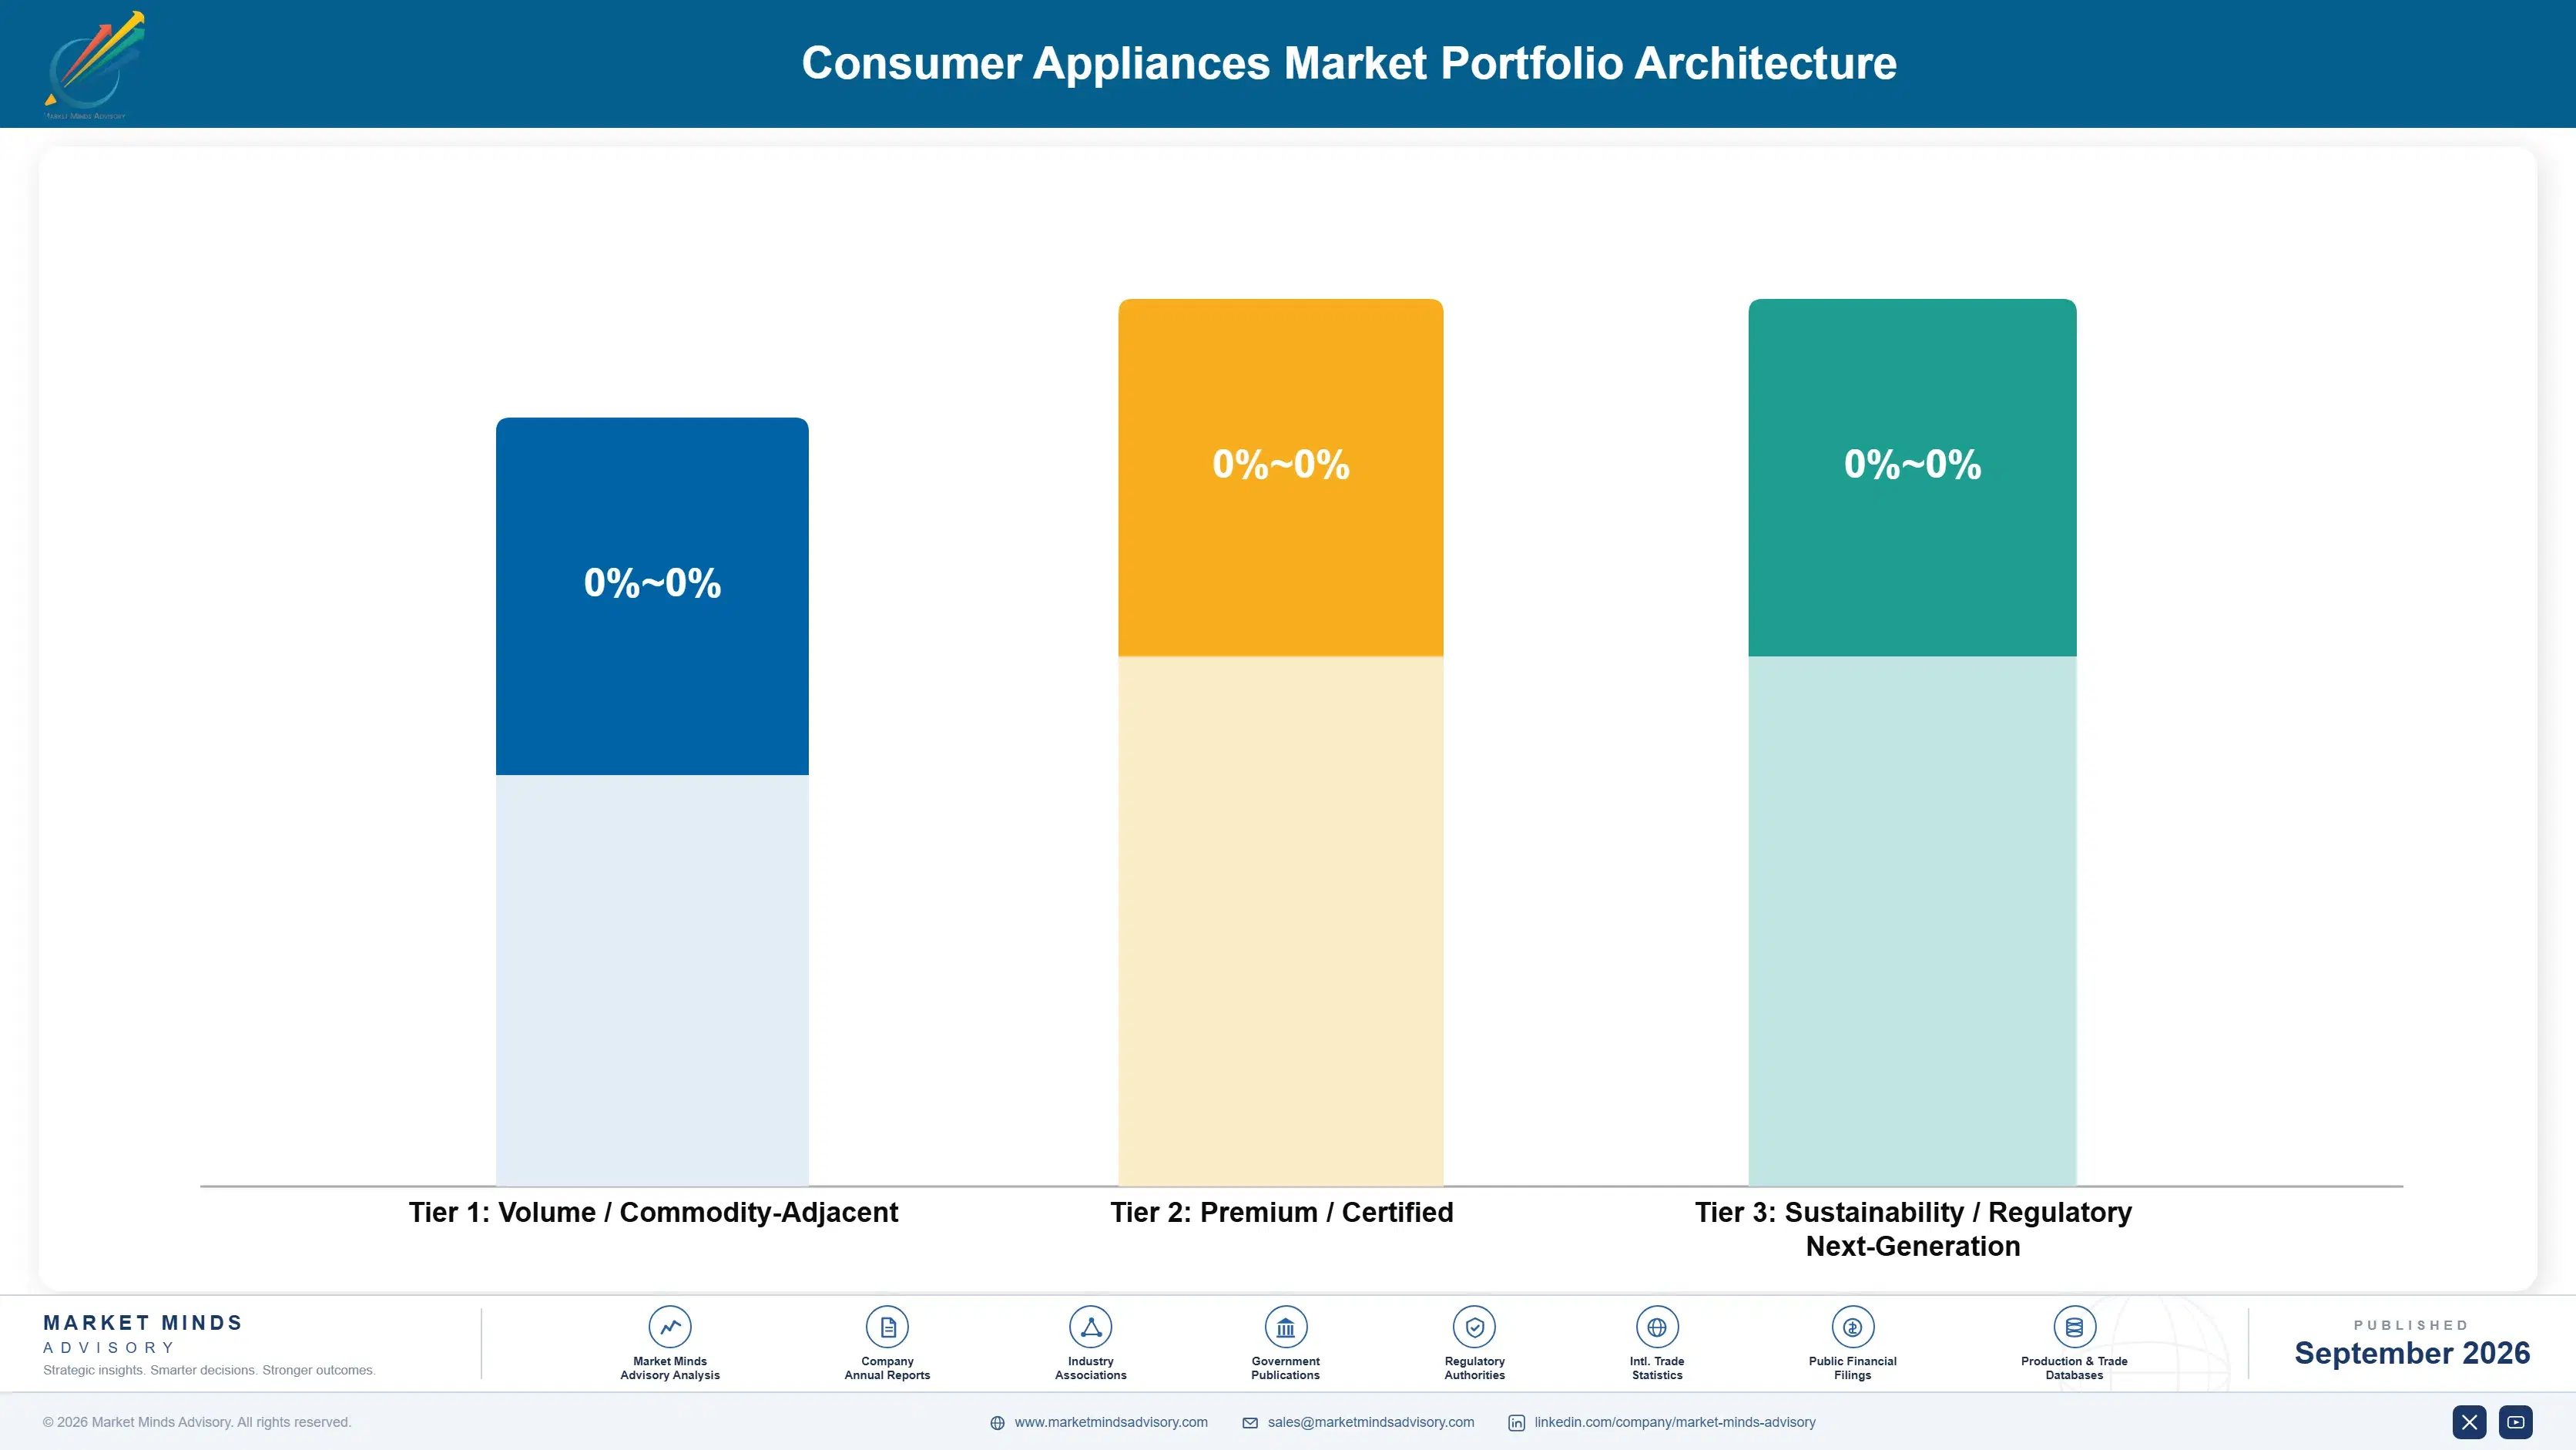
Margin architecture in appliances is thin at the point of manufacture and considerably better everywhere else, which most participants organise around poorly. Entry and mid-tier major appliances sold through mass, builder and online channels run at gross margins in the mid teens to around twenty percent, competing on price against manufacturers with cost positions built on scale that cannot be matched at lower volume.
Premium major appliances and design-led small appliances hold gross margins in the mid twenties to mid thirties. The spread reflects brand permission and channel rather than component cost, since a premium oven and a mid-tier one share more engineering than either manufacturer advertises. Kitchen specification channels also avoid the direct price comparison that a big box aisle enforces on every shopper.

The highest-value pool is spare parts and service, at margins in the mid forties to mid fifties, and regulation is obliging the industry to build the capability regardless. A service visit also produces a customer contact that a manufacturer selling through retail otherwise never has. Appliance manufacture fills the factories. It does not produce the margin that sits downstream of it.

Volume / Commodity-Adjacent

Entry and mid-tier major appliances sold through mass, builder and online channels. These compete against manufacturers whose scale cost positions cannot be matched at lower volumes anywhere in the market.
Gross Margin: 14 to 20%

Premium / Certified

Premium major appliances and design-led small appliances sold through specification and specialty channels. The eight-point range reflects brand permission and channel rather than any meaningful difference in component cost. Specification channels avoid direct aisle comparison entirely.
Gross Margin: 26 to 34%

Sustainability / Regulatory / Next-Generation

Spare parts and service revenue that regulation obliges manufacturers to provide anyway. A service visit also produces a direct customer contact that selling through retail never delivers to the manufacturer.
Gross Margin: 44 to 54%
consumer-appliances-market-portfolio-architecture-1790023383485

High-value Sub-segments and Strategic Watch-out

Spare Parts And Service Operations

High value and growing by regulation rather than by demand. Parts obligations require years of availability after production ends, and participants running this with its own targets report it outgrowing unit revenue. Margins here run around 49% against 17% on appliance manufacture, which few report separately.
Gross Margin: 46 to 54%

Design Led Small Appliances

High value and high growth at 6.3%. No installation decision gates the purchase, replacement runs in a few years and genuine innovation moves through quickly because the risk of trying something new is small. New entrants appear regularly because the barrier is design rather than heavy engineering.
Gross Margin: 30 to 38%

Entry Tier Major Appliances

Volume core, competing against scale cost positions that cannot be matched at lower volumes. It fills factories and carries the freight exposure on a bulky product without producing meaningful margin. Scale cost positions built over decades cannot be contested at lower volumes by anyone at all.
Gross Margin: 14 to 19%

Connected Mid Tier Appliances

Strategic watch-out. Roughly 14% of connected units are ever linked to a network, so component cost and a multi-year security obligation land where no service revenue follows them at all. Removing the radio releases cost with no measurable effect on sell-through at any price point.
Gross Margin: 18 to 28%

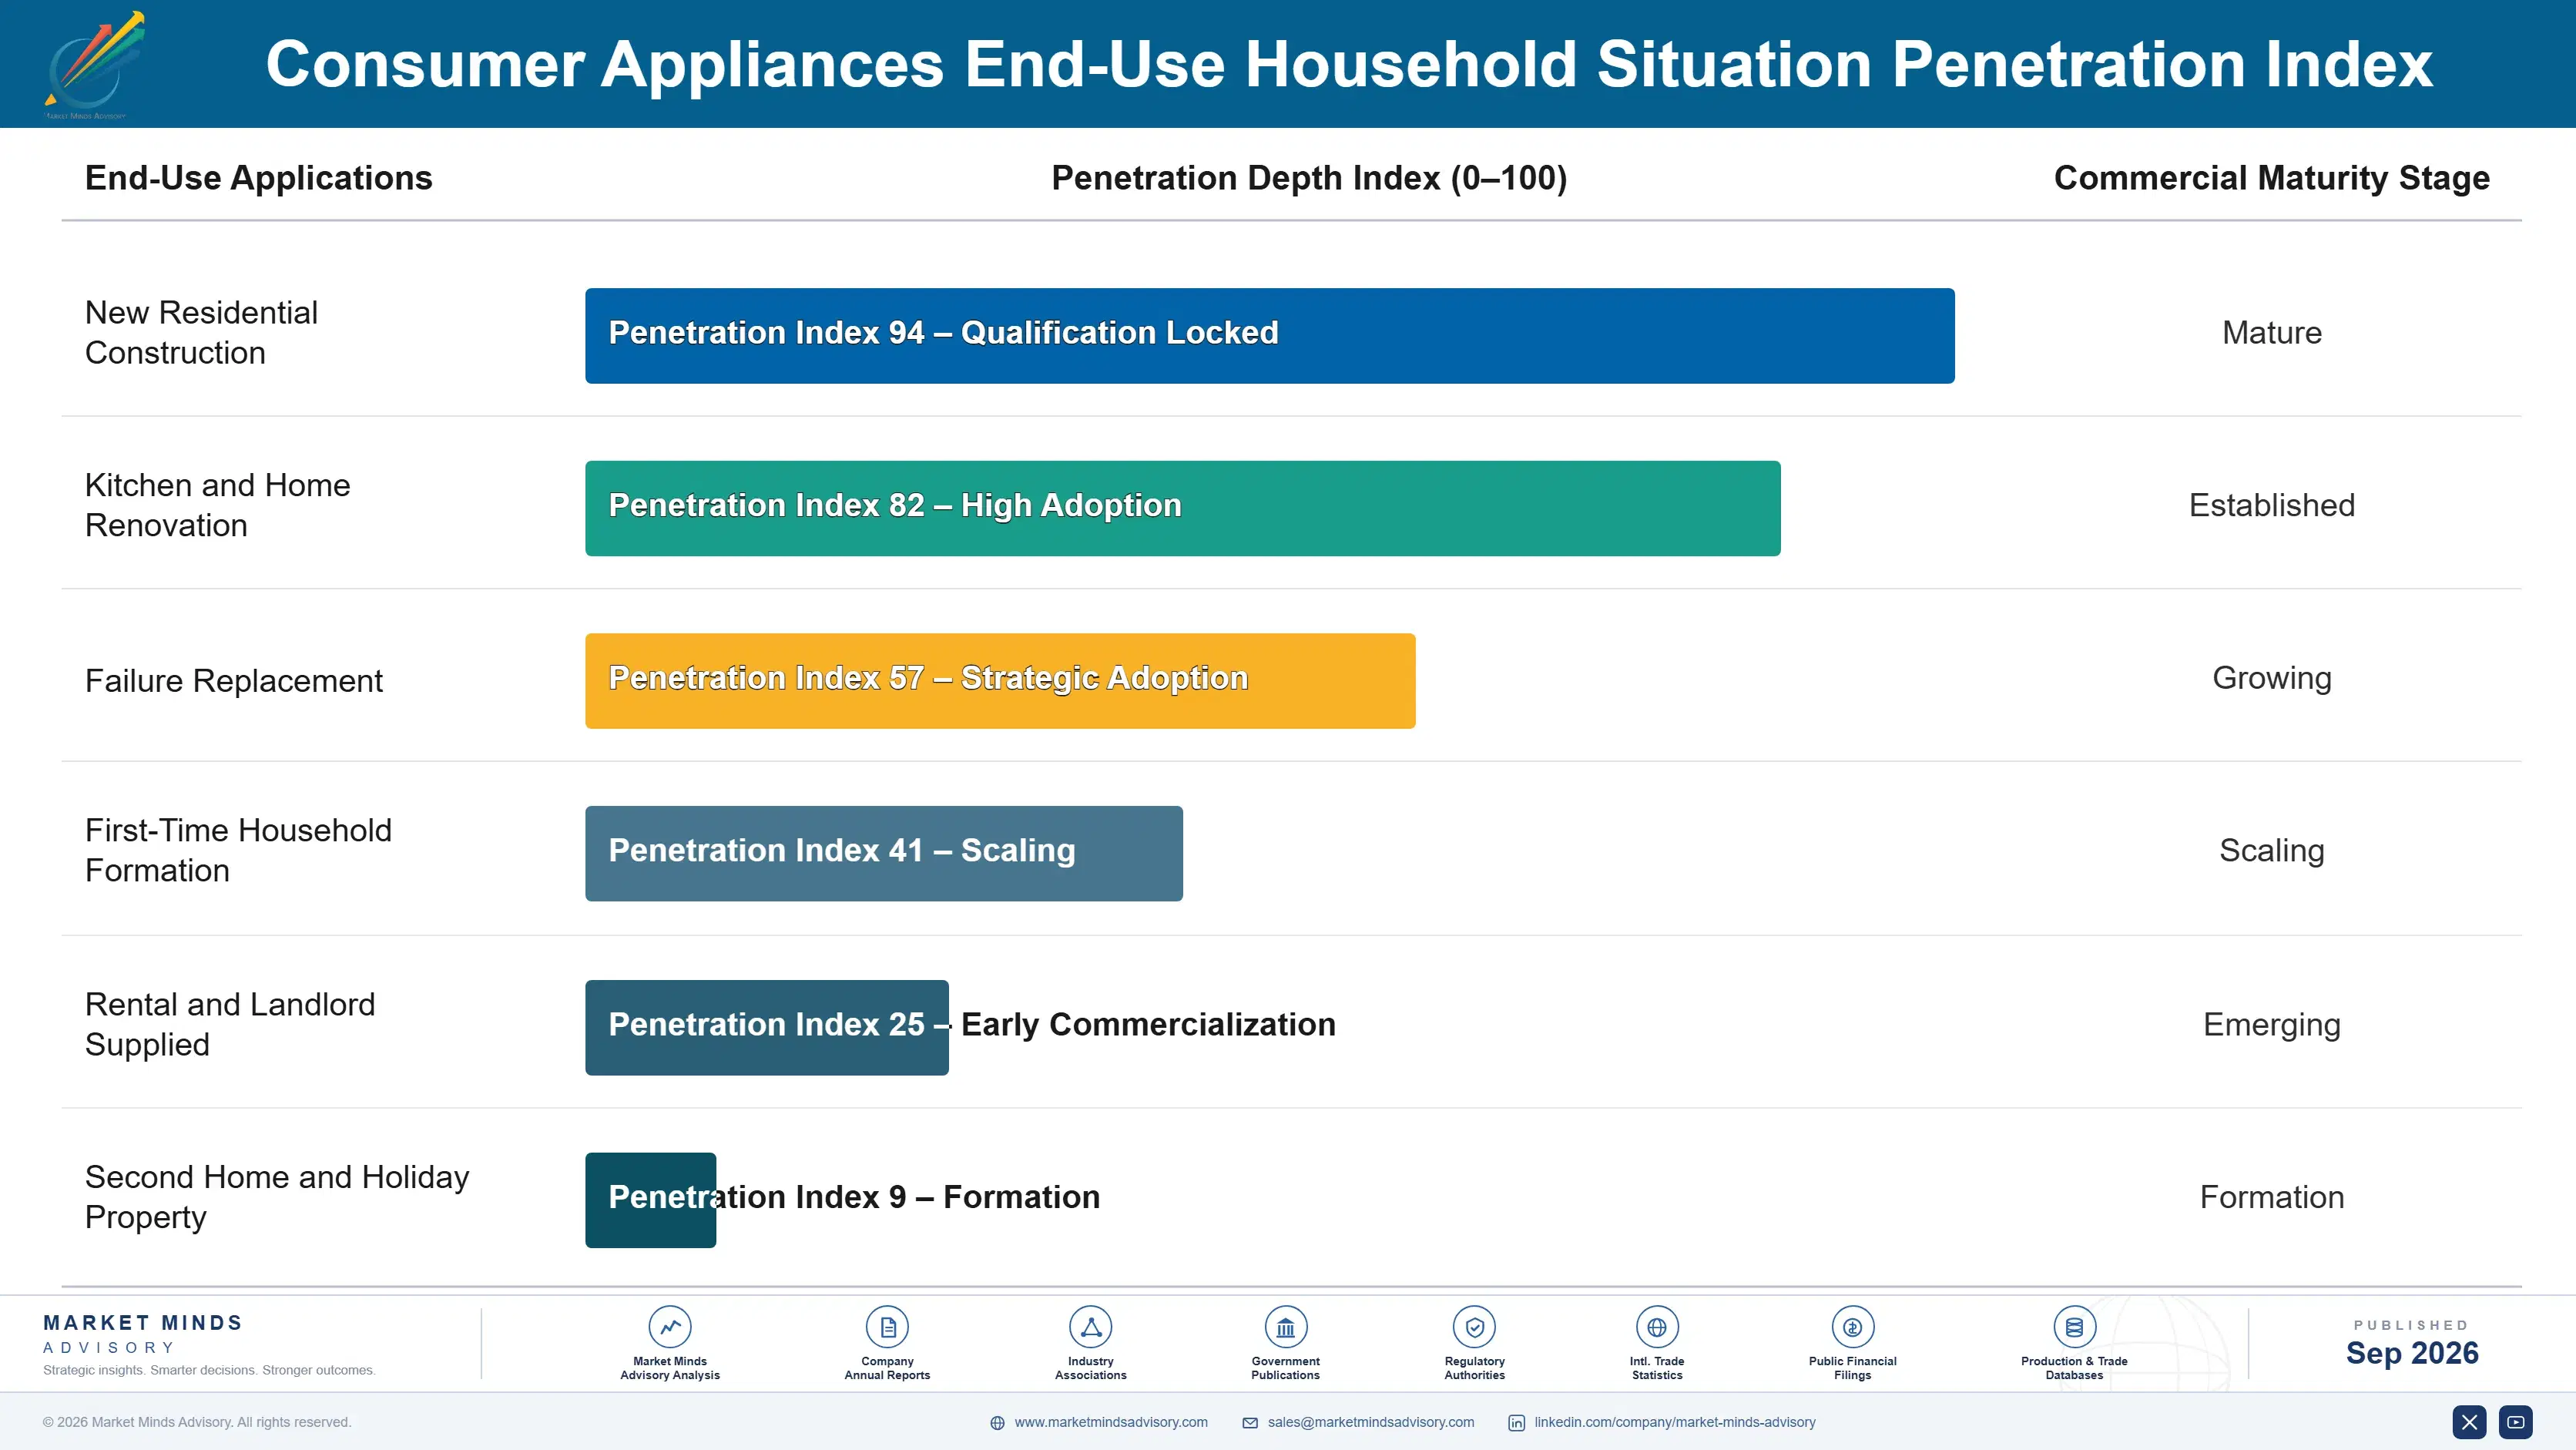
What Triggers Replacement

Major appliance purchase is event-driven rather than desire-driven, which makes it behave far more like a building product than a consumer one. A household buys when it moves, renovates or when something breaks, and almost never because a newer machine appeared. That ties the category to housing transaction volumes closely enough that a slowdown removes demand no marketing can replace, and it made 2023 and 2024 difficult everywhere transactions fell.
Stickiness varies sharply by how the appliance arrived. Households that chose a machine through a kitchen specification process replace with the same brand at high rates, because cabinetry, apertures and fascias all match. Builder-installed appliances generate almost no loyalty, since the occupant never chose one. Small appliance buyers have effectively no brand attachment at all and select on price, appearance and whichever review they encountered most recently.

Owner expectations have moved in one direction that matters commercially. Perceived appliance lifespan now sits near 8.1 years and has fallen rather than risen, which consumers notice and resent. The cohort replacing a machine that failed on electronics after six years arrives at the next purchase asking about repairability, and in one market it can now read a score beside the price.
consumer-appliances-market-end-use-penetration-index-1790023383973

Where Margin Actually Sits

These are among the four positions where our research anticipates prominent divergence between winners and laggards over the coming forecast period. Each is grounded in the demand model, the regulatory perimeter, and the announced capacity pipeline.
01 / CONTROL BOARD STANDARDISATION

Stop pricing the failure part as a rare spare

A replacement control board costs around 54% of what an appliance is worth at the point of failure, because boards are model-specific, produced in short runs and priced as low-volume spares rather than as components. That arithmetic ends otherwise sound machines and is increasingly difficult to defend publicly. Common board architectures across a platform cut the spare price, shrink the inventory obligation regulation imposes and shorten service visits, with participants reporting spare board cost falling by roughly 38%, and the work is a platform decision rather than a product redesign.
02 / SERVICE BUSINESS ORGANISATION

Run the parts obligation as a profit centre

Spare parts availability requirements oblige manufacturers to supply components for years after production ends, and most treat that as a compliance burden buried inside operations. Parts carry gross margins far above appliance manufacture and a service visit produces a direct customer contact that selling through retail never delivers. Participants running parts and service with its own targets report it contributing revenue growth faster than unit sales, on a capability they were compelled to build regardless, which makes this an organisational change rather than a capital or technical one.
03 / CONNECTIVITY RANGE RATIONALISATION

Take the radio out of the middle of the range

Around 14% of connected appliances are ever linked to a home network, so the component cost and a multi-year security update obligation land on ranges where no service revenue follows them at all. Concentrating connectivity where a genuine service attaches and removing it below that releases bill of materials cost and shrinks the software maintenance estate. Participants who have done it report mid-tier contribution improving by around 3 points with no measurable effect on sell-through, at any price point the participants making the change have so far measured.
04 / REPAIRABILITY DESIGN INVESTMENT

Score well before the rule reaches your market

One national market already publishes a mandatory repairability score beside the price and is extending it toward durability, while European disassembly requirements push in the same direction across the region. Designing fastening, part access and documentation to score well costs engineering attention rather than materials, and the result is visible to buyers in a way build quality never was. Participants scoring in the top band report share gains of roughly 4 points in that market, before the requirement reaches any of their other markets at all.

Engagement Snapshot From the Field

A live engagement with an industry participant carrying material or product regulatory and market exposure ahead of a defining policy shift, showing how our research translates into a defensible multi-year portfolio strategy.
MARKET MINDS ADVISORY · CLIENT ENGAGEMENT SUMMARY
Consumer Appliances Producer Strategic Portfolio Review and Transition Roadmap 2026·Investment Scenario on Consumer Appliances Exposure Evaluation 2025-26
CLIENT PROFILE
A European major appliance manufacturer producing laundry and dishwashing products across three engineering platforms with revenue near USD 2.4 billion (client-reported, unverified by MMA). Spare parts were managed within operations against a compliance target with no revenue objective attached. Every mid-tier and premium model carried connectivity, and no repairability scoring work had been undertaken anywhere in the business.
STRATEGIC CHALLENGE
Operating margin had fallen for three consecutive years while unit volumes held, and management attributed it to competitive pricing pressure from lower-cost manufacturers. A cost reduction programme targeting bill of materials had been approved. Nobody had costed the spare parts inventory obligation or examined what connectivity was actually delivering. Neither had ever been examined internally.
MMA APPROACH
MMA costed the spare parts inventory obligation across all three platforms including capital tied up in boards that would never sell, then modelled a common board architecture against it. Connectivity activation was measured across the installed base. Repairability scoring was simulated for the current range, and parts and service margins were separated from manufacturing for the first time.
KEY FINDINGS
  1. Spare parts and service generated gross margins of 49% against 17% on appliance manufacture, and had never been reported separately or given any revenue target.
  2. Model-specific boards across three platforms tied up capital in inventory with an estimated obsolescence write-off exceeding the annual cost reduction target being pursued.
  3. Connectivity activation across the installed base was 11%, below the category figure, and no service revenue of any kind attached to the connected estate.
  4. Simulated repairability scoring placed the current range in the middle band, with fastening and board access accounting for most of the shortfall against top-scoring competitors.
CLIENT PROFILE
A European major appliance manufacturer producing laundry and dishwashing products across three engineering platforms with revenue near USD 2.4 billion (client-reported, unverified by MMA). Spare parts were managed within operations against a compliance target with no revenue objective attached. Every mid-tier and premium model carried connectivity, and no repairability scoring work had been undertaken anywhere in the business.
STRATEGIC CHALLENGE
Operating margin had fallen for three consecutive years while unit volumes held, and management attributed it to competitive pricing pressure from lower-cost manufacturers. A cost reduction programme targeting bill of materials had been approved. Nobody had costed the spare parts inventory obligation or examined what connectivity was actually delivering. Neither had ever been examined internally.
MMA APPROACH
MMA costed the spare parts inventory obligation across all three platforms including capital tied up in boards that would never sell, then modelled a common board architecture against it. Connectivity activation was measured across the installed base. Repairability scoring was simulated for the current range, and parts and service margins were separated from manufacturing for the first time.
KEY FINDINGS
  1. Spare parts and service generated gross margins of 49% against 17% on appliance manufacture, and had never been reported separately or given any revenue target.
  2. Model-specific boards across three platforms tied up capital in inventory with an estimated obsolescence write-off exceeding the annual cost reduction target being pursued.
  3. Connectivity activation across the installed base was 11%, below the category figure, and no service revenue of any kind attached to the connected estate.
  4. Simulated repairability scoring placed the current range in the middle band, with fastening and board access accounting for most of the shortfall against top-scoring competitors.
RECOMMENDED STRATEGY
Phase 1: Phase one: separate parts and service into a reported business with its own revenue and margin targets immediately. Margins there run near 49%. Phase 2: Phase two: adopt a common control board architecture across the three platforms at the next generation change. Obsolescence write-off exceeds the cost target. Phase 3: Phase three: remove connectivity from mid-tier models and redesign fastening and board access for repairability scoring. Activation across the base was 11%.
OUTCOME
Parts and service revenue grew by roughly 34% within a year of being given its own targets (client-reported, unverified by MMA), and mid-tier contribution improved after connectivity was removed with no sell-through effect. The bill of materials cost programme was narrowed considerably once the inventory obligation was properly costed against it.

Frequently Asked Questions

Foundational context covering the market sizes, CAGR, scope, country, region and competition that inform every finding below. This section is provided to cover basics and most often pre-purchase conversations, answered from the MMA Primary Research Dataset.

What is the current size of the Consumer Appliances Market?

The market was valued at USD 560.0 billion in 2025, rising to USD 583.5 billion in 2026. Sizing is at manufacturer revenue across major and small appliance categories.

How large will the Consumer Appliances Market be by 2036?

MMA forecasts USD 880.5 billion by 2036, an increase of USD 297.0 billion over the 2026 base. That represents expansion of 1.51 times across the forecast period.

What is the CAGR for the Consumer Appliances Market 2026 to 2036?

The base case CAGR is 4.2%, with a bull case of 5.4% and a bear case of 3.0%. Historical growth between 2020 and 2025 ran at 3.1%.

Which segment is growing fastest?

Small kitchen appliances grow at 6.3%, half again the market rate, because no installation decision gates the purchase. Floor care and home comfort products follow at 5.4%.

Who are the major companies in the Consumer Appliances Market?

Midea Group, Haier Smart Home, Whirlpool, BSH Hausgerate and Electrolux lead on manufacturer revenue, holding a combined 31%. Chinese manufacturers have converted export scale into global brand positions.

Which country is growing fastest?

India grows fastest at 7.1%, because household formation adds first-time appliance buyers rather than replacements across refrigeration, laundry and small kitchen categories. Penetration across those categories sits far below Western levels.

Report Segmentation Architecture

The full report scope spans multiple orthogonal segmentation dimensions, with cross-tabulated demand data provided for each dimension pair. Coverage extends further to regional breakdowns, trend trajectories, and the competitive detail needed to support segment-level decision-making.

By Appliance Category

  • Refrigeration Appliances
  • Laundry Appliances
  • Cooking Appliances
  • Dishwashing Appliances
  • Small Kitchen Appliances
  • Floor Care and Home Comfort Appliances

By End-Use Household Situation

  • New Residential Construction
  • Kitchen and Home Renovation
  • Failure Replacement
  • First-Time Household Formation
  • Rental and Landlord Supplied
  • Second Home and Holiday Property

By Distribution Channel

  • Big Box Appliance Retail
  • Kitchen Specification and Design
  • Builder and Developer Supply
  • Online and Marketplace
  • Independent Appliance Dealers
  • Department and General Retail

By Region

  • East Asia
  • North America
  • Western Europe
  • South Asia and Pacific
  • Latin America
  • Eastern Europe
  • Middle East and Africa

Scope, Methodology, and Coverage

Every figure in this report is reproducible from documented input assumptions. The scope below maps the historical period, the forecast horizon, the segmentation dimensions, and the countries covered, alongside the underlying primary and qualitative methodology.
Historical Period
2020 to 2025
Forecast Period
2026 to 2036
Base Year
2025 (USD billions; MMA Primary Research Dataset, September 2026)
Market Definition
This market covers appliances sold for household use, spanning refrigeration, laundry, cooking, dishwashing, small kitchen appliances, and floor care and home comfort products. Sizing is at manufacturer revenue across big box, kitchen specification, builder, online, independent and department channels. Commercial and professional catering equipment, heating and air conditioning systems installed as building services, consumer electronics and personal care devices, and extended warranty or service contracts sold separately from an appliance are excluded throughout.
Quantitative Units
USD billions at manufacturer revenue; volume in millions of units; spare part cost as a proportion of appliance value.
Segmentation Dimensions
Appliance category, end-use household situation, distribution channel, and geographic region.
Regions Covered
East Asia, North America, Western Europe, South Asia and Pacific, Latin America, Eastern Europe, Middle East and Africa
Countries Covered
China, United States, Germany, India, Brazil, Japan
Key Companies Profiled
Midea Group, Haier Smart Home, Whirlpool Corporation, BSH Hausgerate, Electrolux, LG Electronics, Samsung Electronics, Panasonic, Arcelik, Gree Electric Appliances, Hisense, Groupe SEB, De'Longhi, Sharp Corporation, Dyson, SharkNinja, Miele, Smeg, Voltas, Godrej Appliances
Quantitative Methodology
Primary survey, n=3,800 respondents, Q4 2025, six countries; demand-side model with trade association cross-validation
Qualitative Methodology
47 expert interviews, Q4 2025; applied to validate demand model assumptions, identify emerging dynamics, and assess competitive positioning
Report Format
PDF and XLSX data workbook (Word format preview document)
Publisher
Market Minds Advisory
Report Code
MMA-2026-CON-787
Published
September 2026
Contact
sales@marketmindsadvisory.com | www.marketmindsadvisory.com

Purchase the full Consumer Appliances Market Report (2026 to 2036).

The full report sizes the consumer appliances market across six appliance categories, six household situations and six distribution channels for all seven global regions. It includes spare parts inventory obligation costed by engineering platform, including capital tied up in components that will never sell. Connectivity activation is measured across installed bases rather than shipped units. Repairability scoring is simulated against current ranges to identify design shortfalls, and parts and service margins are separated from manufacturing throughout. Competitive assessment covers 20 participants on a consistent manufacturer revenue basis.
Spare parts obligation costed by engineering platform
Connectivity activation measured across installed bases
Repairability scoring simulated against current ranges
Parts and service margins separated from manufacturing
Six appliance categories sized through 2036
Twenty participants assessed on manufacturer revenue

Built For The People Who Decide

From boardroom strategy to bench-side execution, this report is read cover-to-cover by leaders shaping the next decade of their industry, turning demand scenarios, market dynamics and valuation benchmarks into decisions.
CXOs/ Presidents/ VPs/ Managers
M&A and Corporate Development
Strategy Teams and R&D Heads
Procurement and Product Directors
Regulatory and Compliance Leaders
Investor Relations and Equity Analysts