Market Minds Advisory
Construction Wearable Technology Market

Construction Wearable Technology Market: Construction Wearable Technology: Split Incentives, Worker Consent and the Two Applications That Actually Pay

The party buying these devices rarely employs the workers actually wearing them, and that single misalignment explains far more failed deployments than battery life, ruggedness or worker resistance ever have.

Lead Analyst

Published

September 2026

Make Smarter Decisions with Customized Research Insights

Request a free sample report and evaluate market opportunities, growth trends, and competitive dynamics relevant to your business needs.

2025 MARKET VALUE$0.9BMarket Size 2025
2036 FORECAST VALUE$4.3BBase Case , 2026 to 2036
CAGR 2026 TO 203615.2 %Bull 16.4% / Bear 14.0%
INCREMENTAL OPPORTUNITY$3.2BNet 10- year value creation
EXPANSION MULTIPLE4.12x2036 value over 2026 base
Strategic Levers
M&A Pipeline
Regional Outlook
Country Rankings
Competitive Intelligence
Segmental Deep-dive
Call-Us : 91 93563 13602

Executive Snapshot and Market Trajectory.

Roughly 76% of people on a construction site work for somebody other than the contractor buying the technology. That is the central commercial problem here, and no amount of product improvement addresses it. Every product improvement in this category has been aimed at a problem that was never the obstacle.
Where the incentive does align, the results are real. Proximity detection around heavy equipment grows at 22.8%, half again the market rate of 15.2%, because being struck by equipment accounts for around 24% of construction fatalities and the owner carrying the insurance can see the number. Heat monitoring follows for the same reason. East Asia takes 32% of spending on the sharpest safety liability rules anywhere.
Concentration is low at roughly 28% across the top five on measured device and platform revenue, and the field mixes established safety equipment makers with venture-funded specialists. Around 41% of pilots are abandoned, and utilisation on issued devices runs near 63%. A device in a locker protects nobody and nobody is measuring that. Shipments and actual coverage are simply not the same number, and buyers rarely check which one they are being shown.
Market Definition
This market covers body-worn and personal protective equipment technology used on construction sites, spanning proximity detection and collision avoidance, location tracking and site mustering, physiological and heat stress monitoring, fall detection and impact sensing, powered and passive exoskeletons, and head-mounted display systems. Revenue is measured as device, gateway and platform subscription value. Fixed site cameras and sensors, machine-mounted proximity systems, drones, conventional unconnected personal protective equipment, and construction project management software are excluded.
Base Year Value
$0.9B in 2025 (MMA Primary Research Dataset, September 2026)
Forecast Period
2026 to 2036, eleven discrete annual values
CAGR
15.2% base case. Bull 16.4%. Bear 14.0%.
Fastest Growth Segment
Proximity Detection and Collision Avoidance: 22.8% CAGR
Fastest Growth Country
Saudi Arabia: 21.6% CAGR
Fastest Growth Region
South Asia and Pacific: 17.4% CAGR
Largest Region
East Asia: 32% of 2025 global value
Market Leaders
Honeywell, MSA Safety, Blackline Safety, 3M and Hilti lead on measured construction wearable device and platform revenue. Source: MMA Primary Research Dataset, July 2026.
Primary Survey
n=3,800 procurement and R&D decision-makers, Q4 2025, six countries
Methodology
Demand-side build-up, cross-validated against public data, 47 expert interviews

Construction Wearable Technology Market Forecast Scenarios

construction-wearable-technology-market-size-forecast-scenario-1788421678955
Growth ran at 14.2% from 2020 to 2025 and most of it came from a few very large projects rather than broad adoption. Pandemic contact tracing briefly pushed location tracking onto projects that had never considered it, and most of it lapsed with the requirement. What survived was proximity avoidance on equipment-heavy sites and heat monitoring in hot climates, both of which had a measurable incident behind them.
The base case at 15.2% rests on three mechanisms rather than on general safety enthusiasm. Criminal liability for workplace fatalities in several jurisdictions has moved safety spending from operational budgets to board attention, which changes both the amount and the speed. Owner-controlled insurance arrangements let the party carrying the loss mandate technology across every subcontractor on a project. Third, heat exposure rules are tightening in exactly the regions where megaproject labour is concentrated.
The bull case at 16.4% assumes insurers price wearable deployment into construction premiums explicitly, which would move adoption from voluntary to contractual across whole portfolios. The bear case at 14.0% is that split incentives persist, subcontractors resist and utilisation stays near 63%. That is the current condition rather than a hypothetical, and nothing about it is improving quickly.

Who Buys, Who Wears and Who Carries the Loss

Construction sites are assembled from companies rather than staffed by one. A general contractor manages the project and roughly 76% of the people on site work for subcontractors, each with its own employment terms, insurance and view on whether a tracking device is acceptable. The contractor buys the technology, the subcontractor's workers wear it, and the benefit accrues to whoever carries the loss. Those are frequently three different parties.
TOP FIVE CONCENTRATION28%Fragmented field spanning safety equipment makers and specialists
SUBCONTRACTED WORKFORCE SHARE76%Site workers employed by parties who do not purchase
PILOT ABANDONMENT RATE41%Trials discontinued before reaching any sustained site-wide deployment
STRUCK-BY INCIDENT SHARE24%Portion of construction fatalities involving contact with equipment
DEVICE UTILISATION RATE63%Issued units actually worn across a typical working shift
COST PER WORKER ANNUALLYUSD 340Outlay per worker across device, gateway and platform
That structure explains the failure pattern better than any product criticism does. Around 41% of pilots are abandoned, usually not because devices failed but because nobody could make subcontractors issue them consistently, and utilisation sits near 63%. The remaining third of workers either did not receive a device, did not charge it, or left it in a locker. A wearable that is not worn is a subscription with no safety function attached.
Where the incentive aligns, the technology performs. Proximity detection around excavators, loaders and haul trucks addresses roughly 24% of construction fatalities and produces incident reductions large enough for an insurer to notice. Heat monitoring in hot climates produces the same clarity. Everything else is sold on a general safety argument competing with every other cost on a low-margin project.
"The uncomfortable question in every one of these deployments is who actually gets paid when an incident does not happen. Until that answer is the same party writing the cheque, adoption will keep stalling at the pilot, and it has very little to do with the hardware."
Director, Construction Technology and Site Safety Practice · MMA Construction and Industrial Equipment Practice · September 2026

Market Trends

Owner-Controlled Insurance Becomes the Adoption Mechanism

Wrap-up and owner-controlled insurance arrangements place a single policy across every contractor on a project, which puts loss and premium in the same hands as the authority to set site rules. That resolves the split incentive directly: the owner mandates wearable deployment as a condition of site access and every subcontractor complies because the alternative is not working. Deployments arranged this way reach utilisation well above the 63% market average and abandon far less often. It is a contractual mechanism rather than a technical one, and it is the clearest route to scale anyone has found.
Market Impact: Addresses 24% of site fatalities
Criminal Liability Moves Safety Spending to the Board

Several jurisdictions have introduced personal criminal liability for executives where workplace deaths follow from inadequate safety management, which changes who signs off on prevention spending and how quickly. South Korean legislation is the sharpest example and Australian industrial manslaughter provisions run in the same direction. The practical effect is that safety technology stops competing against other project costs and starts being evaluated against personal exposure. Suppliers reaching those buyers sell evidence of systematic control rather than device features, which is a different conversation entirely. Device features stop mattering once personal exposure enters the conversation.
Market Impact: Segment grows at 19.6% yearly

Market Opportunities and Growth Drivers

Struck-By Incidents Give Proximity Detection a Countable Case

Contact with equipment and vehicles accounts for roughly 24% of construction fatalities, and unlike most safety categories the mechanism is specific enough to engineer against. Proximity detection between worker tags and machine-mounted units triggers alerts and, on some equipment, automatic slowdown. Insurers and owners can see the incident count change on a site, which is rare in safety technology. That measurability is why proximity detection grows at 22.8%, faster than anything else here, and why it survives budget scrutiny that general site awareness products do not. Owners can point at the number before and after.
Market Impact: Restricted in 5 labour markets

Heat Exposure Rules Tighten Where Megaproject Labour Concentrates

Midday working bans, mandatory rest schedules and heat stress management requirements have expanded across the Gulf, South and Southeast Asia and parts of the United States, and enforcement has become more active than it was. Physiological monitoring converts a blanket schedule rule into individual risk management, letting a project keep working while demonstrating control. Saudi Arabia is the fastest-growing country market at 21.6% for exactly this reason, combining extreme heat with the largest concentration of active megaproject labour anywhere in the world. Individual monitoring buys schedule time that a blanket rule simply removes.
Market Impact: Costs USD 340 per worker

Market Restraints and Challenges

Worker Consent and Location Tracking Resistance Stops Deployments

Site workers frequently object to continuous location tracking, and organised labour has negotiated restrictions on it in several markets, which removes capability that suppliers had built their proposition around. The root cause is that these devices genuinely can track individuals, and assurances about aggregate use do not survive first contact with a disciplinary case. Commercially this caps what any deployment can collect. Suppliers are mitigating with zone-level rather than point-level location, on-device processing, worker-visible data policies and negotiated agreements before deployment rather than afterwards. The technical answer exists and few products implement it.
Market Impact: Lifts utilisation above 63% average

Subcontractor Economics Leave Nobody Willing to Pay

Around 76% of site workers are employed by subcontractors running on margins of a few percent, and a wearable costing roughly USD 340 per worker annually delivers them no recoverable benefit whatever, since the insurance saving sits with the owner or general contractor. The root cause is contractual structure rather than reluctance. Suppliers are mitigating by pricing per project rather than per employer, selling into owner-controlled insurance programmes, and building general contractor site access requirements that fund devices centrally. Site access requirements funded centrally are the only structure that has consistently worked.
Market Impact: Applies across 4 major jurisdictions
3 additional market trends, 4 additional growth drivers, and 2 additional restraints and challenges are covered in the full report. Contact sales@marketmindsadvisory.com to access the complete intelligence.

Segment CAGR and Growth Architecture

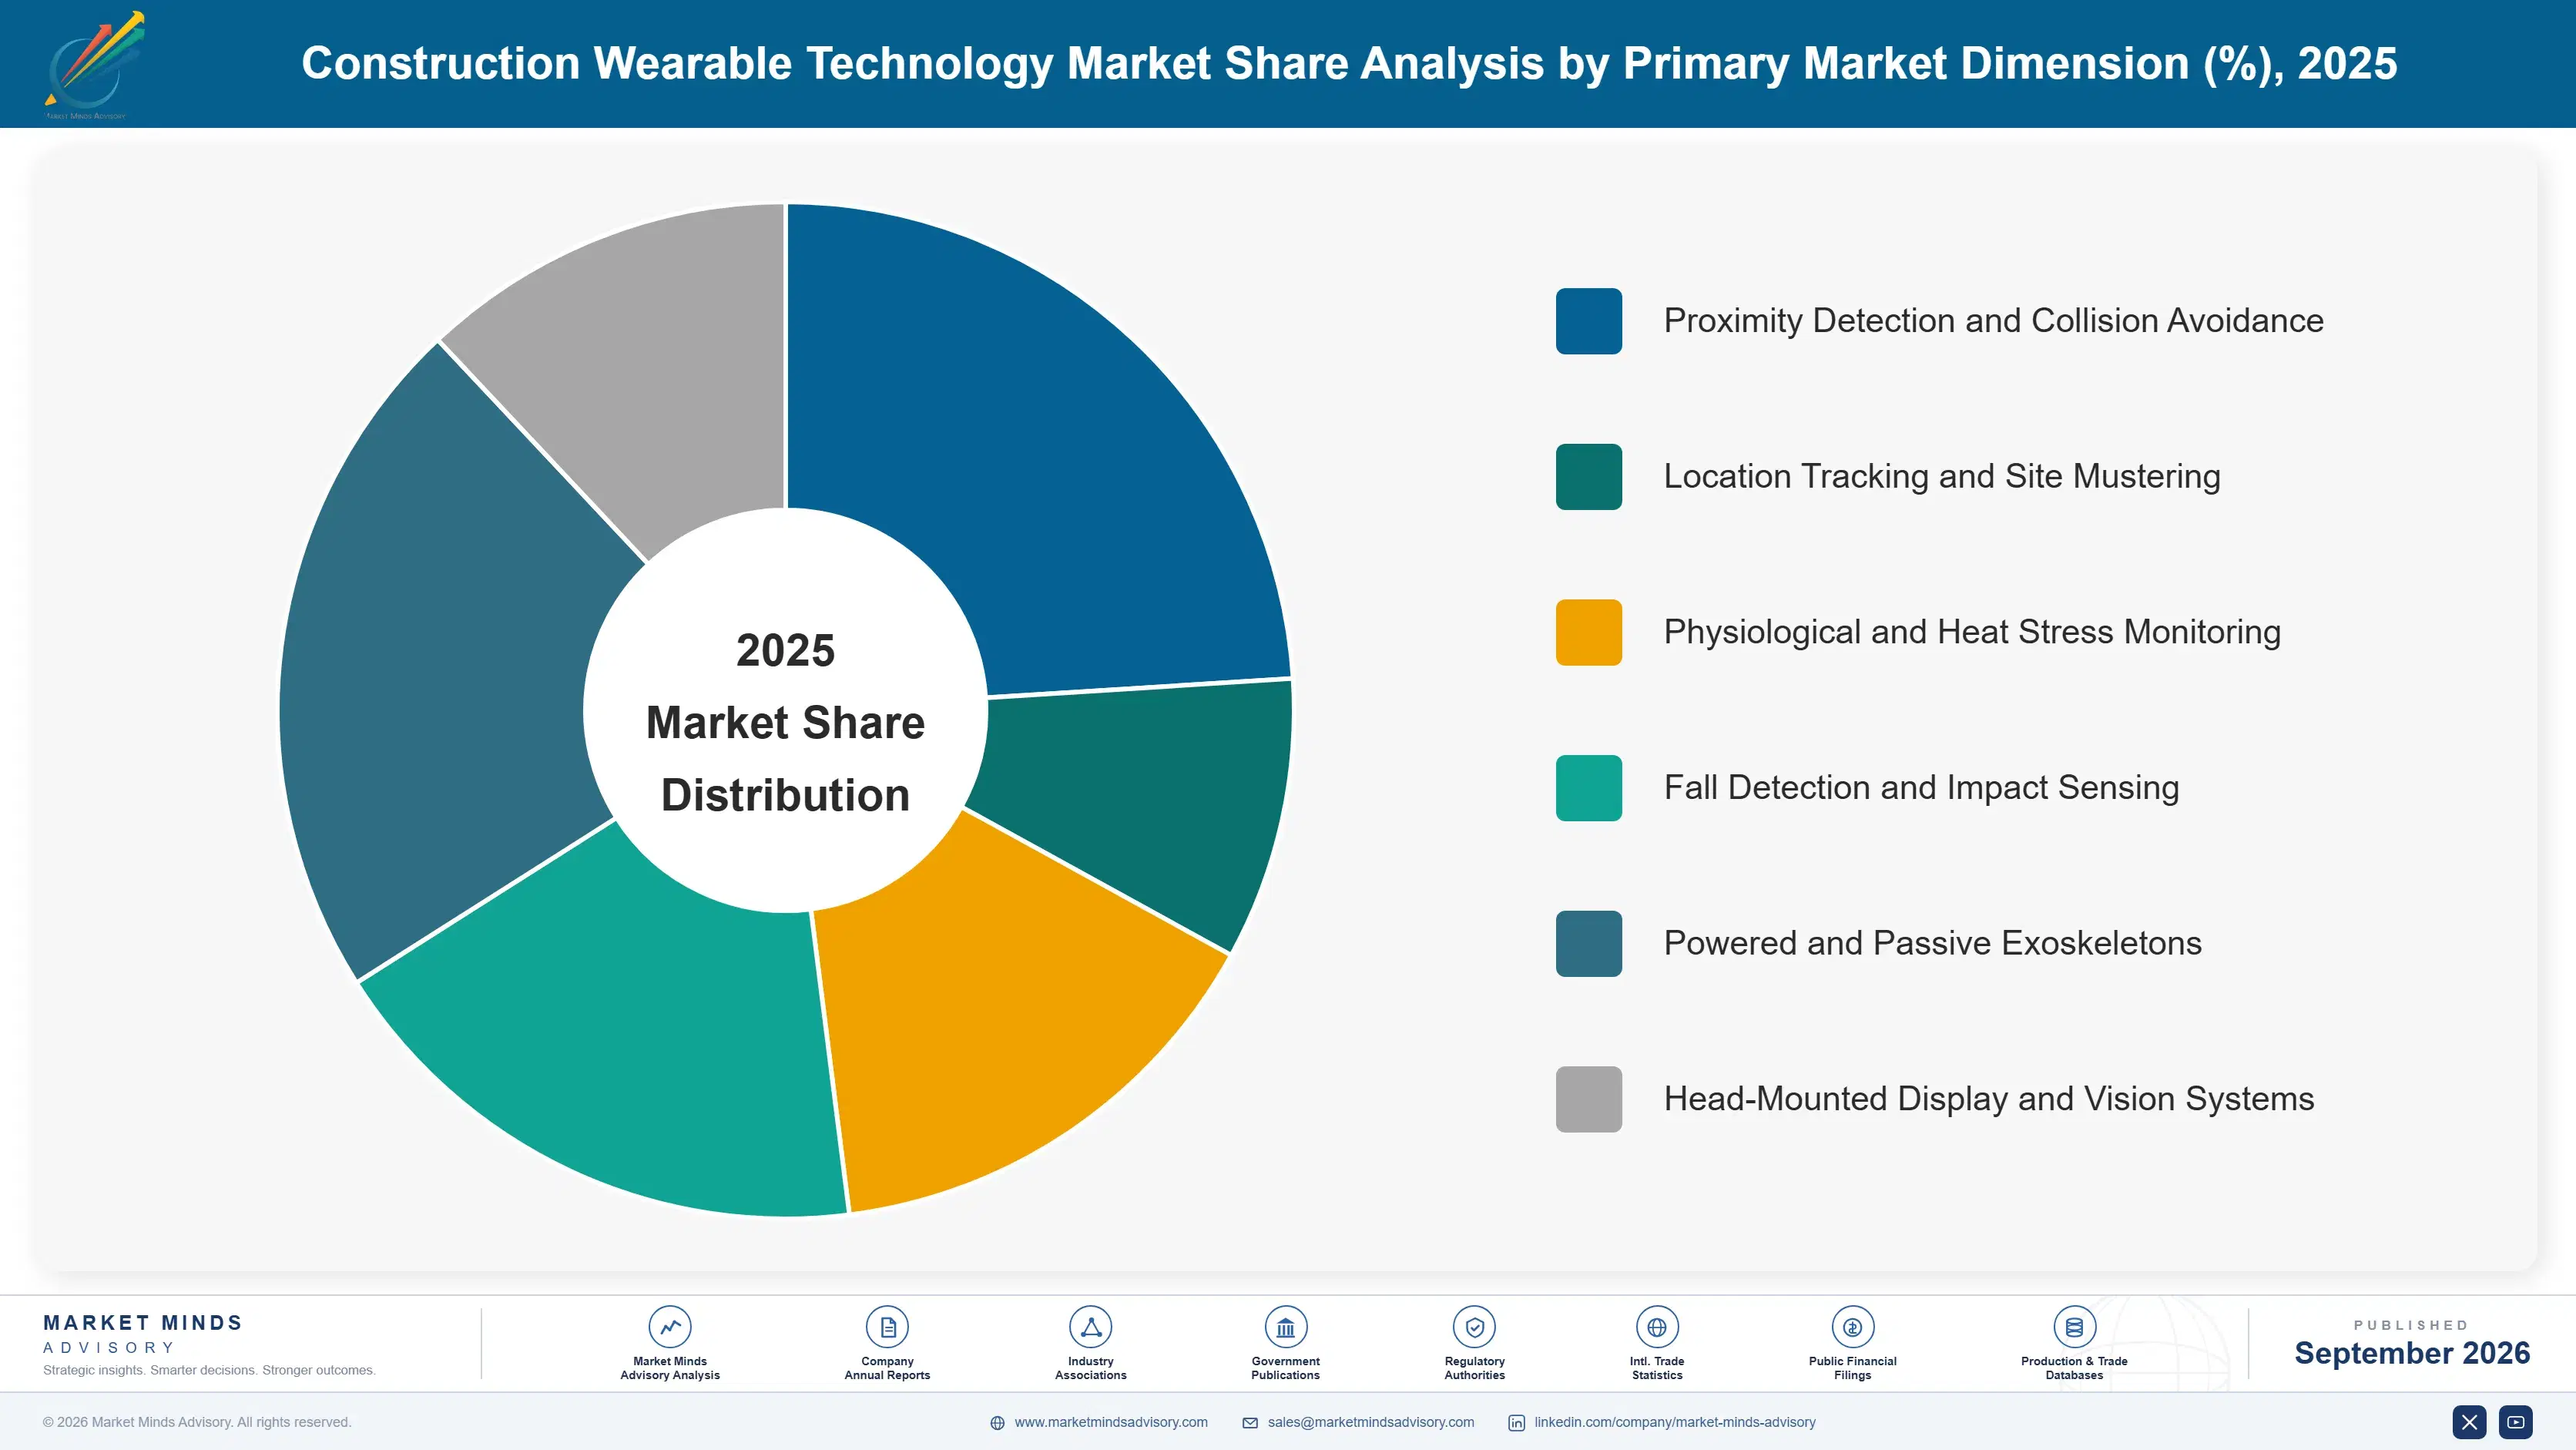
Segmentation follows what the device measures, because that determines whether an incident count moves and therefore whether anybody can justify the spending. Applications with a countable mechanism behind them behave completely differently from those sold on general site awareness, and the gap between the two governs almost all of the growth divergence. Countable mechanisms win budget.
construction-wearable-technology-market-market-share-analysis-1788421679522

Proximity Detection and Collision Avoidance

Proximity detection is the fastest part of this market at 22.8%, half again the market rate of 15.2%, because it is the one application where the incident it prevents can be counted before and after. Worker tags communicate with machine-mounted units to warn operators and workers, and on some equipment to trigger automatic slowdown when a person enters a defined zone. Contact with equipment causes roughly 24% of construction fatalities, which gives insurers and owners a number they can act on. Deployment concentrates on earthmoving, infrastructure and industrial sites where heavy plant and people share ground continuously, and it is far less relevant on vertical building work. Machine-side units are the gate, and worker tags alone achieve nothing at all.
CAGR 22.8%

Physiological and Heat Stress Monitoring

Heat stress monitoring grows at 19.6% on regulation rather than on welfare arguments, since midday working bans and mandatory rest schedules impose a productivity cost that individual monitoring can reduce. Core temperature estimation, heart rate and exertion tracking let a project manage risk worker by worker instead of stopping everyone at a fixed hour, which is worth substantial schedule value on megaprojects. Gulf and South Asian deployments dominate, and Saudi Arabia is the fastest-growing country market at 21.6%. Worker acceptance is considerably higher than for location tracking, because the benefit is personal and immediate rather than administrative and invisible. Schedule value rather than welfare argument funds these programmes on megaprojects.
CAGR 19.6%
Full segment breakdown across 6 segments available in the complete report.

Regional Architecture and Country Demand Map

Regional demand follows liability exposure and climate rather than construction volume. Markets where executives face personal consequences for site deaths, or where heat rules impose a schedule cost, buy heavily; markets with large output and light enforcement buy very little. Output volume predicts almost nothing.

East Asia

East Asia holds 32%, above the regional band, on a liability mechanism sharper than anywhere else: South Korean legislation attaches personal criminal exposure to executives where serious workplace accidents follow inadequate safety management, which has moved construction safety spending from site budgets to board decisions. Korean contractors deploy proximity and location systems across major projects as a documented control. Japanese demand is different again, concentrated in exoskeletons and physiological monitoring as a response to an ageing tradesperson population that recruitment has not replaced. Chinese infrastructure programmes add scale, though procurement there sits inside larger contractor systems and favours domestic suppliers heavily. Regional growth at 16.4% runs ahead of the market on liability rules rather than on construction volume.
Share: 32% | CAGR: 16.4% (2026 to 2036)

North America

American and Canadian demand rests on insurance structure more than on regulation. Owner-controlled and wrap-up insurance arrangements place a single policy across all contractors on large projects, which lets the party carrying the loss mandate wearable deployment as a condition of site access and resolves the split incentive that stalls adoption elsewhere. Heavy civil, energy and industrial projects are the deepest users, particularly for proximity detection around plant. Federal heat rulemaking has raised interest in physiological monitoring across southern states. Commercial building work adopts far less, since equipment exposure is lower and margins are thinner. Regional growth at 14.4% therefore tracks the spread of wrap-up insurance structures more closely than it tracks construction activity itself.
Share: 27% | CAGR: 14.4% (2026 to 2036)
Regional intelligence for 5 additional markets available in the complete report: Western Europe, South Asia and Pacific, Middle East and Africa, Latin America, Eastern Europe. Contact sales@marketmindsadvisory.com.
construction-wearable-technology-market-country-cagr-analysis-1788421680080

Where This Technology Actually Sells

A device costing USD 340 per worker cannot be sold to a subcontractor earning a few percent margin who captures none of the benefit. The positions that work involve selling to whoever carries the loss, pricing per project rather than per employer, and concentrating on the two applications with a countable incident behind them.

Sell to the Party Carrying the Insurance Loss

The split incentive dissolves entirely when the buyer, the rule-setter and the loss-carrier are the same organisation, which is exactly what owner-controlled insurance arrangements create. Suppliers selling into those programmes reach deployment on 3 times the proportion of pilots compared with contractor-led sales, because compliance is a condition of site access rather than a request. Reaching that buyer means engaging risk managers and brokers rather than site safety teams. Most suppliers in this market have never had that conversation and do not know how to start it. Brokers open doors that safety managers cannot.
Market Impact: Reaches deployment on 3 times as many pilots

Price Per Project Not Per Employer

Per-employee pricing asks a subcontractor to fund a benefit that lands somewhere else, which is why 41% of pilots die at the point of scaling beyond the general contractor's own crews. Project-based pricing paid centrally removes the objection completely and lets the buyer cover every worker on site rather than only their own. Deployments priced this way cover roughly 2 times the workforce of equivalent per-employee contracts. It requires suppliers to sell fewer, larger contracts, which changes the sales organisation more than the pricing sheet. Fewer and larger contracts change the sales organisation.
Market Impact: Covers 2 times the entire site workforce properly

Concentrate on Countable Incident Mechanisms Only

Proximity detection addresses roughly 24% of construction fatalities through a mechanism specific enough to measure, and heat monitoring converts a schedule rule into managed risk. Both produce numbers an insurer or owner can act on. Everything else in this category is sold on general site awareness and competes with every other cost on a project running at low single-digit margins. Suppliers concentrating on the two measurable applications win at roughly twice the rate of those selling a comprehensive site platform, and the sales cycle is considerably shorter. Sales cycles shorten considerably as well.
Market Impact: Addresses 24% of all fatalities on construction sites

Design the Consent Problem Out of the Product

Continuous individual location tracking has been restricted by labour agreements in at least 5 markets, and each restriction removes capability the supplier built the proposition around. Zone-level presence, on-device processing and worker-visible data policies preserve the safety function while removing the objection, and deployments designed that way reach agreement roughly 4 months faster. Suppliers treating this as a communications problem rather than an engineering one keep encountering the same resistance. The technical answer exists and very few products have implemented it properly. Engineering solves this and messaging does not. Resistance repeats otherwise.
Market Impact: Reaches worker agreement roughly 4 months sooner overall

Who Controls the Margin Pool

Concentration is low at roughly 28% across the top five on measured device and platform revenue, and the field mixes two quite different kinds of company. Established safety equipment makers reach buyers through protective equipment distribution already in place, while venture-funded specialists hold better technology and no route to market. The gap between them is one of distribution and balance sheet rather than product, and several specialists were acquired because that gap proved uncrossable.
Competition runs on three dimensions. Access to the buyer who carries the loss is first and increasingly decisive, since that is where deployments actually scale. Second is worker acceptance design, covering what data is collected and how visibly, which decides whether a labour agreement is reachable. Third is integration with site access control and machine-mounted equipment, since a tag is useless without something to interact with.

Two pressures are reshaping the field. Equipment manufacturers are building proximity capability into machines directly, which reaches the site through a channel no wearable supplier controls. Insurers and brokers are also becoming specifiers rather than observers, favouring suppliers who produce loss data over those demonstrating features. Rankings will move toward suppliers with risk manager relationships and machine integration.
construction-wearable-technology-market-company-positioning-matrix-1788421680609

Competitive Moat and Risk Dimensions

HONEYWELL

Moat: Safety equipment distribution reach

Honeywell reaches construction safety buyers through protective equipment distribution and existing supply agreements that specialists cannot replicate at any reasonable cost. Its connected worker platform spans industrial and construction applications, spreading development cost across markets with different cycles. Relationships with large contractors and industrial owners shorten procurement, and its balance sheet supports long deployment cycles.
HONEYWELL

Risk: Broad platform, shallow specialism

The company's connected worker capability spans many industries, which brings breadth but leaves it behind specialists on the two construction applications where incidents are actually countable. Proximity detection in particular requires machine-side integration that dedicated suppliers have pursued further. Buyers evaluating on demonstrated incident reduction rather than on portfolio coverage frequently shortlist smaller competitors with deeper construction-specific deployment histories.
BLACKLINE SAFETY

Moat: Connected device and service model

Blackline sells connected safety devices as a service with monitoring, connectivity and support included, which suits construction buyers who want an outcome rather than hardware to manage. Its cellular-connected architecture avoids the site gateway infrastructure that complicates deployment on dispersed or moving worksites. Recurring service revenue and a monitored response capability differentiate it from suppliers selling devices and a dashboard.
BLACKLINE SAFETY

Risk: Limited proximity detection depth

The company's strength lies in gas detection, lone worker and connected safety rather than in proximity avoidance around heavy plant, which is the fastest growing construction application and the one insurers can measure. Building that capability requires machine-side integration and equipment manufacturer relationships it does not currently hold. Construction exposure is also smaller than its industrial base, limiting reference depth.

Players Tracked

Prominent Players

Honeywell
MSA Safety
Blackline Safety
3M
Hilti

Other Key Players

Triax Technologies
Kenzen
SlateSafety
Guardhat
German Bionic
Ekso Bionics
Levitate Technologies
Ottobock
RealWear
Vuzix
Trimble
Topcon Positioning Systems
WakeCap
Corvex Connected Safety
Kinetic

Recent Developments

MARCH 2025

Gulf megaproject owners mandate wearable heat monitoring across contractor chains

Project owners on several giga-project packages made physiological monitoring a condition of site access for all contractors and subcontractors, funded centrally rather than by individual employers. The requirement replaced blanket midday stoppages with individually managed rest scheduling across the workforce. Contractors were given no opt-out on any package.
Signal: Owner mandates dissolve the split incentive that stalls every contractor-led deployment, and they scale almost immediately.
AUGUST 2025

Heavy equipment makers extend machine-integrated proximity detection ranges

Several earthmoving equipment manufacturers expanded factory-fitted proximity detection across additional machine classes, developed internally rather than acquired. The systems interact with worker-worn tags from multiple suppliers, though integration depth varies considerably between machine brands and tag providers. Retrofit kits were offered for older machines already in service across contractor fleets.
Signal: Machine-side integration is becoming the gate on proximity deployments, and wearable suppliers do not control that channel.
NOVEMBER 2025

European works council agreements restrict continuous site location tracking

Labour agreements at several large European contractors limited individual positional tracking to zone-level presence with defined retention periods, following disputes about disciplinary use of movement data. The restrictions applied to existing deployments as well as to future procurement decisions. Existing deployments were reconfigured rather than removed.
Signal: Consent design is now a product requirement in Europe rather than a deployment conversation held afterwards.

What a Site Deployment Costs

Cost divides between the worn device and the site infrastructure behind it. Device hardware runs between 34% and 47% of cost of goods, the range reflecting whether the unit carries cellular connectivity or depends on site gateways. Batteries and charging equipment add roughly 12%, gateway and machine-mounted units 18%, and deployment, training and support the balance. Support labour is the line suppliers most consistently underestimate when pricing a first project.
Battery and connectivity costs have moved most. Lithium cell pricing followed the wider market through 2024 and 2025, and IEA critical minerals and battery reporting documents the movement across that period. Site connectivity is the harder problem, since construction sites change shape weekly and gateway infrastructure has to be moved with them. MSA Safety and Blackline Safety both referenced component and deployment cost conditions in recent annual reporting.

Exposure varies by architecture rather than by scale. Suppliers using cellular-connected devices carry recurring connectivity cost and avoid gateway logistics entirely. Those relying on gateways carry lower device cost and far higher deployment labour on reconfiguring sites. Suppliers selling hardware outright pass component movement on; service suppliers absorb it. Small specialists finance deployed hardware without a balance sheet for long project cycles.
construction-wearable-technology-market-cost-volatility-analysis-1788421680804

Choose cellular connectivity on reconfiguring sites

Gateway infrastructure has to be repositioned as a site changes shape, and that labour compounds quietly across a multi-year project until it exceeds the hardware saving. Cellular-connected devices remove it entirely at higher recurring cost. The calculation turns on reconfiguration frequency, which suppliers should establish during scoping rather than after the margin is committed.

Price devices as a service across project duration

Selling hardware outright on a project lasting several years exposes the customer to obsolescence and the supplier to a single transaction, neither of which suits the work. Service pricing across project duration spreads cost, retains the relationship and allows hardware refresh without renegotiation. It requires financing deployed devices, which is why smaller specialists lose the largest projects.

Standardise deployment and training into a repeatable programme

Deployment and worker training is the largest labour line and the most variable, since each project reinvents onboarding, charging routines and issue procedures from nothing. A standardised programme with prepared materials and defined roles cuts that effort by around 45% and lifts utilisation. Utilisation matters more than cost, since an unworn device achieves nothing.

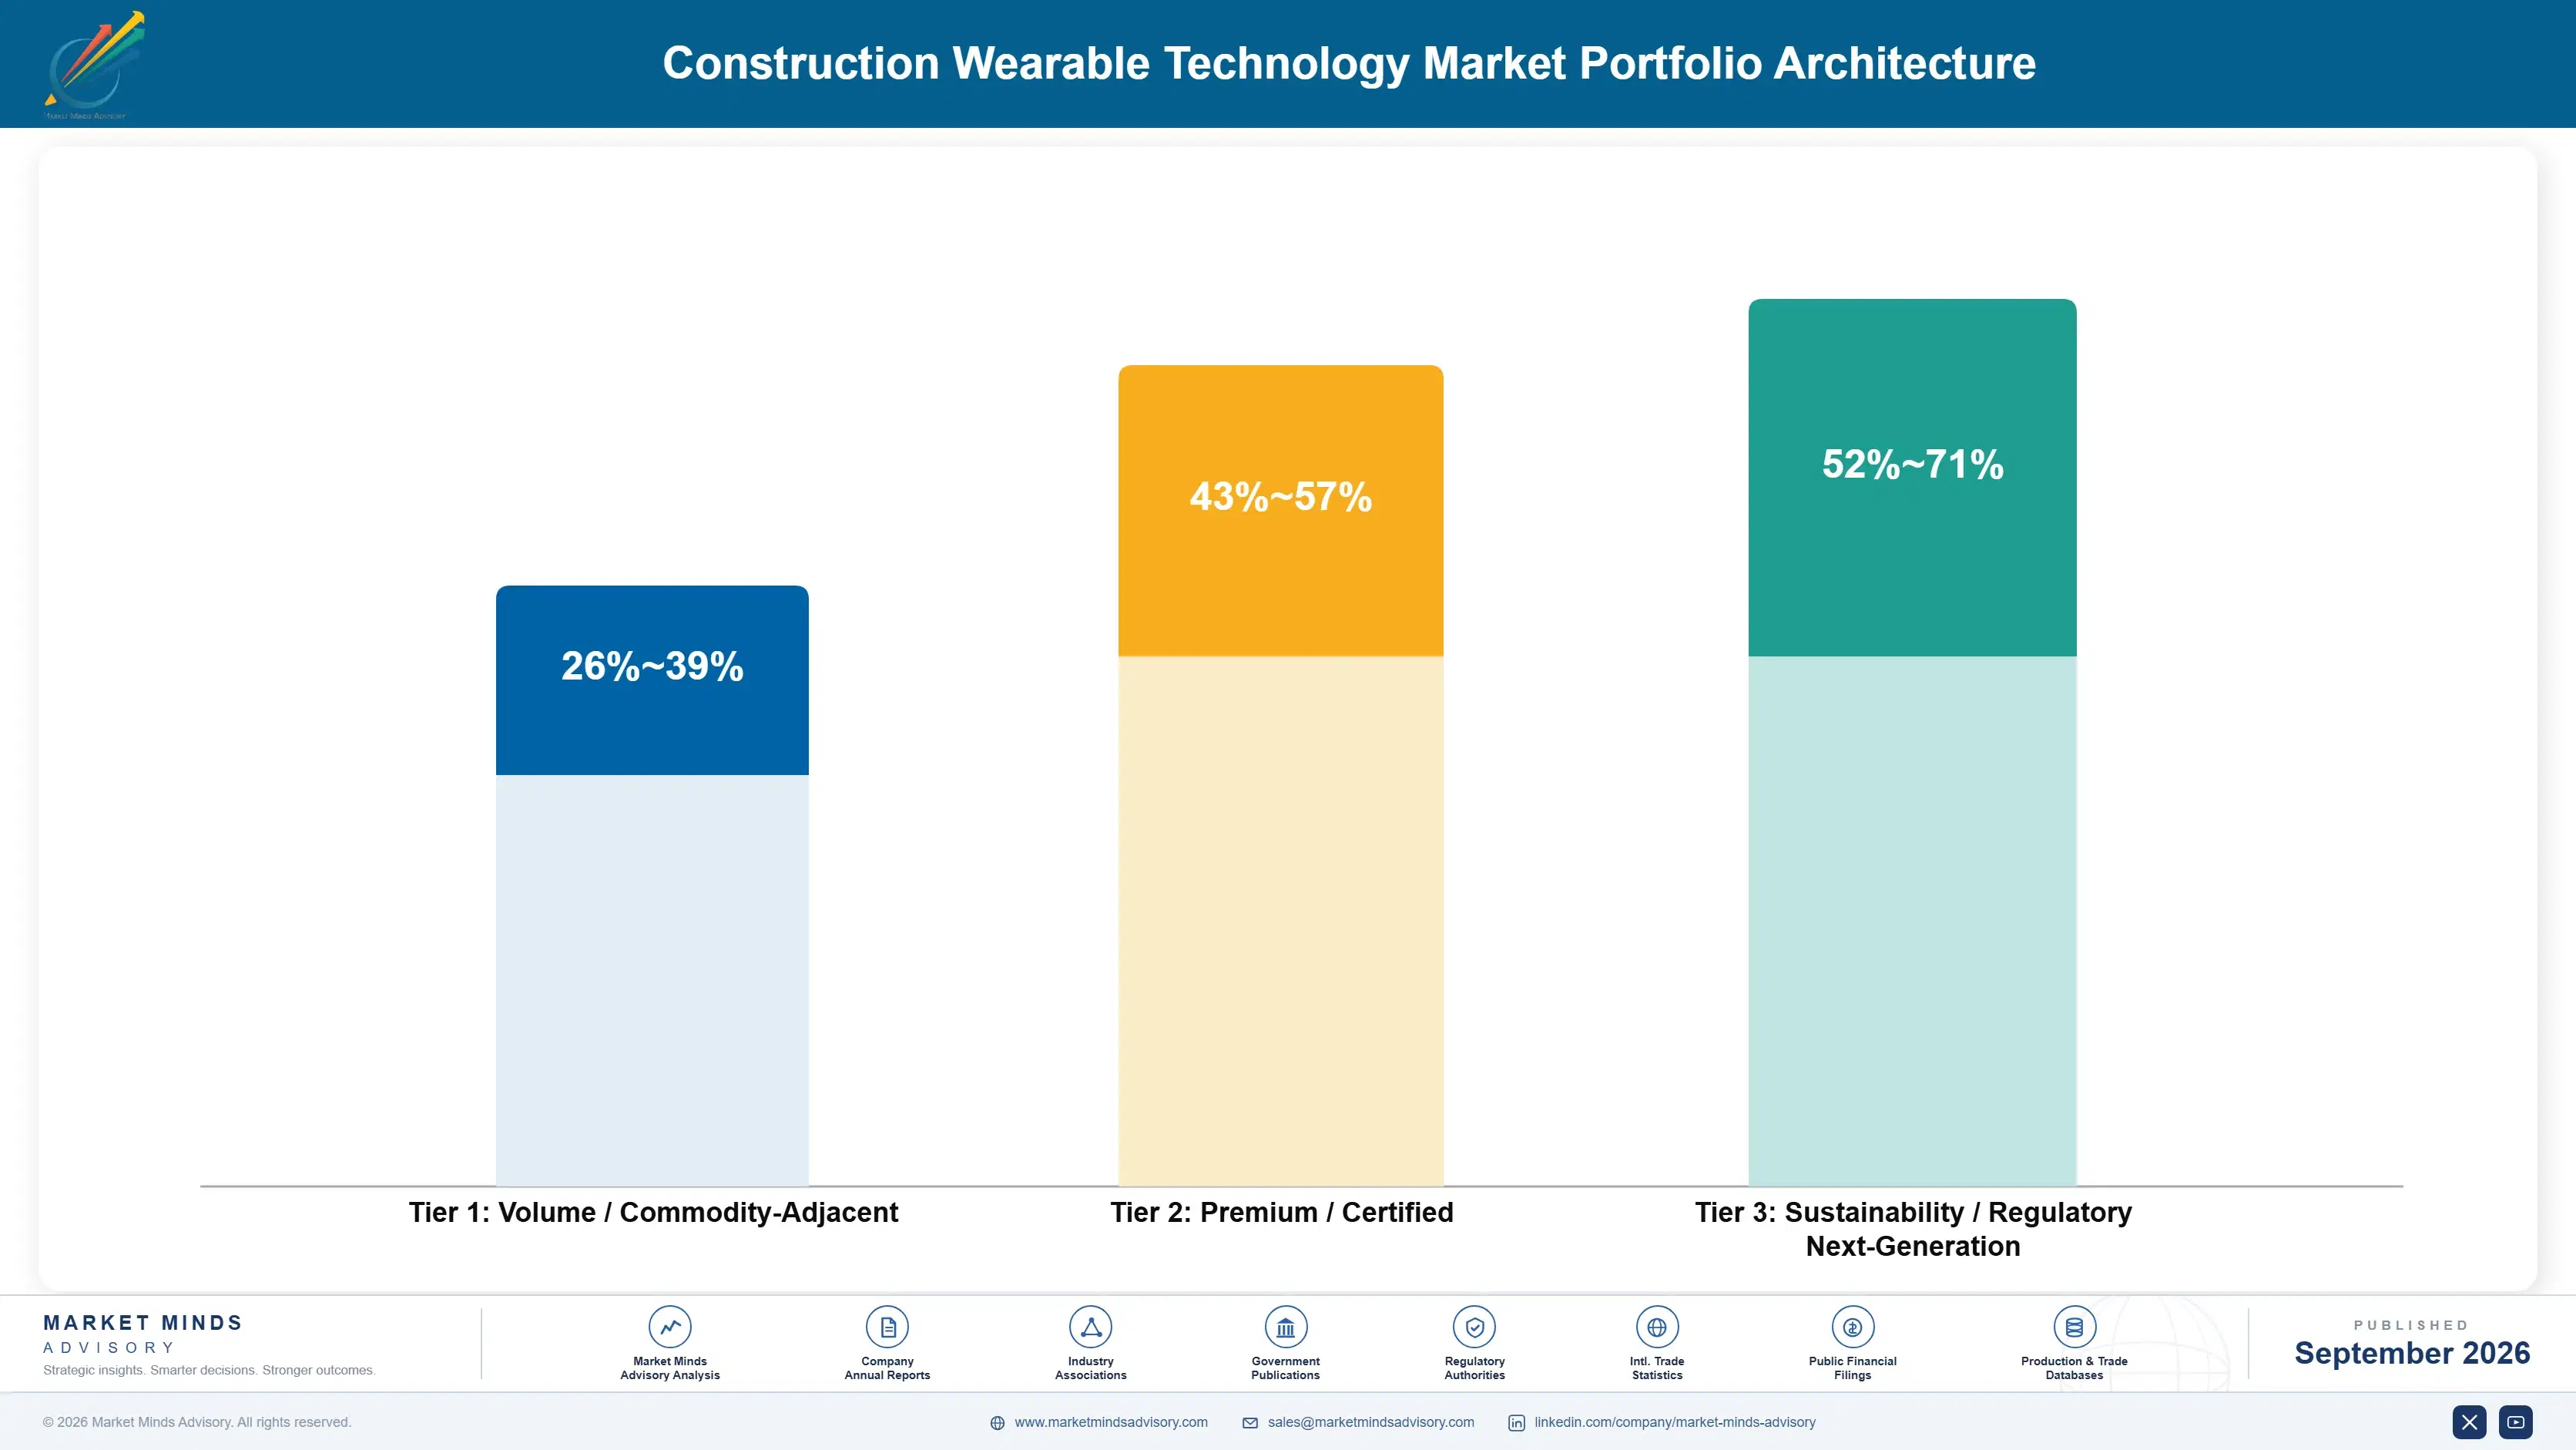
Portfolio Architecture for Margin Defence

Margin architecture separates on whether the supplier sells devices or an ongoing monitored service. Hardware sold outright earns modest electronics margins under pressure from imported alternatives and from equipment makers building capability into machines. Devices supplied as a service with monitoring, connectivity and support earn considerably more and renew across project duration, because the buyer is purchasing a managed safety outcome rather than equipment to look after.
The volume tension is between covering whole sites and covering the contractor's own crews. Site-wide deployment is where the safety outcome actually exists, since the 76% of workers employed by subcontractors are exposed to the same hazards. It is also where pricing and contracting are hardest. Contractor-only deployment is easy to sell and fund, and produces a partial result insurers discount heavily. Insurers discount partial coverage almost entirely.

High-value revenue concentrates in proximity detection with machine integration and in physiological monitoring on heat-constrained projects. Both share the property that the buyer can point to a number, whether an incident count or a schedule saving. Location tracking and general site awareness generate most shipments and face the strongest worker resistance alongside the weakest justification. That imbalance is unlikely to change.

Volume / Commodity-Adjacent

Location tags, mustering devices and basic site presence hardware sold outright. The wide range separates suppliers manufacturing at scale from those assembling contract-built units. Worker resistance and weak justification make this the most vulnerable tier when a project reviews costs.
Gross Margin: 26-39%

Premium / Certified

Connected devices supplied as a service with monitoring, connectivity and support across project duration. Margin holds because the buyer is purchasing a managed outcome and switching mid-project is disruptive. Recurring revenue and refresh rights come with the contract structure.
Gross Margin: 43-57%

Sustainability / Regulatory / Next-Generation

Proximity systems with machine integration and physiological monitoring on heat-constrained projects, sold against measurable incident and schedule outcomes. The widest range in the portfolio, reflecting integration depth and monitoring content. Highest margin and the least price-sensitive buyers in the market.
Gross Margin: 52-71%
construction-wearable-technology-market-portfolio-architecture-1788421681366

High-value Sub-segments and Strategic Watch-out

Machine-Integrated Proximity Systems

High value and high growth together, addressing roughly a quarter of construction fatalities through a mechanism insurers can measure before and after. The margin range reflects machine-side integration depth, which varies by equipment brand. Owner and insurer buyers evaluate incident data rather than specifications, which removes price pressure.
Gross Margin: 58-71%

Heat Stress Monitoring Programmes

High value with strong growth, sold as a schedule tool that replaces blanket working bans with individually managed rest. The range reflects monitoring service content and climate severity. Worker acceptance is far higher than for location tracking, since the benefit is personal and immediate rather than administrative.
Gross Margin: 50-64%

Site Location and Mustering Tags

The volume core of device shipments and the weakest part commercially, facing worker resistance, labour agreement restrictions and the hardest justification when project costs are reviewed. It provides the site presence that other capability is sold alongside. Suppliers need the volume and struggle to defend the price.
Gross Margin: 25-38%

Equipment Maker Integrated Detection

The strategic watch-out, carried at zero because it displaces wearable supplier revenue rather than generating any. Machine manufacturers are building proximity capability in at the factory and reaching sites through a channel wearable suppliers do not control. Treating them as integration partners misreads where specification power is moving.
Gross Margin: 0-0%

How This Revenue Repeats

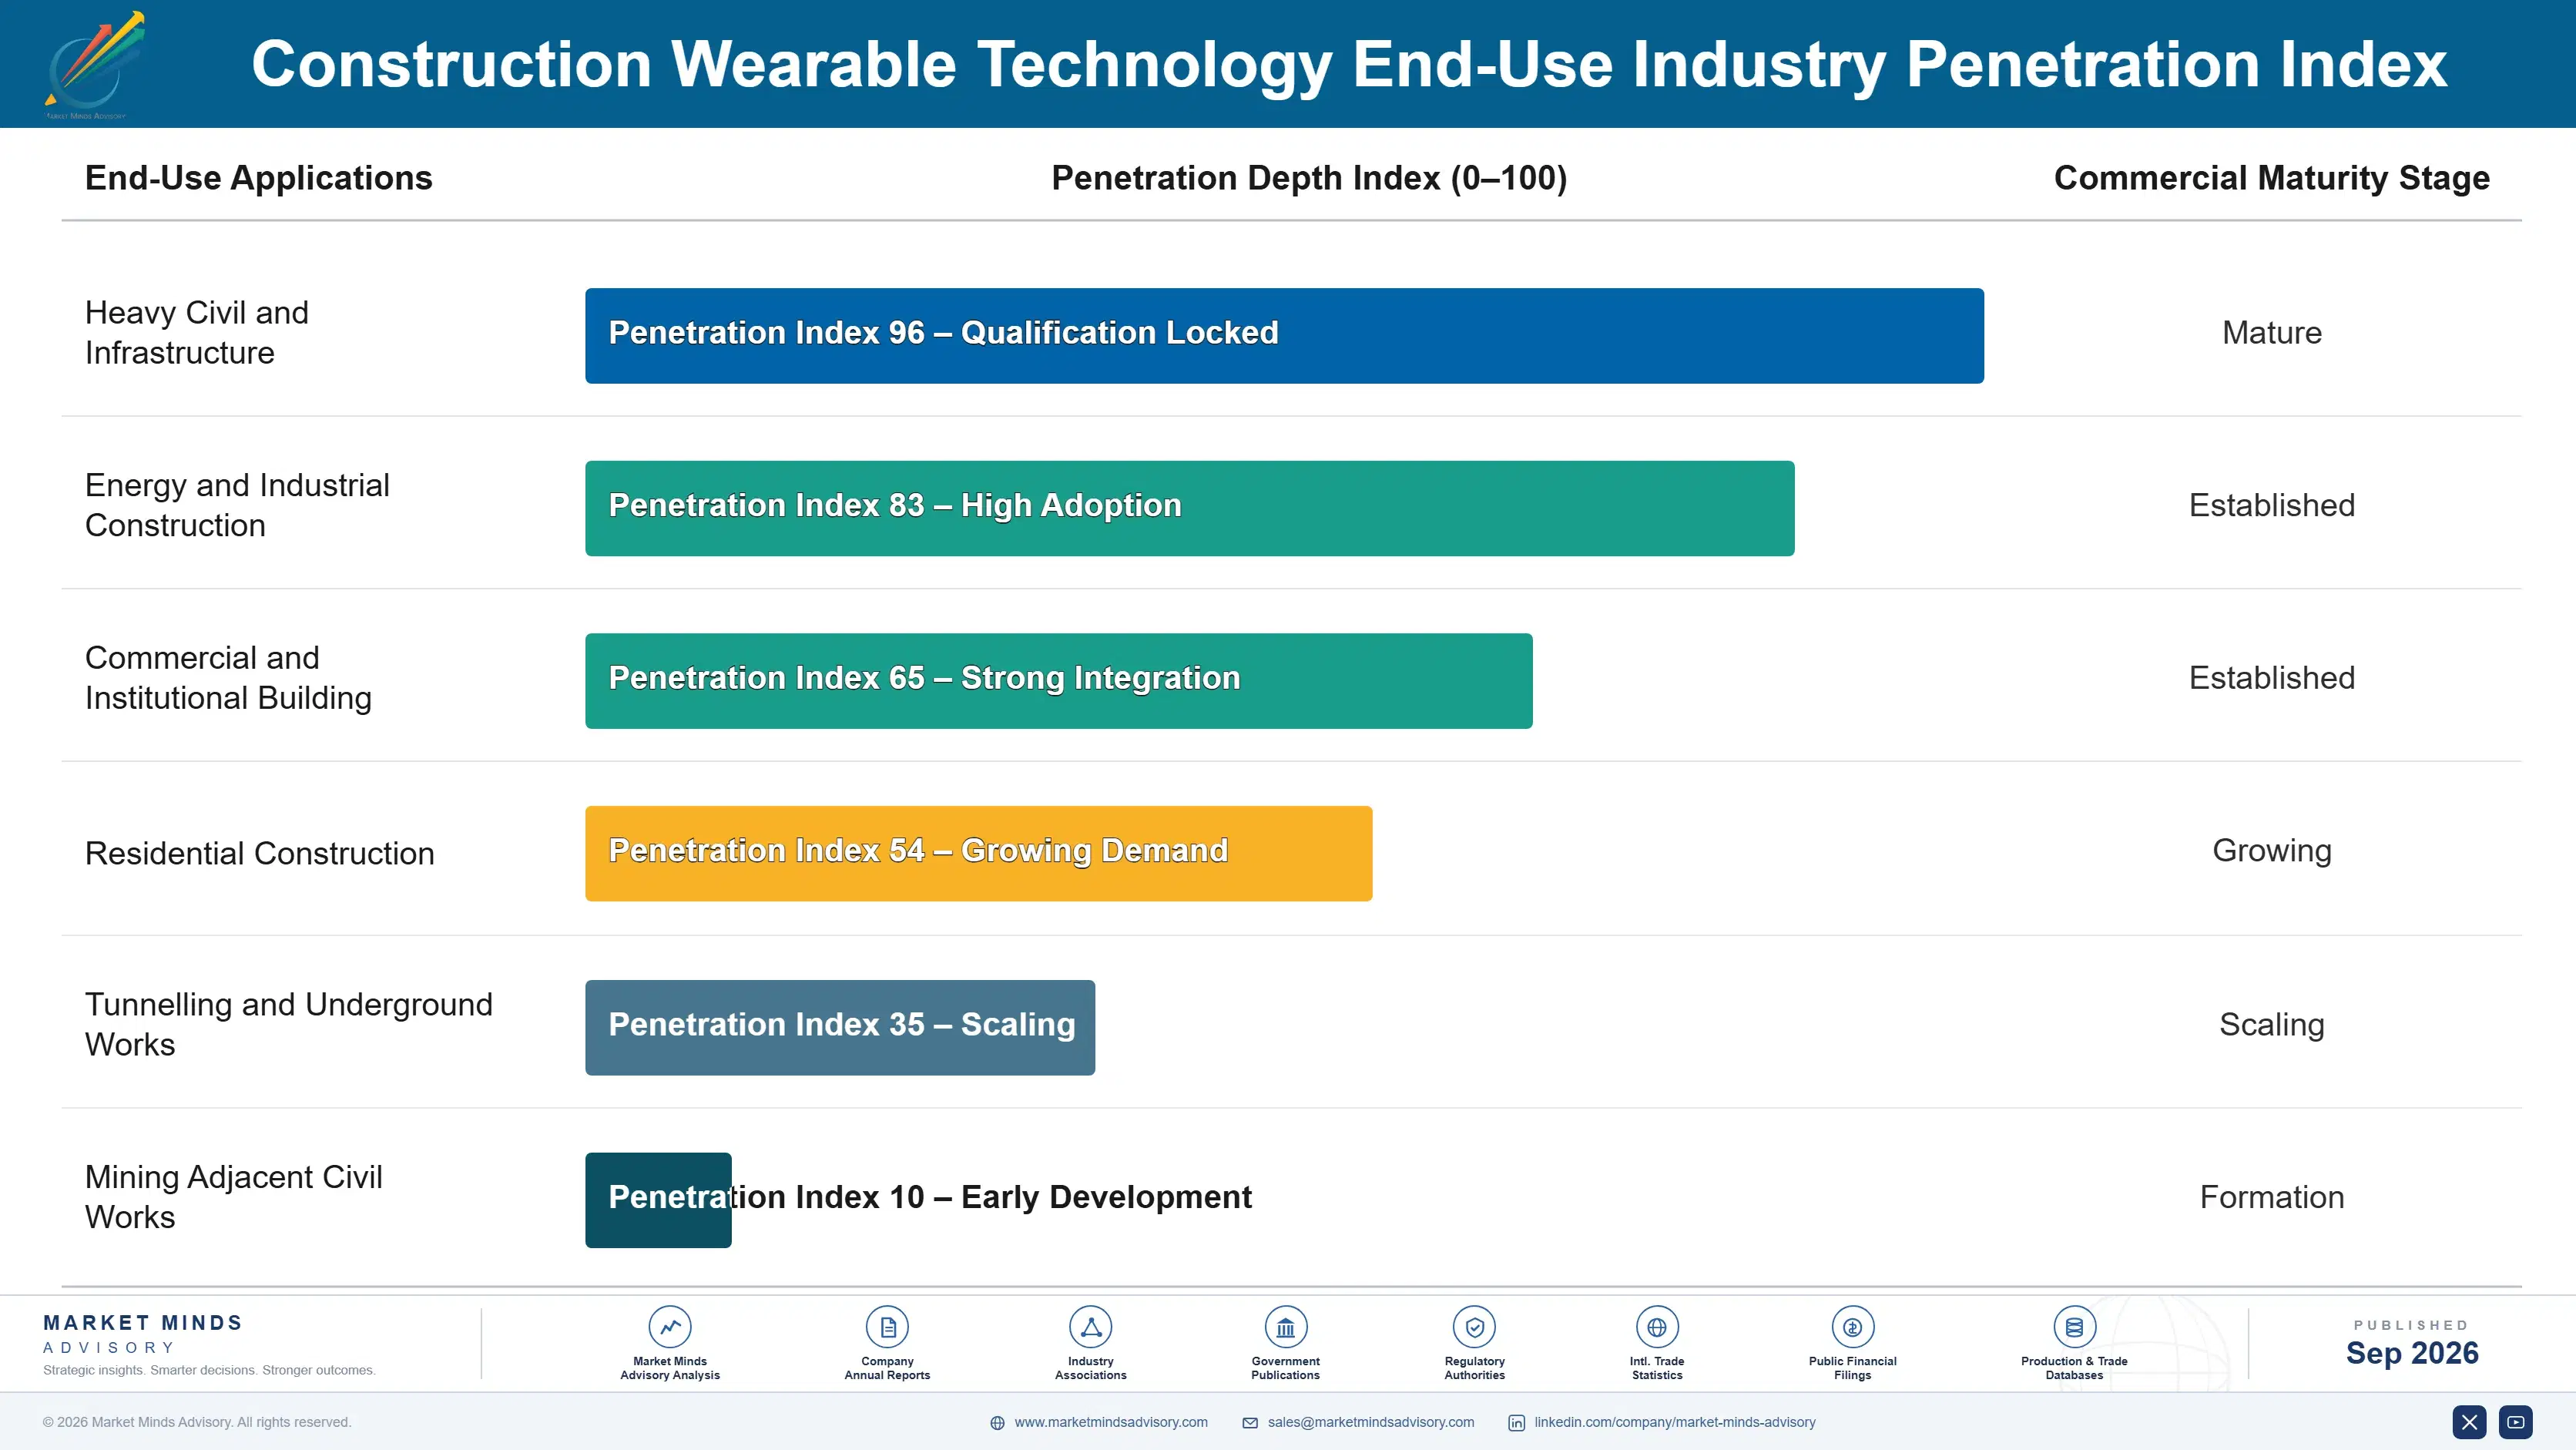
Revenue repeats by project rather than by customer, which makes it less predictable than supplier subscription language suggests. A deployment lasts as long as the project, typically two to four years, and then ends regardless of results. Whether the same contractor deploys again depends on who leads the next project and whether the owner mandates anything. Suppliers with owner and insurer relationships carry position between projects; contractor relationships start again each time.
Adoption depth varies sharply by project type. Heavy civil, energy and industrial sites use proximity detection continuously, since plant and people share ground all day. Gulf megaprojects run physiological monitoring as an operating system for the working schedule. Vertical commercial building adopts thinly, with lower equipment exposure and no spare margin. Tunnelling uses location and mustering intensively, since evacuation accounting is a genuine requirement.

The buyer has moved from site safety management toward risk and insurance. A site safety manager evaluated devices on features and comfort with a small budget. Today the specification comes from a project owner, risk manager or broker who carries the loss and can impose requirements across every contractor. Suppliers presenting to site safety teams address somebody who cannot fund site-wide deployment.
construction-wearable-technology-market-end-use-penetration-index-1788421681968

What Makes These Deployments Work

These are among the four positions where our research anticipates prominent divergence between winners and laggards over the coming forecast period. Each is grounded in the demand model, the regulatory perimeter, and the announced capacity pipeline.
01 / LOSS CARRIER ACCESS

Sell to whoever pays when the incident happens

The split incentive that stalls this market dissolves only when the buyer, the rule-setter and the loss-carrier are the same organisation, which is precisely what owner-controlled and wrap-up insurance arrangements create. Suppliers selling into those programmes reach deployment on roughly 3 times the proportion of pilots that contractor-led sales manage to convert. Reaching that buyer means engaging risk managers and brokers rather than site safety teams, and most suppliers in this market have simply never had that conversation at all.
02 / PROJECT LEVEL PRICING

Charge per site, never per individual employer

Around 76% of site workers are employed by subcontractors running on a few percent margin who capture no recoverable benefit from a device costing USD 340 a year. Per-employer pricing therefore kills scaling at precisely the point where site safety coverage would begin to matter, which is why 41% of pilots are abandoned. Project-based pricing paid centrally covers roughly 2 times the workforce of equivalent per-employee contracts and it removes the objection entirely rather than merely arguing against it each time.
03 / COUNTABLE MECHANISM FOCUS

Sell only what changes a number somebody watches

Proximity detection addresses roughly 24% of construction fatalities through a mechanism specific enough to measure before and after, while heat monitoring converts a blanket schedule rule into individually managed working time. Both of them produce figures that an insurer or a project owner can act on directly. Suppliers concentrating on those two applications win at roughly twice the rate of those selling comprehensive site platforms, because everything else in this category competes against every other cost on a low-margin project.
04 / CONSENT BY DESIGN

Engineer the tracking objection out, do not argue it

Labour agreements in at least 5 separate markets now restrict continuous individual location tracking, and every one of those restrictions removes capability that suppliers had built their whole proposition around. Zone-level presence, on-device processing and worker-visible data policies preserve the underlying safety function while removing the objection altogether, and deployments designed that way reach agreement roughly 4 months faster. Suppliers treating this as a communications problem rather than an engineering requirement keep meeting exactly the same resistance again and again.

Engagement Snapshot From the Field

A live engagement with an industry participant carrying material or product regulatory and market exposure ahead of a defining policy shift, showing how our research translates into a defensible multi-year portfolio strategy.
MARKET MINDS ADVISORY · CLIENT ENGAGEMENT SUMMARY
Construction Wearable Technology Producer Strategic Portfolio Review and Transition Roadmap 2026·Investment Scenario on Construction Wearable Technology Exposure Evaluation 2025-26
CLIENT PROFILE
A public infrastructure owner delivering a rail programme worth roughly USD 8.4 billion across four contract packages (client-reported, unverified by MMA), with about 6,100 workers on site at peak and 91 subcontractors engaged across the tier structure. The owner carried project insurance through a wrap-up arrangement covering every contractor and subcontractor engaged on the programme.
STRATEGIC CHALLENGE
Two struck-by incidents in eighteen months had triggered regulatory attention and a premium review (client-reported, unverified by MMA). One main contractor had deployed wearables to its own crews only, covering roughly 22% of the site population, while the other three packages had declined on cost grounds. Nobody could establish whether the partial deployment had changed anything measurable.
MMA APPROACH
MMA analysed incident and near-miss data by exposure type rather than by contractor, which the programme had never separated, to establish which mechanisms the technology could actually address. We interviewed 19 site personnel, seven subcontractors, four suppliers and the programme's insurance broker. Supplier evaluation weighted machine-side integration and worker acceptance design ahead of platform features or dashboard capability.
KEY FINDINGS
  1. Both struck-by incidents involved workers outside the deploying contractor's own crews, meaning the partial deployment had covered the wrong 22% of the site population entirely.
  2. Machine-mounted units existed on only 34% of heavy plant on site, so worker tags had nothing to interact with across most of the equipment fleet.
  3. Subcontractors uniformly refused to fund devices, and every one of them said they would comply without objection if the requirement came through site access rules.
  4. The broker confirmed that measurable site-wide deployment would support a premium review, but that partial coverage carried no weight whatsoever in that assessment.
CLIENT PROFILE
A public infrastructure owner delivering a rail programme worth roughly USD 8.4 billion across four contract packages (client-reported, unverified by MMA), with about 6,100 workers on site at peak and 91 subcontractors engaged across the tier structure. The owner carried project insurance through a wrap-up arrangement covering every contractor and subcontractor engaged on the programme.
STRATEGIC CHALLENGE
Two struck-by incidents in eighteen months had triggered regulatory attention and a premium review (client-reported, unverified by MMA). One main contractor had deployed wearables to its own crews only, covering roughly 22% of the site population, while the other three packages had declined on cost grounds. Nobody could establish whether the partial deployment had changed anything measurable.
MMA APPROACH
MMA analysed incident and near-miss data by exposure type rather than by contractor, which the programme had never separated, to establish which mechanisms the technology could actually address. We interviewed 19 site personnel, seven subcontractors, four suppliers and the programme's insurance broker. Supplier evaluation weighted machine-side integration and worker acceptance design ahead of platform features or dashboard capability.
KEY FINDINGS
  1. Both struck-by incidents involved workers outside the deploying contractor's own crews, meaning the partial deployment had covered the wrong 22% of the site population entirely.
  2. Machine-mounted units existed on only 34% of heavy plant on site, so worker tags had nothing to interact with across most of the equipment fleet.
  3. Subcontractors uniformly refused to fund devices, and every one of them said they would comply without objection if the requirement came through site access rules.
  4. The broker confirmed that measurable site-wide deployment would support a premium review, but that partial coverage carried no weight whatsoever in that assessment.
RECOMMENDED STRATEGY
Phase 1: Mandate wearable deployment through site access conditions across all four packages, funding it centrally from the programme rather than from any contractor budget. Phase 2: Fit machine-mounted proximity units across the entire heavy plant fleet before expanding worker tags, since tags without machine units achieve nothing. Phase 3: Agree data use and retention terms with worker representatives before deployment, restricting positional data to zone-level presence with defined retention.
OUTCOME
Site-wide coverage reached 94% of the workforce within seven months and recorded proximity events fell by roughly 61% over the following two quarters (client-reported, unverified by MMA). The programme secured a premium reduction at the following review, which more than covered the annual technology cost.

Frequently Asked Questions

Foundational context covering the market sizes, CAGR, scope, country, region and competition that inform every finding below. This section is provided to cover basics and most often pre-purchase conversations, answered from the MMA Primary Research Dataset.

What is the current size of the Construction Wearable Technology Market?

The market was worth USD 0.9 billion in 2025 and reaches USD 1.04 billion in 2026. Proximity detection and heat stress monitoring account for most of the growth.

How large will the Construction Wearable Technology Market be by 2036?

MMA forecasts USD 4.28 billion by 2036, an expansion of 4.12 times over the forecast period. That represents USD 3.24 billion of incremental annual revenue against 2026.

What is the CAGR for the Construction Wearable Technology Market 2026 to 2036?

The base case is 15.2% compound annual growth, with a bull case at 16.4% and a bear case at 14.0%. Whether insurers price deployment into premiums separates the scenarios.

Which segment is growing fastest?

Proximity detection and collision avoidance grows at 22.8%, half again the market rate of 15.2%. Contact with equipment causes roughly 24% of construction fatalities, which gives insurers a countable mechanism.

Who are the major companies in the Construction Wearable Technology Market?

Honeywell, MSA Safety, Blackline Safety, 3M and Hilti lead on measured device and platform revenue. Together they hold roughly 28%, alongside a long tail of venture-funded specialists.

Which country is growing fastest?

Saudi Arabia grows fastest at 21.6%, combining extreme heat with the largest concentration of active megaproject labour anywhere and owner mandates that apply across the whole contractor chain.

Report Segmentation Architecture

The full report scope spans multiple orthogonal segmentation dimensions, with cross-tabulated demand data provided for each dimension pair. Coverage extends further to regional breakdowns, trend trajectories, and the competitive detail needed to support segment-level decision-making.

By Primary Market Dimension

  • Proximity Detection and Collision Avoidance
  • Location Tracking and Site Mustering
  • Physiological and Heat Stress Monitoring
  • Fall Detection and Impact Sensing
  • Powered and Passive Exoskeletons
  • Head-Mounted Display and Vision Systems

By End-Use Industry

  • Heavy Civil and Infrastructure
  • Energy and Industrial Construction
  • Commercial and Institutional Building
  • Residential Construction
  • Tunnelling and Underground Works
  • Mining Adjacent Civil Works

By Commercial Dimension

  • Project Owner Mandated Programmes
  • General Contractor Direct Purchase
  • Insurance and Broker Specification
  • Safety Equipment Distribution
  • Device as a Service Contracts
  • Equipment Manufacturer Integration

By Region

  • East Asia
  • North America
  • Western Europe
  • South Asia and Pacific
  • Middle East and Africa
  • Latin America
  • Eastern Europe

Scope, Methodology, and Coverage

Every figure in this report is reproducible from documented input assumptions. The scope below maps the historical period, the forecast horizon, the segmentation dimensions, and the countries covered, alongside the underlying primary and qualitative methodology.
Historical Period
2020 to 2025
Forecast Period
2026 to 2036
Base Year
2025 (USD billions; MMA Primary Research Dataset, September 2026)
Market Definition
This market covers body-worn and personal protective equipment technology used by construction site workers, spanning proximity detection and collision avoidance, location tracking and site mustering, physiological and heat stress monitoring, fall detection and impact sensing, powered and passive exoskeletons, and head-mounted display and field vision systems. Revenue is measured as device, gateway, machine-mounted interaction unit and platform subscription value including attributable deployment services. Fixed site cameras and sensors, standalone machine-mounted systems without worker-worn components, drones, conventional unconnected protective equipment and construction project management software are excluded.
Quantitative Units
USD billions, device, infrastructure and platform subscription revenue
Segmentation Dimensions
Wearable function, project type, commercial model, region
Regions Covered
East Asia, North America, Western Europe, South Asia and Pacific, Middle East and Africa, Latin America, Eastern Europe
Countries Covered
United States, Canada, Mexico, Brazil, Chile, United Kingdom, Germany, Netherlands, France, Sweden, Norway, Denmark, Poland, Czechia, Japan, South Korea, China, Taiwan, Singapore, India, Malaysia, Australia, New Zealand, Saudi Arabia, United Arab Emirates, Qatar, Egypt, South Africa
Key Companies Profiled
Honeywell, MSA Safety, Blackline Safety, 3M, Hilti, Triax Technologies, Kenzen, SlateSafety, Guardhat, German Bionic, Ekso Bionics, Levitate Technologies, Ottobock, RealWear, Vuzix, Trimble, Topcon Positioning Systems, WakeCap, Corvex Connected Safety, Kinetic
Quantitative Methodology
Primary survey, n=3,800 respondents, Q4 2025, six countries; demand-side model with trade association cross-validation
Qualitative Methodology
47 expert interviews, Q4 2025; applied to validate demand model assumptions, identify emerging dynamics, and assess competitive positioning
Report Format
PDF and XLSX data workbook (Word format preview document)
Publisher
Market Minds Advisory
Report Code
MMA-2026-CON-601
Published
September 2026
Contact
sales@marketmindsadvisory.com | www.marketmindsadvisory.com

Purchase the full Construction Wearable Technology Market Report (2026 to 2036).

The full MMA report explains why construction wearables fail commercially rather than technically, and what deployment structures actually reach site-wide coverage. It sizes the market to 2036 across six wearable functions, seven regions and 28 countries, with segment growth rates and regional demand mechanisms set out in full. Competitive analysis covers 20 suppliers assessed on measured device and platform revenue, including moat and risk assessment for the two leaders. The report quantifies deployment cost structure, utilisation economics and margin architecture across three portfolio tiers. It closes with four strategic verdicts and an anonymised infrastructure owner engagement.
Six wearable functions sized to 2036
Seven regions with demand mechanism analysis
Twenty suppliers on consistent revenue basis
Deployment cost and device utilisation benchmarks
Margin architecture across three portfolio tiers
Anonymised infrastructure owner safety technology engagement

Built For The People Who Decide

From boardroom strategy to bench-side execution, this report is read cover-to-cover by leaders shaping the next decade of their industry, turning demand scenarios, market dynamics and valuation benchmarks into decisions.
CXOs/ Presidents/ VPs/ Managers
M&A and Corporate Development
Strategy Teams and R&D Heads
Procurement and Product Directors
Regulatory and Compliance Leaders
Investor Relations and Equity Analysts