Market Minds Advisory
Construction Punch List Software Market

Construction Punch List Software Market: Construction Punch List Software Market. Photo-Based Defect Detection and the Digitisation of Project Closeout

General contractors closing out projects still chase subcontractors through spreadsheets and paper walkthroughs for outstanding defects, and that manual bottleneck is now the clearest remaining gap in a digitised construction technology stack.

Lead Analyst

Published

September 2026

Make Smarter Decisions with Customized Research Insights

Request a free sample report and evaluate market opportunities, growth trends, and competitive dynamics relevant to your business needs.

2025 MARKET VALUE$0.7BMarket Size 2025
2036 FORECAST VALUE$1.8BBase Case , 2026 to 2036
CAGR 2026 TO 20369.5 %Bull 10.8% / Bear 8.2%
INCREMENTAL OPPORTUNITY$1.1BNet 10- year value creation
EXPANSION MULTIPLE2.48x2036 value over 2026 base
Strategic Levers
M&A Pipeline
Regional Outlook
Country Rankings
Competitive Intelligence
Segmental Deep-dive
Call-Us : 91 93563 13602

Executive Snapshot and Market Trajectory.

General contractors are replacing spreadsheet and paper-based punch list tracking with dedicated mobile software as project closeout delays increasingly become the visible bottleneck standing between substantial completion and final payment, and that single pain point is now driving purchase decisions.. with no easy manual substitute at scale today.
Demand is concentrated among commercial general contractors managing multiple concurrent projects, particularly enterprise firms running many concurrent sites, while AI-assisted defect detection tools using photo and video analysis are growing fastest as computer vision matures enough to flag likely defects automatically rather than relying on manual walkthroughs. North America and East Asia hold the deepest current deployment, reflecting commercial construction technology adoption maturity and large-scale infrastructure investment volume across both regions..
Competitive structure splits between large integrated construction management platforms bundling punch list functionality alongside broader project management tools and smaller standalone applications competing on mobile usability and subcontractor adoption ease. Owners and general contractors increasingly treat digital punch list and handover documentation as a contractual requirement rather than an optional convenience, reshaping vendor sales conversations across nearly every major regional market this year. across most markets.
Market Definition
This market covers software applications, whether standalone or embedded within broader construction management platforms, used to create, assign, track, and close out defect and deficiency items during construction project inspection and handover phases. It excludes general project scheduling software, building information modelling authoring tools, and accounting or payment platforms that do not directly manage punch list or defect tracking workflows.
Base Year Value
$0.7B in 2025 (MMA Primary Research Dataset, September 2026)
Forecast Period
2026 to 2036, eleven discrete annual values
CAGR
9.5% base case. Bull 10.8%. Bear 8.2%.
Fastest Growth Segment
AI-Assisted Defect Detection Tools: 16.0% CAGR
Fastest Growth Country
India: 12.5% CAGR
Fastest Growth Region
South Asia and Pacific: 11.8% CAGR
Largest Region
North America: 30% of 2025 global value
Market Leaders
Procore Technologies Inc., Autodesk Inc., Oracle Corporation, Trimble Inc., Fieldwire Inc. Source: MMA Analysis based on company annual reports and investor filings.
Primary Survey
n=3,800 procurement and R&D decision-makers, Q4 2025, six countries
Methodology
Demand-side build-up, cross-validated against public data, 47 expert interviews

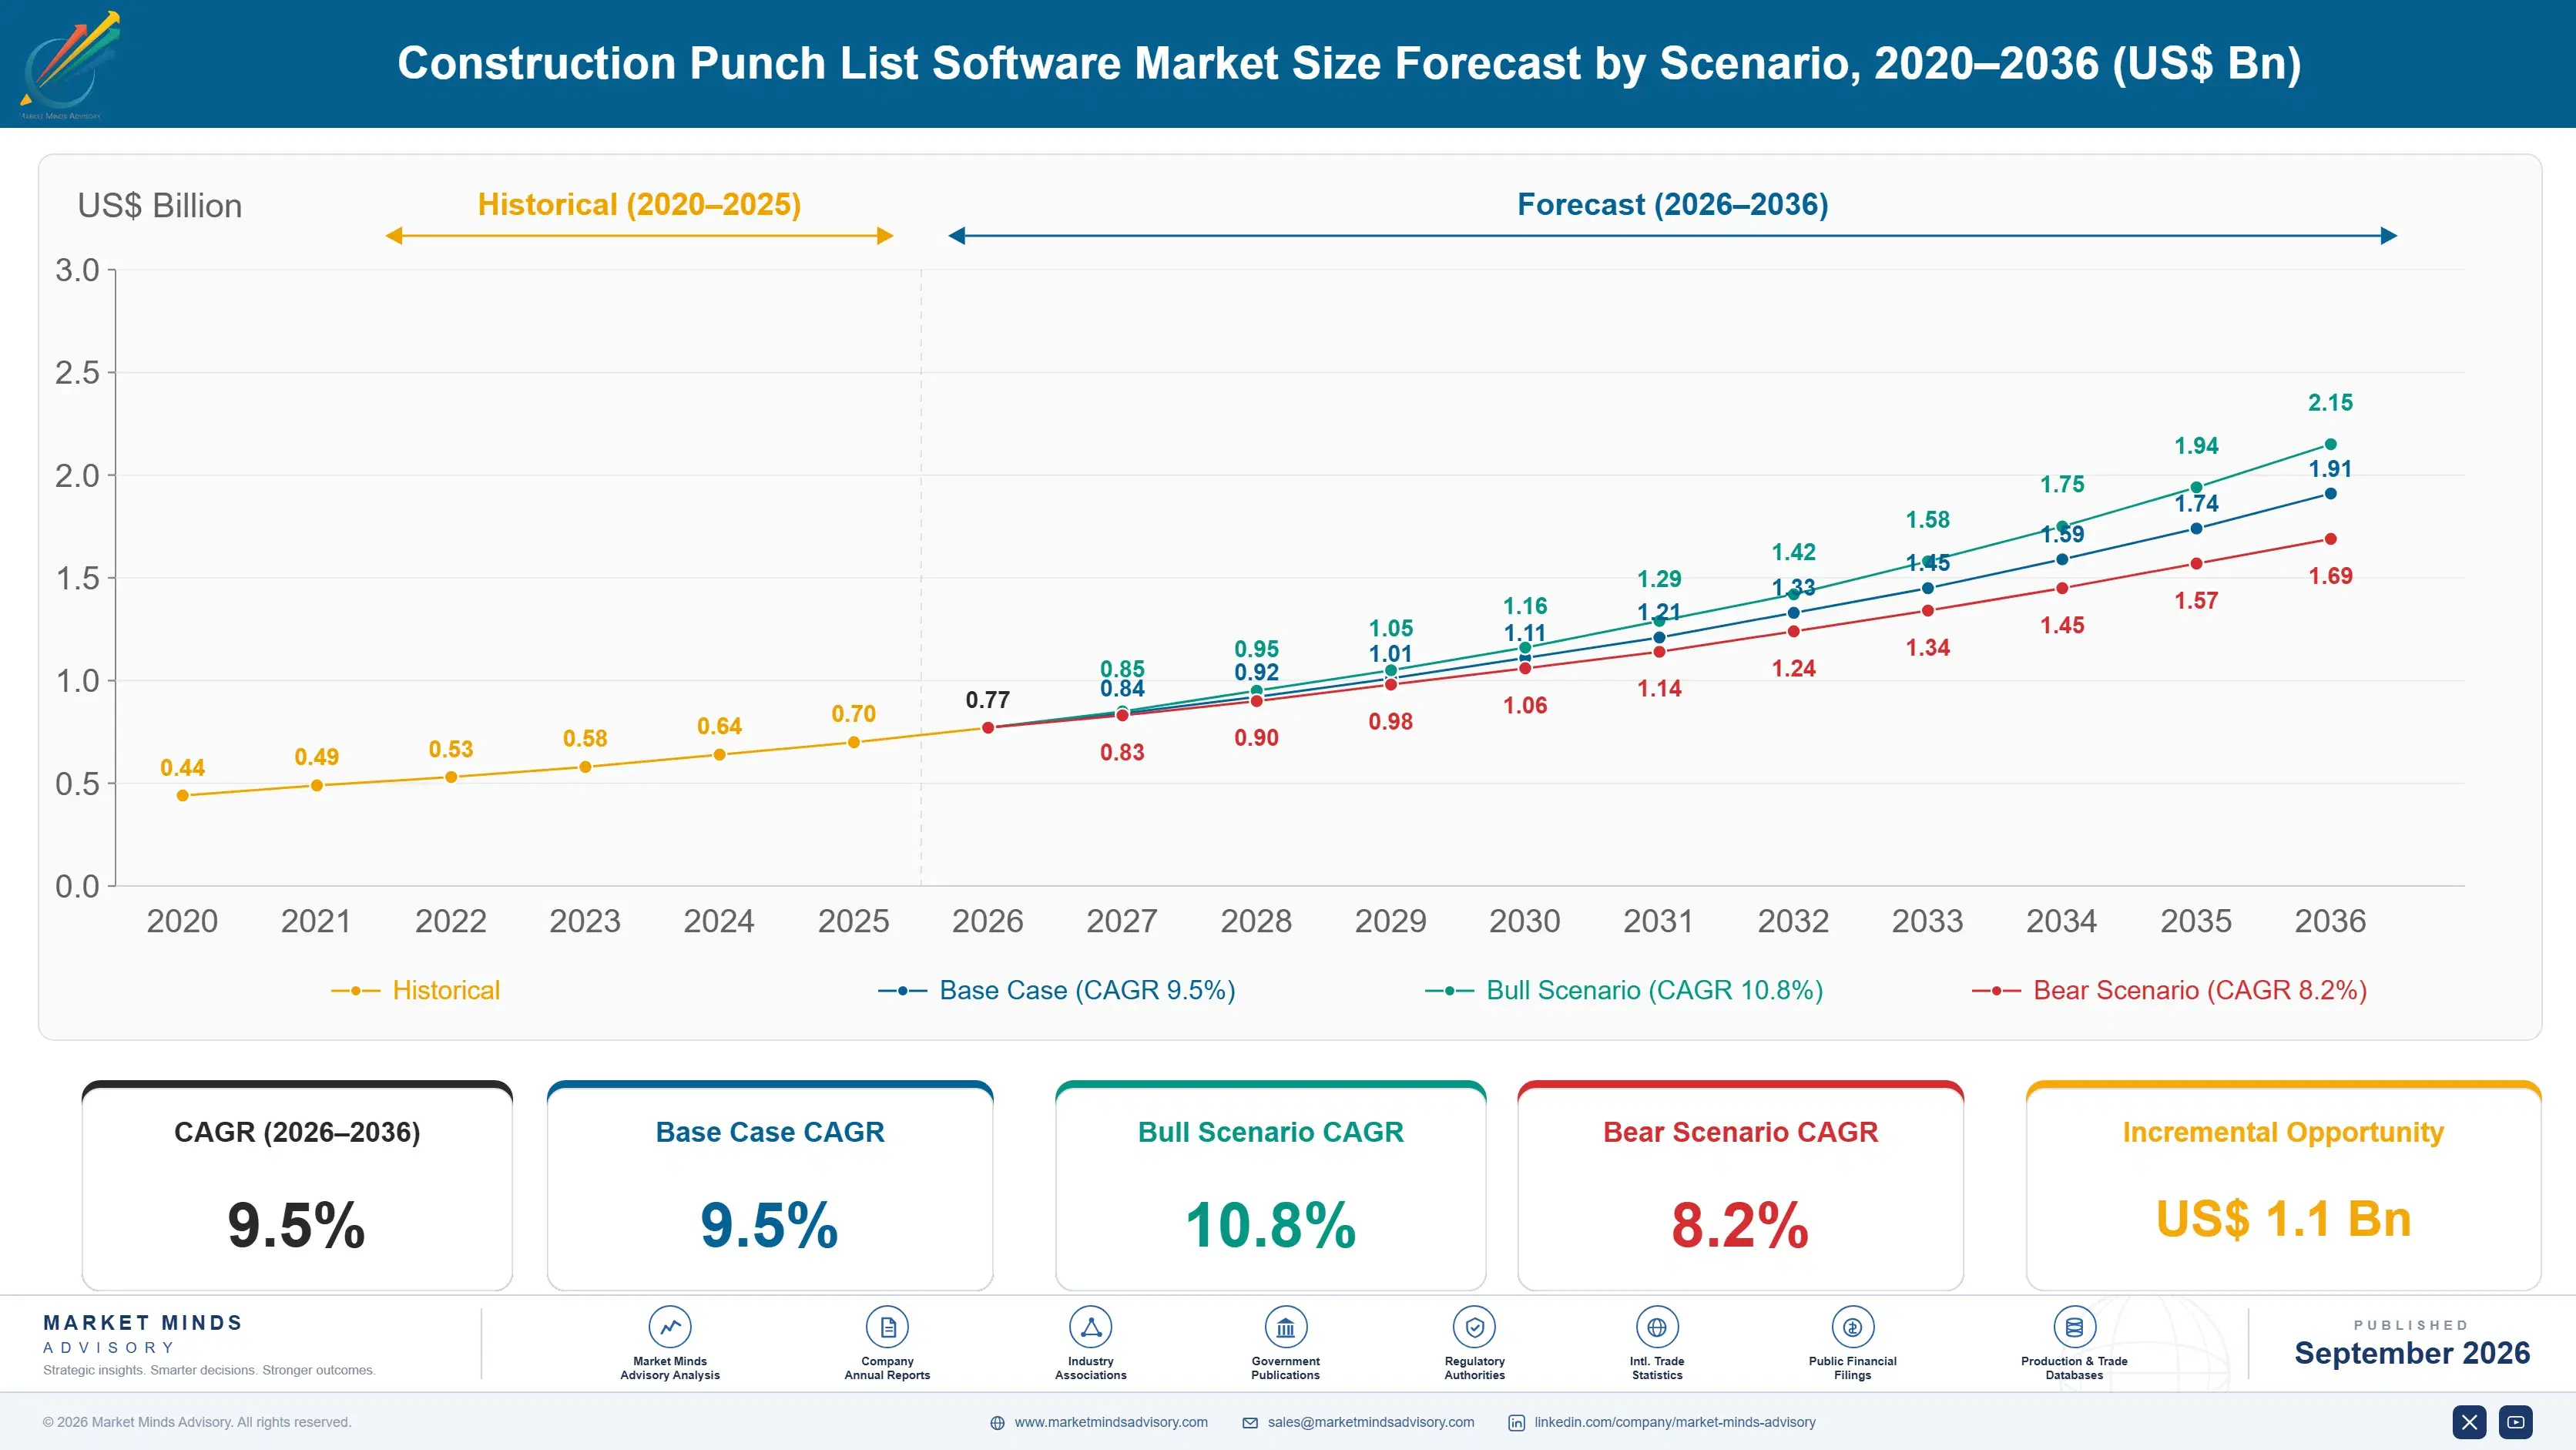
Construction Punch List Software Market Forecast Scenarios

construction-punch-list-software-market-size-forecast-scenario-1788421382020
Between 2020 and 2025 this category grew steadily as broader construction technology adoption accelerated following pandemic-driven remote collaboration needs, with dedicated punch list tools gradually displacing spreadsheet-based tracking across mid-sized general contractors first. Larger enterprise contractors adopted more slowly, often waiting for punch list functionality to appear inside an already-purchased broader project management suite. Historical annual growth averaged roughly 8.5 percent across this period, MMA estimates.
The base case assumes continued solid growth driven by three mechanisms: broader commercial construction activity generating more projects requiring closeout documentation, increasing owner and lender contractual requirements for digital handover documentation packages, and maturing AI-assisted defect detection features that reduce the manual inspection time general contractors must budget for project closeout specifically. These three mechanisms compound fastest among general contractors running multiple concurrent commercial projects where closeout delays carry the most direct cash flow consequences.
A bull scenario turns on AI-assisted defect detection reaching accuracy levels that meaningfully reduce manual inspection labor, pulling forward broad adoption across contractors currently on the fence. The bear risk is continued construction technology budget consolidation toward fewer, broader platform vendors, compressing the addressable market available to standalone punch list specialists lacking a path to broader platform functionality.

Digitising the Last Mile of Construction Project Closeout

Two forces are converging on this category at once: general contractors under mounting pressure to accelerate project closeout and final payment cycles, and computer vision technology maturing enough to make photo-based automated defect flagging genuinely useful rather than a marketing gimmick. Together these are pulling budget away from generic checklist spreadsheets toward purpose-built software that actively speeds up the closeout process itself. This dual pressure is reshaping product roadmaps faster than most vendors originally planned.
MARKET CONCENTRATIONCR5 44%Reflects continued dominance of large integrated construction platforms
AVERAGE SEAT PRICEUSD 45 per user per monthBlended average across standalone and bundled platform pricing
TOP PRODUCING COUNTRY SHAREUnited States 31%Anchored firmly by concentrated construction technology vendor headquarters
PUNCH LIST DIGITISATION RATE52% of commercial projectsShare of commercial projects using digital punch list tools
AVERAGE CLOSEOUT TIME REDUCTION34% versus paper trackingTypical closeout time saved using dedicated punch list software
SUBCONTRACTOR ADOPTION RATE68% active engagementShare of assigned subcontractors actively using the platform
Commercially, the market behaves like a wedge product inside a broader construction technology sale. Many contractors first adopt punch list functionality as a narrow, low-risk pilot before expanding into broader project management or field collaboration tools from the same vendor, making punch list software a genuine gateway into much larger platform relationships for vendors positioned correctly.
Over the next decade, expect punch list functionality to become a standard, expected feature inside every major construction management platform rather than a standalone purchase decision for most large contractors. Vendors that keep a distinct standalone product viable will do so by serving specific niches, smaller contractors, specialty trades, or owner-side facility handover use cases that broader platforms serve less precisely.
"Nobody gets excited about punch list software until they're staring down a project that's ninety eight percent done and stuck there for six weeks over paperwork nobody can track."
Director, Construction Technology and Field Operations Practice · MMA Construction and Industrial Equipment Practice · September 2026

Market Trends

AI-Assisted Photo Analysis Automates Defect Flagging at Scale

Vendors across the category are deploying computer vision models trained to identify common construction defects directly from inspection photos, flagging likely issues automatically rather than requiring an inspector to manually document every item during a physical walkthrough. MMA's Q4 2025 primary research found AI-assisted defect flagging features present in a meaningfully growing share of new platform deployments, with general contractors citing reduced inspection time as the primary adoption reason. This shift is letting smaller inspection teams cover more square footage per visit than previously possible. Vendors continue refining model accuracy across an expanding library of common defect categories.
Market Impact: Drives 66% of new software purchases
Owners Mandate Digital Handover Documentation in Contracts

Commercial property owners and institutional lenders are increasingly writing digital punch list and handover documentation requirements directly into construction contracts, treating a structured digital record as a condition of final payment release rather than accepting informal paper documentation as sufficient. Several major institutional owners interviewed for MMA's Q4 2025 expert programme confirmed this contractual requirement had become standard practice across their active project portfolios within the past two years specifically. This shift is forcing previously resistant general contractors to comply, since missing documentation can delay final payment considerably. Vendors expect this pattern to spread further.
Market Impact: Speeds final payment release 3 weeks

Market Opportunities and Growth Drivers

Commercial Construction Activity Sustains Steady Project Volume

Sustained commercial construction activity across office, industrial, healthcare, and multifamily residential sectors continues generating a steady pipeline of projects requiring closeout and punch list management, providing the underlying volume base this category depends upon for continued growth regardless of specific technology adoption pace. Surveyed general contractors linked sixty six percent of new punch list software purchases directly to managing an increased number of concurrent active projects relative to prior years, according to MMA's Q4 2025 primary research. Contractors managing the highest project volume are adopting software fastest. This coordination burden becomes unmanageable manually beyond a handful of simultaneous projects.
Market Impact: Cuts item closure speed by 22%

Lender and Owner Payment Requirements Push Digital Adoption

Construction lenders and institutional property owners increasingly require structured digital closeout documentation before releasing final payment or retainage, directly linking punch list software adoption to contractors' cash flow timing rather than treating it as a discretionary efficiency investment. Surveyed contractors reported that projects using dedicated punch list software closed out and released final payment measurably faster than comparable projects still relying on paper or spreadsheet tracking, according to MMA's Q4 2025 expert interview programme. This direct cash flow linkage is accelerating adoption among contractors who might otherwise have delayed the purchase decision for additional budget cycles.
Market Impact: Cuts standalone win rate 15%

Market Restraints and Challenges

Subcontractor Adoption Resistance Slows Full Platform Value

General contractors adopting punch list software often struggle to achieve full subcontractor engagement, since subcontractors working across multiple general contractors face genuine friction learning several different mobile applications depending on the job site. The root cause is that no single platform has achieved sufficient market share to become a de facto standard subcontractors can rely on across most projects, leaving fragmented adoption as the default state. The commercial impact shows up as lower item closure rates on projects where subcontractor engagement remains partial. Several vendors are simplifying subcontractor-facing interfaces to minimise the learning curve for occasional users.
Market Impact: Lifts AI-flagged defect share 18 points

Platform Consolidation Pressures Standalone Vendor Positioning

Large integrated construction management platforms bundling punch list functionality at no additional cost are pressuring standalone vendors to justify a separate purchase, particularly among enterprise contractors already paying for a broader platform subscription. The root cause is that punch list functionality, while valuable, is not sufficiently differentiated to resist bundling economics once a platform vendor builds comparable capability. The commercial impact falls hardest on standalone vendors serving enterprise accounts specifically. Several standalone vendors are focusing on small and mid-sized contractors less likely to already own a comprehensive platform subscription. This dynamic favours vendors that find a defensible niche quickly.
Market Impact: Adds 16.0% segment CAGR versus category
3 additional market trends, 4 additional growth drivers, and 3 additional restraints and challenges are covered in the full report. Contact sales@marketmindsadvisory.com to access the complete intelligence.

Segment CAGR and Growth Architecture

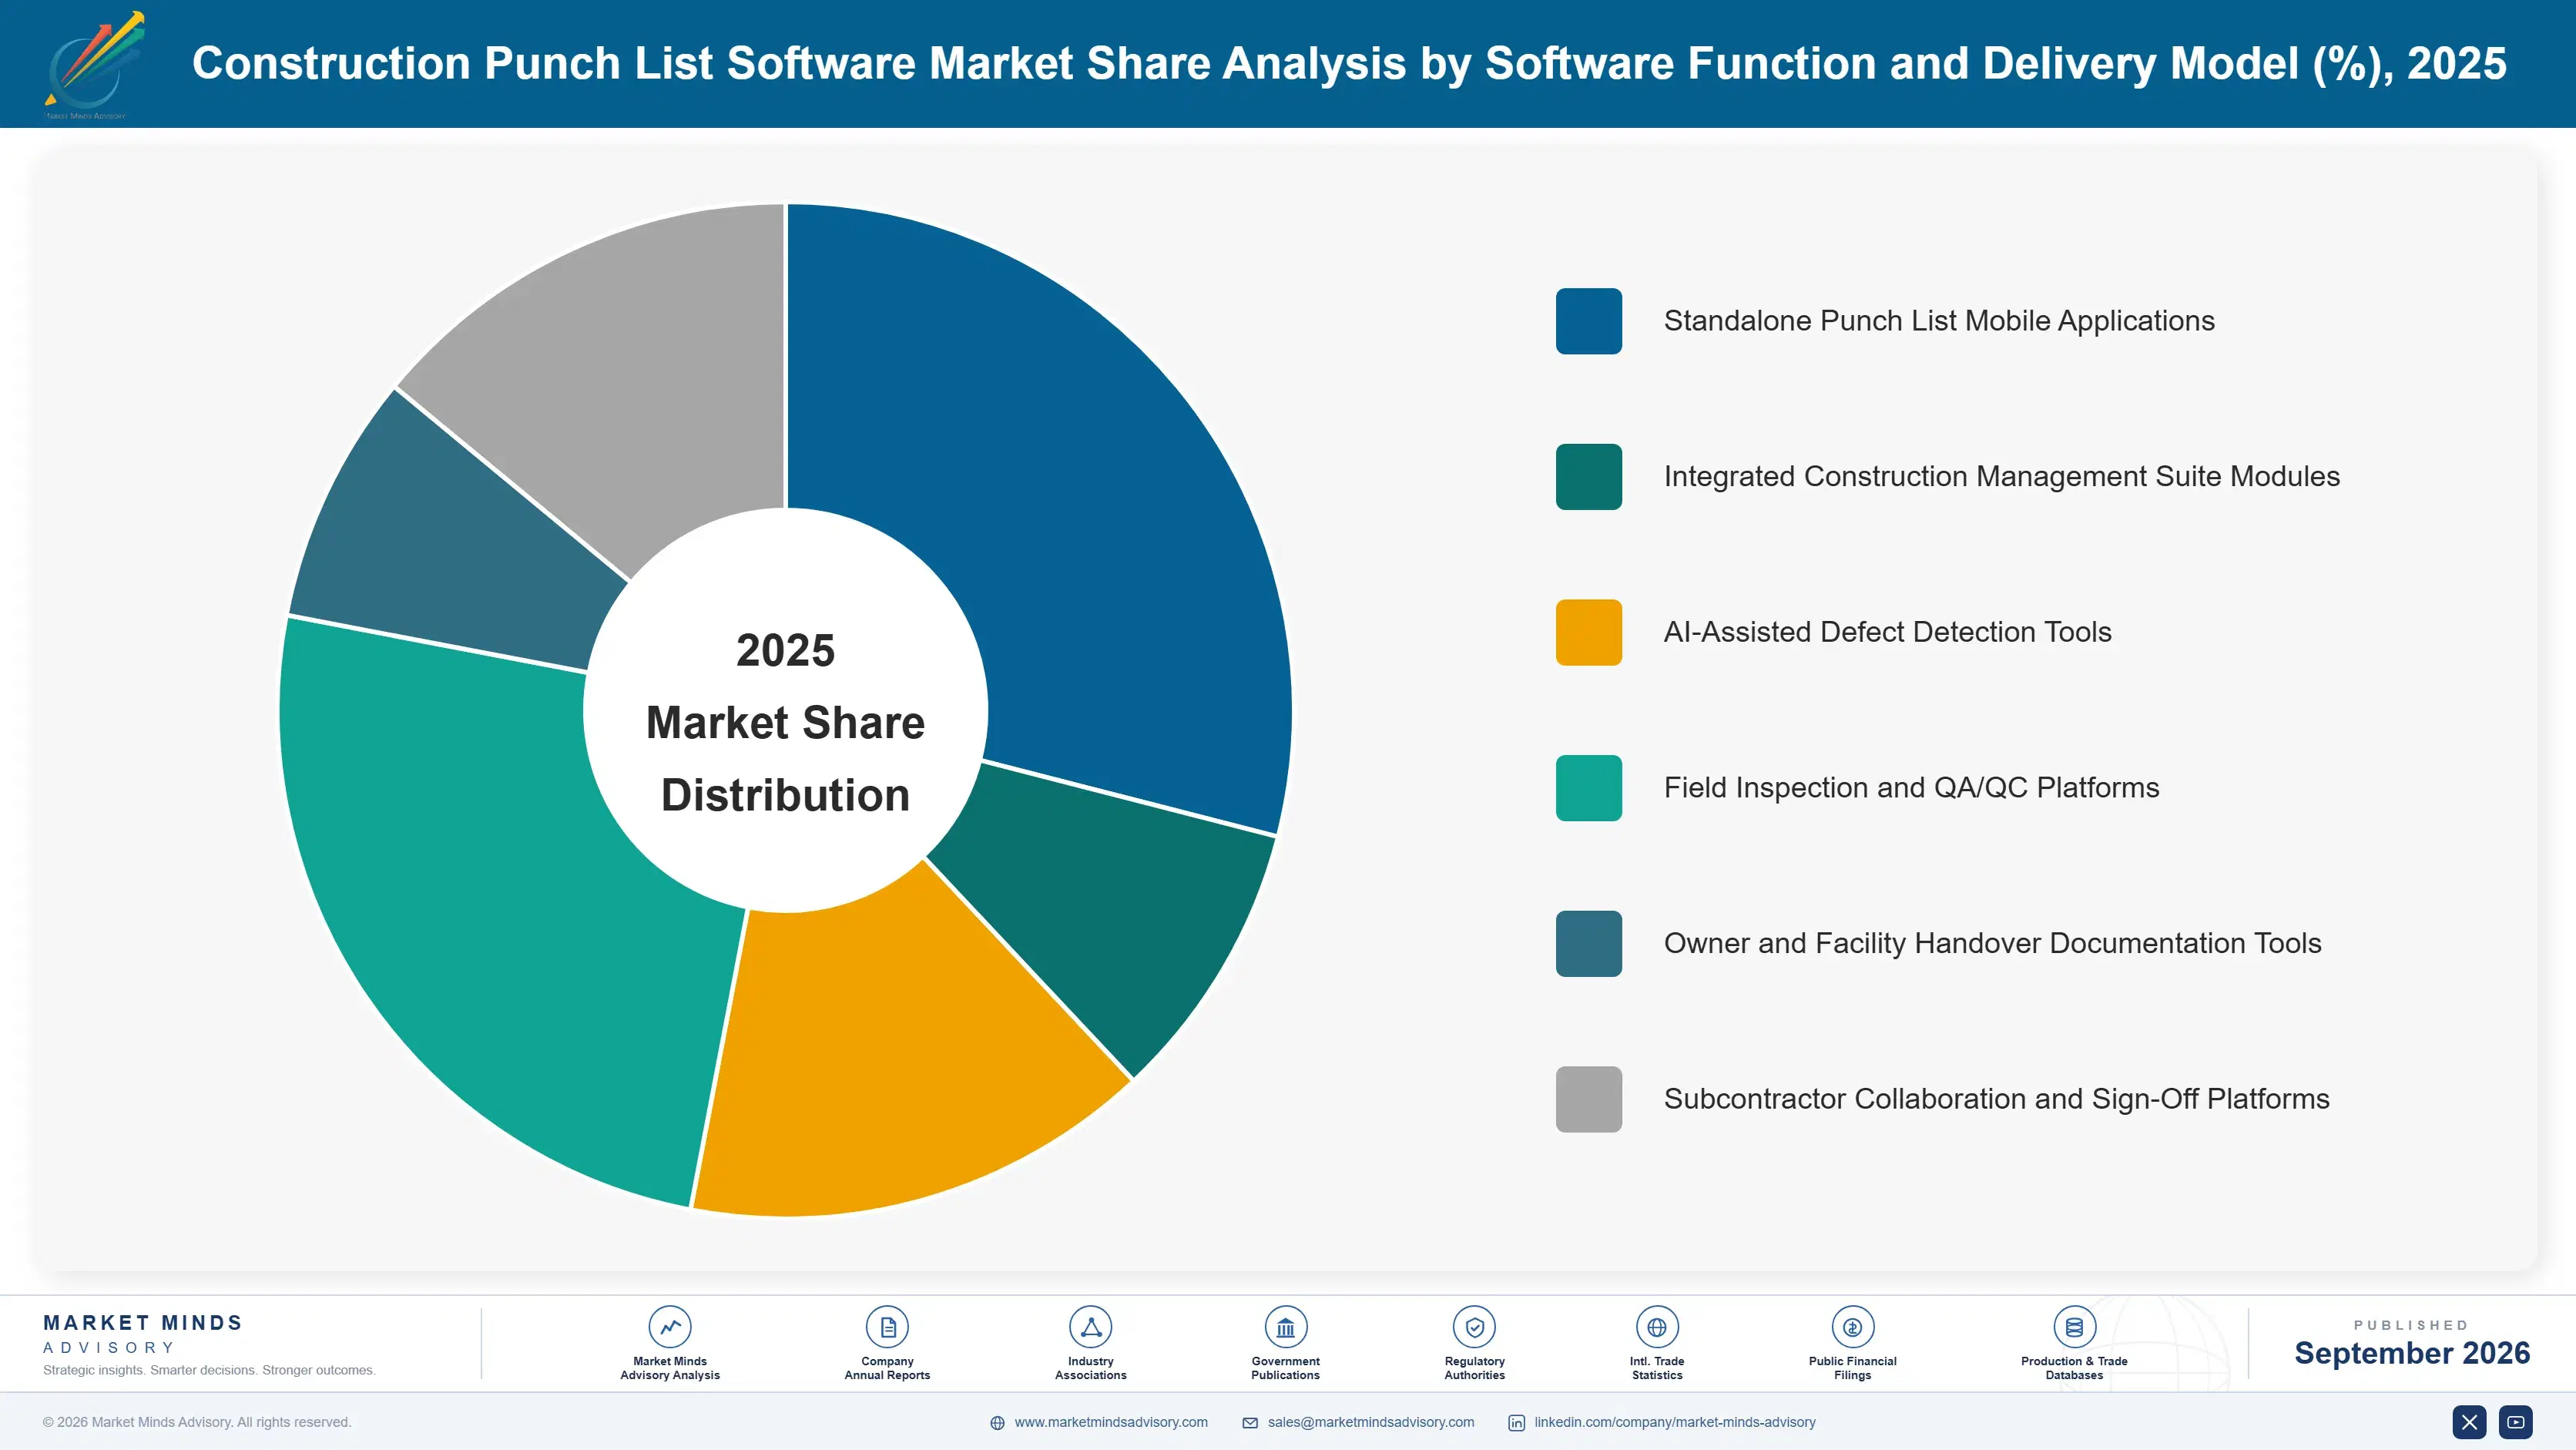
Segmentation follows software function and delivery model, since that dimension best explains buyer evaluation criteria, spanning standalone mobile punch list applications through integrated platform modules to newer AI-assisted defect detection tools. This single classification logic keeps software function separate from downstream end-use industry and commercial packaging, preserving mutually exclusive, collectively exhaustive segment boundaries throughout the analysis.
construction-punch-list-software-market-market-share-analysis-1788421382582

AI-Assisted Defect Detection Tools

This segment covers software using computer vision and photo or video analysis to automatically identify likely construction defects during inspection walkthroughs, flagging issues for inspector confirmation rather than requiring fully manual identification and documentation of every item found on site. Adoption is concentrated among larger general contractors managing enough project volume to justify the additional cost of AI-enabled tiers, where inspection time savings translate directly into measurable labor cost reduction across many concurrent projects. Growth is outpacing every other segment in this report because the underlying computer vision technology has only recently reached commercial reliability for construction-specific defect types, giving this segment a low starting base from which rapid proportional growth is easier to sustain.
CAGR 16.0%

Integrated Construction Management Suite Modules

This segment covers punch list functionality delivered as a module within a broader construction management platform rather than as a standalone application, letting contractors manage defect tracking alongside scheduling, budgeting, and document control from a single unified system. Demand is rising as large general contractors consolidate their technology stack toward fewer vendors, preferring integrated modules that share data automatically with other project systems over standalone tools requiring manual data transfer between platforms. Growth trails the AI-assisted segment only because integrated modules already represent a larger, more established base, with most major platform vendors having already shipped basic punch list functionality years earlier. Vendors here increasingly price on module usage tied to concurrent project count rather than flat seats.
CAGR 12.0%
Full segment breakdown across 6 segments available in the complete report.

Regional Architecture and Country Demand Map

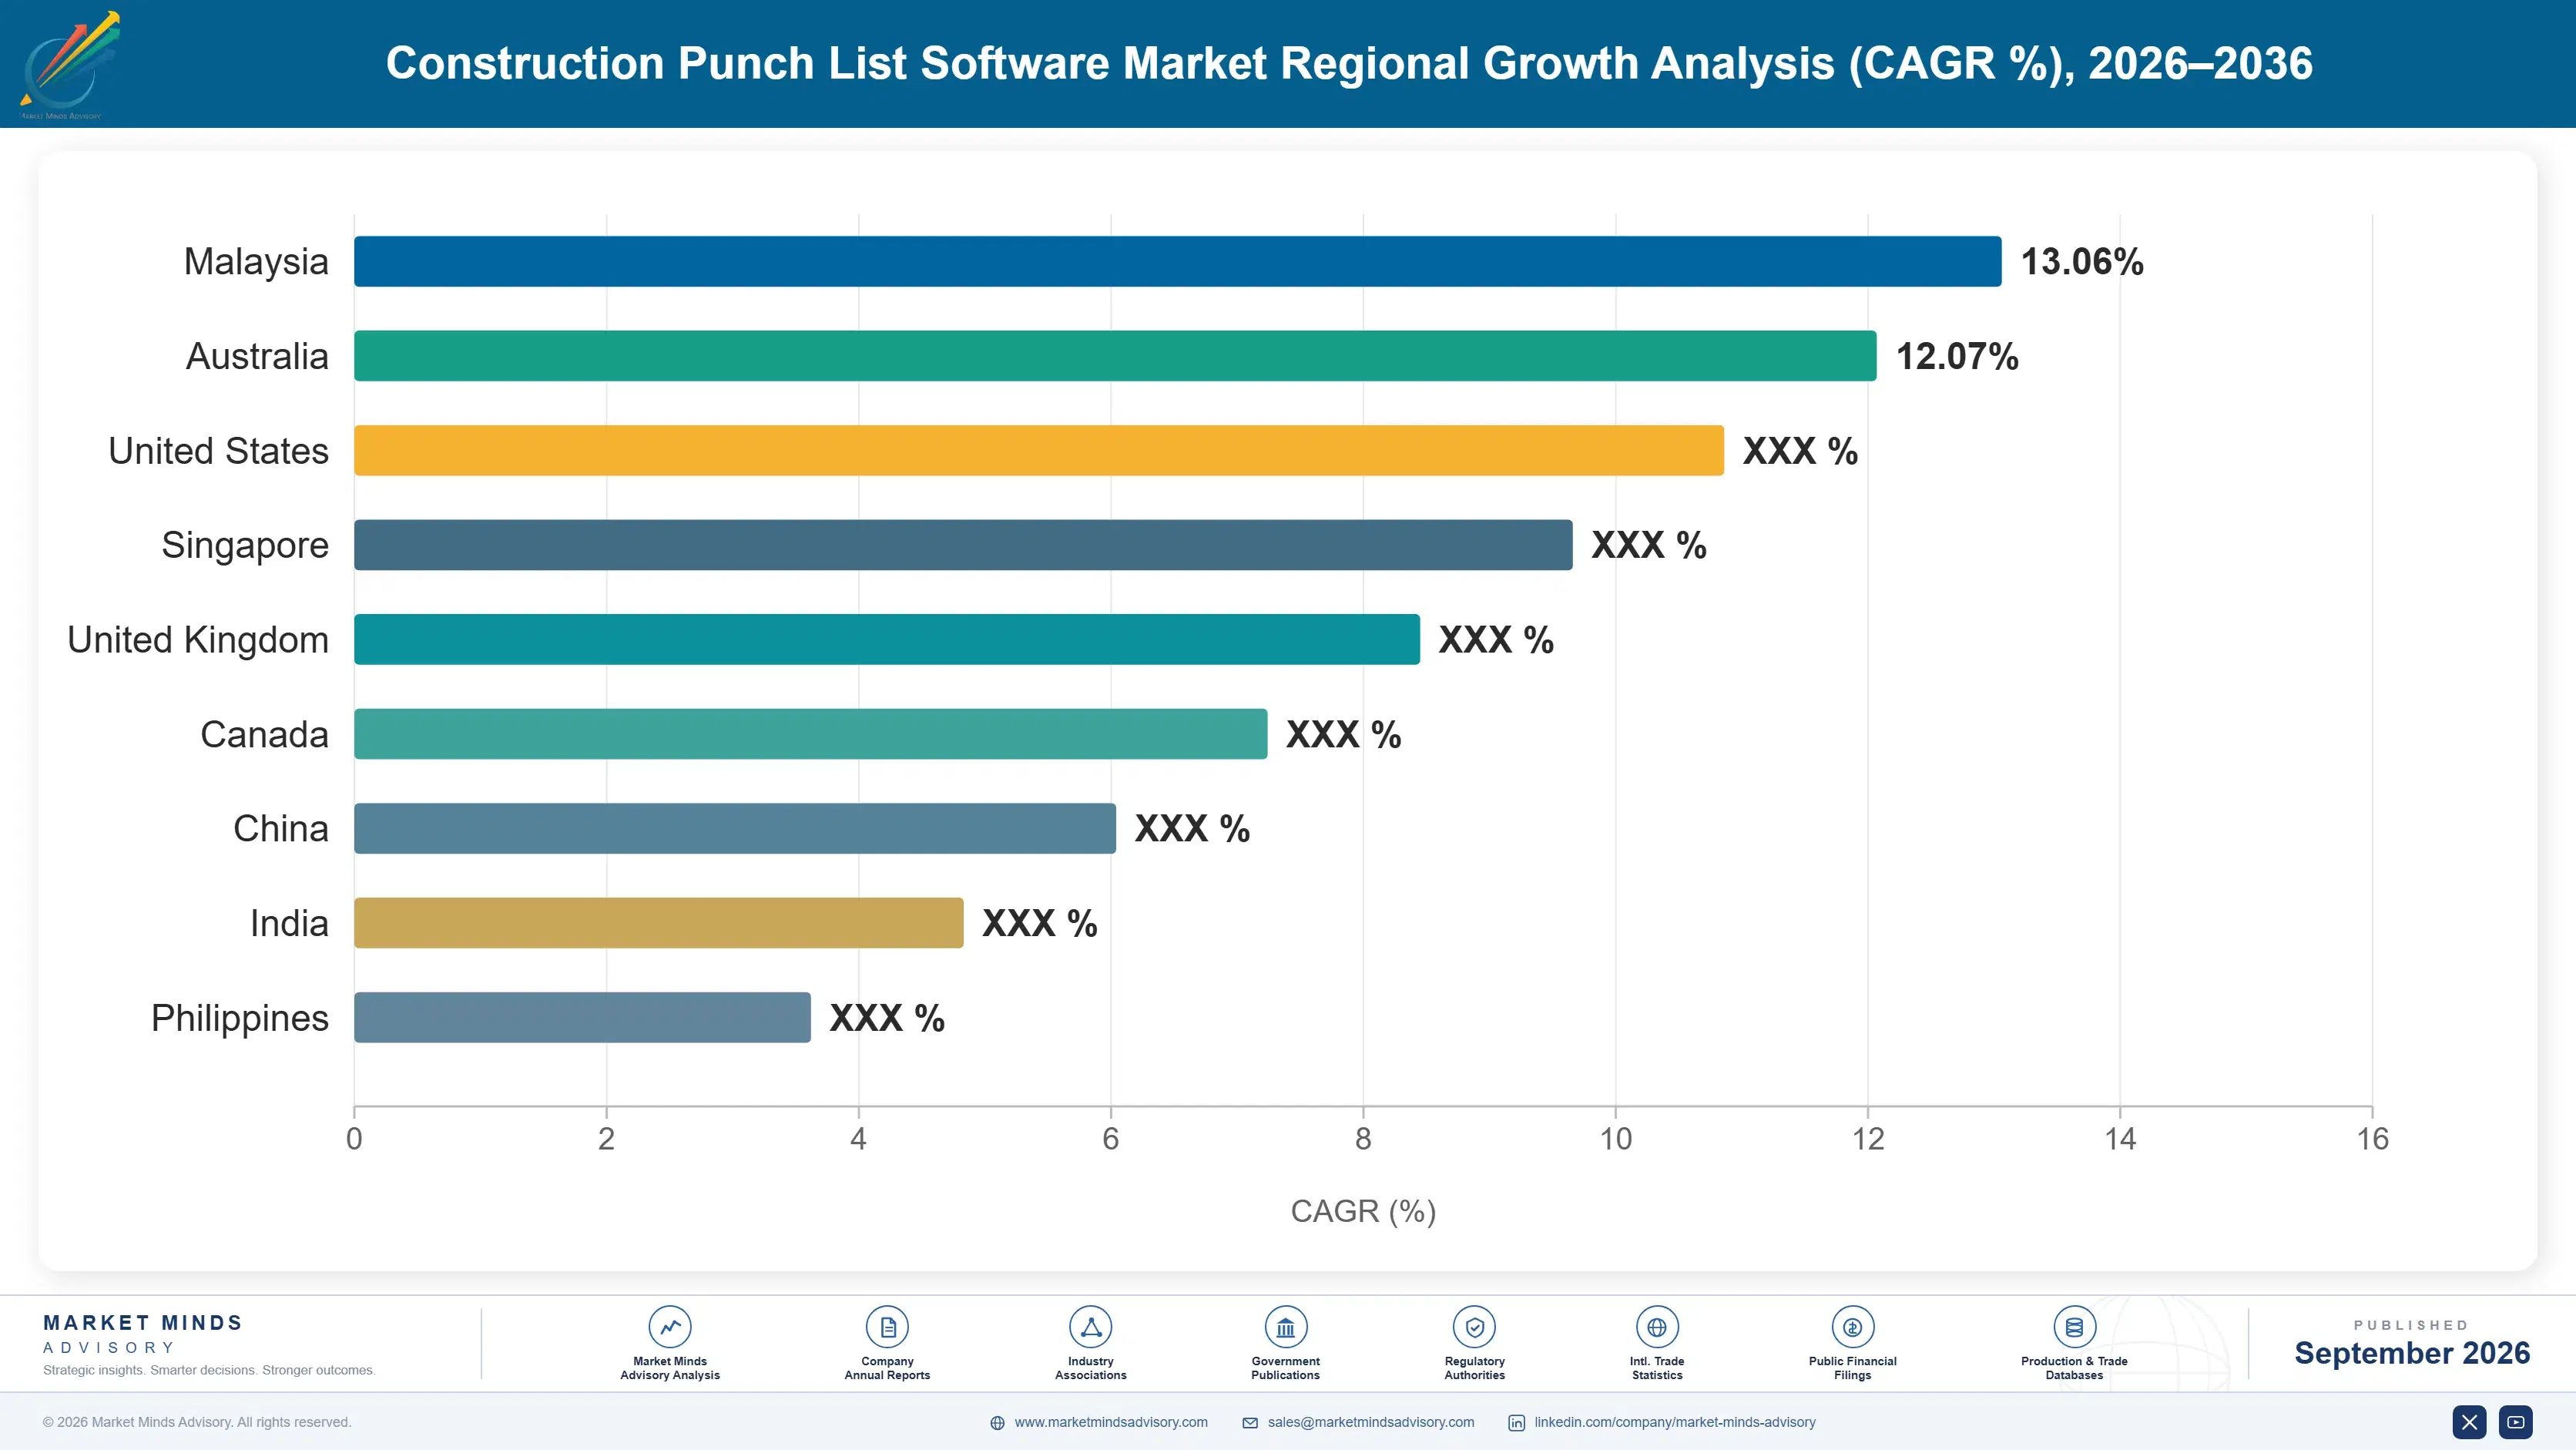
North America and East Asia together anchor more than half of global revenue, reflecting concentrated construction technology vendor headquarters and large-scale infrastructure investment, while South Asia and Pacific delivers the fastest regional expansion off a smaller current deployment base. Latin America and Eastern Europe remain smaller contributors.

North America

United States commercial general contractors account for the overwhelming majority of regional demand, driven by mature construction technology adoption and a concentrated cluster of major platform vendors headquartered domestically. Canadian commercial construction activity is adopting punch list software steadily as lenders increasingly require digital closeout documentation for project financing approval. Growth here runs close to the global base rate since the region's construction technology adoption, while extensive in absolute terms, is now a mature and closely tracked spending category rather than an emerging one this year specifically among most contractor segments. Enterprise procurement teams increasingly treat digital punch list adoption as a board-level operational efficiency priority rather than a discretionary field tool purchase.
Share: 30% | CAGR: 10.7% (2026 to 2036)

Western Europe

German and French commercial construction firms drive the bulk of regional demand, adopting punch list software steadily as broader construction technology modernisation continues across the region's largest contracting firms. United Kingdom contractors are adopting digital closeout tools quickly given increasingly stringent building safety documentation requirements introduced following recent regulatory reform. Growth trails the global rate somewhat because European commercial construction activity overall has grown more slowly than in North America or East Asia, limiting the underlying project volume driving new software adoption across the region specifically. Nordic countries are also beginning steady adoption as regional construction technology modernisation programmes expand across smaller national contracting markets. regulatory reform continuing to expand documentation obligations broadly.
Share: 20% | CAGR: 8.2% (2026 to 2036)
Regional intelligence for 5 additional markets available in the complete report: East Asia, South Asia and Pacific, Latin America, Middle East and Africa, Eastern Europe. Contact sales@marketmindsadvisory.com.
construction-punch-list-software-market-country-cagr-analysis-1788421383115

Where Punch List Vendors Can Still Expand Margin

Four commercial levers separate vendors compounding revenue per seat from those stuck competing on price alone, spanning AI feature monetisation, subcontractor network effects, owner-side handover packaging, and integration marketplace expansion across the wider platform landscape. Execution difficulty varies across these four paths, and vendors without existing subcontractor density or enterprise integration capability will find some levers harder to pursue.

Monetising AI-Assisted Defect Detection as a Premium Tier

Vendors that price AI-assisted defect detection as a distinct premium tier rather than bundling it into a single flat subscription are capturing meaningfully higher average revenue per user, since the feature demonstrably reduces manual inspection time for contractors managing high project volume who are willing to pay for it. Early movers on this pricing structure reported blended seat prices roughly 35 percent above vendors offering flat all-inclusive pricing, based on disclosed pricing pages reviewed across the top fifteen platforms. The approach works best where the underlying AI feature has a clearly demonstrable time savings, favouring vendors with mature inspection data.
Market Impact: Raises average revenue per seat by 35 percent

Building Owner-Facing Facility Handover Documentation Packages

Vendors packaging structured, owner-ready handover documentation as a distinct commercial offering are winning larger contract values than vendors selling contractor-only punch list tools, since owners increasingly pay directly for a polished, structured closeout record they can retain for facility management purposes after project completion. This lever requires building genuinely owner-friendly reporting and export functionality that many contractor-focused vendors have not prioritised, creating a meaningful differentiation opportunity. Contract values for deals including owner handover packaging in MMA's dataset ran roughly 40 percent higher than comparable contractor-only deployments of similar project count.
Market Impact: Lifts contract value roughly 40 percent above baseline

Achieving De Facto Subcontractor Standard Status Regionally

Vendors that achieved sufficient regional market share to become the de facto subcontractor standard are seeing meaningfully higher retention, since subcontractors already familiar with a platform from other job sites resist switching to a general contractor's alternative choice. This lever compounds because each additional general contractor adopting the platform increases the odds any given subcontractor already knows it, creating a network effect that smaller regional vendors without comparable market share struggle to replicate quickly. Vendors with de facto standard status in MMA's dataset reported retention roughly 12 points above vendors without comparable regional density.
Market Impact: Adds roughly 12 points of platform retention overall

Expanding Integration Marketplaces With Adjacent Construction Software

Vendors that opened integration marketplaces connecting with adjacent scheduling, budgeting, and document control software are seeing higher enterprise retention, since each additional connected tool raises the practical switching cost of leaving the platform later for a competing standalone solution. Marketplace-enabled vendors reported retention roughly 7 points above platforms relying solely on an internal integration roadmap, according to MMA's competitive tracking across the fifteen largest vendors by seat count tracked in this category. Vendors without an existing marketplace face a meaningfully harder path to matching this retention advantage quickly, since building comparable integration breadth from scratch takes considerable engineering time.
Market Impact: Adds roughly 7 points of enterprise retention overall

Who Controls the Margin Pool

CR5 sits at forty four percent, evaluated on disclosed paid seat counts across the top vendors, reflecting a market where large integrated platforms hold a meaningful but not overwhelming lead over standalone specialists. Procore and Autodesk hold the clearest lead on enterprise seat count, but the gap to focused standalone challengers remains narrower than combined revenue figures alone suggest once mid-market and small contractor segments are factored in.
Current competitive activity centers on three fronts: building AI-assisted defect detection into existing platforms to defend against newer entrants, packaging owner-facing handover documentation as a distinct commercial offering, and pursuing regional subcontractor network density to raise switching costs. Pricing itself has become a secondary battleground behind AI feature capability and subcontractor adoption ease in nearly every competitive evaluation reviewed for this report.

Emerging pressure is coming from two directions simultaneously. Well-funded AI-native startups focused specifically on computer vision defect detection are attracting significant venture investment, threatening to leapfrog established platforms on this specific capability. At the enterprise end, broader construction technology suites continuing to bundle punch list functionality at no additional cost could compress independent standalone vendors into acquisition targets over the next several years, reshaping today's competitive rankings meaningfully.
construction-punch-list-software-market-company-positioning-matrix-1788421383647

Competitive Moat and Risk Dimensions

PROCORE TECHNOLOGIES INC.

Moat: Broad Platform Data Lock-In

Years of accumulated project data, workflow customisation, and integration relationships embedded across large general contractor accounts make migration costly and slow, and Procore's broader platform has become deeply woven into customers' daily operating rhythm rather than sitting alongside it, discouraging switching even under competitive pricing pressure.
PROCORE TECHNOLOGIES INC.

Risk: AI-Native Challenger Disruption

Smaller, faster-moving AI-native entrants are shipping computer vision defect detection features ahead of Procore's own release cadence, and contractors increasingly cite feature velocity over legacy platform maturity when evaluating renewal against emerging alternatives during annual contract negotiations. This gap could widen further if Procore does not accelerate its own AI release cadence soon.
AUTODESK INC.

Moat: Building Information Modelling Integration Depth

Autodesk's deep integration between its construction management tools and its dominant building information modelling software gives it a workflow continuity advantage that standalone punch list vendors cannot easily replicate, since defect data linked directly back to the original design model carries genuine value for design-build contractors specifically.
AUTODESK INC.

Risk: Mobile Usability Perception Gap

Autodesk's construction management tools face persistent perception challenges around field-level mobile usability compared to purpose-built standalone punch list applications, and subcontractors sometimes resist adoption of the broader platform's punch list module in favour of simpler alternative tools. This perception gap could persist unless Autodesk invests further in field-level mobile design specifically.

Players Tracked

Prominent Players

Procore Technologies Inc.
Autodesk Inc.
Oracle Corporation
Trimble Inc.
Fieldwire Inc.

Other Key Players

Bridgit Inc.
Buildertrend Solutions Inc.
CoConstruct LLC
Raken Inc.
Newforma Inc.
Assignar Pty Ltd.
GoFormz Inc.
PlanRadar GmbH
Fonn Group AS
Sablono GmbH
Bluebeam Inc.
Kahua Inc.
Reconstruct Inc.
Novade Solutions Pte Ltd.
eSUB Construction Software Inc.

Recent Developments

FEBRUARY 2026

Procore Launches Automated Defect Flagging Feature

Procore rolled out an automated defect flagging tool that uses computer vision to identify likely construction defects from inspection photos, moving the capability from an enterprise-only add-on into its mid-tier plan for the first time this year following beta testing. Early customer feedback has been positive across initial rollout accounts.
Signal: Signals mid-tier AI feature parity race accelerating across incumbent construction platform vendors. ahead of similar releases from smaller competitors.
OCTOBER 2025

Autodesk Acquires Defect Detection Startup ClearSite Vision

Autodesk completed the acquisition of computer vision defect detection startup ClearSite Vision, adding automated photo analysis capability intended to strengthen its construction cloud platform's punch list and quality control functionality ahead of broader competitive feature parity pressure. Financial terms of the acquisition were not disclosed publicly.
Signal: Confirms buy-versus-build pressure on AI-assisted defect detection across mid-size platform vendors. as vendors race to build comparable computer vision capability.
JUNE 2025

Fieldwire Signs Strategic Distribution Agreement With Hilti

Fieldwire signed an expanded strategic distribution agreement with parent company Hilti to bundle punch list software access with hardware purchases across Hilti's broader construction tool and fastening systems customer base, extending distribution reach beyond direct software sales channels. Financial terms of the expanded agreement were not disclosed.
Signal: Indicates hardware-software bundling becoming a meaningful distribution strategy for construction technology vendors. across other hardware-focused construction technology vendors broadly.

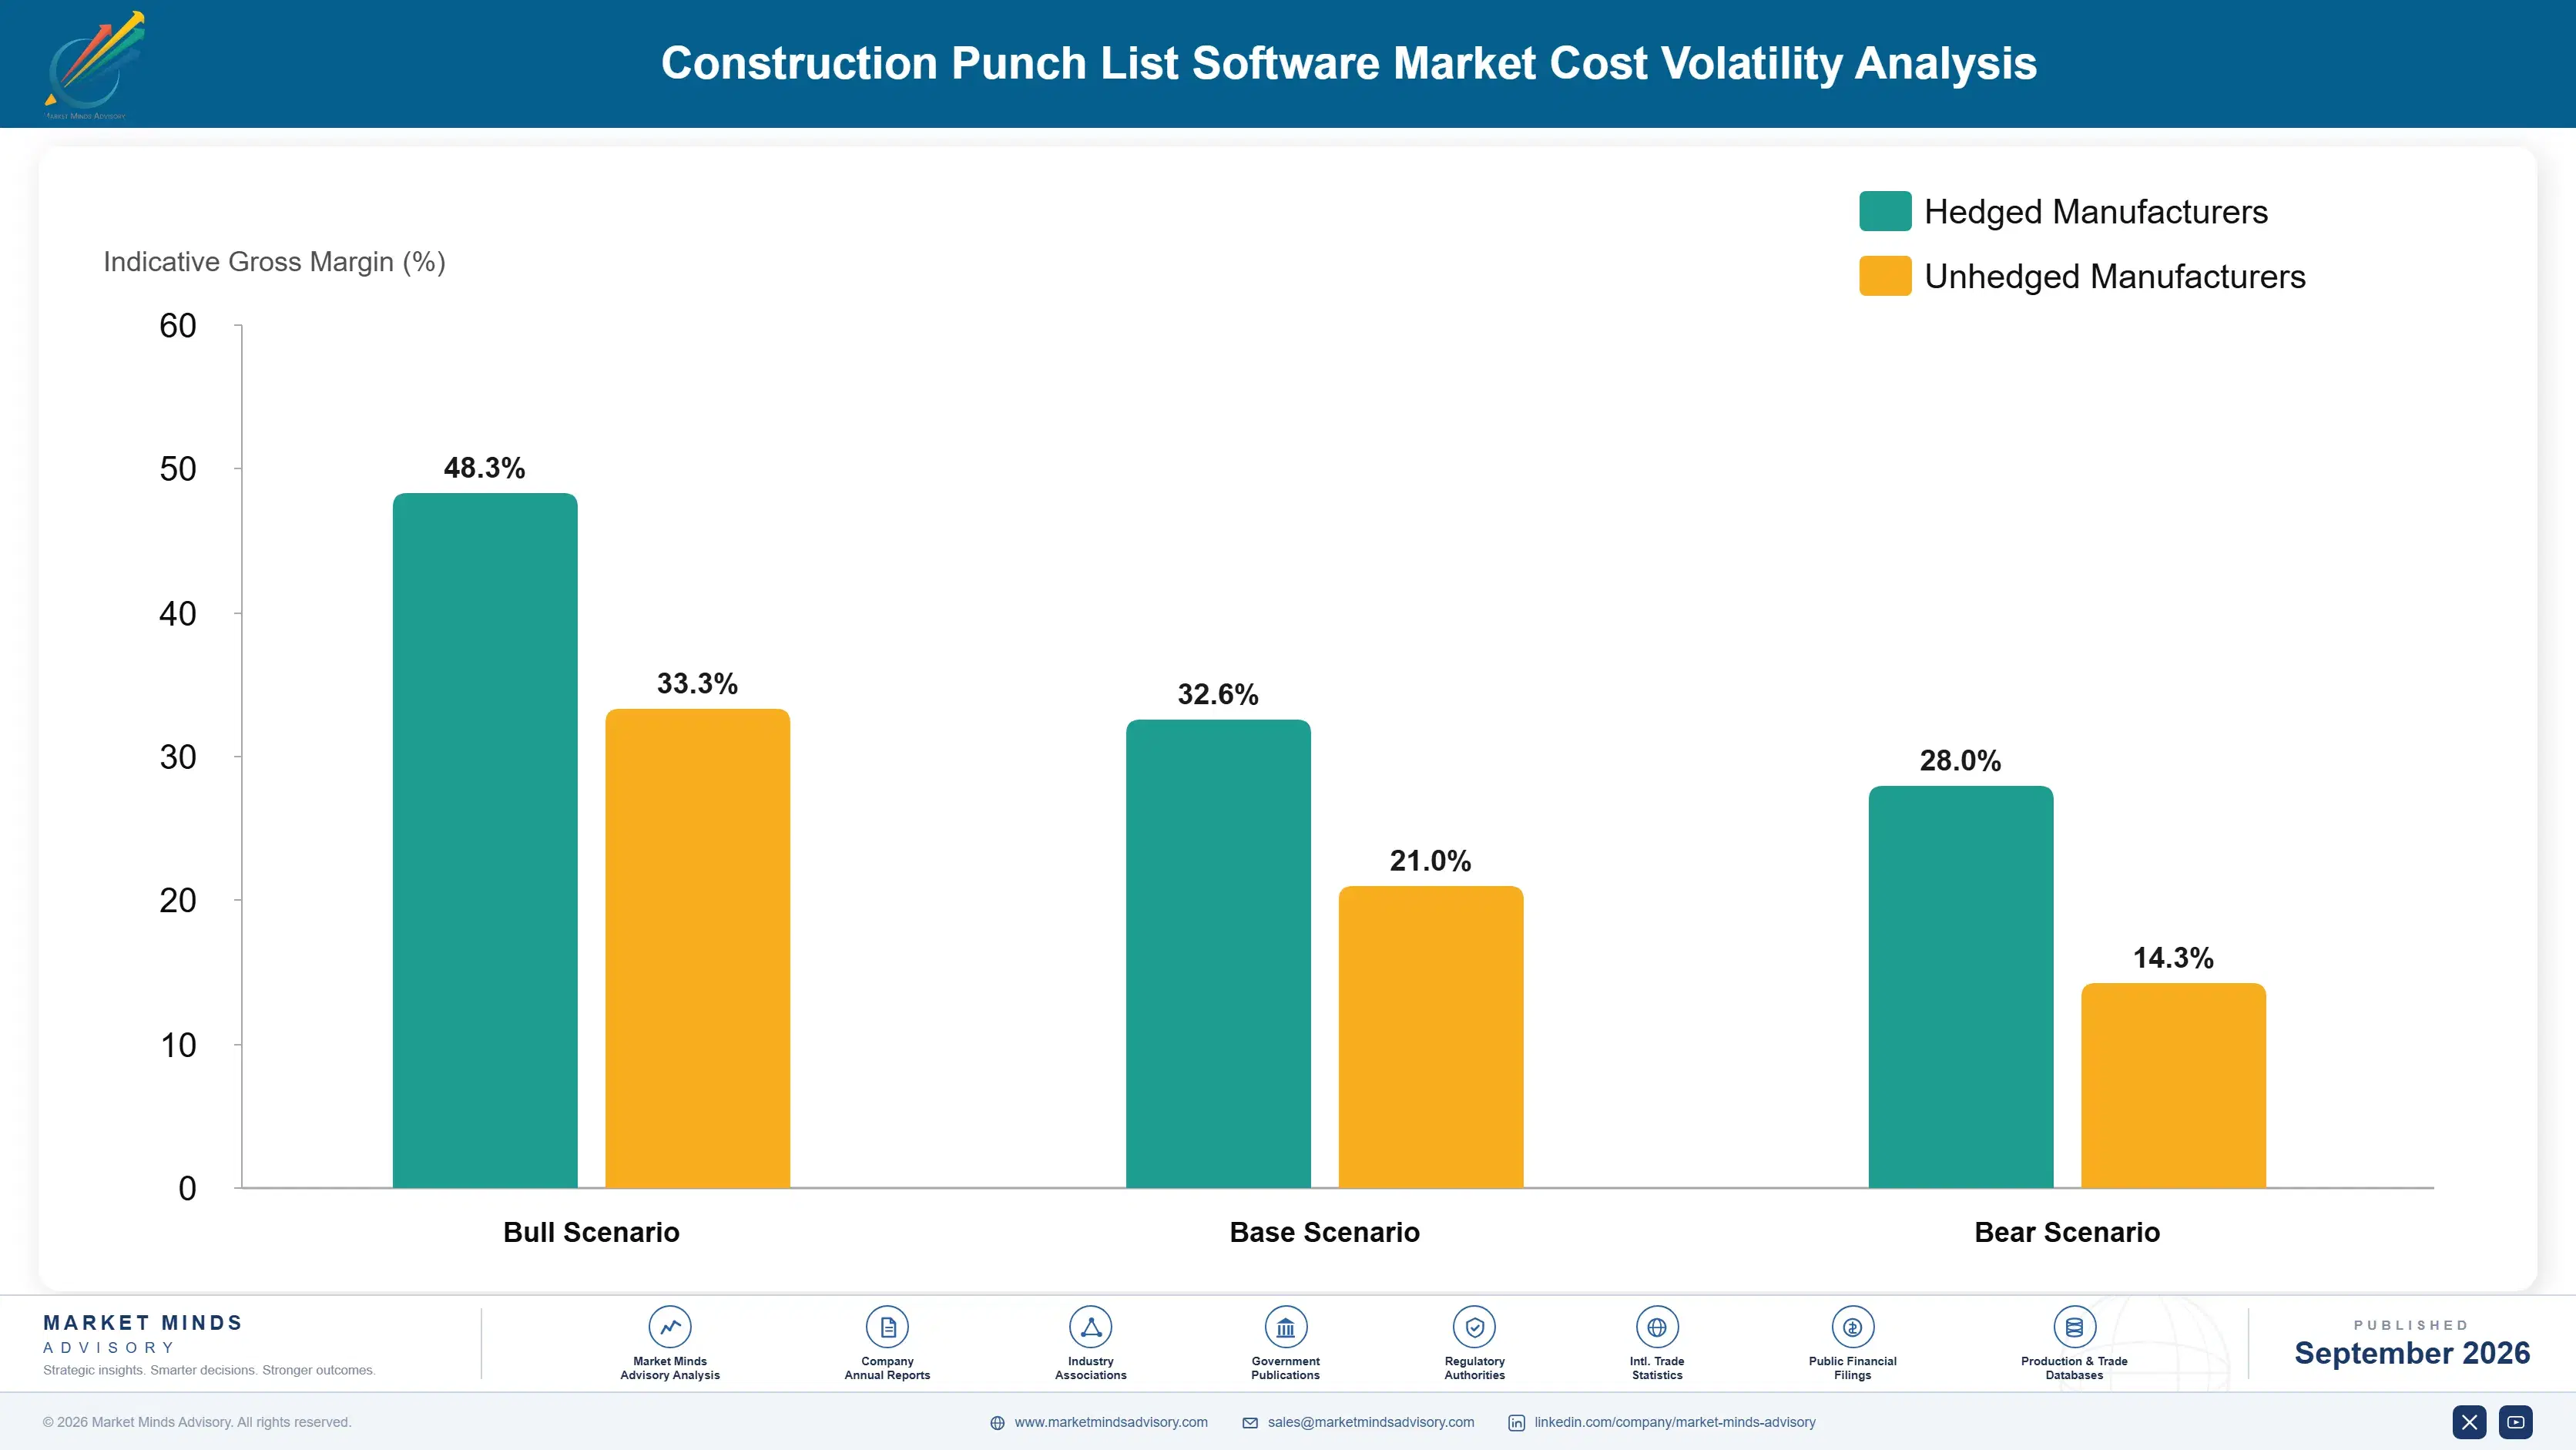
Cloud Infrastructure and Engineering Cost Exposure

Cloud hosting and data storage for high-resolution inspection photos and video represent a meaningful variable cost input for punch list software vendors, running an estimated 18 to 25 percent of cost of goods sold for vendors with substantial AI-assisted photo analysis feature adoption, sourced from major cloud providers billed on consumption. Engineering talent for computer vision remains a fixed cost line outside COGS.
Cloud storage and compute pricing became a more significant line item during 2025 as vendors expanded AI-assisted photo analysis features requiring substantially more compute-intensive processing than basic checklist functionality, consistent with cloud infrastructure cost trends tracked across vendor investor updates. Vendors running AI inference through third-party cloud providers absorbed pricing changes directly, while negotiated enterprise agreements gave more room to manage it.. across most vendors regardless of scale.

The competitive disadvantage falls hardest on smaller vendors without the volume to negotiate favourable cloud infrastructure pricing terms, forcing some to limit AI feature availability on lower-priced tiers. Exposure varies by product architecture too, since video-heavy vendors face higher storage cost than photo-only competitors. Larger vendors with diversified enterprise customer bases can absorb this variation more easily than smaller specialists concentrated in a single product architecture.
construction-punch-list-software-market-cost-volatility-analysis-1788421383842

Negotiating Enterprise Cloud Infrastructure Volume Agreements

Larger vendors are locking in multi-year volume-based pricing directly with major cloud infrastructure providers rather than paying list rates, insulating a meaningful share of their AI feature cost base from near-term pricing volatility and giving product teams more predictable margin planning ahead. Smaller vendors without comparable negotiating scale remain considerably more exposed to sudden provider repricing decisions each quarter.

Compressing Photo and Video Storage Through Smarter Retention

Several vendors are implementing smarter data retention policies that compress or archive older inspection media automatically, cutting ongoing storage cost meaningfully while keeping recent, actively referenced project data readily accessible for users. This approach requires ongoing engineering investment in retention tooling that smaller vendors sometimes deprioritise in favour of new feature development. over time.

Running Smaller Task-Specific Models for Routine Defect Types

Several platforms are training smaller, purpose-built computer vision models for common defect types rather than routing every image through a large general-purpose model, cutting per-image inference cost meaningfully while keeping detection accuracy acceptable for routine inspection use. This approach requires upfront model training investment that smaller, resource-constrained vendors often cannot justify without confirmed demand first.

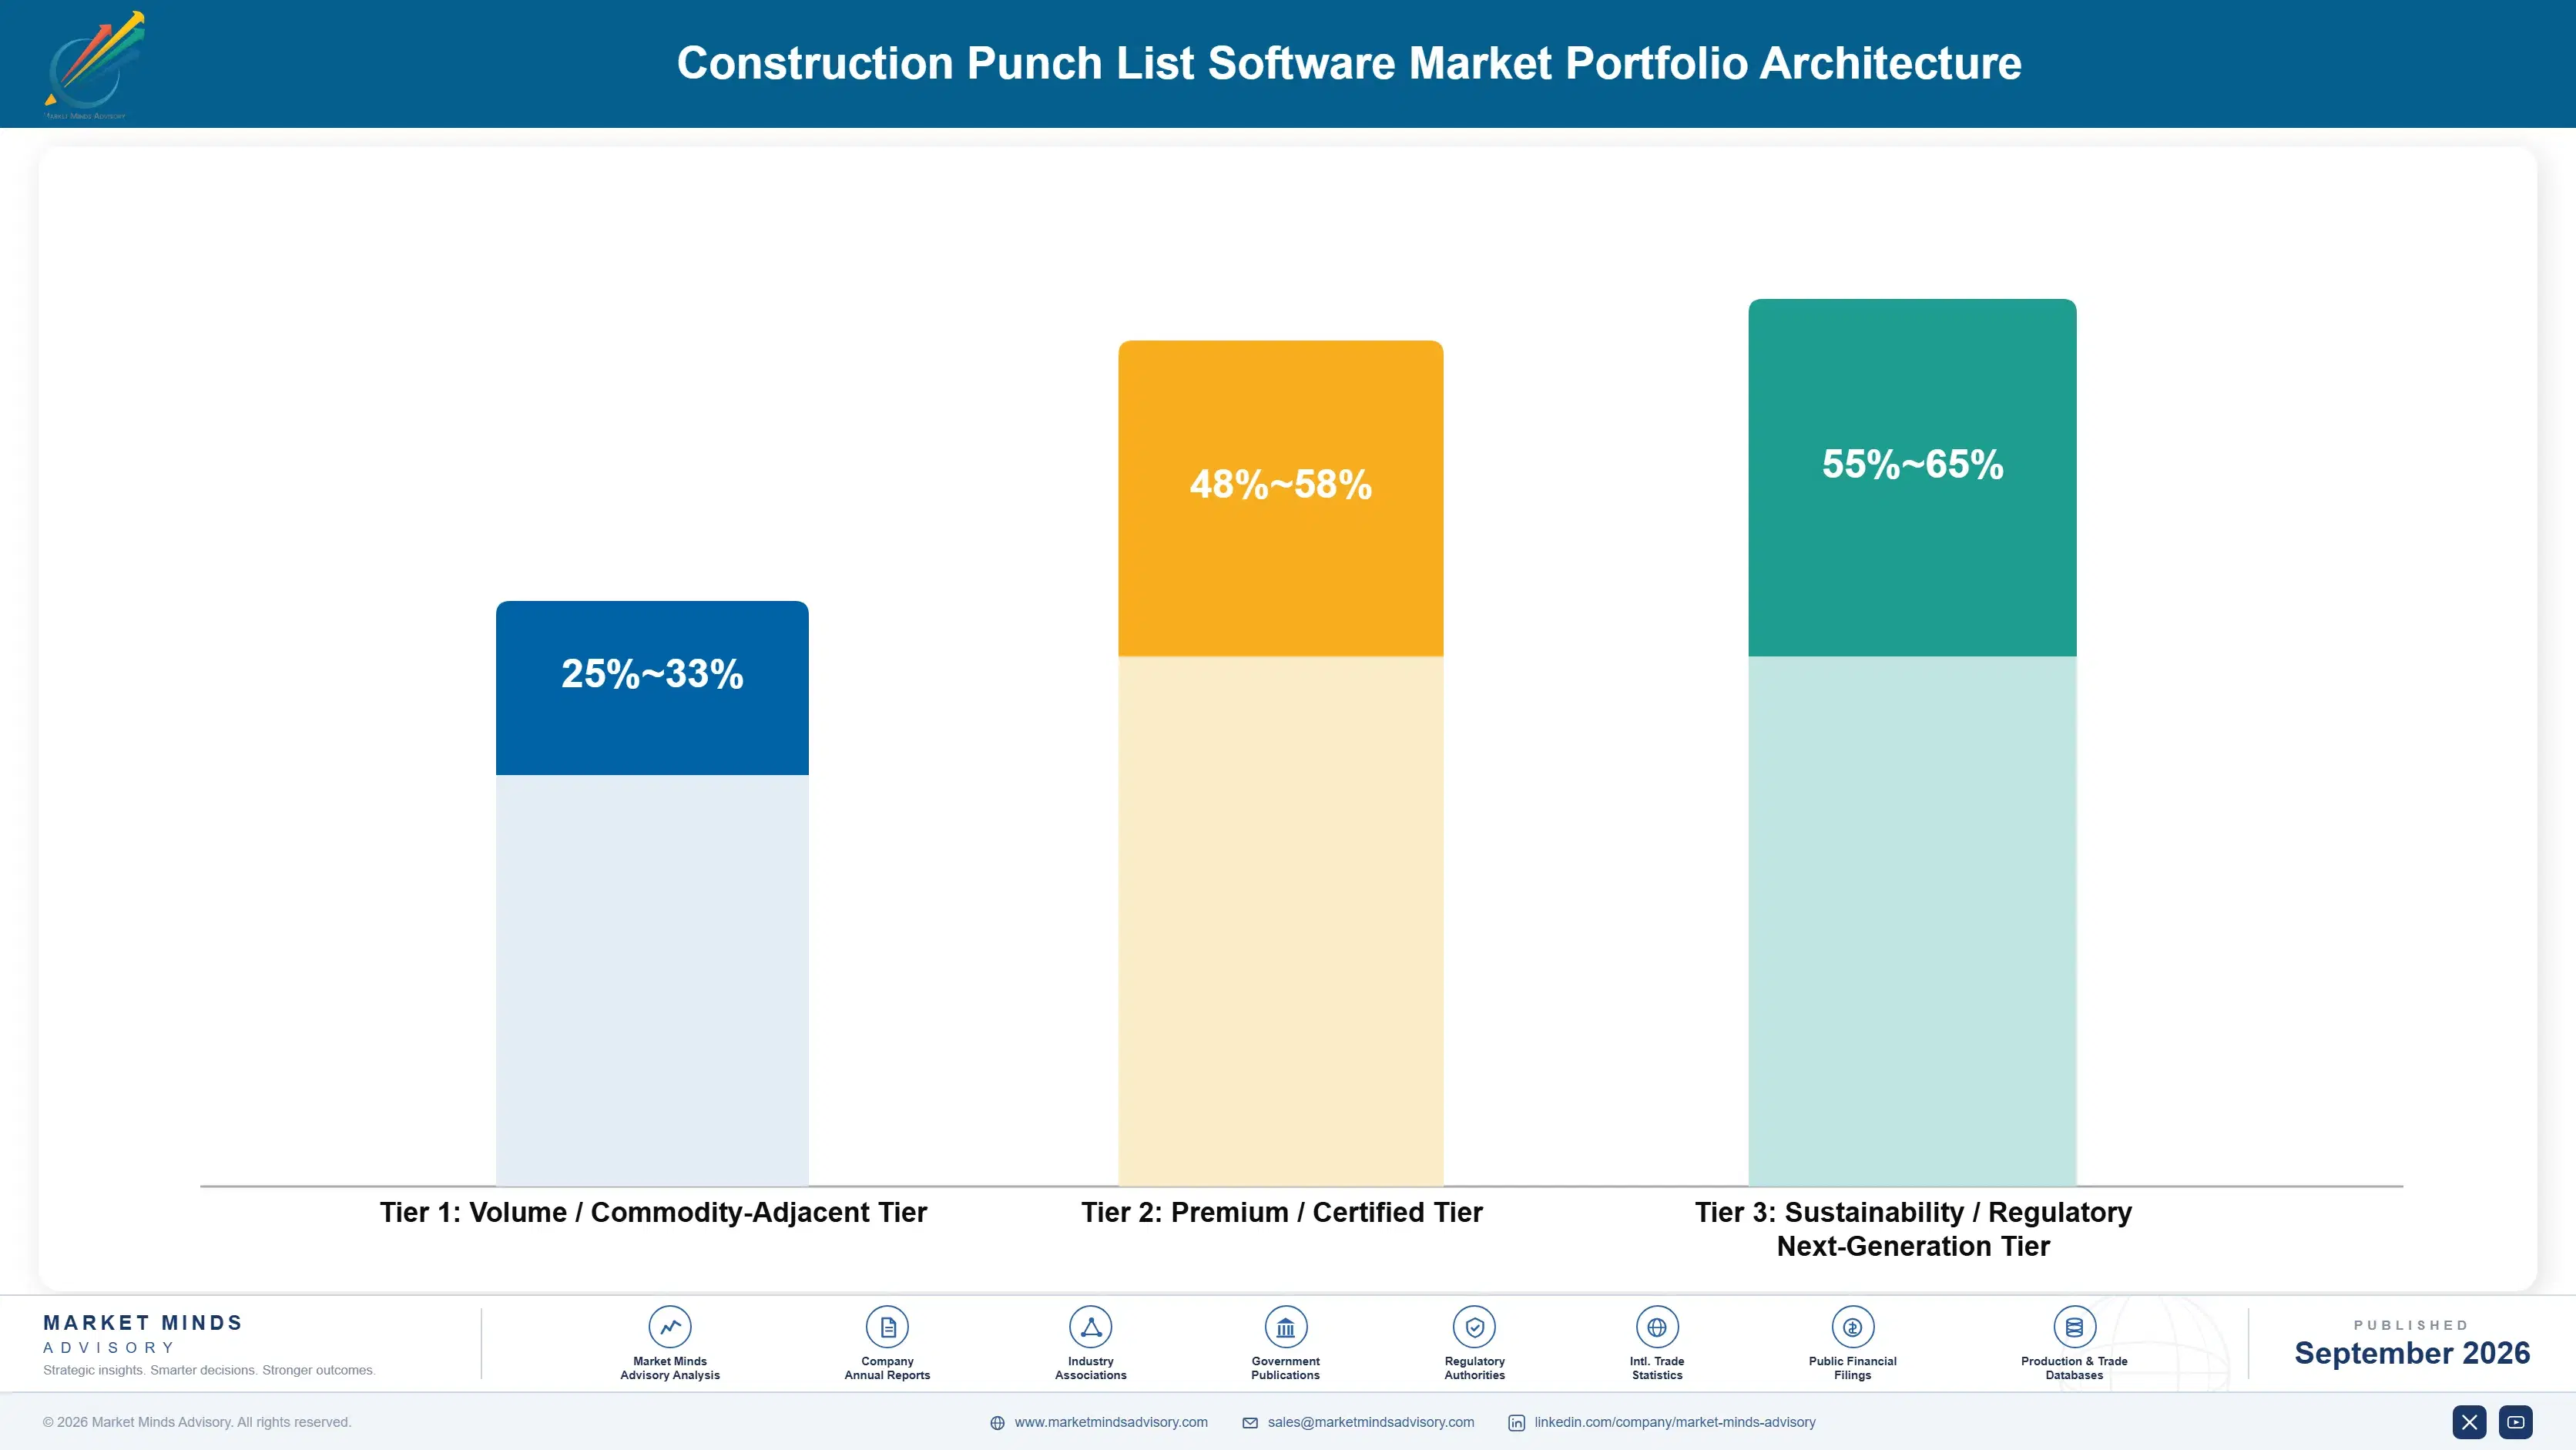
Portfolio Architecture for Margin Defence

Portfolio economics split cleanly into three tiers. Volume tier standalone mobile applications monetise a broad small-contractor user base through modest per-seat pricing and thin margins, while premium integrated platform modules built for large enterprise general contractors carry meaningfully higher gross margins tied to bundled functionality and multi-year contracts. The sustainability and next-generation tier, built around AI-assisted defect detection, currently carries the highest margins of the three despite its smaller revenue base relative to established modules.
The volume versus premium tension shows up most clearly in product roadmap prioritisation. Engineering resources devoted to simple, low-friction mobile usability for small contractors compete directly against resources needed for deep enterprise integration and AI feature development, and vendors that under-invest in either side risk losing ground to a competitor optimised specifically for that buyer profile.

High-value margin pools concentrate in enterprise integrated platform deployments carrying multi-year contracts and in the emerging AI-assisted detection tier, where usage-based pricing lets vendors capture more value from the heaviest inspection users. The volume standalone tier remains essential for top-of-funnel growth and subcontractor network density but contributes the smallest share of blended gross margin across the category today.

Volume / Commodity-Adjacent Tier

Standalone mobile applications for small contractors, monetised through modest per-seat pricing and thin margins across a broad user base. Vendors here compete mainly on ease of use and low price point rather than deep feature differentiation.
Gross Margin: 25-33%

Premium / Certified Tier

Integrated platform modules for enterprise general contractors, carrying higher blended margins tied to bundled functionality and multi-year contracts. These modules justify their pricing through deep enterprise integration and long-term multi-project contract relationships.
Gross Margin: 48-58%

Sustainability / Regulatory / Next-Generation Tier

AI-assisted defect detection products priced on usage, currently the highest-margin tier despite a smaller absolute revenue base overall. Margins here should gradually compress as more competitors ship comparable computer vision capability over time.
Gross Margin: 55-65%
construction-punch-list-software-market-portfolio-architecture-1788421384359

High-value Sub-segments and Strategic Watch-out

AI-Assisted Defect Detection Contracts

Usage-based enterprise deployments of computer vision defect detection, combining the fastest unit growth in the category with the highest gross margins currently observed across any tier tracked. Vendors positioned early in this segment are capturing outsized contract wins as enterprise contractors finalise next-generation inspection workflow decisions.
Gross Margin: 55-65%

Owner-Facing Handover Documentation Packages

Premium contracts including structured, owner-ready closeout documentation, carrying strong margins and larger contract values than contractor-only deployments of similar project count. These contracts also provide vendors valuable long-term revenue visibility tied to owner relationships that outlast any single construction project. particularly among large institutional owners.
Gross Margin: 45-55%

Core Integrated Platform Punch List Modules

The largest existing revenue base, standard modules within enterprise platform subscriptions with moderate growth and stable renewal rates funding most vendors' ongoing development spending. Vendors here rely on integration depth and existing enterprise relationships rather than standalone innovation to defend their existing base. particularly at large enterprise accounts.
Gross Margin: 48-58%

Standalone Small Contractor Mobile Applications

The largest user base by count but the lowest margin contribution, a strategic watch-out since platform consolidation threatens standalone unit economics over the medium term. Vendors still reliant on this segment risk losing ground as platform bundling increasingly displaces standalone small contractor tools industry-wide. particularly among smaller regional vendors.
Gross Margin: 25-33%

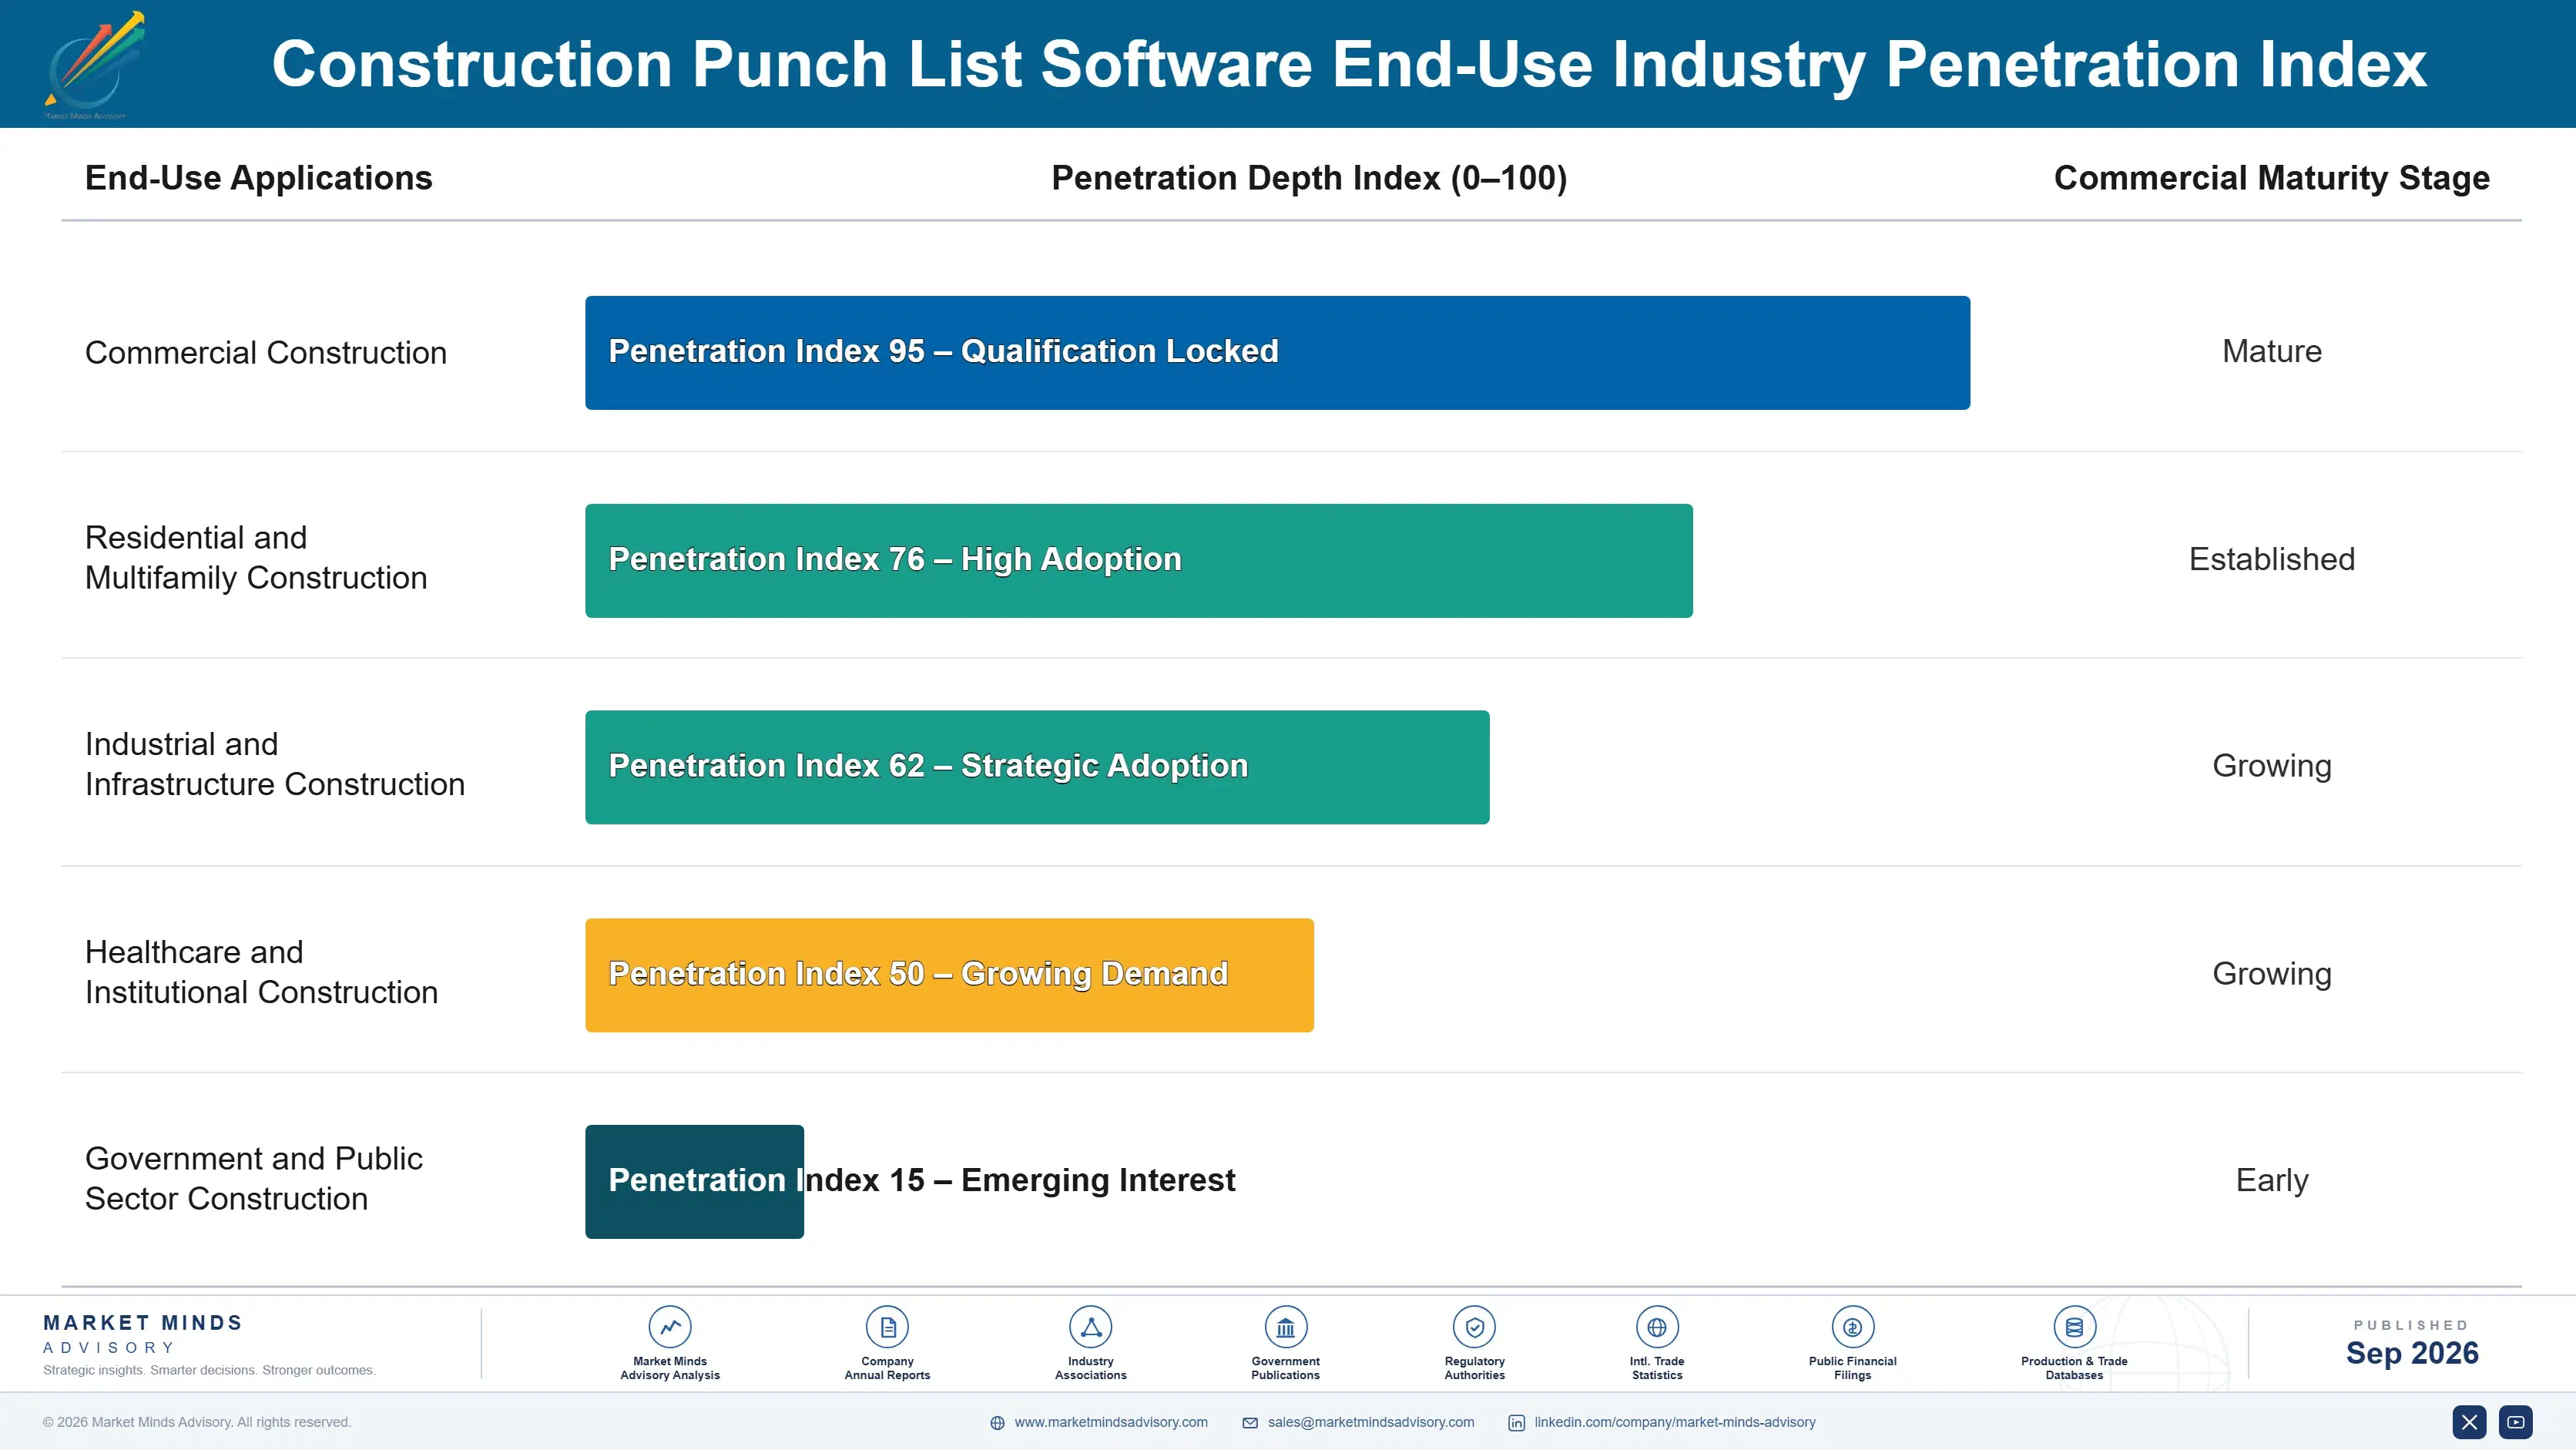
Project Lifecycle and Subcontractor Network Economics

Revenue behaves like an annuity once a general contractor embeds a platform across its standard project workflow, since retraining project teams and subcontractors on an alternative tool carries genuine switching friction, and that friction, not brand loyalty alone, explains most of this category's meaningful renewal stability across repeat general contractor customers..
Adoption depth varies sharply by contractor size and project type. Large enterprise general contractors integrate punch list functionality deeply into broader project management and compliance workflows, creating durable multi-year relationships, while smaller contractors and specialty trades tend to use standalone tools more narrowly around a single active project, leaving meaningful headroom for vendors that build stickier ongoing engagement features..

Buyer profiles are shifting generationally as well. Project managers who came up through paper-based punch lists still favour manual control and printed inspection reports, while younger field superintendents increasingly default to trusting AI-assisted flagging outright, a difference in tool expectations that is already shaping which vendors win newly formed project teams versus long-tenured contractor relationships. Vendors that anticipate this generational shift early are better positioned to win newly formed project teams specifically. Vendors that anticipate this generational shift early are better positioned to win newly formed project teams.
construction-punch-list-software-market-end-use-penetration-index-1788421384850

Where the Category Consolidates Next

These are among the four positions where our research anticipates prominent divergence between winners and laggards over the coming forecast period. Each is grounded in the demand model, the regulatory perimeter, and the announced capacity pipeline.
01 / AI FEATURE INVESTMENT

Automated defect flagging is becoming table stakes, not differentiation

Every vendor with meaningful enterprise seat count now ships some form of automated defect flagging, which means the feature itself no longer differentiates a platform in buyer evaluations the way it did just two years ago. Vendors need a second layer of defensibility beyond AI capability alone, whether that is subcontractor network density, owner-side documentation packaging, or genuinely superior integration with adjacent construction systems. Companies still marketing basic AI detection as their primary pitch risk sounding a full product cycle behind where enterprise buyers already are.
02 / SUBCONTRACTOR NETWORK DENSITY

Regional subcontractor familiarity is becoming a durable competitive moat

Vendors achieving sufficient regional subcontractor density are capturing a self-reinforcing advantage, since general contractors increasingly favour platforms subcontractors already know from other job sites over unfamiliar alternatives requiring additional training. This dynamic rewards vendors that pursued regional density deliberately rather than pure enterprise account expansion. Vendors without meaningful regional density should consider geographic focus rather than spreading thin across too many markets simultaneously without building the network effect anywhere specifically, since building this density deliberately looks like the more durable long-term strategy for smaller regional vendors.
03 / OWNER DOCUMENTATION PACKAGING

Owner-facing handover packages are an underexploited revenue opportunity

Owner-facing handover documentation packaging remains underexploited relative to its clear commercial value, since owners increasingly pay directly for structured closeout records they retain long after the general contractor relationship ends. Vendors without a dedicated owner-facing product offering are leaving contract value on the table relative to competitors that built this capability explicitly. Expect more vendors to launch dedicated owner packaging tiers over the next two to three years specifically, and vendors that move first here should capture durable pricing power before competitors recognise its full commercial value.
04 / PLATFORM CONSOLIDATION RISK

Standalone vendors need a clear moat beyond punch list functionality alone

Standalone punch list vendors without a credible differentiation beyond basic defect tracking risk being commoditised out of enterprise accounts as broader platforms bundle comparable functionality at no additional cost. Vendors that survive this consolidation will do so through defensible niches such as subcontractor network density, AI feature leadership, or owner-side documentation specialisation rather than general-purpose competition. Ignoring this consolidation pressure in favour of feature parity alone looks like a losing long-term strategy for most standalone competitors willing to drift into commoditisation by default rather than make this strategic choice deliberately.

Engagement Snapshot From the Field

A live engagement with an industry participant carrying material or product regulatory and market exposure ahead of a defining policy shift, showing how our research translates into a defensible multi-year portfolio strategy.
MARKET MINDS ADVISORY · CLIENT ENGAGEMENT SUMMARY
Construction Punch List Software Producer Strategic Portfolio Review and Transition Roadmap 2026·Investment Scenario on Construction Punch List Software Exposure Evaluation 2025-26
CLIENT PROFILE
The client is a commercial general contractor with roughly eleven hundred employees managing concurrent projects across four regional offices, generating approximately three hundred sixty million dollars in annual revenue (client-reported, unverified by MMA), and running three different punch list tools inherited through past regional office acquisitions. and serving primarily healthcare and multifamily residential clients across its regional footprint.
STRATEGIC CHALLENGE
Leadership needed to consolidate onto a single punch list platform without disrupting active projects nearing closeout, while satisfying divergent regional office preferences built up over years of independent tool selection and managing subcontractor relationships accustomed to different existing platforms. while operating under a tight timeline set by ongoing project deadlines that could not be delayed for the transition.
MMA APPROACH
MMA ran a structured vendor evaluation benchmarked against the firm's actual subcontractor base to identify which platform already had the highest existing familiarity across the client's regular trade partner network. The engagement included primary interviews with project managers across all four regional offices to quantify switching resistance before recommending a rollout sequence.
KEY FINDINGS
  1. Subcontractor familiarity with the eventual chosen platform varied significantly by region, driven by which platform local competitors and other general contractors already used most commonly.
  2. Owner-facing documentation quality differences between the three legacy tools were more significant to client leadership than day-to-day field usability differences among project teams.
  3. A phased rollout starting with the region showing the highest existing subcontractor familiarity reduced organisational resistance meaningfully compared to a simultaneous company-wide switch.
  4. Field superintendents adopted AI-assisted defect flagging features faster than administrative staff, reversing the firm's original assumption about where resistance would concentrate most heavily.
CLIENT PROFILE
The client is a commercial general contractor with roughly eleven hundred employees managing concurrent projects across four regional offices, generating approximately three hundred sixty million dollars in annual revenue (client-reported, unverified by MMA), and running three different punch list tools inherited through past regional office acquisitions. and serving primarily healthcare and multifamily residential clients across its regional footprint.
STRATEGIC CHALLENGE
Leadership needed to consolidate onto a single punch list platform without disrupting active projects nearing closeout, while satisfying divergent regional office preferences built up over years of independent tool selection and managing subcontractor relationships accustomed to different existing platforms. while operating under a tight timeline set by ongoing project deadlines that could not be delayed for the transition.
MMA APPROACH
MMA ran a structured vendor evaluation benchmarked against the firm's actual subcontractor base to identify which platform already had the highest existing familiarity across the client's regular trade partner network. The engagement included primary interviews with project managers across all four regional offices to quantify switching resistance before recommending a rollout sequence.
KEY FINDINGS
  1. Subcontractor familiarity with the eventual chosen platform varied significantly by region, driven by which platform local competitors and other general contractors already used most commonly.
  2. Owner-facing documentation quality differences between the three legacy tools were more significant to client leadership than day-to-day field usability differences among project teams.
  3. A phased rollout starting with the region showing the highest existing subcontractor familiarity reduced organisational resistance meaningfully compared to a simultaneous company-wide switch.
  4. Field superintendents adopted AI-assisted defect flagging features faster than administrative staff, reversing the firm's original assumption about where resistance would concentrate most heavily.
RECOMMENDED STRATEGY
Phase 1: Phase 1 (Months 1 to 2): Benchmark candidate platforms against actual subcontractor familiarity data across all four regional offices. and confirm rollout sequencing. Phase 2: Phase 2 (Months 3 to 5): Migrate the region with highest existing platform familiarity first, rebuilding workflows before wider rollout begins. Phase 3: Phase 3 (Months 6 to 9): Roll out remaining regions sequentially, prioritising offices with the least legacy tool customisation complexity first.
OUTCOME
Nine months after full rollout, the client reported unified closeout reporting across all regional offices and a reduction in average project closeout time of approximately twenty eight percent relative to its prior fragmented toolset (client-reported, unverified by MMA). Leadership also reported meaningfully faster final payment collection across projects using the consolidated platform.

Frequently Asked Questions

Foundational context covering the market sizes, CAGR, scope, country, region and competition that inform every finding below. This section is provided to cover basics and most often pre-purchase conversations, answered from the MMA Primary Research Dataset.

What is the current size of the Construction Punch List Software Market?

The Construction Punch List Software Market reached an estimated USD 0.68 billion in global revenue in 2025, according to MMA Analysis based on primary research and company disclosures. This base year figure anchors the forecast period beginning in 2026.

How large will the Construction Punch List Software Market be by 2036?

MMA projects the market will reach approximately USD 1.85 billion by 2036 under the base case scenario. That represents roughly a 2.48 times expansion from the 2026 starting value of USD 0.74 billion.

What is the CAGR for the Construction Punch List Software Market 2026 to 2036?

The base case compound annual growth rate is 9.5% across the 2026 to 2036 forecast window. Bull and bear scenarios range from 8.2% to 10.8% depending on AI feature adoption and platform consolidation pace.

Which segment is growing fastest?

AI-Assisted Defect Detection Tools lead all segments at a 16.0% CAGR, roughly 1.68 times the overall market rate. This segment benefits from a low starting base and rapidly maturing computer vision technology for construction-specific defects.

Who are the major companies in the Construction Punch List Software Market?

Leading vendors include Procore Technologies Inc., Autodesk Inc., Oracle Corporation, Trimble Inc., and Fieldwire Inc. Together these five hold an estimated 44% combined share on a disclosed paid seat count basis.

Which country is growing fastest?

India leads national growth at an estimated 12.5% CAGR, driven by rapid digitisation across its expanding commercial and infrastructure construction sector. Vietnam and Indonesia follow within the same South Asia and Pacific region.

Report Segmentation Architecture

The full report scope spans multiple orthogonal segmentation dimensions, with cross-tabulated demand data provided for each dimension pair. Coverage extends further to regional breakdowns, trend trajectories, and the competitive detail needed to support segment-level decision-making.

By Software Function and Delivery Model

  • Standalone Punch List Mobile Applications
  • Integrated Construction Management Suite Modules
  • AI-Assisted Defect Detection Tools
  • Field Inspection and QA/QC Platforms
  • Owner and Facility Handover Documentation Tools
  • Subcontractor Collaboration and Sign-Off Platforms

By End-Use Industry

  • Commercial Construction
  • Residential and Multifamily Construction
  • Industrial and Infrastructure Construction
  • Healthcare and Institutional Construction
  • Government and Public Sector Construction

By Commercial Dimension

  • General Contractor Direct Licensing
  • Owner and Developer Direct Licensing
  • Subcontractor Seat-Based Access
  • Systems Integrator and Reseller Channel Sales

By Region

  • North America
  • Western Europe
  • East Asia
  • South Asia and Pacific
  • Latin America
  • Middle East and Africa
  • Eastern Europe

Scope, Methodology, and Coverage

Every figure in this report is reproducible from documented input assumptions. The scope below maps the historical period, the forecast horizon, the segmentation dimensions, and the countries covered, alongside the underlying primary and qualitative methodology.
Historical Period
2020 to 2025
Forecast Period
2026 to 2036
Base Year
2025 (USD billions; MMA Primary Research Dataset, September 2026)
Market Definition
This report covers software applications, whether standalone or embedded within broader construction management platforms, used to create, assign, track, and close out defect and deficiency items during construction project inspection and handover phases. It excludes general project scheduling software, building information modelling authoring tools, and accounting or payment platforms that do not directly manage punch list or defect tracking workflows.
Quantitative Units
USD billions (current prices); paid seat counts; average revenue per user
Segmentation Dimensions
By Software Function and Delivery Model; By End-Use Industry; By Commercial Dimension; By Region
Regions Covered
North America, Western Europe, East Asia, South Asia and Pacific, Latin America, Middle East and Africa, Eastern Europe
Countries Covered
USA, China, Germany, France, UK, Japan, South Korea, India, Australia, Canada, Brazil, Mexico, Indonesia, Vietnam, Thailand, Malaysia, UAE, Saudi Arabia, South Africa, Nigeria, Turkey, Poland, Netherlands, Italy, Spain, Sweden, Switzerland, Argentina, Colombia, Singapore, and additional markets relevant to this sector
Key Companies Profiled
Procore Technologies Inc.; Autodesk Inc.; Oracle Corporation; Trimble Inc.; Fieldwire Inc.; Bridgit Inc.; Buildertrend Solutions Inc.; CoConstruct LLC; Raken Inc.; Newforma Inc.; Assignar Pty Ltd.; GoFormz Inc.; PlanRadar GmbH; Fonn Group AS; Sablono GmbH; Bluebeam Inc.; Kahua Inc.; Reconstruct Inc.; Novade Solutions Pte Ltd.; eSUB Construction Software Inc.
Quantitative Methodology
Primary survey, n=3,800 respondents, Q4 2025, six countries; demand-side model with trade association cross-validation
Qualitative Methodology
47 expert interviews, Q4 2025; applied to validate demand model assumptions, identify emerging dynamics, and assess competitive positioning
Report Format
PDF and XLSX data workbook (Word format preview document)
Publisher
Market Minds Advisory
Report Code
MMA-2026-CON-455
Published
September 2026
Contact
sales@marketmindsadvisory.com | www.marketmindsadvisory.com

Purchase the full Construction Punch List Software Market Report (2026 to 2036).

The full report delivers complete segmentation data across all six software function segments, all seven regional markets, and detailed competitive profiles for all twenty companies named in this summary. It includes the underlying primary survey dataset of three thousand eight hundred respondents and forty seven expert interviews conducted during the fourth quarter of 2025. Buyers also receive downloadable data tables covering historical 2020 to 2025 figures alongside the full 2026 to 2036 annual forecast. A dedicated appendix addresses AI-assisted defect detection accuracy benchmarks across three deployment scenarios.
Full Seven-Region Regional Data Tables and Charts
All Twenty Company Competitive Profiles and Rankings
Ten-Year Annual Forecast Model With Scenarios
Primary Survey Raw Data Access and Tables
AI Defect Detection Accuracy Benchmark Appendix
Quarterly Update Subscription Option for Buyers

Built For The People Who Decide

From boardroom strategy to bench-side execution, this report is read cover-to-cover by leaders shaping the next decade of their industry, turning demand scenarios, market dynamics and valuation benchmarks into decisions.
CXOs/ Presidents/ VPs/ Managers
M&A and Corporate Development
Strategy Teams and R&D Heads
Procurement and Product Directors
Regulatory and Compliance Leaders
Investor Relations and Equity Analysts